Chapter 2kennisbanksu.com/wp-content/uploads/2016/03/Crimineel_recht02.pdf · Chapter 2 © 2003...
84
© 2003 Prentice-Hall, Inc. 1 The Crime Picture Chapter 2
Transcript of Chapter 2kennisbanksu.com/wp-content/uploads/2016/03/Crimineel_recht02.pdf · Chapter 2 © 2003...

© 2003 Prentice-Hall, Inc. 1
The Crime Picture
Chapter 2

© 2003 Prentice-Hall, Inc. 2
Sources of Data
• Uniform Crime Report (UCR)
• National Crime Victimization Survey (NCVS)
• Offender Self-Reports

© 2003 Prentice-Hall, Inc. 3
Uniform Crime Reports
• The reports began in 1930.
• Data was collected by F.B.I.
• Approximately 16,000 police agencies provide data.
• Reports of crimes known to the police are included.
• The reports are voluntarily submitted by law enforcement.
• The UCR contains the Crime Index.

© 2003 Prentice-Hall, Inc. 4
UCR: Crime Index
The Index is made up of Part I offenses.1. violent crime
2. property crime

© 2003 Prentice-Hall, Inc. 5
UCR: Violent Crimes
• murder
• forcible rape
• robbery
• aggravated assault
© 2003 Prentice-Hall, Inc. 6
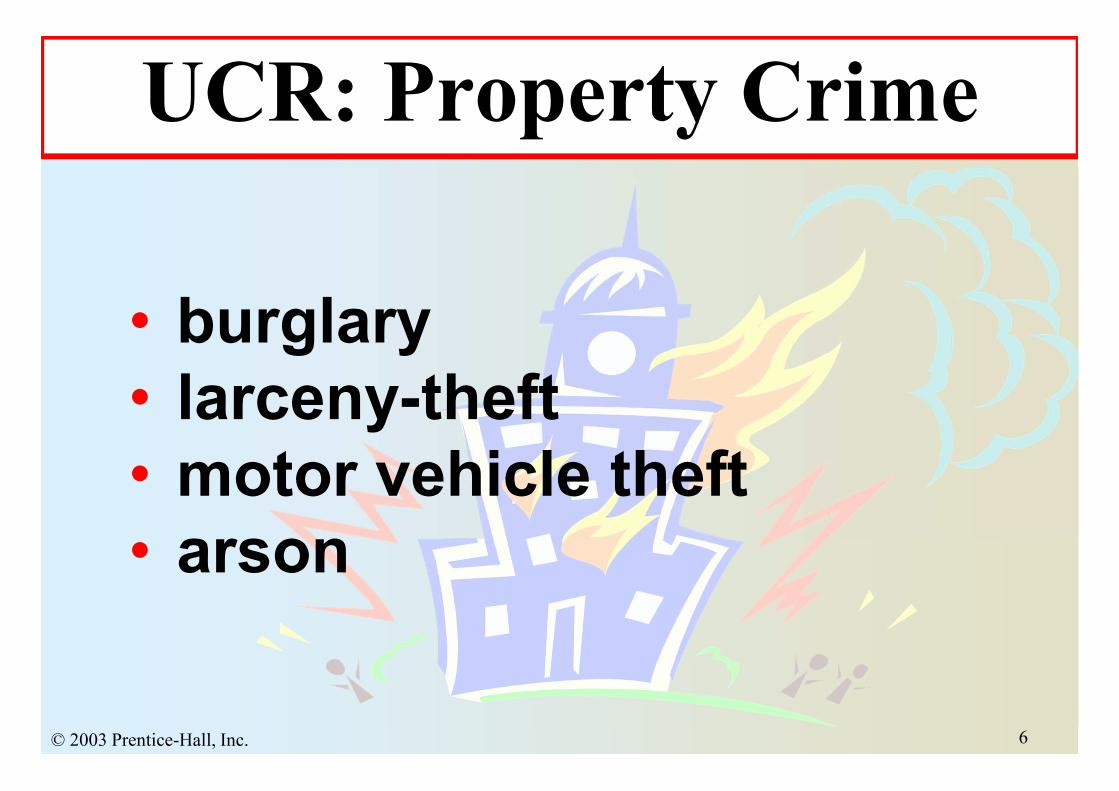
UCR: Property Crime
• burglary• larceny-theft• motor vehicle theft• arson

© 2003 Prentice-Hall, Inc. 7
Actual and Projected Rates of Crime in the U.S., 1950-2010

© 2003 Prentice-Hall, Inc. 8
UCR: Crime Index
crimes
100,000 populationCrime Index =

© 2003 Prentice-Hall, Inc. 9
The Rate of Crime in the United States (per 100,000 Inhabitants), 1960-2000
© 2003 Prentice-Hall, Inc. 10
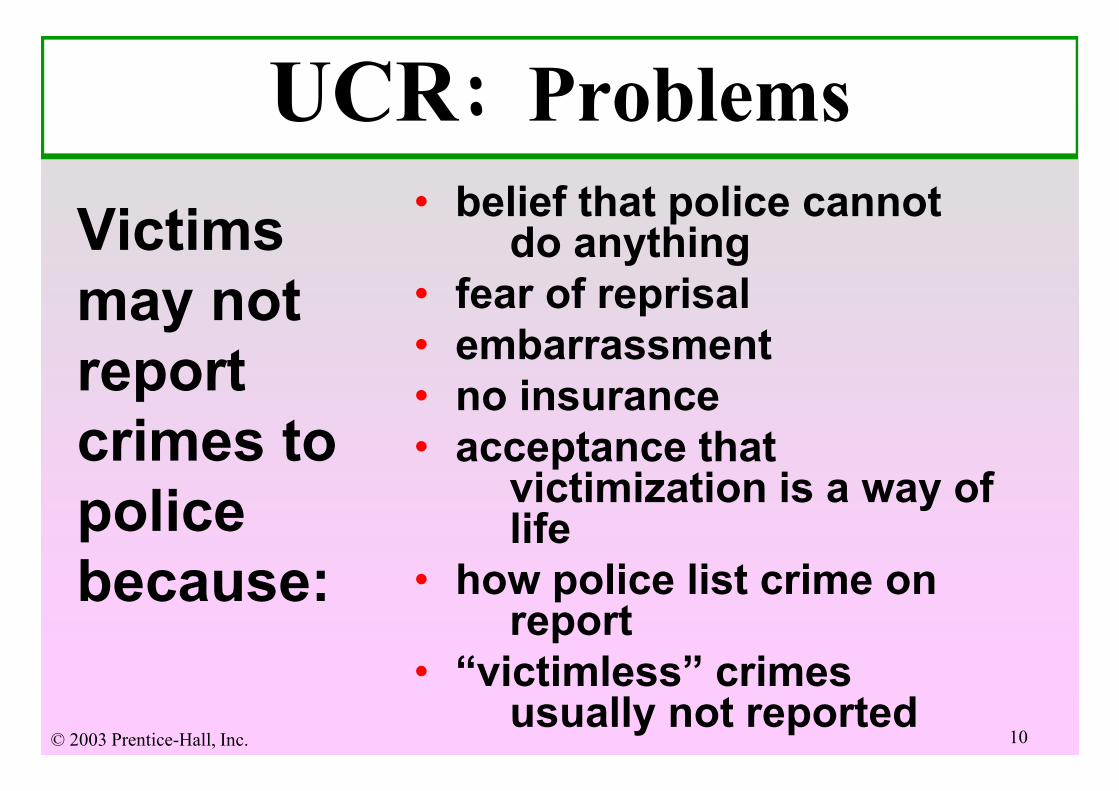
UCR: Problems
Victims may not report crimes to police because:
• belief that police cannot do anything
• fear of reprisal• embarrassment• no insurance• acceptance that
victimization is a way of life
• how police list crime on report
• “victimless” crimes usually not reported
© 2003 Prentice-Hall, Inc. 11
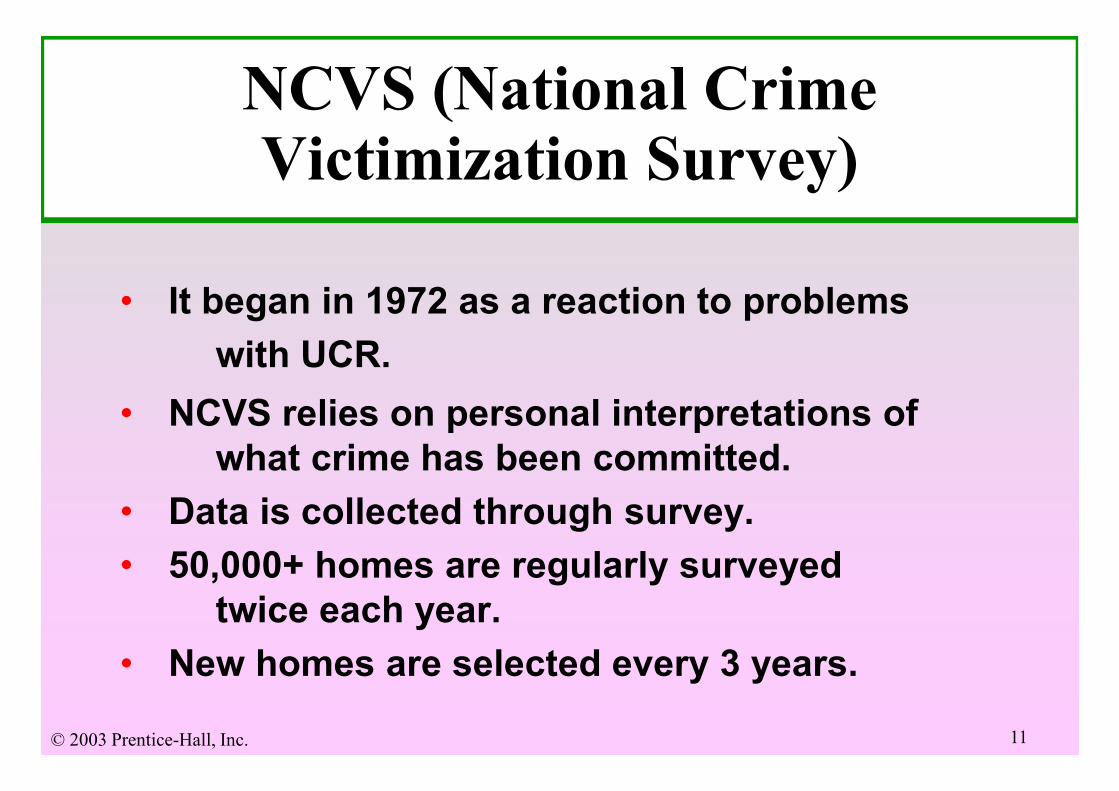
NCVS (National Crime Victimization Survey)
• It began in 1972 as a reaction to problems
with UCR.
• NCVS relies on personal interpretations of what crime has been committed.
• Data is collected through survey.
• 50,000+ homes are regularly surveyed twice each year.
• New homes are selected every 3 years.

© 2003 Prentice-Hall, Inc. 12
UCR: Part I Crimes - 2000
Rate per 100,000 Number
murder 5.5 15,517 forcible rape 32 90,186 robbery 144.9 407,842 aggravated assault 323.6 910,744

© 2003 Prentice-Hall, Inc. 13
Rate per 100,000 Number
burglary 728.4 2,049,946
larceny-theft 2,475.3 6,965,957
motor vehicle theft 414.2 1,165,559
arson 36.9 78,280
UCR: Part I Crimes - 2000

© 2003 Prentice-Hall, Inc. 14
UCR: Clearance Rates
clearance rate - A measure that compares the number of crimes reported and/or discovered to the number of crimes solved by arrest or by other means i.e., death of suspect, finding out report of crime was falsified, etc.

© 2003 Prentice-Hall, Inc. 15
Murder
The unlawful killing of a human being. A generic term which, in common usage, may include first-and second-degree murder, as well as manslaughter, involuntary manslaughter, and other similar kinds of offenses.

© 2003 Prentice-Hall, Inc. 16
Murder
• deaths caused by negligence
• suicide
• accident
• justifiable homicides
Excludes:Excludes:

© 2003 Prentice-Hall, Inc. 17
Murder• July & August -
highest number of reports
• most common in southern states
• person age 20-24 most likely victim
• perpetrators most likely between 18-24 years-old

© 2003 Prentice-Hall, Inc. 18
• highest clearance rate of Part I offenses (typically over 65%)
• firearms most frequent weapon of choice (65%)
• knives second most frequent (13%)
Murder

© 2003 Prentice-Hall, Inc. 19
Murder
• only 13% committed by strangers
• 38% relationship to victim undetermined
• 50% committed by acquaintances
• 32% as a result of an “argument”

© 2003 Prentice-Hall, Inc. 20
serial - The killing of two or more people, on more than one occasion, over an extended period of time.
Murder

© 2003 Prentice-Hall, Inc. 21
mass - The killingof three or more people, in a single event, by an offender who typically does not seek concealment of the crime.
Murder

© 2003 Prentice-Hall, Inc. 22
Forcible Rape
The carnal knowledge of a female, forcibly and against her will.
Includes:
assault or attempt to commit rape by force or threat of force
Excludes:• assault if victim is male• statutory rape (without force) • other sex offenses

© 2003 Prentice-Hall, Inc. 23
One of the most underreported violent crimes.
Reasons for NOT reporting rapes:
• The lack of belief in ability of police to apprehend the suspect.
• The concern that the victim would receive unsympathetic treatment from the police.
• The desire to avoid the embarrassment of publicity.
Forcible Rape

© 2003 Prentice-Hall, Inc. 24
One of the most underreported violent crimes.
• The fear of reprisal by the rapist.
• The fear of additional “victimization” by court proceedings.
• The desire to keep family/friends from knowing.
Forcible Rape
Reasons for NOT reporting rapes:

© 2003 Prentice-Hall, Inc. 25
• Most rapes are committed by acquaintances of victim.
• Most rapists appear to be motivated by the need to feel powerful.
• July and August are months with highest number of reported rapes.
• December, January, and February are months with lowest number of reported rapes.
Forcible Rape

© 2003 Prentice-Hall, Inc. 26
Date rape is unlawful forced sexual intercourse with a female against her will that occurs within the context of a dating relationship.
Forcible Rape

© 2003 Prentice-Hall, Inc. 27
Marital rape isforcible sex between people who are legally married to each other.
Forcible Rape

© 2003 Prentice-Hall, Inc. 28
Rape Shield Law
Most states have laws which protect women from being questioned about their sexual history, unless it is judged to have a direct bearing on the case.

© 2003 Prentice-Hall, Inc. 29
Unlawful intentional causing of serious bodily injury with or without a deadly weapon. It also means the unlawful intentional attempting or threatening of serious bodily injury or death with a deadly or dangerous weapon.
• Attempted assaults fall under this category, though it is not necessary to have an injury result.
• The possible use of a gun, knife, or other weapon that could result in serious injury.
Includes:
Aggravated Assault

© 2003 Prentice-Hall, Inc. 30
• 59% clearance rate (lower than for murder)
• summer months highest number reported
• February, November, and December lowest
number reported
• 36% blunt object
• 27% hands and feet
• 19% guns
• 18% knives
Aggravated Assault

© 2003 Prentice-Hall, Inc. 31
Clearance is relatively low because of the uncooperativeness of the victim.
• The victim knows assailant.
• The assailant is either the husband or the boyfriend.
• The victim considers offense a “personal” matter.
• The victim believes he “got what he deserved.”
• The victim fears revenge if charges are pursued.
Aggravated Assault

© 2003 Prentice-Hall, Inc. 32
BurglaryUnlawful entry of any fixed structure, vehicle, or vessel used for regular residence, industry, or business, with or without force, with intent to commit a felony or larceny.
• forcible entry
• unlawful entry without force
• attempted forcible entry
Types of burglaries:

© 2003 Prentice-Hall, Inc. 33
Burglary
• 29.5% of all burglaries are unlawful entries.
• 63.7% are forcible entries.
• 6.8% are attempted forcible entries.
• 2.1 million burglaries reported in 2000.
• Daytime burglaries are the most common.
• The clearance rate in 2000 was only 13.4%.
© 2003 Prentice-Hall, Inc. 34
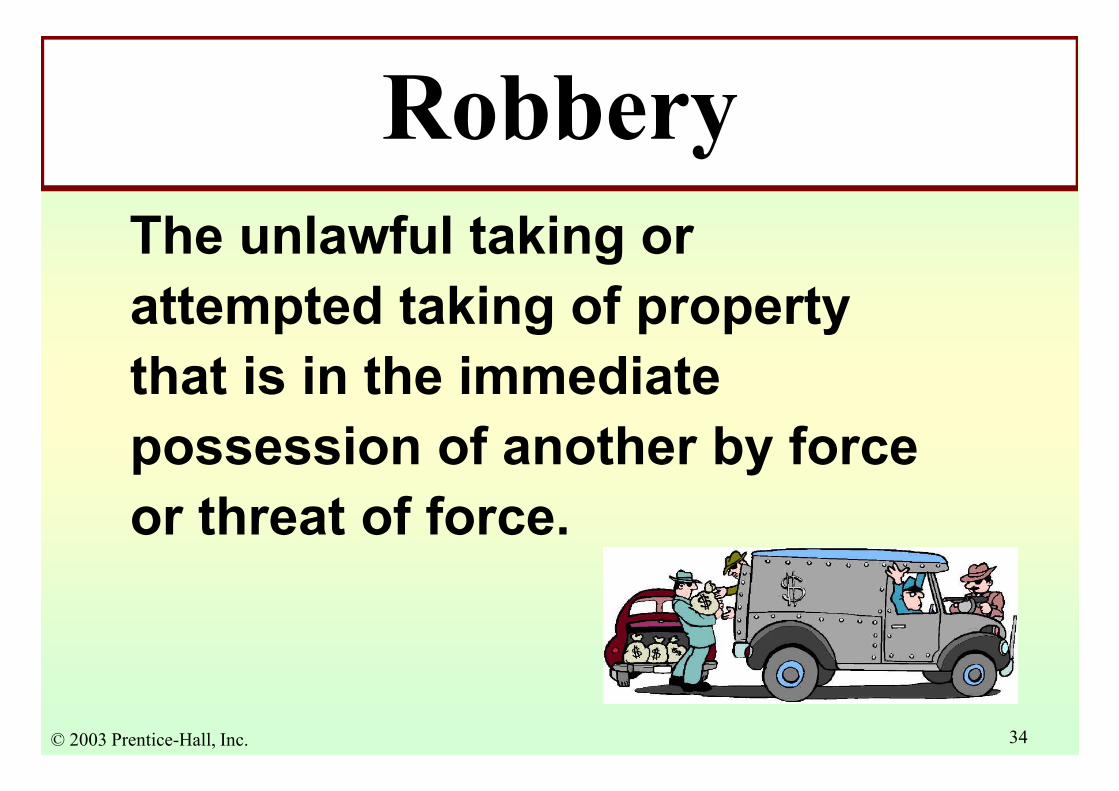
Robbery
The unlawful taking or
attempted taking of property
that is in the immediate
possession of another by force
or threat of force.

© 2003 Prentice-Hall, Inc. 35
Excludes:
• threat to expose a victim -for instance as a homosexual or embezzler
• force applied after the taking, as it does not constitute robbery
• purse snatching
Robbery

© 2003 Prentice-Hall, Inc. 36
Robbery
Most of those arrested are:• young males (90%)
• under age 25 (63%)
• members of minority groups (56%)
Robbery Rates in 2000 (per 100,000):
•large cities – 440.2
•rural areas – 15.5

© 2003 Prentice-Hall, Inc. 37
Larceny-theft
The unlawful taking or attempted taking of property other than a motor vehicle from the possession of another – by stealth, without force, and without deceit – with intent to deprive the owner of the property permanently.

© 2003 Prentice-Hall, Inc. 38
Includes (in declining order of frequency):
• theft from motor vehicles• shoplifting• theft of motor vehicle parts and
accessories• theft from buildings • bicycle thefts• pocket picking• purse snatching• theft from coin operated machines
Larceny-theft

© 2003 Prentice-Hall, Inc. 39
The most common form of larceny in recent years has been the theft of motor vehicle accessories and contents (tires, wheels, stereos, hubcaps, radar detectors, tapes, compact discs, and cell phones) and thefts of farm animals (rustling). Theft of farm machinery is considered larceny.
Larceny-theft

© 2003 Prentice-Hall, Inc. 40
• It is the most frequently reported major crime.
• Total value of property stolen is placed at $5.1billion dollars.
Larceny-theft

© 2003 Prentice-Hall, Inc. 41
The unlawful taking or attempted taking of a self-propelled road vehicle owned by another, with the intent to deprive him or her of it permanently or temporarily.
Motor Vehicle Theft

© 2003 Prentice-Hall, Inc. 42
Includes:
• automobiles• motorcycles • motor scooters• trucks• buses• snowmobiles
Motor Vehicle Theft

© 2003 Prentice-Hall, Inc. 43
Excludes:• trains
• airplanes
• bulldozers
• most farm equipment
• ships
• boats
• spacecraft
Motor Vehicle Theft

© 2003 Prentice-Hall, Inc. 44
Types:• short-term transportation
• long-term transportation
• commission of another crime
• profit• highly organized professionals• amateur auto strippers who steal
for parts
Motor Vehicle Theft

© 2003 Prentice-Hall, Inc. 45
• Legally, this is a type of robbery not a motor vehicle theft.
• It accounts for just over 1% of all car thefts.
• Victims and perpetrators tend to be young African-American males.
• About half of carjacking committed by gangs or groups.
• About 24% of victims sustain injuries.
Motor Vehicle Theftcarjacking - The taking of a motor vehicle
force.
carjacking - The taking of a motor vehicle directly from the owner by the use of
force.

© 2003 Prentice-Hall, Inc. 46
Car models that have been in production for a few years, without many design changes, stand the greatest risk of theft.
These models are the ones most often taken because their parts are most valued in the secondary market.
Motor Vehicle Theft

© 2003 Prentice-Hall, Inc. 47
The intentional damaging or destruction or attempted damaging or destruction, by means of fire or explosion of the property of another without the consent of the owner, or of one’s own property or that of another, with intent to defraud.
Arson

© 2003 Prentice-Hall, Inc. 48
It can include a dwelling, house, public building, motor vehicle, aircraft, or personal property of another.
Arson

© 2003 Prentice-Hall, Inc. 49
Arson
• It was added to Part I Index offenses in 1979.
• Juveniles are arrested for a greater share of this crime than any other.

© 2003 Prentice-Hall, Inc. 50
arson for profit -
A professional arsonist who sets fires for a fee.
Arson

© 2003 Prentice-Hall, Inc. 51
arson fraud -
Involves business owner burning his property to escape financial problems or for insurance.
Arson

© 2003 Prentice-Hall, Inc. 52
• Special Arson Reporting System - 1982
• designed to provide data
Arson

© 2003 Prentice-Hall, Inc. 53
• includes place of occurrence
• type of weapon (if any) used
• type and value of property damaged or stolen
• personal characteristics of offender and victim
National Incident Based Reporting System
Incident driven, rather than summary based:
NIBRS

© 2003 Prentice-Hall, Inc. 54
NIBRS
• nature of the disposition of the complaint
• replaces the old Part I and Part II offenses with 22 general offenses

© 2003 Prentice-Hall, Inc. 55
22 offenses include:
• arson• assault• bribery• burglary• counterfeiting• vandalism
NIBRS
• narcotics offenses• embezzlement• extortion• fraud• weapons violations

© 2003 Prentice-Hall, Inc. 56
• gambling• homicide• kidnapping• larceny• motor vehicle
theft• pornography
NIBRS22 offenses include:
• prostitution• robbery• forcible sex
offenses• non-forcible sex
offenses• receiving stolen
property

© 2003 Prentice-Hall, Inc. 57
• bad checks• vagrancy• disorderly conduct• driving under the
influence• drunkenness• non-violent family
offenses
Also collects data on:
NIBRS
• liquor law violations• “peeping tom”
activity• runaways• trespassing• general category of
all “other” criminal law violations

© 2003 Prentice-Hall, Inc. 58
Hate Crimes
Criminal offenses in which the defendant’s conduct was motivated by hatred, bias, or prejudice, based on the actual or perceived race, color, religion, national origin, ethnicity, gender, or sexual orientation of another individual or group of individuals.

© 2003 Prentice-Hall, Inc. 59
Hate Crimes: 2000
• Police reported 8,152 hate crime incidents.
• The reports include 19 murders.• 16% of total incidents were
motivated by religious bias.• 54.8% were caused by racial bias.• 16% based on sexual orientation.• Most hate crimes fall into category of “intimidation.”

© 2003 Prentice-Hall, Inc. 60
White Supremacist Groups in the United States
Source: Klanwatch Project

© 2003 Prentice-Hall, Inc. 61
NCVS
• It began operation in 1972.
• The Survey is based on victim self-reports.
• It’s designed to measure the “dark figure” of crime.
• Data is collected by the Bureau of Justice Statistics.
• More than 50,000 households aresurveyed twice per year.
National Crime Victimization Survey

© 2003 Prentice-Hall, Inc. 62
all crime
Dark Figure of Crime
crimes knownto the police

© 2003 Prentice-Hall, Inc. 63
NCVS
• robbery• assault• burglary• personal and household larceny• motor vehicle theft
• rape
Includes data on:

© 2003 Prentice-Hall, Inc. 64
• 25% of all households are touched by crime.
• About 1/2 of all violent crime is reported.
• City residents are twice as likely as rural residents to be a victim of crime.
• 2/5 of all household crimes are reported to the police.
• 1/4 of all personal theft reported to police.
NCVS

© 2003 Prentice-Hall, Inc. 65
• Men are more likely to be victims of crime than women.
• Younger people are more likely to be victims of crime than older people.
• African-Americans are more likely than whites to be victims of crime.
• Young males have the highest rates of violent victimization.
NCVS

© 2003 Prentice-Hall, Inc. 66
NCVS Household crime rates are highest for households:
• headed by younger people
• headed by African-Americans
• with six or more members
• headed by renters
• located in central cities
© 2003 Prentice-Hall, Inc. 67
Problems:• There is potential for false or
exaggerated reports.
• False reports may be generated by overzealous interviewers.
• Respondents may suffer from faulty memories.
• Respondents may misinterpret events.
NCVS

© 2003 Prentice-Hall, Inc. 68
Guns, Crime, and Gun Control
In a typical year, there are 10,000 murders in the United States using guns (handguns).

© 2003 Prentice-Hall, Inc. 69
Pew Research Center Poll (1999)
2/3 of American people believe that increasing restrictions on guns will prevent crime.
Guns, Crime, and Gun Control

© 2003 Prentice-Hall, Inc. 70
The Bureau of Justice Statistics, in 2001, reported 18% of state prison inmates were armed at time of commission of their crime.
Guns, Crime, and Gun Control

© 2003 Prentice-Hall, Inc. 71
Emerging Trends
• gun control legislation
• domestic violence offender gun ban
• lawsuits against gun manufacturers
Guns, Crime, and Gun Control

© 2003 Prentice-Hall, Inc. 72
National Violence Against Women Survey (Bureau of Justice Statistics, 1998)
Women and Crime• 52% of women surveyed say they have
been physically assaulted as a child or as an adult.
• Approximately 1.9 million women are physically assaulted in the United States each year.
• 25% of women, compared to 8% of men surveyed, said they had experienced partner violence in their lifetime.

© 2003 Prentice-Hall, Inc. 73
• 18% of women have experienced a completed or attempted rape at sometime in their life.
• Women are significantly more likely to be injured during an assault.
• Violence against women is primarily partner violence.
National Violence Against Women Survey (Bureau of Justice Statistics, 1998)
Women and Crime

© 2003 Prentice-Hall, Inc. 74
• Women living in central cities are considerably more likely to be victimized than women residing in suburbs.
• Suburban women are more likely to be victimized than women in rural areas.
Women and Crime

© 2003 Prentice-Hall, Inc. 75
Separated or divorced women are likely to be victims of violent crime:
• 6x more than widows• 4.5x more than married women• 3x more than widowers and married men
Women and Crime

© 2003 Prentice-Hall, Inc. 76
Women and Crime
• Low-income women experience highest amount of violent crime.
• Victimization of women falls as family income rises.
• African-American women are victims of violent crime more frequently than women of other races.
• Hispanic women are victimized more frequently than white women.

© 2003 Prentice-Hall, Inc. 77
• Women 20-24 years-old are most at risk for violent victimization.
• Women 16-19 years-old are second most likely to be victimized.
Women and Crime

© 2003 Prentice-Hall, Inc. 78
Women Offenders
Women are reported to have committed:
• 35.9% of larceny- thefts• 39% of forgery and counterfeiting
offenses• 44.9% of fraud offenses• 50% of embezzlements
Women are reported to have committed:
• 35.9% of larceny- thefts• 39% of forgery and counterfeiting
offenses• 44.9% of fraud offenses• 50% of embezzlements

© 2003 Prentice-Hall, Inc. 79
While women make up 51% of the population, they are arrested for 17.4%of violent crime and 29.9% of property crime.
Women Offenders

© 2003 Prentice-Hall, Inc. 80
Economic Cost of Crime
Personal costs of crime:
$17.6 billion dollars per year

© 2003 Prentice-Hall, Inc. 81
• Robberies - $500 million dollars per year
• Burglaries – $4 billion dollars per year
• Larceny-Theft – $4 billion dollars per year
Economic Cost of Crime

© 2003 Prentice-Hall, Inc. 82
Victimization
$105 billion dollars annually in property and productivity losses
Economic Cost of Crime

© 2003 Prentice-Hall, Inc. 83
Rape – the costliest
crime:
• annual victim costs-$127 billion dollars
• higher cost than murder
Economic Cost of Crime

© 2003 Prentice-Hall, Inc. 84
In 2000, persons age 65 and over accounted for
less than 1% of all arrests.
Elderly and Crime