CHAPTER 1V DATA DESCRIPTION AND ANALYSIS A. Data …
29
50 CHAPTER 1V DATA DESCRIPTION AND ANALYSIS This chapter discusses about data description, data analysis per cycle, and final data analysis. A. Data Description This study was conducted by using a classroom action research. It consisted of several activities. First activity was the preliminary research. In this activity, the researcher interviewed the English teacher and did the observation to find out the problem faced by the students. It was held on Wednesday, 20 th of April 2016. After did the preliminary research, the researcher held the cycle 1 on Wednesday, 27 th of April 2016, cycle 2 on Friday, 29 th of April 2016. The subject of this study is students of IX TKJ of SMK Ma’arif NU 01 Ketanggungan Brebes. The total number of this class was 22 students. Based on the observation, some students of this class (IX TKJ) didn’t pay attention to the teacher. There were just a few of student active asking questions to the teacher during the teaching learning process, and some students were easy to be bored. Managing this class was not easy because they had different characteristics of psychological background. In teaching learning process, the teacher used conventional method, where the students just paid attention the
Transcript of CHAPTER 1V DATA DESCRIPTION AND ANALYSIS A. Data …

50
CHAPTER 1V
DATA DESCRIPTION AND ANALYSIS
This chapter discusses about data description, data analysis
per cycle, and final data analysis.
A. Data Description
This study was conducted by using a classroom action
research. It consisted of several activities. First activity was the
preliminary research. In this activity, the researcher interviewed
the English teacher and did the observation to find out the problem
faced by the students. It was held on Wednesday, 20th of April
2016. After did the preliminary research, the researcher held the
cycle 1 on Wednesday, 27th of April 2016, cycle 2 on Friday, 29
th
of April 2016. The subject of this study is students of IX TKJ of
SMK Ma’arif NU 01 Ketanggungan Brebes. The total number of
this class was 22 students.
Based on the observation, some students of this class (IX
TKJ) didn’t pay attention to the teacher. There were just a few of
student active asking questions to the teacher during the teaching
learning process, and some students were easy to be bored.
Managing this class was not easy because they had different
characteristics of psychological background.
In teaching learning process, the teacher used
conventional method, where the students just paid attention the

51
explanation from the teacher. So, the students felt bored of this
way. It affected their ability in learning English.
There were 22 students participated in the research. Each
student was labeled by a code as below:
Table 4.1
List of Students’ Code
No Name Student’s code
1 Carwiti A-1
2 Cecep Nugroho A-2
3 Ema Husnilillah A-3
4 Fajar Murnasih A-4
5 Himatul Aliyah A-5
6 Ida Nurhidayah A-6
7 Khotimah A-7
8 Kurniati Ratnasari A-8
9 Meliana Nur Afiati A-9
10 Nken Indah F A-10
11 Ninok Mutiara Maharani A-11
12 Putri Septiani Rahayu A-12
13 Rina Herlina A-13
14 Rizal Fadilah A-14
15 Saripin A-15
16 Siti Nurlaela A-16
17 Toipah A-17
18 Toybatul Laeli A-18
19 Ulfah A-19
20 Ummilia Umrotul Ummah A-20
21 Warti A-21
22 Wawan Gunawan A-22

52
B. Data Analysis per Cycle
The data would be analyzed per cycle. It was done to
make easy in describing the implementation of busy picture game
in teaching learning process and to know students’ ability in
understanding passive voice after being taught by using busy
picture game.
1. Pre-Cycle
Pre – cycle was conducted on Wednesday, 20th of
April 2016 at 07.15 – 08.45. There are 22 students as
participant. First activity was interview. The writer
interviewed the English teacher to find out the problems faced
by the students. Mr. Supriyanto as English teacher said that
the students’ interest and ability toward English, especially
about its grammar were low. It might be caused of some
possibility reasons, such as the limited time of lesson and the
less facility supported in English lesson, for example there is
no language laboratory yet.1
Besides the interview the writer also did the
observation. It was done on 20th of April 2016. An observation
checklist was used in this activity. Teacher explained the
material about passive voice. Teacher used conventional
method in this pre-cycle. From the observation, the writer
1 Interview was with Mr. Supriyanto, S. Pd (English teacher),
Wednesday, 25th
of November 2015, in SMK Ma’arif NU 01 Ketanggungan
Brebes

53
found some facts that happen in the classroom during the
English lesson. It could be described as bellow:
The English teacher explained the material
systematically and communicatively. Teacher did not use
English language in explaining the material because some
students did not understand if the teacher used English in
explaining material. Here, some students was not enthusiastic
in listening teacher’ explanation. Too many students gave
negative responses in the class with their various troublesome
attitudes verbal or nonverbally. Here is form of observation
about interaction between students and teacher in the class:2
Table 4.2
Form of observation checklist in Pre cycle
No Indicators None
(0%
)
Few
(<20%
)
Hal
f (2
0-
49%
)
Man
y
(50
-69%
)
Maj
ori
ty
(>70%
) Total
Score
1 2 3 4 5
1 The students
paid attention
teacher’s
explanation
2
2 The students
asked question
actively
1
3 The students
were
enthusiastic in
2
2 Based on researcher’s observation in the class

54
teaching
learning
process
4 The students
were
enthusiastic in
doing the test
2
5 The teacher
used active
learning
1
In fact, the data from pre cycle showed that the
students less interacted with the teacher well. The students’
interaction can be calculated by using this following formula:
Score =
=
x 100%
= 32%
From the table above, the average of the interaction
between students and teacher when teaching learning process
was 32%. It can be concluded that students need interesting
technique in teaching learning process.
After finishing the material and the students were
conducive, the teacher prepared the test for pre cycle. The test
was given to the students by giving 10 questions how to
change active into passive form in English. For each correct
answer students would be given 1 score and 0 for each wrong
answer. The maximum score was 10. Then after finding the

55
result of the students’ score, the researcher went to analyze the
score by using percentage of scoring as follow, Below was the
data of pre cycle:
%100xquestionsofnumberThe
answerrightofnumberTheScore
By using the percentage of scoring above, the
researcher had purpose to get the percentage of correct answer
to analyze the students’ score. Then the researcher used five
letters: A, B, C, D and E. to classify the grade of students’
score level as presented on the table below.
The test result of pre cycle can be seen in the table below:
Table 4.3
The result of percentage in the pre cycle as follow:
No Students’
Code
Score Percentage Letter
Score
Category
1 A-1 6 60% D Less
2 A-2 3 30% E Poor
3 A-3 8 80% B Good
4 A-4 6 60% D Less
5 A-5 5 50% D Less
6 A-6 5 50% D Less
7 A-7 6 60% D Less
8 A-8 6 60% D Less
9 A-9 8 80% B Good
10 A-10 8 80% B Good
11 A-11 2 20% E Poor
12 A-12 5 50% D Less
13 A-13 1 10% E Poor
14 A-14 2 20% E Poor
15 A-15 4 40% E Poor
16 A-16 7 70% C Fair
17 A-17 3 30% E Poor

56
18 A-18 6 60% D Less
19 A-19 7 70% C Fair
20 A-20 1 10% E Poor
21 A-21 6 60% D Less
22 A-22 8 80% B Good
Total score 113
Mean 5,13
After knowing the result of students’ score of pre
cycle, the researcher determined the frequency of the students’
ability; it aimed to classify students’ ability. The frequency of
level percentage is divided by total of respondent (n), and
multiplied by the formula was:
P =
X 100%
Note:
P = the percentage of frequency
f = frequency of students’ score
n = the total of students
The computing of the scoring as follow:
Table 4.4
The Category of the students’ score and their percentage
No Interval Frequency Percentage Category
1 90% -
100% Excellent
2 80% - 89% 4 18,19% Good
3 70% - 79% 2 9,1% Fair
4 50% - 69% 9 40,9% Less
5 <50% 7 31,81 Poor
22 100%

57
From the data above, it can be seen that no one
student or 0% who got excellent category, 4 students or
18,19% got good category, 2 students or 9,1% got fair
category, 9 students or 40,9 % got less category, and 7
students or 31,81% got poor category.
After calculating the percentage of students’ score, the
researcher calculated the mean to know the improvement of
students’ score in every cycle. The formula is as follow:
X =
X = the mean
F = the sum score
N = the number of students
The computation in pre cycle is as follow:
X =
X =
= 5,13
The average of the students’ score in pre cycle was
5,13. It showed that the result was low. The researcher would
use the interesting game in teaching passive voice, the
researcher used busy picture game to improve students’
understanding on passive voice.
2. Cycle 1
The first cycle of this research was conducted on
Wednesday, 27th of April 2016. After the result that was
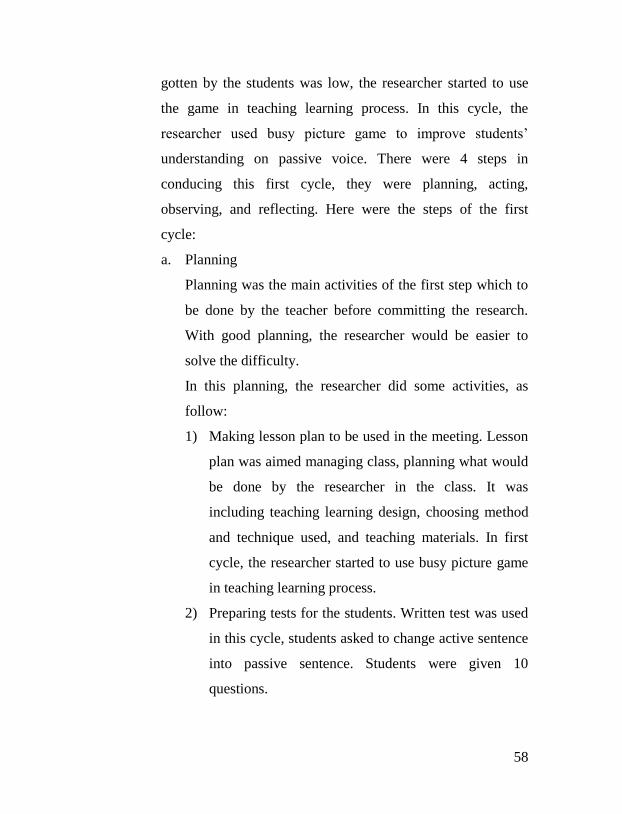
58
gotten by the students was low, the researcher started to use
the game in teaching learning process. In this cycle, the
researcher used busy picture game to improve students’
understanding on passive voice. There were 4 steps in
conducing this first cycle, they were planning, acting,
observing, and reflecting. Here were the steps of the first
cycle:
a. Planning
Planning was the main activities of the first step which to
be done by the teacher before committing the research.
With good planning, the researcher would be easier to
solve the difficulty.
In this planning, the researcher did some activities, as
follow:
1) Making lesson plan to be used in the meeting. Lesson
plan was aimed managing class, planning what would
be done by the researcher in the class. It was
including teaching learning design, choosing method
and technique used, and teaching materials. In first
cycle, the researcher started to use busy picture game
in teaching learning process.
2) Preparing tests for the students. Written test was used
in this cycle, students asked to change active sentence
into passive sentence. Students were given 10
questions.

59
3) Preparing media for teaching. The use of media was
very important to gain students attention and to
support teaching learning process and data collection.
The researcher prepared the picture that had many
activities on. The researcher did not use slide because
there was not LCD in this class. Besides that,
preparing digital camera to make documentation.
b. Acting
There were some things done in acting step, they were:
1) Delivering the materials to the students. The
researcher introduced 8 tenses that would be learned,
that were simple present tense, simple past tense,
simple future tense, simple past future tense, present
continuous tense, present perfect tense, past
continuous tense, and past perfect tense. Then,
students had to change active sentences into passive
form. Students was learned to make sentences in
passive form based on busy pictures that given by the
researcher.
2) Giving the test for the students. After using the busy
picture game students was given the test, it was for
measuring students’ achievement after taught by busy
picture game.
3) Collecting data

60
c. Observing
This observation had function as viewing and documenting
the effects caused by the actions in the classroom. There
were 2 aspects monitored in this step:
1) Students’ attention and participation in learning
While conducting teaching learning process, students’
attention and participation was observed. Observation
was done by the researcher and collaborator. After the
teaching learning process the results were being
discussed.
Table 4.5
Form of students’ interaction in cycle 1
No Indicators None
(0%
)
Few
(<20%
)
Hal
f (2
0-
49%
)
Man
y
(50
-69%
)
Maj
ori
ty
(>70%
)
Total
Score
1 2 3 4 5
1 The students
paid
attention
teacher’s
explanation
3
2 The students
asked
question
actively
2
3 The students
were
enthusiastic
in teaching
learning
process
3

61
4 The students
were
enthusiastic
in doing the
test
3
5 The teacher
used active
learning
2
In fact, the data from cycle 1 showed that the students
still less interacted with the teacher well. The students‟
interaction can be calculated by using this following
formula:
Score =
=
x 100%
= 52%
In pre cycle, students got 32%. It showed that students
attention in teaching learning process was low, in the
first cycle students got 52%. So, there were improvement
of students’ attention and participation in teaching
learning process. Although, the students were still be
confused with the technique used, because the technique
were new for them. It mean that students’ interaction
were still low from the indicator of achievement (75%).
But after given some example, they began to understand.
Some of them paid attention to the material, some of
them ignored the teacher explanation.

62
2) Students’ achievement
After the game used by the researcher, students were
given tests to know improvement of students’
understanding on passive voice.
Table 4.6
Students’ Achievement in Cycle 1
No Students’
Code
Score Percentage Letter
Score
Category
1 A-1 6 60% D Less
2 A-2 3 30% E Poor
3 A-3 8 80% B Good
4 A-4 7 70% C Fair
5 A-5 6 60% D Less
6 A-6 7 70% C Fair
7 A-7 6 60% D Less
8 A-8 5 50% D Less
9 A-9 8 80% B Good
10 A-10 8 80% B Good
11 A-11 2 20% E Poor
12 A-12 7 70% C Fair
13 A-13 5 50% D Less
14 A-14 5 50% D Less
15 A-15 7 70% C Fair
16 A-16 8 80% B Good
17 A-17 5 50% D Less
18 A-18 8 80% B Good
19 A-19 7 70% C Fair
20 A-20 4 40% E Poor
21 A-21 7 70% C Fair
22 A-22 9 90% A Excellent
Total score 138
Mean 6,27

63
Table 4.7
The Category of the Students Score and their
percentage in cycle 1:
No Interval Frequency Percentage Category
1 90% -
100% 1 4,55% Excellent
2 80% -
89% 5 22,73% Good
3 70% -
79% 6 27,27% Fair
4 50% -
69% 7 31,81% Less
5 <50% 3 13,64% Poor
22 100%
From the data above, it can be seen that one
student or 4,55% who got excellent category, 5 students
or 22,73% got good category, 6 students or 27,27% got
fair category, 7 students or 31,81 % got less category,
and 3 students or 13,64% got poor category.
After calculating the percentage of students’ score,
the researcher calculated the mean to know the
improvement of students’ score in every cycle. The
formula is as follow:
X =
X = the mean
F = the sum score
N = the number of students

64
The computation in pre cycle is as follow:
X =
X =
= 6,27
In pre cycle, the average was 5,13, and in cycle 1 the
average was 6, 27. So, there are improvement of the
average, that was 1,14%. But, the students have not
gotten good result.
d. Reflecting
From the table above, it could be seen the students’
achievement or understanding on passive voice. The
average score was 6,27. The minimum score was 2, and
the maximum score was 9. There was an increasing from
the pre-test average score that was 5,13 became 6,27. It
could be concluded that busy picture game was effective
to teach passive voice in this cycle. Although, there were
students got poor category, it might be students have not
understood well about the game. However, the average
score was still below minimum standard score. The
minimum standard score (75), so the researcher tried to
the next cycle.
Since pre cycle until test in the first cycle, the
increase of students’ average score was shown as below:

65
Chart 4.1
The increasing of students’ average score
From the diagram above, the researcher can
conclude that there was an improvement on students’
achievement in passive voice after taught using busy
picture game.
In cycle 1 showed that there was increasing
students’ achievement up to 6,27. Before it students’
achievement was 5,13 It means there was improvement
from pre cycle until cycle 1 after using busy picture game.
So, second cycle would be conducted
3. Cycle 2
The second cycle of this research was conducted on
Friday, 29th of April 2016. After using busy picture game in
the first cycle students still confused about passive, they
0
1
2
3
4
5
6
7

66
couldn’t differ the function of auxiliary verb (to be). They also
confused differ subject and agent. When they were playing
game some of them could not cooperative with their group,
thus the researcher was still guides them on playing game.
The implementation of busy picture game was continued in
teaching passive voice. There were 4 steps in conducting the
second cycle, they were planning, acting, observing, and
reflecting.
a. Revised Planning
The researcher did this cycle based on the
reflection of the first cycle with the teacher of English. In
this revise plan activity, the teacher prepared the
instructional tool for teaching and learning process such
as; arranging lesson plan. Here the lesson plan was
modified with different material and activities from the
previous one but still used problem based learning
strategy. It supposed to make the students would get better
improvement on their result. Then, the teacher prepared
media, observation checklist which needed in teaching
learning process. The teacher also prepared test for the
students which the test was different topic in this cycle
than the test in the previous cycle.
b. Acting
There were some things done in acting stage, they
were:
67
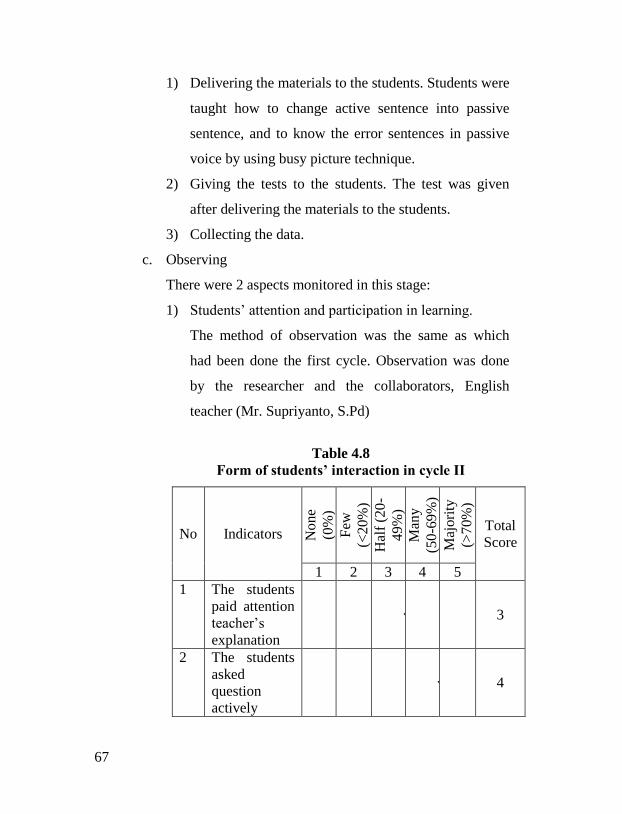
1) Delivering the materials to the students. Students were
taught how to change active sentence into passive
sentence, and to know the error sentences in passive
voice by using busy picture technique.
2) Giving the tests to the students. The test was given
after delivering the materials to the students.
3) Collecting the data.
c. Observing
There were 2 aspects monitored in this stage:
1) Students’ attention and participation in learning.
The method of observation was the same as which
had been done the first cycle. Observation was done
by the researcher and the collaborators, English
teacher (Mr. Supriyanto, S.Pd)
Table 4.8
Form of students’ interaction in cycle II
No Indicators No
ne
(0%
)
Few
(<2
0%
)
Hal
f (2
0-
49
%)
Man
y
(50
-69
%)
Maj
ori
ty
(>7
0%
)
Total
Score
1 2 3 4 5
1 The students
paid attention
teacher’s
explanation
3
2 The students
asked
question
actively
4
68
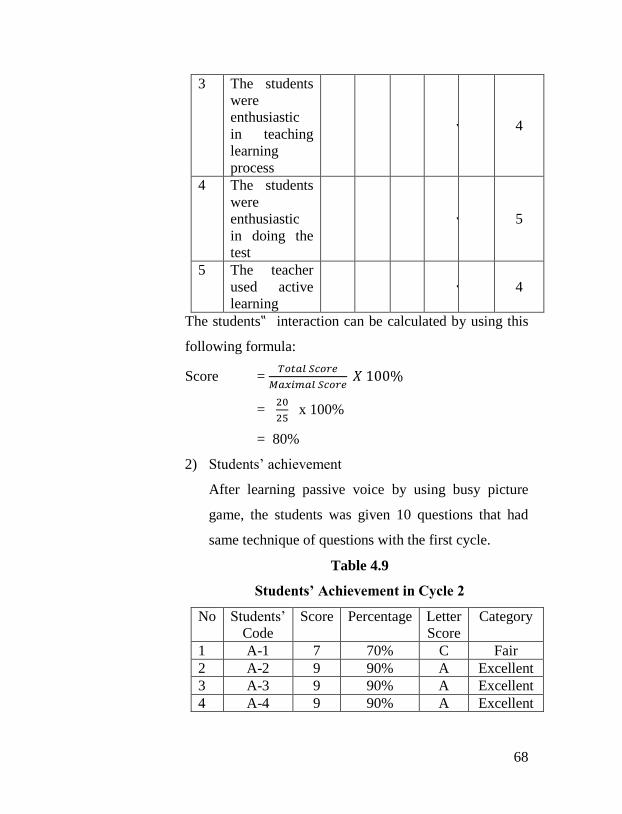
3 The students
were
enthusiastic
in teaching
learning
process
4
4 The students
were
enthusiastic
in doing the
test
5
5 The teacher
used active
learning
4
The students‟ interaction can be calculated by using this
following formula:
Score =
=
x 100%
= 80%
2) Students’ achievement
After learning passive voice by using busy picture
game, the students was given 10 questions that had
same technique of questions with the first cycle.
Table 4.9
Students’ Achievement in Cycle 2
No Students’
Code
Score Percentage Letter
Score
Category
1 A-1 7 70% C Fair
2 A-2 9 90% A Excellent
3 A-3 9 90% A Excellent
4 A-4 9 90% A Excellent

69
5 A-5 7 70% C Fair
6 A-6 9 90% A Excellent
7 A-7 8 80% B Good
8 A-8 7 70% C Fair
9 A-9 10 100% A Excellent
10 A-10 8 80% B Good
11 A-11 9 90% A Excellent
12 A-12 8 80% B Good
13 A-13 8 80% B Good
14 A-14 7 70% C Fair
15 A-15 8 80% B Good
16 A-16 9 90% A Excellent
17 A-17 8 80% B Good
18 A-18 8 80% B Good
19 A-19 7 70% C Fair
20 A-20 7 70% C Fair
21 A-21 8 80% B Good
22 A-22 8 80% B Good
Total score 178
Mean 8,09
Table 4.10
The Category of the Students Score and their
percentage in cycle 2:
No Interval Frequency Percentage Category
1 90% -
100% 7 31,82% Excellent
2 80% -
89% 9 40,90% Good
3 70% -
79% 6 27,28% Fair
4 50% -
69% Less
5 <50% Poor
22 100%

70
After calculating the percentage of students’ score,
the researcher calculated the mean to know the
improvement of students’ score in every cycle. The
formula is as follow:
X =
X = the mean
F = the sum score
N = the number of students
The computation in pre cycle is as follow:
X =
X =
= 8,09
d. Reflecting
From the table above, it seemed that there were 6
students failed the tests. They got score under standard
minimum, that was 7,5, 7 students got excellent category,
and 9 students got good category. The average score was
8,09. The minimum score was 7, and the maximum score
was 10. There was an increase of the scores average, from
6,27 became 8,09. It could be concluded that busy picture
game was effective for passive voice. Because of the
score that was higher than minimum standard score, the
problem of teaching passive voice was solved
The interaction between students and teacher in
this cycle was also increase. The mean of students’

71
interaction during second cycle was 80% of total students.
It means that students’ participation was excellent. It was
passed the indicator of achievement (75%).
Since test in the first cycle until second cycle, the
increase of students‟ average score was shown as below:
Chart 4.2
The increasing of students’ average score
From the diagram above, the researcher can
conclude that there was an improvement on students’
achievement or understanding on passive voice after
taught using busy picture game. From first cycle showed
that students’ achievement was 6,27%. In cycle 2 showed
that there was increasing students’ achievement up to
8,09%. It means there was improvement from cycle 1
until cycle 2 after using busy picture game.
0
1
2
3
4
5
6
7
8
9

72
C. Final Data Analysis
1. The Result of Observation Checklist
After the researcher implemented busy picture game
as the technique to improve students’ understanding on
passive voice, he got data. It was analyzed from each cycle
and then the researcher got the result of the classroom action
research as followed:
Table 4.11
Students’ Observation Checklist
No Indicators Grade
Pre cycle Cycle 1 Cycle 2
1 The students paid
attention teacher’s
explanation
2 3 3
2 The students asked
question actively 1 2 4
3 The students were
enthusiastic in teaching
learning process
2 3 4
4 The students were
enthusiastic in doing
the test
2 3 5
5 The teacher used active
learning 1 2 4
Total 8 13 20
Percentage 32% 52% 80%
Table 4.12

73
Teacher’s Observation Checklist
No Indicators Total Score
Pre cycle Cycle 1 Cycle 2
1 Presentation
a. Teacher’s
explanation is easy
to be understood
b. Teacher gives
students chance to
ask some questions
about the material
c. Teacher can answer
the students’ answer
d. Teacher can involve
students to make a
conclusion
2
3
3
2
3
3
4
3
4
4
4
5
2 Implementing of
Strategy
a. Teacher can apply
the strategy
appropriate with
lesson planning
b. Teacher can give
explicit and easy to
be understood
instructions
c. Teacher can use
media effectively
3
3
2
4
3
3
4
4
5
3 Performance
a. Teacher has clear
voice during
teaching and
learning process
2
4
5

74
b. Teacher can manage
students in class
1 3 4
Total 21 30 39
Percentage 46.7% 66.7% 86.7%
It can be seen from the observation above that there
were improvements from the teacher’s activities in teaching
passive voice. It was 46.7% in the preliminary research. It
means that the score is still average. It was being 66.7% in the
cycle one and it was being 86.7% in the cycle two. It means
that the scores were good. The teacher felt easier to handle the
class when she taught busy picture game.
2. The result of test
Table 4.13
The result of task from the first cycle until third cycle
as follow:
No Students’ Code Pre Cycle Cycle 1 Cycle 2
1 A-1 6 6 7
2 A-2 3 3 9
3 A-3 8 8 9
4 A-4 6 7 9
5 A-5 5 6 7
6 A-6 5 7 9
7 A-7 6 6 8
8 A-8 6 5 7
9 A-9 8 8 10
10 A-10 8 8 8
11 A-11 2 2 9
12 A-12 5 7 8
13 A-13 1 5 8
14 A-14 2 5 7

75
15 A-15 4 7 8
16 A-16 7 8 9
17 A-17 3 5 8
18 A-18 6 8 8
19 A-19 7 7 7
20 A-20 1 4 7
21 A-21 6 7 8
22 A-22 8 9 8
Sum 113 138 178
Average (Mean) 5,13 6,27 8,09
Low Score 1 2 7
High Score 8 9 10
Since pre cycle until test in the second cycle, the increase
of students’ average score was shown as below:
Chart 4.3
The increasing of students’ average score
0
1
2
3
4
5
6
7
8
9

76
Table 4.14
The Result of Students’ Observation Checklist from
Preliminary until Second Cycle
No Cycle Average (Mean)
1 Preliminary 32%
2 Cycle 1 52%
3 Cycle 2 80%
Table 4.15
The Result of Teacher Observation Checklist from
Preliminary until Second Cycle
No Cycle Average (Mean)
1 Preliminary 46.7%
2 Cycle 1 66.7%
3 Cycle 2 86.7%
In the pre cycle, all of the students have been doing the
test, and the average result was 5,13. In this activity, the teacher
still uses conventional method and didn’t implement teaching
strategy yet. The students’ interaction was 32%. It means that
students’ interaction were still low from the indicator of
achievement (75%). In teaching learning process, only half of the
students are active and enthusiastic to the lesson. A half of
students did not give response maximally, especially the students

77
who sit down in backside. They like talk with their pairs. The
students look boring and sleepy.
In the first cycle, the average result increased became
6,27, and the students’ interaction was 52%. The teacher began
busy picture game to teach the students. In beginning, students
were still confused with the game. I thought that the students have
not understood well about the game. But, after several examples,
they began to understand. In teaching learning process, there were
many of students joined the class enthusiastically. They
sometimes paid attention, and sometimes didn’t pay attention.
There were many students in the behind still talked with their pair.
In the second cycle, the average result was 8,09. It was
higher than result in pre cycle and first cycle. It showed that there
was some significant improvement in students’ achievement. The
students’ interaction in the class was also increased became 80%.
Furthermore, there was also improvement from cycle 1 until cycle
2.
Teaching learning process in second cycle has not many
different with the previous one. The researcher just analyzed and
gives more attention to some students that still have lower score.
Before the lesson began, the researcher asked the students to give
more pay attention to the lesson. Because the materials were quite
difficult, the researcher would give reward for the students who
got higher score, so it makes the students are more highly
motivated to learn. In teaching learning process, majority of the

78
students joined the class enthusiastically. All activities in this
cycle run well.
The researcher did not continue to the next cycle. Because
there were some reasons, firstly, from the second cycle the result
of students’ achievement reached the minimum score although
there were many students’ that got fair category. Secondly, the
time, the students’ of this school wanted to do final test of first
semester. So, they had to prepare it.
Based on the result that have been done, it can be
described that using busy picture game in the teaching learning
process at grade XI TKJ students’ of SMK Ma’arif NU 01
Ketanggungan Brebes could improve students’ understanding on
passive voice. Actually, the use of the appropriate teaching media
and technique made students easy to understand the material that
is delivered by the teacher. The researcher felt that applying busy
picture game to improve students’ understanding on passive voice
was successful.