Chapter 19 Methods Appendix GAIN Coordinating Center (11/21/2012). Normal, IL: Chestnut Health...
54
Chapter 19 Methods Appendix GAIN Coordinating Center (11/21/2012). Normal, IL: Chestnut Health Systems. November 2012. Available from www.gaincc.org/slides Created for: Substance Abuse and Mental Health Services Administration’s (SAMHSA) Center for Substance Abuse Treatment (CSAT) under contract number 270-2012-00001
-
Upload
marjorie-warren -
Category
Documents
-
view
215 -
download
1
Transcript of Chapter 19 Methods Appendix GAIN Coordinating Center (11/21/2012). Normal, IL: Chestnut Health...
Chapter 19Methods Appendix
GAIN Coordinating Center (11/21/2012).Normal, IL: Chestnut Health Systems. November 2012.
Available from www.gaincc.org/slides
Created for: Substance Abuse and Mental Health Services Administration’s (SAMHSA) Center for
Substance Abuse Treatment (CSAT) under contract number 270-2012-00001
2
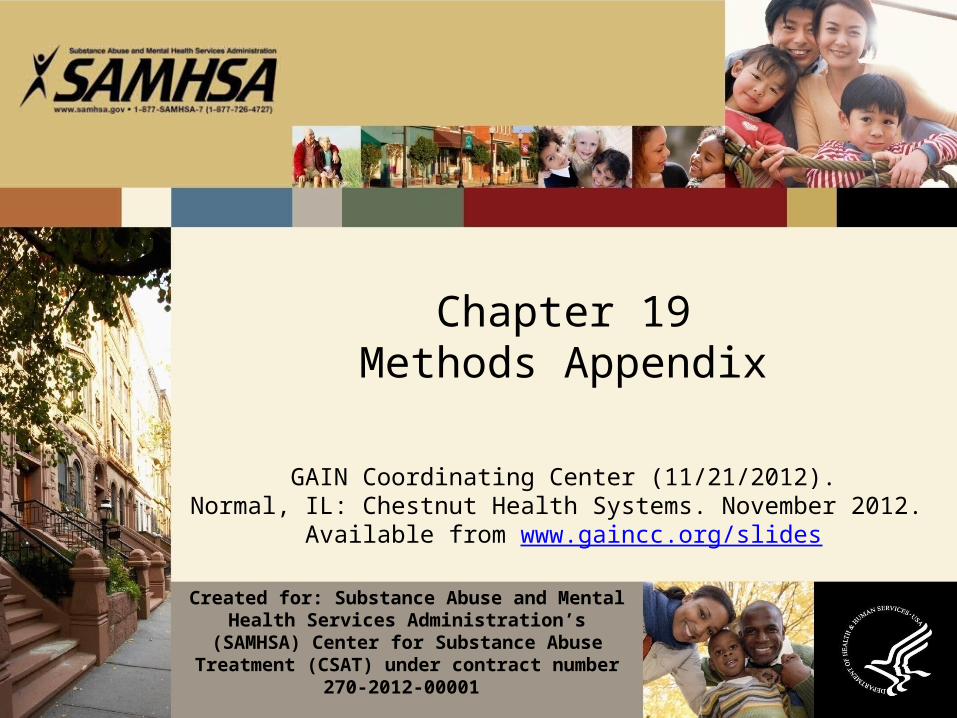
Methods Appendix
This section provides an overview of methodological issues including:– Administration times – Follow-up rates, – Months to last follow-ups, – Number of follow-ups, – Instrument fidelity.

3
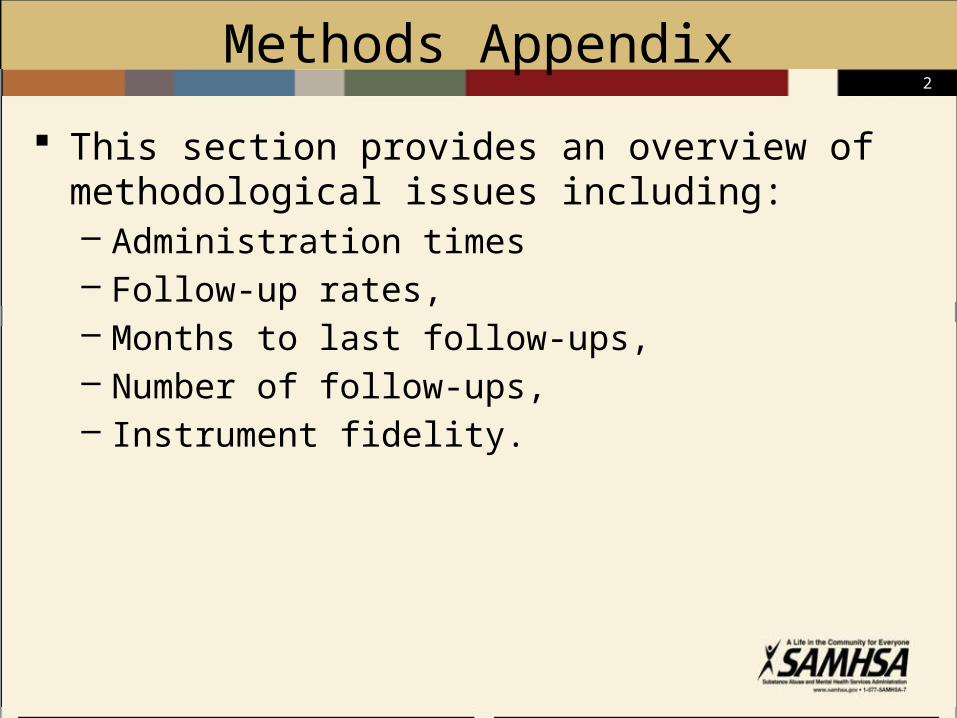
Administration Times ‘Core Only’ administration refers to records where the
participant was asked only the required GAIN items and none of the optional items.
‘Core + Optional’ (Full) administration refers to records where the participant was asked all required and optional GAIN items. This version includes recommended and treatment items for a broader clinical picture.
‘Total’ indicates the combination of both the records that used a core with the records that used the full.
Approximately 8% of cases could not be designated as a Full or a Core only administration.
Less than 1% were missing data on interview duration.
4
Administration Times
Core Only Core + Optional Total
Number of records (sites) 10,691 (127) 16,870 (206) 29,715 (230)
Average Minutes 88 112 103
95% Confidence Interval (in minutes) 87 to 89 111 to 113 102 to 103
St. Deviation (in minutes) 31 43 41
Skew 1.37 0.78 1.02
Percentiles
5% 49 55 50
25% 65 80 74
50% 83 105 95
75% 103 135 120
95% 145 193 180
SAMHSA 2011 GAIN Summary Analytic Data Set (n = 29,715)
5
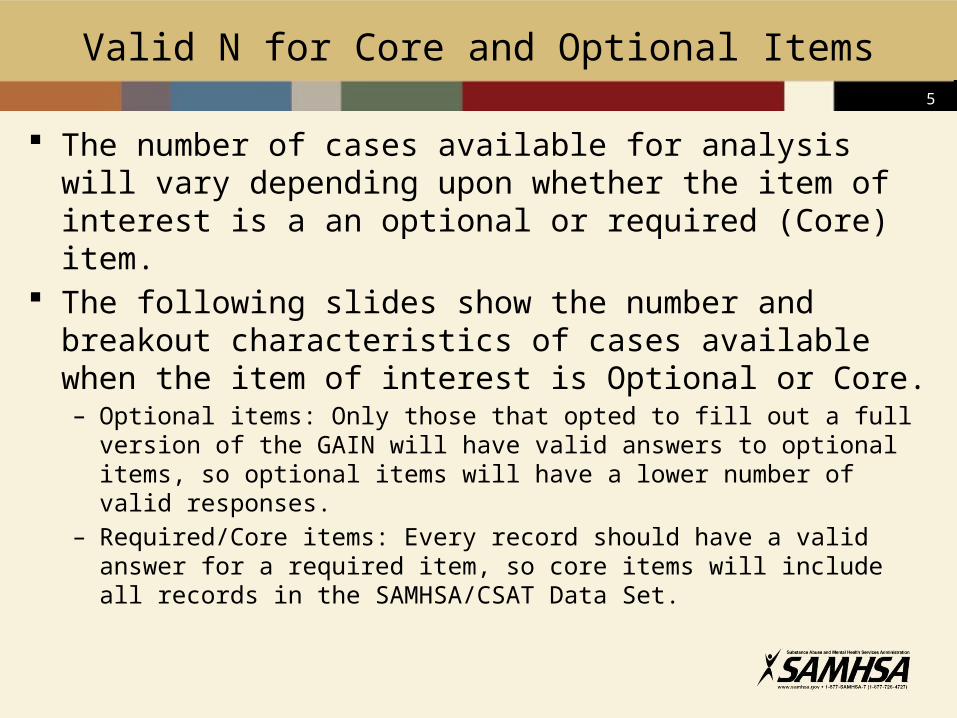
Valid N for Core and Optional Items
The number of cases available for analysis will vary depending upon whether the item of interest is a an optional or required (Core) item.
The following slides show the number and breakout characteristics of cases available when the item of interest is Optional or Core.– Optional items: Only those that opted to fill out a full version of the
GAIN will have valid answers to optional items, so optional items will have a lower number of valid responses.
– Required/Core items: Every record should have a valid answer for a required item, so core items will include all records in the SAMHSA/CSAT Data Set.
6
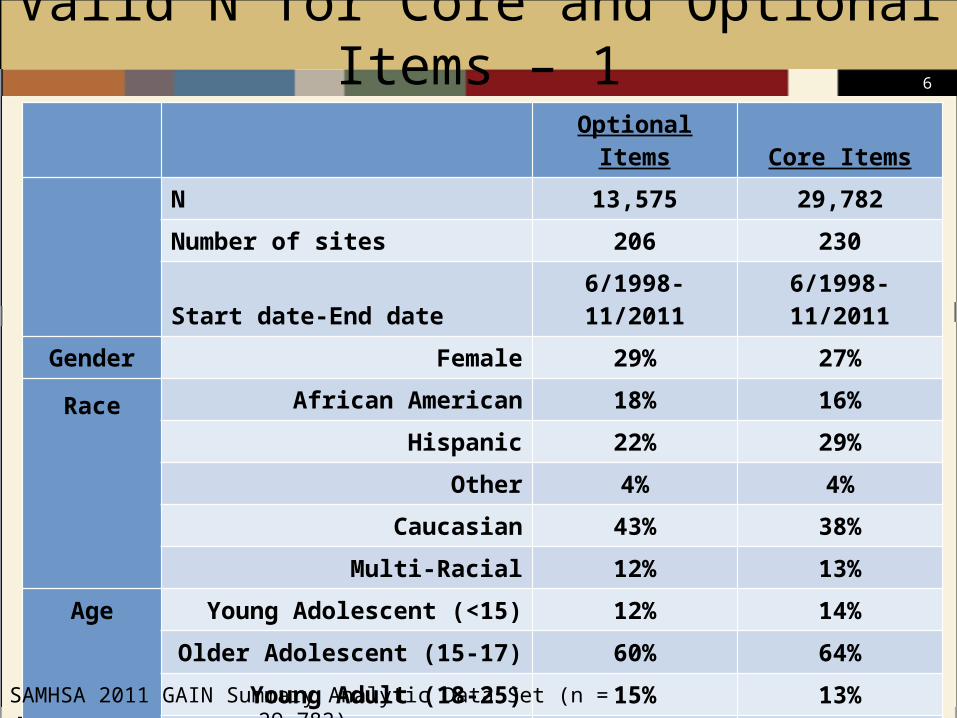
Valid N for Core and Optional Items – 1
Optional Items Core Items
N 13,575 29,782
Number of sites 206 230
Start date-End date 6/1998-11/2011 6/1998-11/2011
Gender Female 29% 27%
RaceAfrican American 18% 16%
Hispanic 22% 29%
Other 4% 4%
Caucasian 43% 38%
Multi-Racial 12% 13%
Age Young Adolescent (<15) 12% 14%
Older Adolescent (15-17) 60% 64%
Young Adult (18-25) 15% 13%
Older Adult (26+) 12% 9%
SAMHSA 2011 GAIN Summary Analytic Data Set (n = 29,782)
7
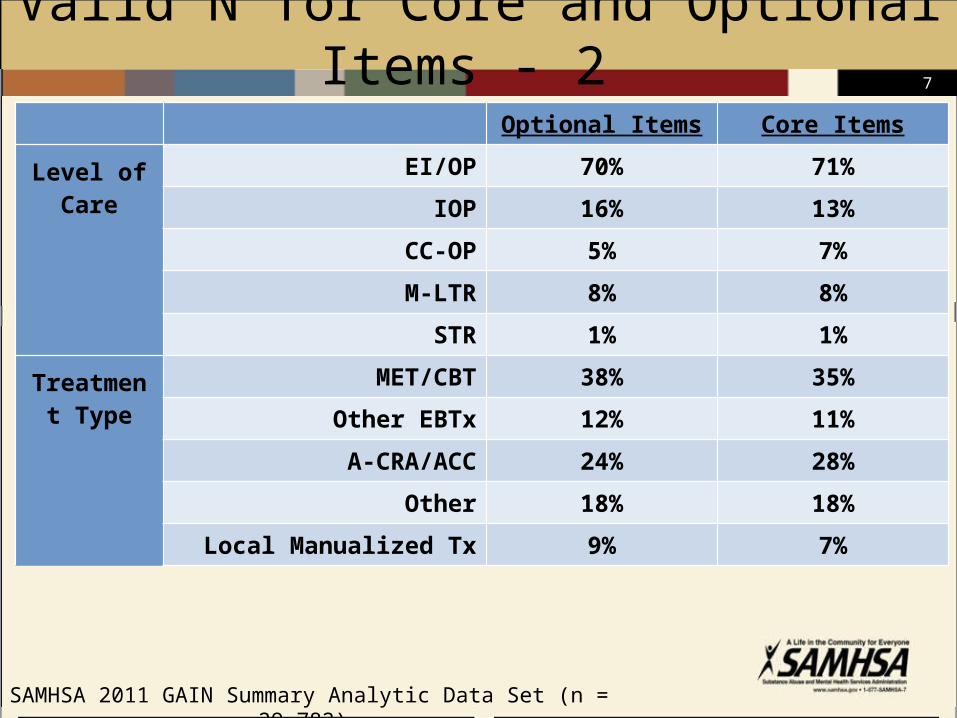
Valid N for Core and Optional Items - 2
Optional Items Core Items
Level of Care
EI/OP 70% 71%
IOP 16% 13%
CC-OP 5% 7%
M-LTR 8% 8%
STR 1% 1%
Treatment Type
MET/CBT 38% 35%
Other EBTx 12% 11%
A-CRA/ACC 24% 28%
Other 18% 18%
Local Manualized Tx 9% 7%
SAMHSA 2011 GAIN Summary Analytic Data Set (n = 29,782)

8
Valid N for Core and Optional Items - 3
Optional Items Core Items
ProgramOther 3% 4%
TCE 7% 10%
EAT 21% 22%
DC 3% 6%
AAFT 15% 19%
SCY 10% 8%
ATDC 7% 4%
ORP 13% 8%
YORP 8% 8%
CYT 3% 2%
ART 3% 6%
ATM 7% 5%
SAMHSA 2011 GAIN Summary Analytic Data Set (n = 29,782)
9
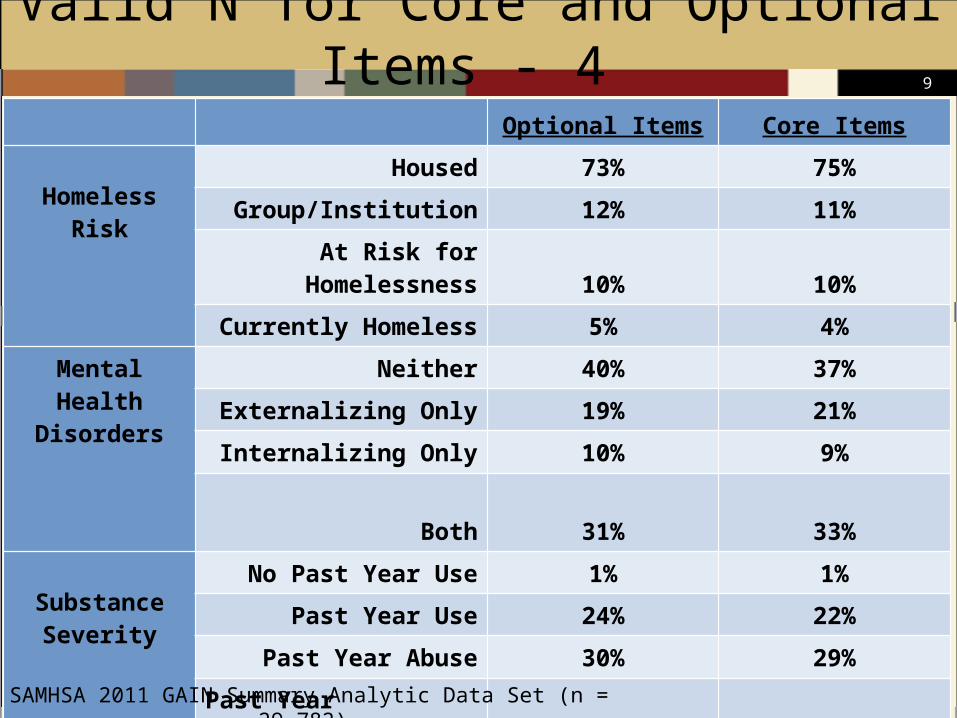
Valid N for Core and Optional Items - 4
Optional Items Core Items
Homeless Risk
Housed 73% 75%
Group/Institution 12% 11%
At Risk for Homelessness 10% 10%
Currently Homeless 5% 4%
Mental Health Disorders
Neither 40% 37%
Externalizing Only 19% 21%
Internalizing Only 10% 9%
Both 31% 33%
Substance Severity
No Past Year Use 1% 1%
Past Year Use 24% 22%
Past Year Abuse 30% 29%
Past Year Dependence 46% 47%
SAMHSA 2011 GAIN Summary Analytic Data Set (n = 29,782)

10
Valid N for Core and Optional Items - 5
Optional Items Core Items
Intensity of Justice System
Involvement
PY illegal activity/SA use 15% 15%
Past arrest/CJ status 6% 6%
Other CJ status 12% 12%
Other prob/parole/deten 16% 15%
Prob/parole 14+ days 20% 22%
Drug Court 11% 11%
Deten/jail 14-29 days 4% 5%
Deten/jail 30+ days 16% 14%
SAMHSA 2011 GAIN Summary Analytic Data Set (n = 29,782)
11
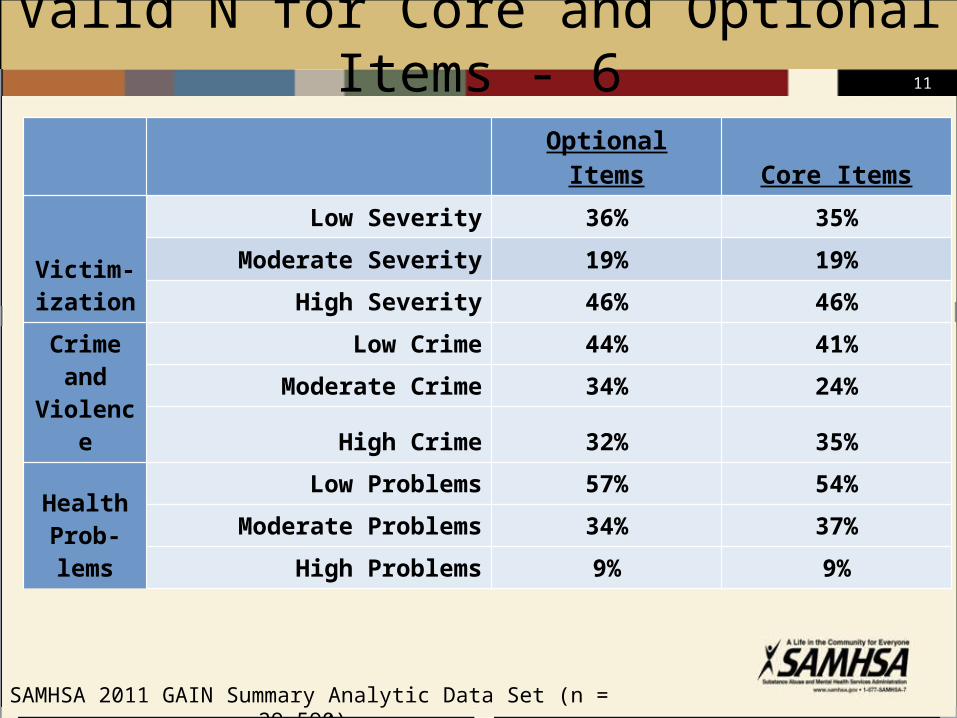
Valid N for Core and Optional Items - 6
Optional Items Core Items
Victim-ization
Low Severity 36% 35%
Moderate Severity 19% 19%
High Severity 46% 46%
Crime and
Violence
Low Crime 44% 41%
Moderate Crime 34% 24%
High Crime 32% 35%
Health Prob-lems
Low Problems 57% 54%
Moderate Problems 34% 37%
High Problems 9% 9%
SAMHSA 2011 GAIN Summary Analytic Data Set (n = 29,590)

12
Follow Up Rates*
Series10%
10%
20%
30%
40%
50%
60%
70%
80%
90%
100%
89%
79% 77%69%
1+ Follow Up Rate 3 Month 6 Month 12 Month
SAMHSA 2011 GAIN Summary Analytic Data Set
*Of those due for that follow-up

13
Follow Up Rates* by Age
<15 15-17 18-25 26+0%
10%
20%
30%
40%
50%
60%
70%
80%
90%
100%9
1%
88
%
87
%
89
%
83
%
79
%
78
%
78
%
80
%
76
%
73
% 78
%
72
%
69
%
66
% 72
%
1+ Follow Up Rate 3-Month 6 Month 12 Month
*Of those due for that follow-up
SAMHSA 2011 GAIN Summary Analytic Data Set
14
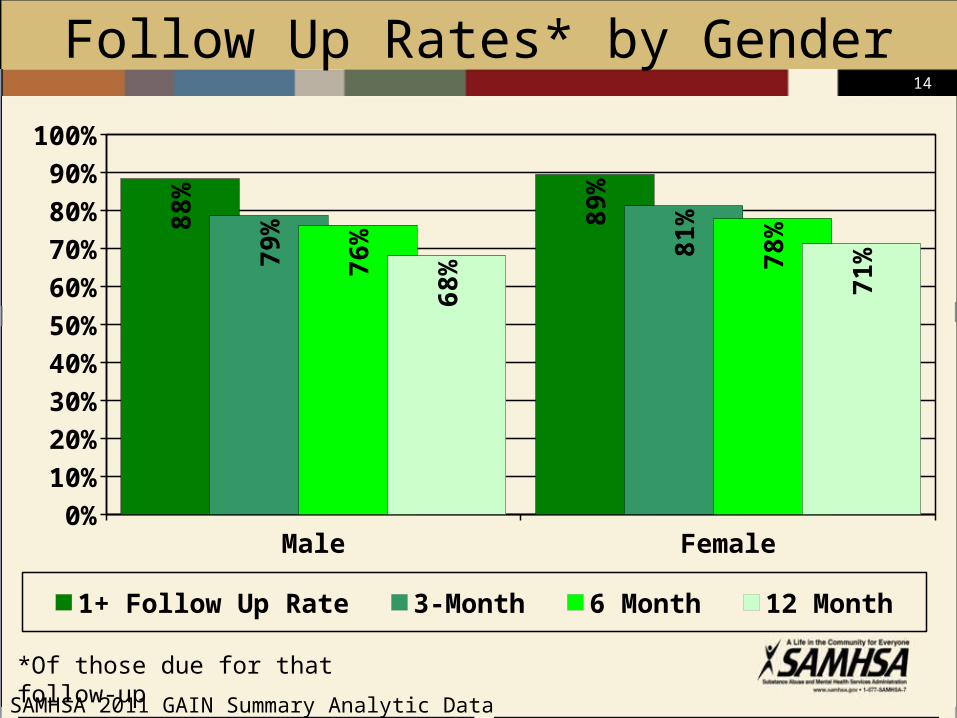
Follow Up Rates* by Gender
Male Female0%
10%
20%
30%
40%
50%
60%
70%
80%
90%
100%
88
%
89
%
79
%
81
%
76
%
78
%
68
%
71
%
1+ Follow Up Rate 3-Month 6 Month 12 Month
*Of those due for that follow-up
SAMHSA 2011 GAIN Summary Analytic Data Set
15
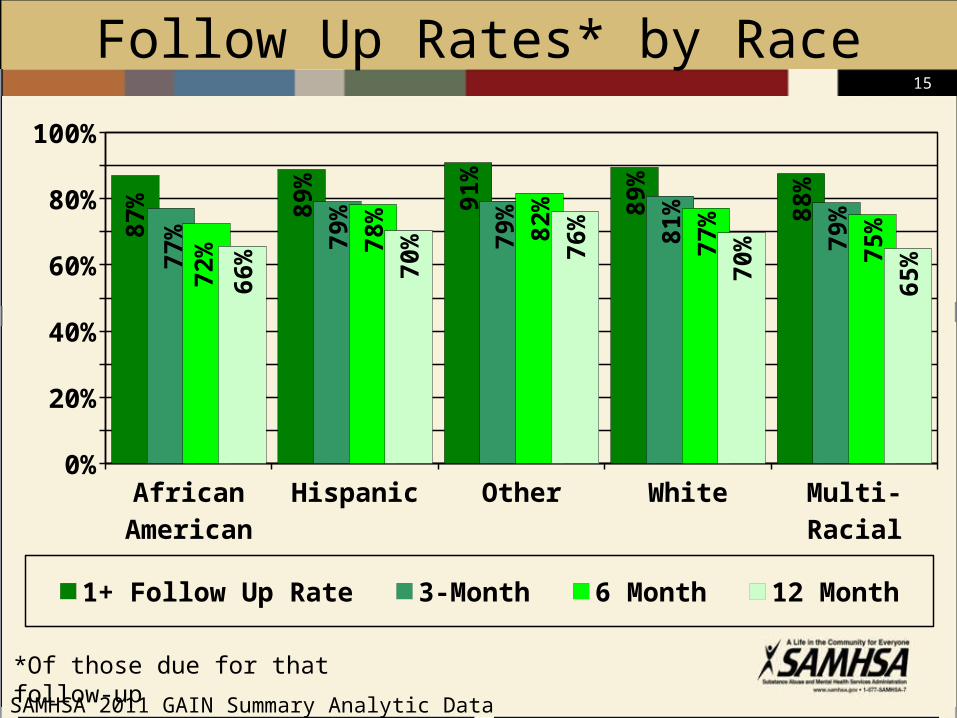
Follow Up Rates* by Race
African American
Hispanic Other White Multi-Racial0%
10%20%30%40%50%60%70%80%90%
100%87
% 89%
91%
89%
88%
77% 79
%
79%
81%
79%
72% 78
%
82%
77%
75%
66% 70
% 76%
70%
65%
1+ Follow Up Rate 3-Month 6 Month 12 Month
*Of those due for that follow-up
SAMHSA 2011 GAIN Summary Analytic Data Set

16
Follow Up Rates* by Substance Use Severity
No PY Use PY Use PY Abuse PY De-pendence
0%
20%
40%
60%
80%
100%
89
%
87
%
89
%
89
%
77
%
78
%
80
%
80
%
78
%
74
%
77
%
78
%
66
%
64
%
68
%
71
%
1+ Follow Up Rate 3-Month 6 Month 12 Month
*Of those due for that follow-up
SAMHSA 2011 GAIN Summary Analytic Data Set
17
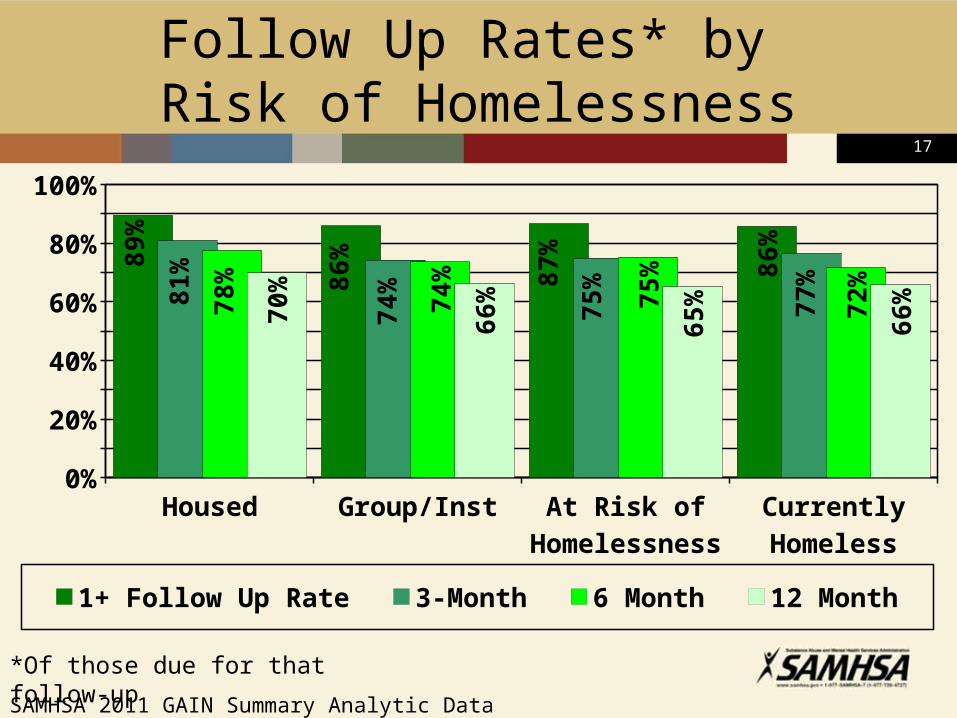
Follow Up Rates* by Risk of Homelessness
Housed Group/Inst At Risk of Homelessness
Currently Homeless
0%
20%
40%
60%
80%
100%
89
%
86
%
87
%
86
%
81
%
74
%
75
%
77
%
78
%
74
%
75
%
72
%
70
%
66
%
65
%
66
%
1+ Follow Up Rate 3-Month 6 Month 12 Month
*Of those due for that follow-up
SAMHSA 2011 GAIN Summary Analytic Data Set
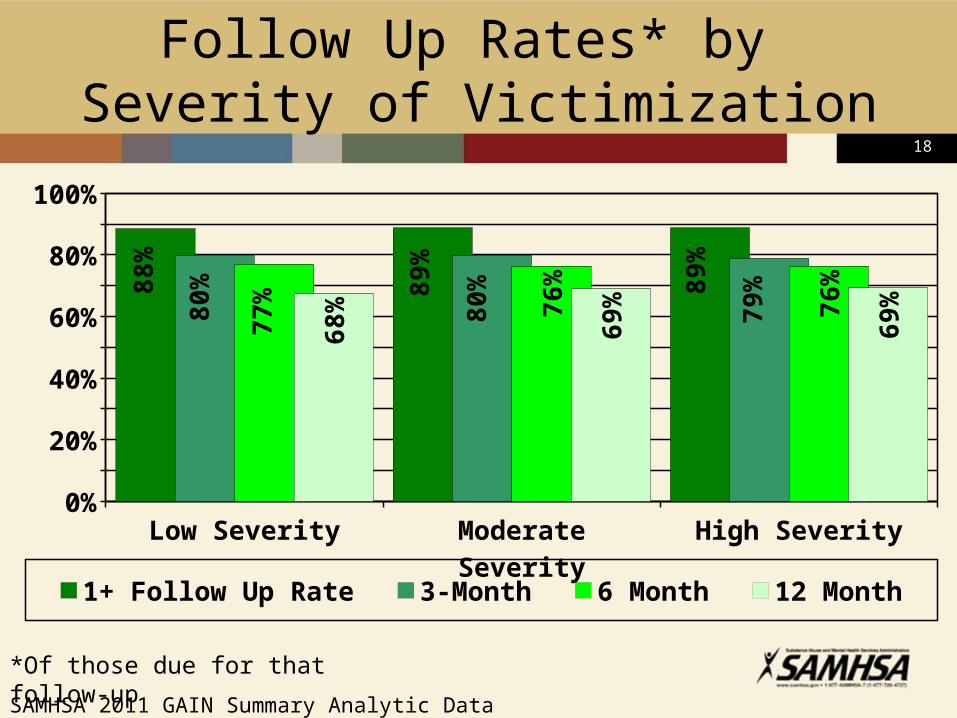
18
Follow Up Rates* by Severity of Victimization
Low Severity Moderate Severity High Severity0%
10%20%30%40%50%60%70%80%90%
100%
88
%
89
%
89
%
80
%
80
%
79
%
77
%
76
%
76
%
68
%
69
%
69
%
1+ Follow Up Rate 3-Month 6 Month 12 Month
*Of those due for that follow-up
SAMHSA 2011 GAIN Summary Analytic Data Set
19
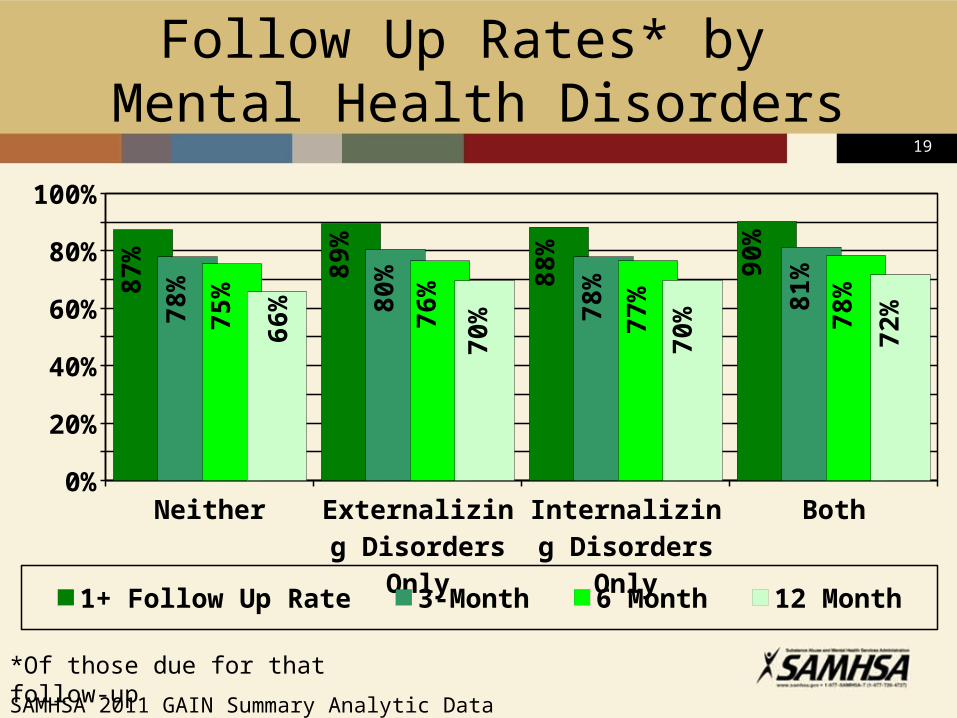
Follow Up Rates* by Mental Health Disorders
Neither Externalizing Disorders Only
Internalizing Disorders Only
Both0%
20%
40%
60%
80%
100%
87
%
89
%
88
%
90
%
78
%
80
%
78
%
81
%
75
%
76
%
77
%
78
%
66
%
70
%
70
%
72
%
1+ Follow Up Rate 3-Month 6 Month 12 Month
*Of those due for that follow-up
SAMHSA 2011 GAIN Summary Analytic Data Set
20
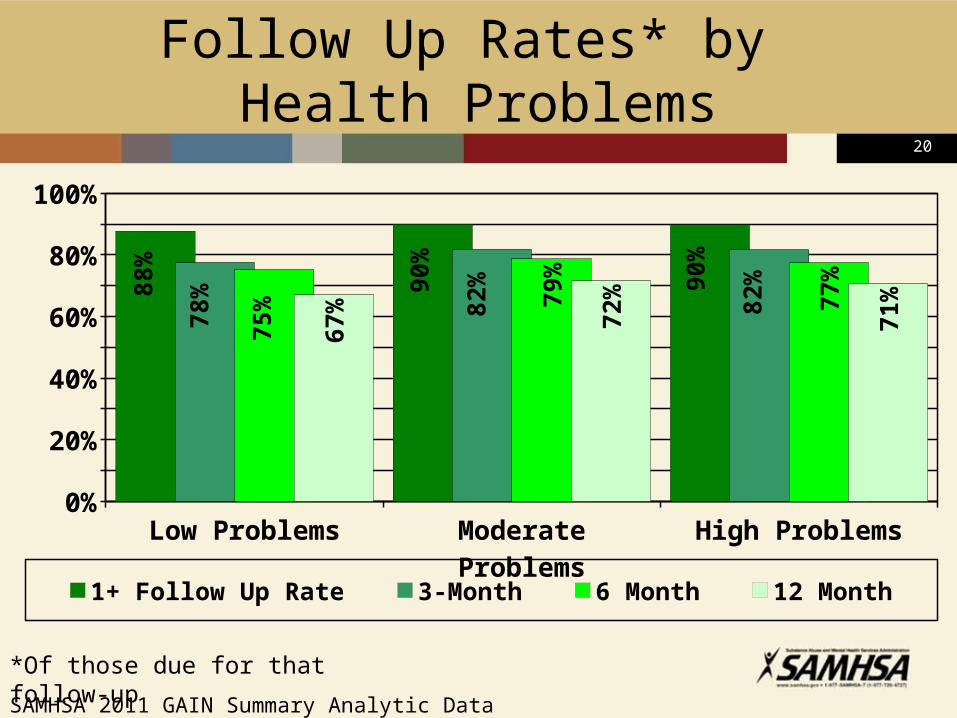
Follow Up Rates* by Health Problems
Low Problems Moderate Problems High Problems0%
10%20%30%40%50%60%70%80%90%
100%
88%
90%
90%
78%
82%
82%
75% 79
%
77%
67% 72
%
71%
1+ Follow Up Rate 3-Month 6 Month 12 Month
*Of those due for that follow-up
SAMHSA 2011 GAIN Summary Analytic Data Set

21
Follow Up Rates* by Crime and Violence
Low Crime Moderate Crime High Crime0%
10%20%30%40%50%60%70%80%90%
100%
88%
89%
89%
79%
81%
79%
76% 77
%
77%
68%
70%
69%
1+ Follow Up Rate 3-Month 6 Month 12 Month
*Of those due for that follow-up
SAMHSA 2011 GAIN Summary Analytic Data Set
22
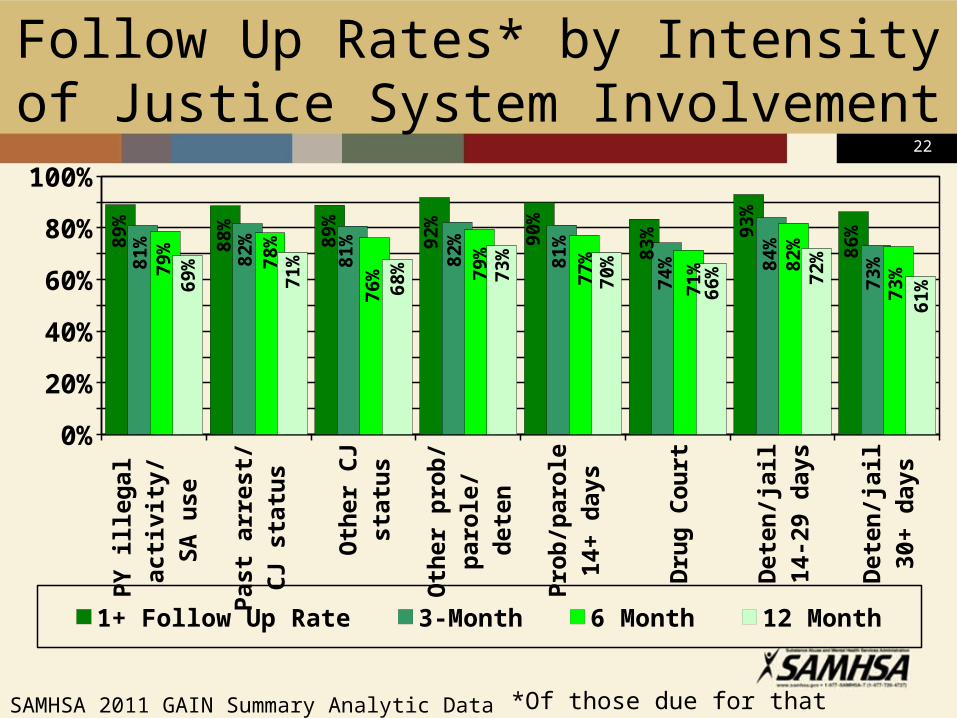
Follow Up Rates* by Intensity of Justice System Involvement
PY
ill
egal
ac
tivi
ty/
SA
use
Pas
t ar
rest
/C
J st
atu
s
Oth
er C
Jst
atu
s
Oth
er p
rob
/p
aro
le/
det
en
Pro
b/p
aro
le14
+ d
ays
Dru
g C
ou
rt
Det
en/j
ail
14-2
9 d
ays
Det
en/j
ail
30+
day
s
0%
20%
40%
60%
80%
100%
89
%
88
%
89
%
92
%
90
%
83
% 93
%
86
%
81
%
82
%
81
%
82
%
81
%
74
% 84
%
73
%79
%
78
%
76
% 79
%
77
%
71
% 82
%
73
%
69
%
71
%
68
% 73
%
70
%
66
% 72
%
61
%
1+ Follow Up Rate 3-Month 6 Month 12 Month
*Of those due for that follow-upSAMHSA 2011 GAIN Summary Analytic Data Set
23
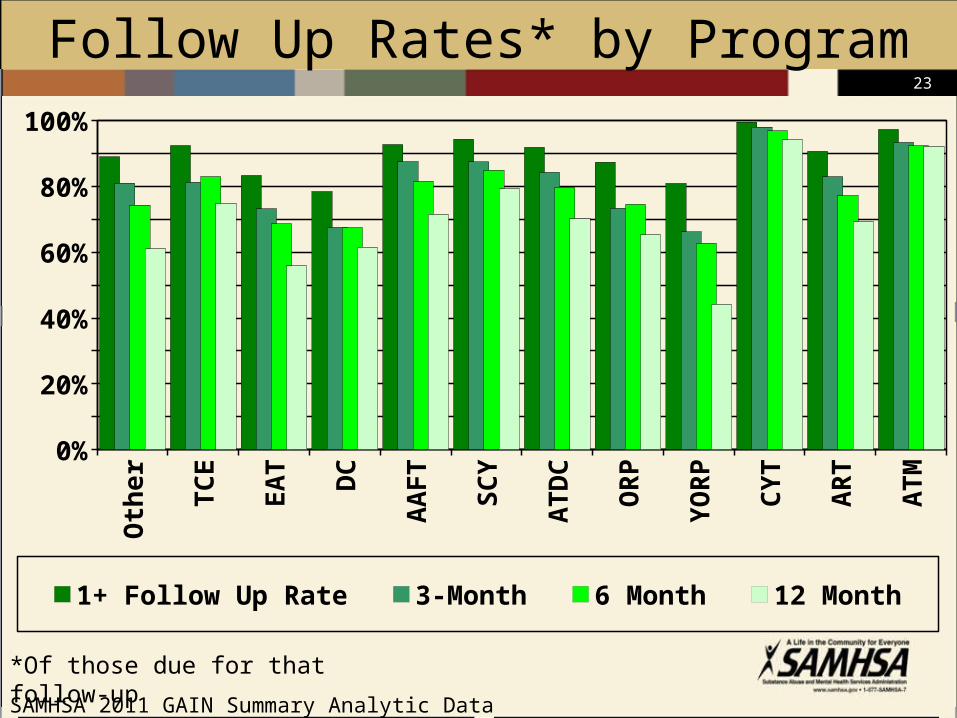
Follow Up Rates* by Program
Oth
er
TC
E
EA
T
DC
AA
FT
SC
Y
AT
DC
OR
P
YO
RP
CY
T
AR
T
AT
M
0%10%20%30%40%50%60%70%80%90%
100%
1+ Follow Up Rate 3-Month 6 Month 12 Month
*Of those due for that follow-up
SAMHSA 2011 GAIN Summary Analytic Data Set
24
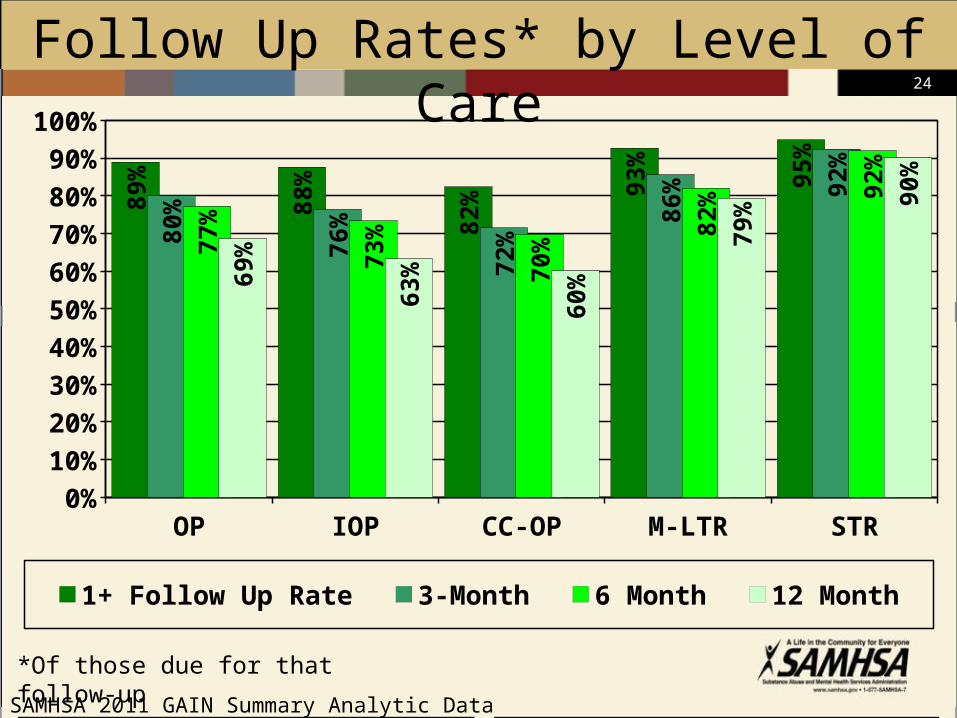
Follow Up Rates* by Level of Care
OP IOP CC-OP M-LTR STR0%
10%
20%
30%
40%
50%
60%
70%
80%
90%
100%89
%
88%
82% 93
%
95%
80%
76%
72%
86% 92
%
77%
73%
70%
82% 92
%
69%
63%
60%
79% 90
%
1+ Follow Up Rate 3-Month 6 Month 12 Month
*Of those due for that follow-up
SAMHSA 2011 GAIN Summary Analytic Data Set
25
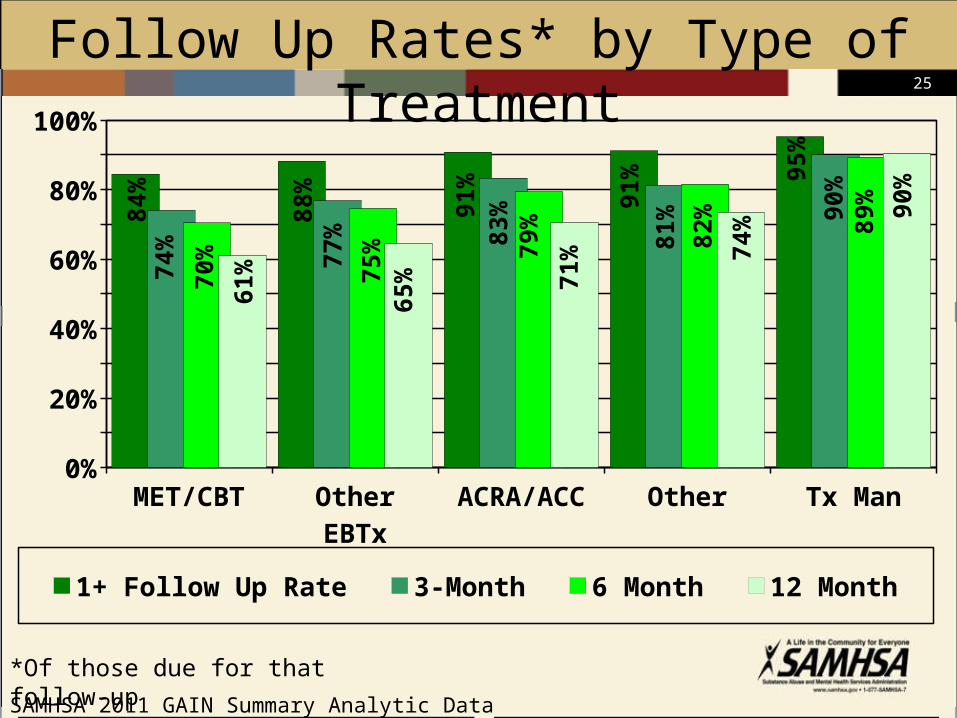
Follow Up Rates* by Type of Treatment
MET/CBT Other EBTx ACRA/ACC Other Tx Man0%
10%20%30%40%50%60%70%80%90%
100%84
%
88%
91%
91% 95
%
74%
77% 83
%
81% 90
%
70%
75% 79
%
82% 89
%
61%
65% 71
% 74%
90%
1+ Follow Up Rate 3-Month 6 Month 12 Month
*Of those due for that follow-up
SAMHSA 2011 GAIN Summary Analytic Data Set

26
Average Number of Follow Ups & Months to Last Wave by Gender
Male Female0
3
6
9
12
8.0 8.1
Average Months from Intake to Last Wave (n=25,498;
mean=8.0)
Male Female0
1
2
3
4
1.9 1.9
Average Number of Follow Ups (n=29,771; mean=1.9)
SAMHSA 2011 GAIN Summary Analytic Data Set

27
Average Number of Follow Ups & Months to Last Wave by Age
<15 15-17 18-25 26+0
3
6
9
12
8.2 8.1 7.7 7.6
Average Months from Intake to Last Wave (n=25,508;
mean=8.0)
<15 15-17 18-25 26+0
1
2
3
4
2.0 2.0 1.8 1.6
Average Number of Follow Ups (n=29,771; mean=1.9)
SAMHSA 2011 GAIN Summary Analytic Data Set

28
Average Number of Follow Ups & Months to Last Wave by Race
African Ameri-
can
His-panic
Other White Multi-Racial
0
3
6
9
12
7.8 7.9 8.7 8.2 7.8
Average Months from Intake to Last Wave (n=29,499; mean=8.0)
African Ameri-
can
His-panic
Other White Multi-Racial
0
1
2
3
4
1.8 1.8 2.0 2.0 1.8
Average Number of Follow Ups (n=29,767; mean=1.9)
SAMHSA 2011 GAIN Summary Analytic Data Set
29
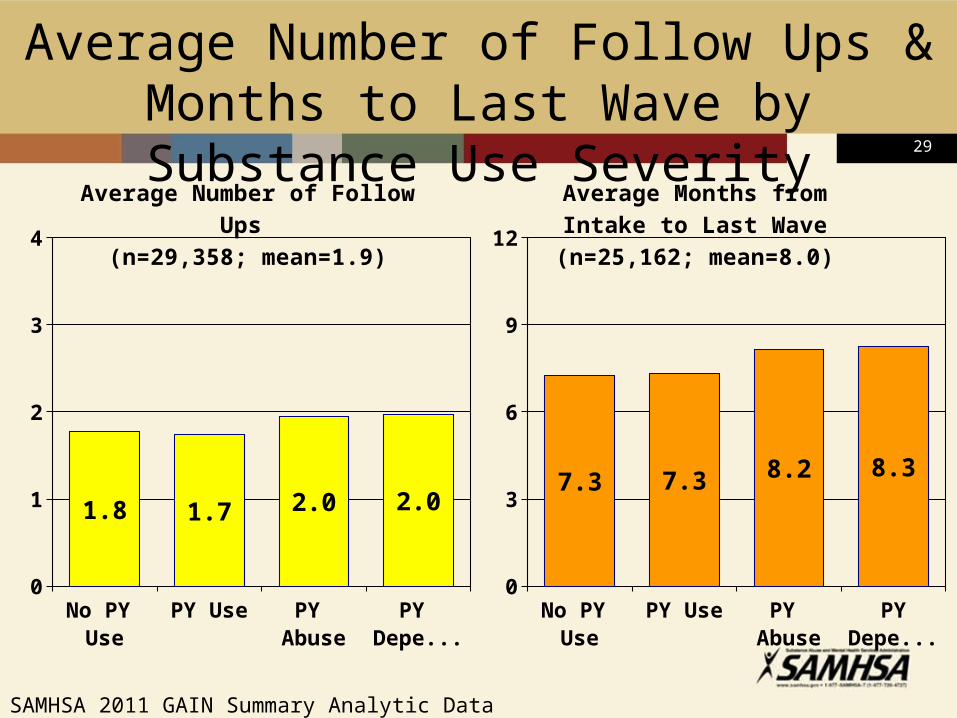
Average Number of Follow Ups & Months to Last Wave by Substance Use Severity
No PY Use
PY Use PY Abuse
PYDe-pen-
dence
0
3
6
9
12
7.3 7.3 8.2 8.3
Average Months from Intake to Last Wave (n=25,162; mean=8.0)
No PY Use
PY Use PY Abuse
PY De-pen-
dence
0
1
2
3
4
1.8 1.7 2.0 2.0
Average Number of Follow Ups (n=29,358; mean=1.9)
SAMHSA 2011 GAIN Summary Analytic Data Set
30
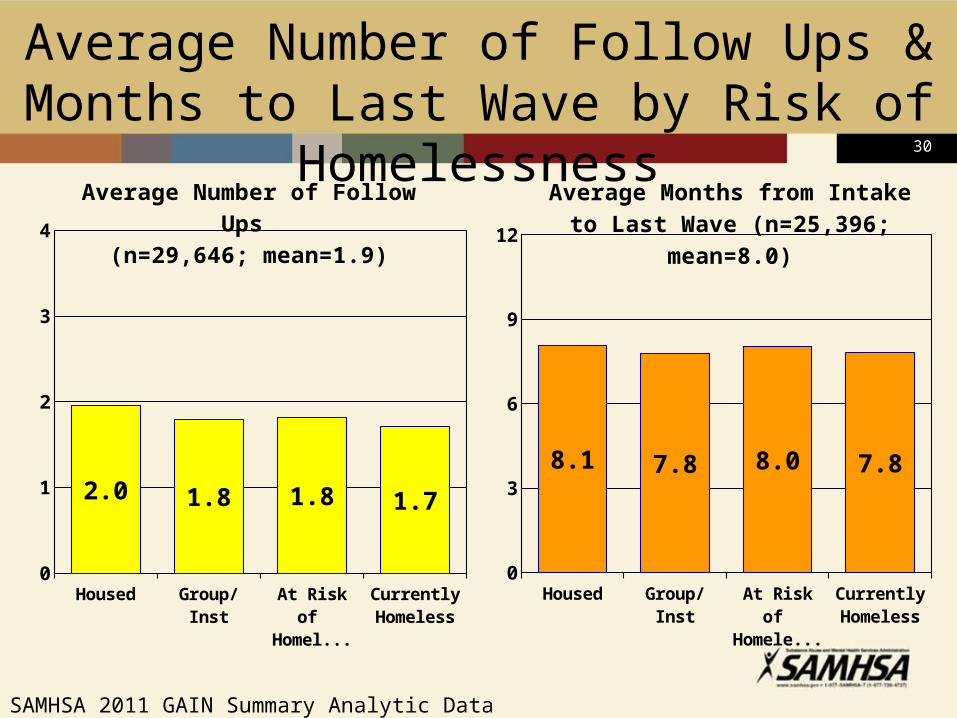
Average Number of Follow Ups & Months to Last Wave by Risk of Homelessness
Housed Group/Inst
At Risk of Homeless-
ness
Currently Homeless
0
3
6
9
12
8.1 7.8 8.0 7.8
Average Months from Intake to Last Wave (n=25,396; mean=8.0)
Housed Group/Inst At Risk of Homeless-
ness
Currently Homeless
0
1
2
3
4
2.0 1.8 1.8 1.7
Average Number of Follow Ups (n=29,646; mean=1.9)
SAMHSA 2011 GAIN Summary Analytic Data Set
31
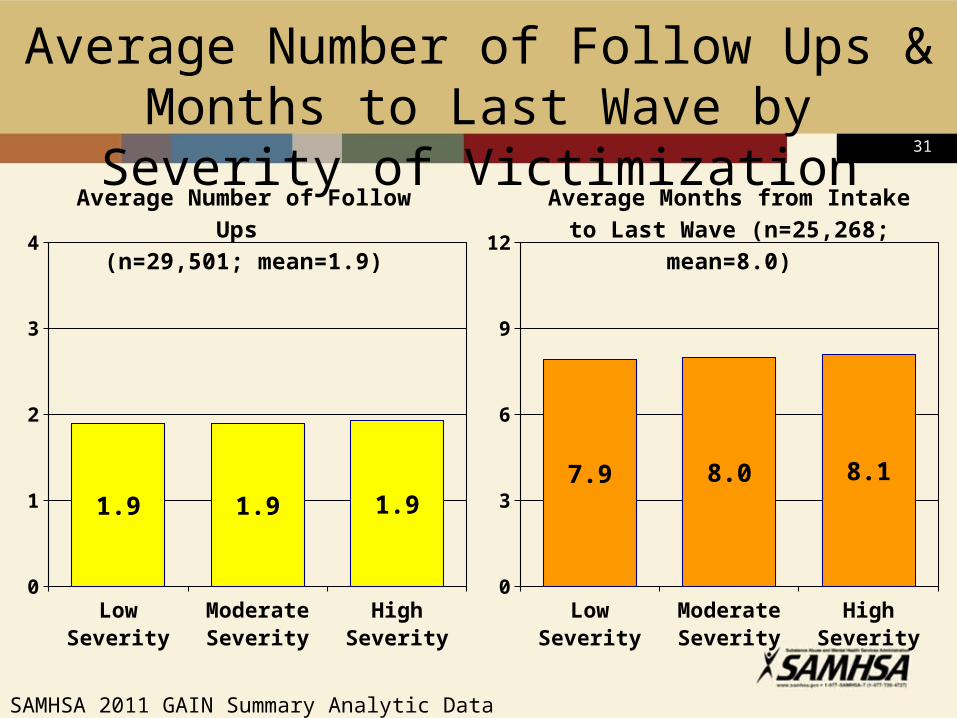
Average Number of Follow Ups & Months to Last Wave by Severity of Victimization
Low Severity Moderate Severity
High Sever-ity
0
3
6
9
12
7.9 8.0 8.1
Average Months from Intake to Last Wave (n=25,268; mean=8.0)
Low Severity Moderate Severity
High Sever-ity
0
1
2
3
4
1.9 1.9 1.9
Average Number of Follow Ups (n=29,501; mean=1.9)
SAMHSA 2011 GAIN Summary Analytic Data Set

32
Average Number of Follow Ups & Months to Last Wave by Mental Health Disorders
Neither Externaliz-ing
Disorders Only
Internalizing Disorders
Only
Both0
3
6
9
12
7.8 8.2 7.9 8.3
Average Months from Intake to Last Wave (n=25,452; mean=8.0)
Neither Externaliz-ing
Disorders Only
Internaliz-ing
Disorders Only
Both0
1
2
3
4
1.8 2.0 1.8 2.0
Average Number of Follow Ups (n=29,684; mean=1.9)
SAMHSA 2011 GAIN Summary Analytic Data Set
33
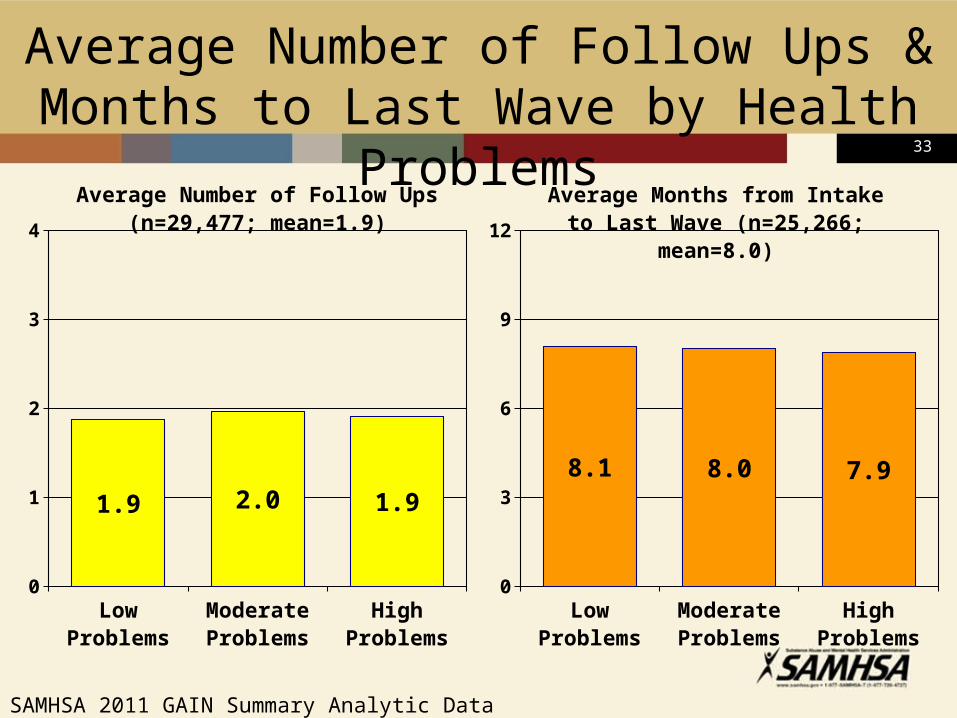
Average Number of Follow Ups & Months to Last Wave by Health Problems
Low Prob-lems
Moderate Problems
High Prob-lems
0
3
6
9
12
8.1 8.0 7.9
Average Months from Intake to Last Wave (n=25,266; mean=8.0)
Low Prob-lems
Moderate Problems
High Prob-lems
0
1
2
3
4
1.9 2.0 1.9
Average Number of Follow Ups (n=29,477; mean=1.9)
SAMHSA 2011 GAIN Summary Analytic Data Set

34
Average Number of Follow Ups & Months to Last Wave by Crime and Violence
Low Crime Moderate Crime
High Crime0
3
6
9
12
7.8 8.1 8.2
Average Months from Intake to Last Wave (n=25,468; mean=8.0)
Low Crime Moderate Crime
High Crime0
1
2
3
4
1.8 2.0 2.0
Average Number of Follow Ups (n=29,703; mean=1.9)
SAMHSA 2011 GAIN Summary Analytic Data Set
35
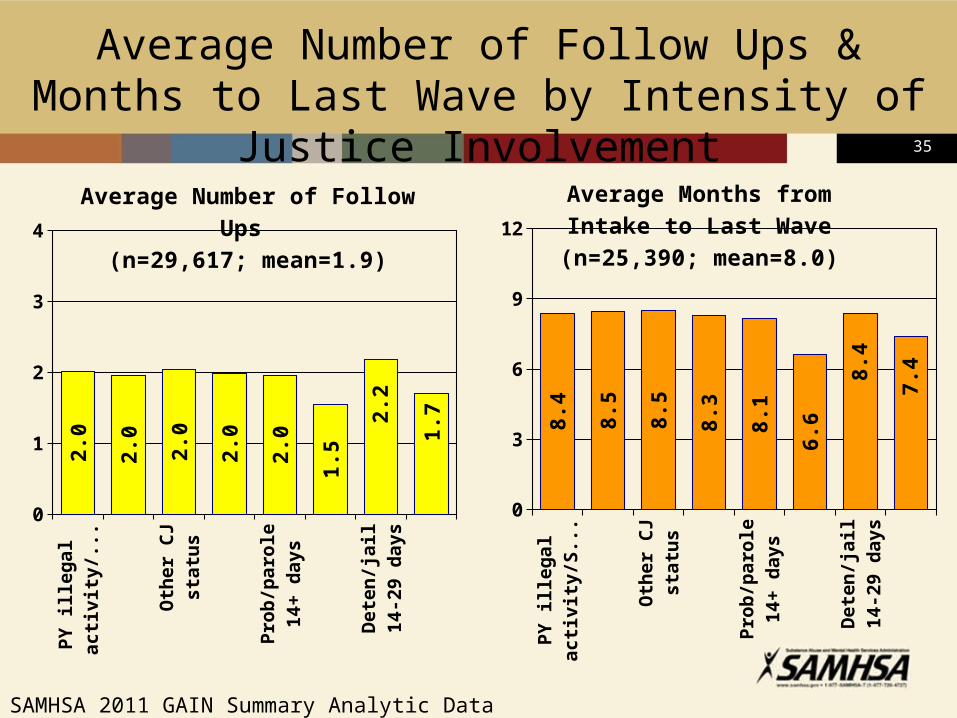
Average Number of Follow Ups & Months to Last Wave by Intensity of Justice Involvement
PY
ille
ga
la
cti
vit
y/S
A u
se
Pa
st
arr
es
t/C
J s
tatu
s
Oth
er
CJ
sta
tus
Oth
er
pro
b/
pa
role
/de
ten
Pro
b/p
aro
le1
4+
da
ys
Dru
g C
ou
rt
De
ten
/jail
14
-29
da
ys
De
ten
/jail
30
+ d
ay
s
0
3
6
9
12
8.4 8.5 8.5
8.3
8.1
6.6
8.4
7.4
Average Months from Intake to Last Wave (n=25,390; mean=8.0)
PY
ille
ga
l a
cti
vit
y/S
A u
se
Pa
st
arr
es
t/C
J s
tatu
s
Oth
er
CJ
sta
tus
Oth
er
pro
b/
pa
role
/de
ten
Pro
b/p
aro
le1
4+
da
ys
Dru
g C
ou
rt
De
ten
/jail
14
-29
da
ys
De
ten
/jail
30
+ d
ay
s
0
1
2
3
4
2.0
2.0 2.0
2.0
2.0
1.5
2.2
1.7
Average Number of Follow Ups (n=29,617; mean=1.9)
SAMHSA 2011 GAIN Summary Analytic Data Set

36
Average Number of Follow Ups & Months to Last Wave by Program
Oth
er
TC
E
EA
T
DC
AA
FT
SC
Y
AT
DC
OR
P
CY
T
AR
T
AT
M
0
3
6
9
12
7.1 7
.9 8.0
6.4 7
.7
10
.0 7.3
7.0
6.2
11
.5
8.4
11
.1
Average Months from Intake to Last Wave (n=25,508; mean=8.0)
Oth
er
TC
E
EA
T
DC
AA
FT
SC
Y
AT
DC
OR
P
CY
T
AR
T
AT
M
0
1
2
3
4
1.7 1.8
1.7
1.4
2.0
2.6
1.8
1.5
1.4
3.8
2.1
3.1
Average Number of Follow Ups (n=29,782; mean=1.9)
SAMHSA 2011 GAIN Summary Analytic Data Set
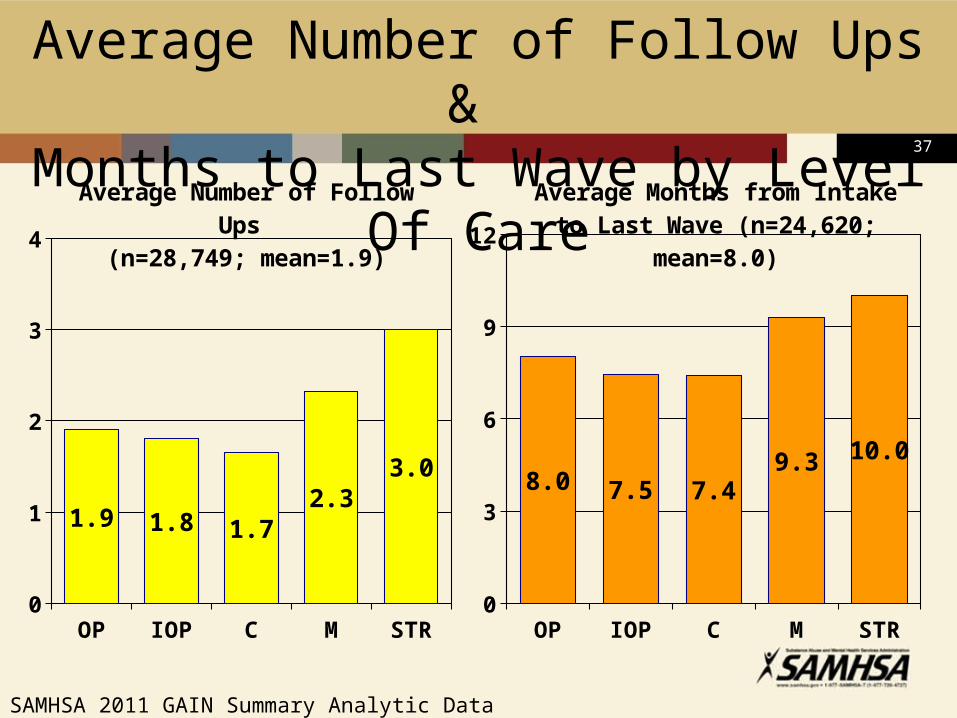
37
Average Number of Follow Ups & Months to Last Wave by Level Of Care
OP IOP CC-OP M-LTR STR0
3
6
9
12
8.0 7.5 7.49.3 10.0
Average Months from Intake to Last Wave (n=24,620; mean=8.0)
OP IOP CC-OP M-LTR STR0
1
2
3
4
1.9 1.8 1.72.3
3.0
Average Number of Follow Ups
(n=28,749; mean=1.9)
SAMHSA 2011 GAIN Summary Analytic Data Set

38
Average Number of Follow Ups & Months to Last Wave by Type of Treatment
MET/CBT
OtherEBTx
ACRA/ACC
Other Tx Man0
3
6
9
12
8.0 7.1 7.7 8.110.4
Average Months from Intake to Last Wave (n=24,700; mean=8.0)
MET/CBT
Other EBTx
ACRA/ACC
Other Tx Man0
1
2
3
4
1.8 1.7 1.9 1.8
3.0
Average Number of Follow Ups (n=28,880; mean=1.9)
SAMHSA 2011 GAIN Summary Analytic Data Set

39
GAIN Administration Fidelity Index (GAFI)
Average Denial/Misrepresenta-tion
(0/1/2-4)
Max Breaks (0-1/2/3-high)
Context Effects (0/1-2/3-high)
Inconsistencies (0-4/5-9/10-high)
Administration Duration (low-90/91-149/150-high)
Don't Know's in Change Scale Items (0/1/2-high)
Total GAINEdits (0-1/2-5/6-high)
GAFI* (0-69/70-79/80-100)
0% 20% 40% 60% 80% 100%
4%
5%
7%
11%
13%
14%
18%
32%33% 35%
HighFidelity
Moderate Fidelity
LowFidelity
SAMHSA 2011 GAIN Summary Analytic Data Set (n=19,482)
*Proportional sum of 7 items
40
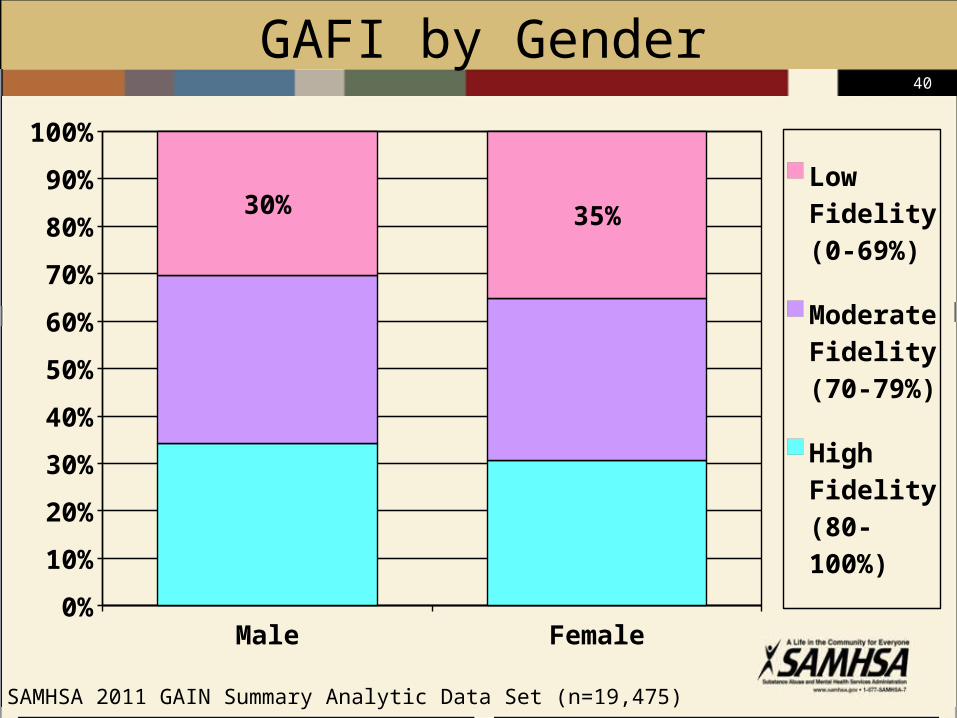
GAFI by Gender
Male Female0%
10%
20%
30%
40%
50%
60%
70%
80%
90%
100%
30% 35%Low Fidelity(0-69%)
Moderate Fidelity (70-79%)
High Fidelity (80-100%)
SAMHSA 2011 GAIN Summary Analytic Data Set (n=19,475)

41
GAFI by Age
<15 15-17 18-25 26+0%
10%
20%
30%
40%
50%
60%
70%
80%
90%
100%
32% 33% 30% 26% Low Fidelity(0-69%)
Moderate Fidelity (70-79%)
High Fidelity (80-100%)
SAMHSA 2011 GAIN Summary Analytic Data Set (n=19,482)
42
42
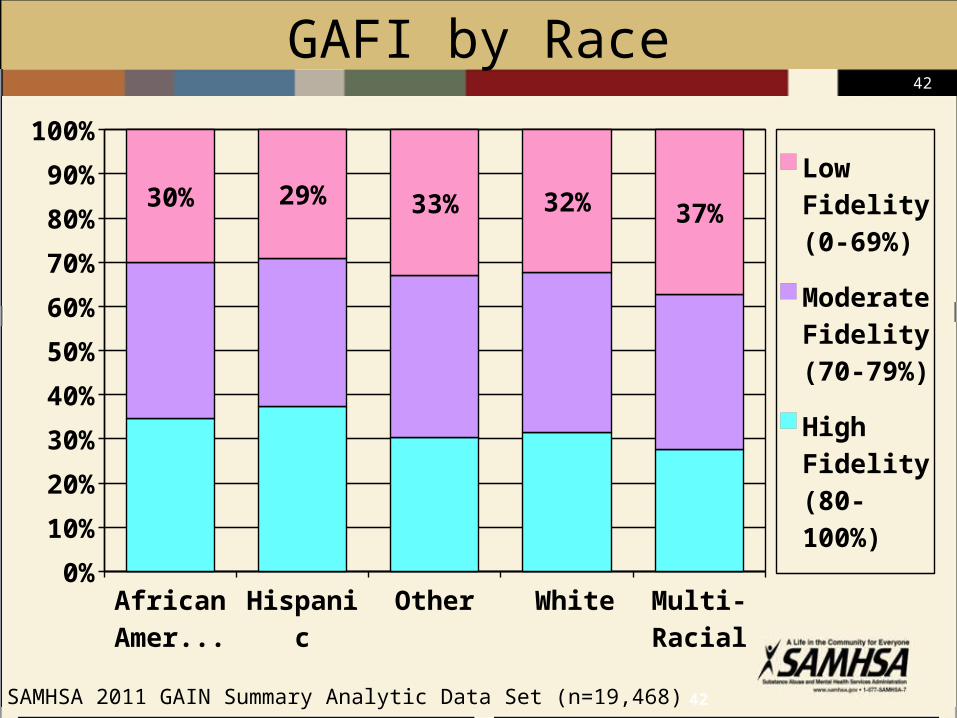
GAFI by Race
African American
Hispanic Other White Multi-Racial
0%
10%
20%
30%
40%
50%
60%
70%
80%
90%
100%
30% 29% 33% 32% 37%Low Fidelity(0-69%)
Moderate Fidelity (70-79%)
High Fidelity (80-100%)
SAMHSA 2011 GAIN Summary Analytic Data Set (n=19,468)
43
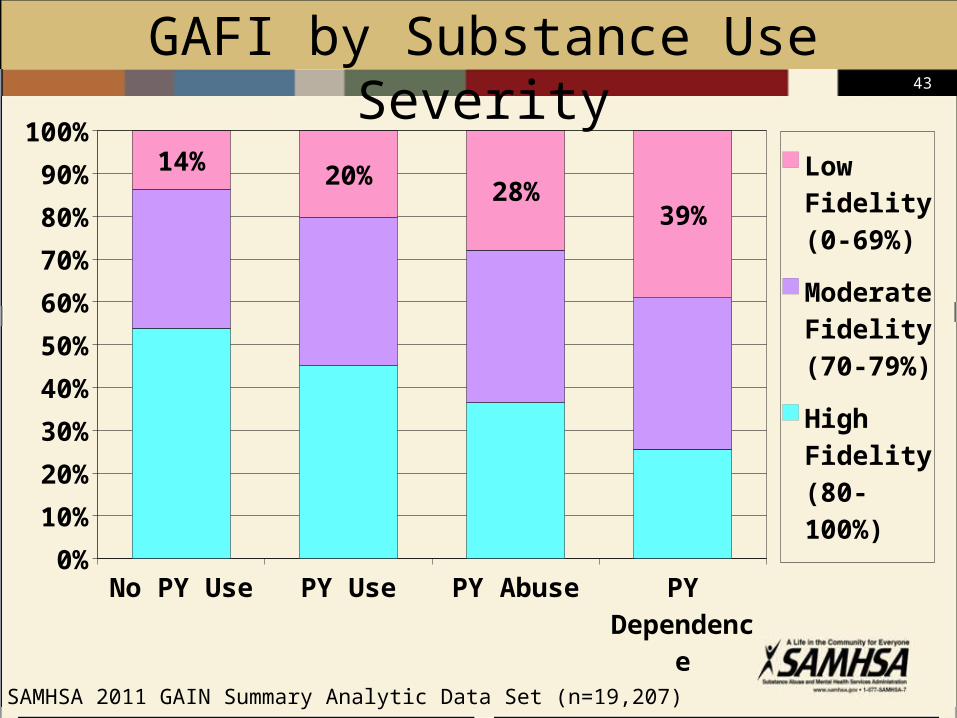
No PY Use PY Use PY Abuse PY De-pendence
0%
10%
20%
30%
40%
50%
60%
70%
80%
90%
100%14% 20%
28%39%
Low Fidelity(0-69%)
Moderate Fidelity (70-79%)
High Fidelity (80-100%)
GAFI by Substance Use Severity
SAMHSA 2011 GAIN Summary Analytic Data Set (n=19,207)

44
Housed Group/Inst
At Risk of Home-
lessness
Currently Homeless
0%
10%
20%
30%
40%
50%
60%
70%
80%
90%
100%
30% 28%40% 47%
Low Fidelity(0-69%)
Moderate Fidelity (70-79%)
High Fidelity (80-100%)
GAFI by Risk of Homelessness
SAMHSA 2011 GAIN Summary Analytic Data Set (n=19,362)

45
Low Severity Moderate Sever-ity
High Severity0%
10%
20%
30%
40%
50%
60%
70%
80%
90%
100%
24% 30%38%
Low Fidelity(0-69%)
Moderate Fidelity (70-79%)
High Fidelity (80-100%)
GAFI by Severity of Victimization
SAMHSA 2011 GAIN Summary Analytic Data Set (n=19,454)
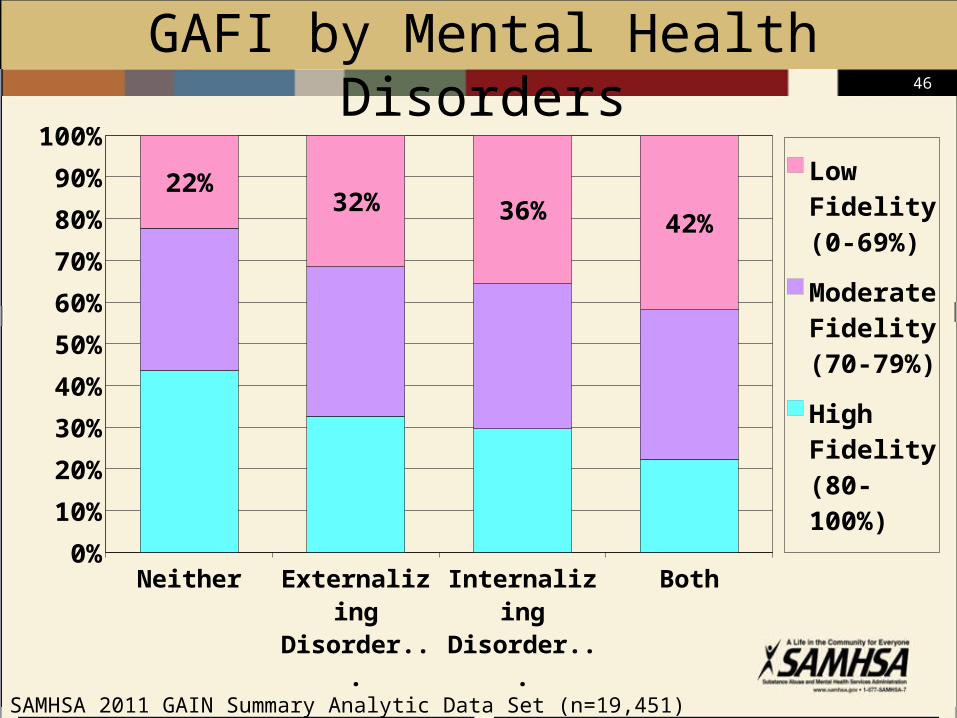
46
Neither Externalizing Disorders
Only
Internalizing Disorders
Only
Both0%
10%
20%
30%
40%
50%
60%
70%
80%
90%
100%
22%32% 36% 42%
Low Fidelity(0-69%)
Moderate Fidelity (70-79%)
High Fidelity (80-100%)
GAFI by Mental Health Disorders
SAMHSA 2011 GAIN Summary Analytic Data Set (n=19,451)

47
Low Problems Moderate Prob-lems
High Problems0%
10%
20%
30%
40%
50%
60%
70%
80%
90%
100%
32% 30% 35%Low Fidelity(0-69%)
Moderate Fidelity (70-79%)
High Fidelity (80-100%)
GAFI by Health Problems
SAMHSA 2011 GAIN Summary Analytic Data Set (n=19,289)
48
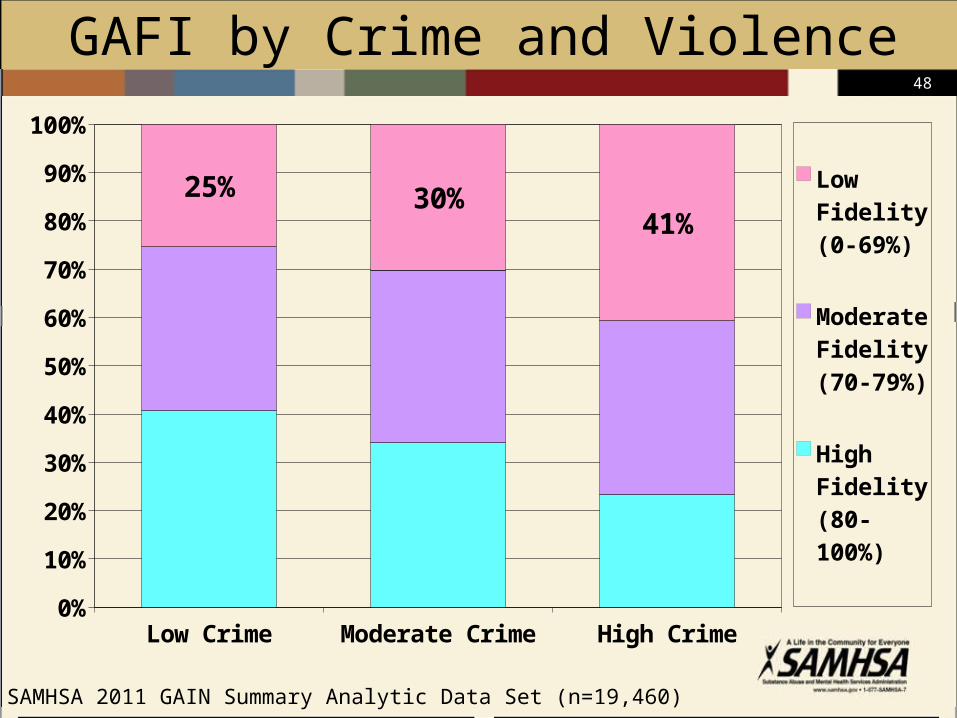
Low Crime Moderate Crime High Crime0%
10%
20%
30%
40%
50%
60%
70%
80%
90%
100%
25% 30%41%
Low Fidelity(0-69%)
Moderate Fidelity (70-79%)
High Fidelity (80-100%)
GAFI by Crime and Violence
SAMHSA 2011 GAIN Summary Analytic Data Set (n=19,460)
49
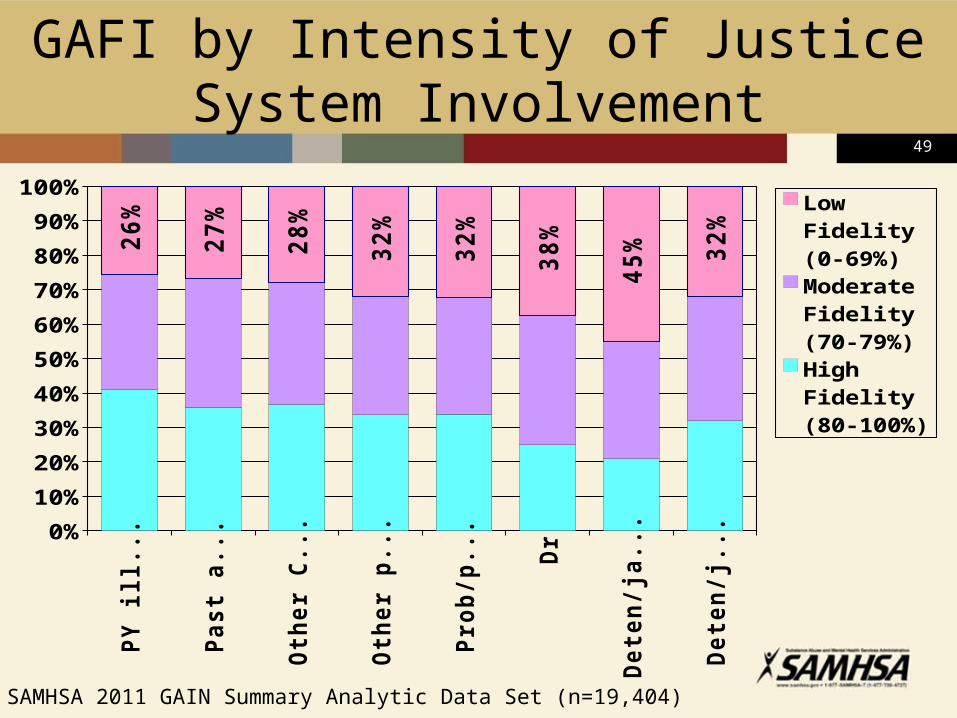
GAFI by Intensity of Justice System Involvement
PY
illeg
a...
Past
arr
es...
Oth
er
CJ...
Oth
er
pro
b...
Pro
b/p
ar.
..
Dru
Dete
n/jail...
Dete
n/jail...0%
10%
20%
30%
40%
50%
60%
70%
80%
90%
100%
26
%
27
%
28
%
32
%
32
%
38
%
45
% 32
%
Low Fidelity(0-69%)
Moderate Fidelity (70-79%)
High Fidelity (80-100%)
SAMHSA 2011 GAIN Summary Analytic Data Set (n=19,404)
50
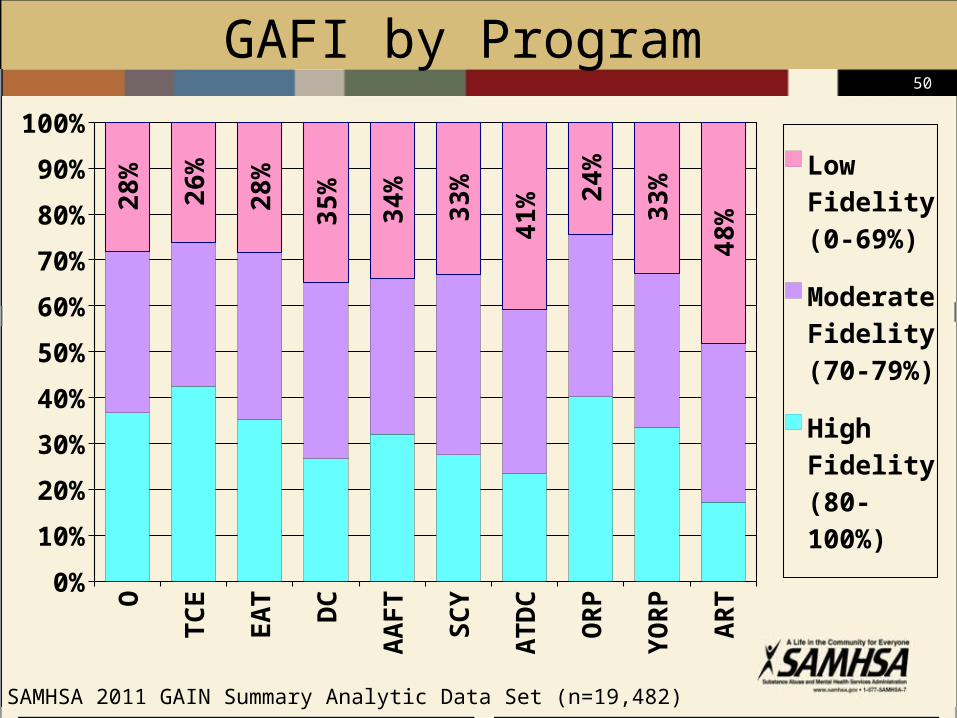
GAFI by Program
Oth
er
TC
E
EA
T
DC
AA
FT
SC
Y
AT
DC
OR
P
AR
T
0%
10%
20%
30%
40%
50%
60%
70%
80%
90%
100%28
%
26%
28%
35%
34%
33%
41% 24
%
33%
48%
Low Fidelity(0-69%)
Moderate Fidelity (70-79%)
High Fidelity (80-100%)
SAMHSA 2011 GAIN Summary Analytic Data Set (n=19,482)
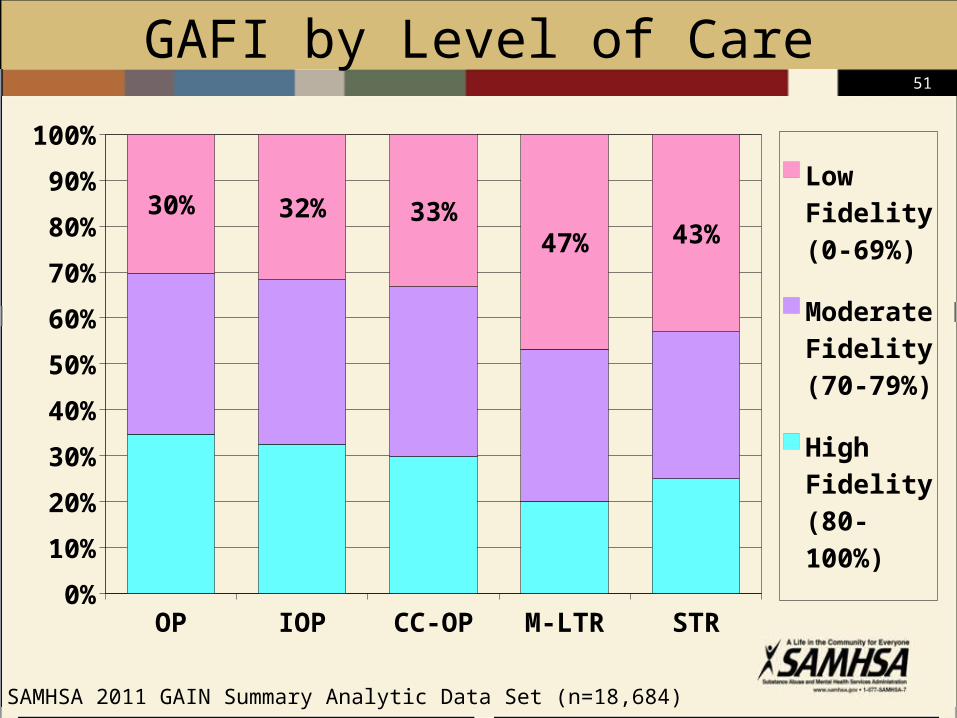
51
OP IOP CC-OP M-LTR STR0%
10%
20%
30%
40%
50%
60%
70%
80%
90%
100%
30% 32% 33%47% 43%
Low Fidelity(0-69%)
Moderate Fidelity (70-79%)
High Fidelity (80-100%)
GAFI by Level of Care
SAMHSA 2011 GAIN Summary Analytic Data Set (n=18,684)

52
MET/CBT
OtherEBTx
ACRA/ACC
Other Tx Man0%
10%
20%
30%
40%
50%
60%
70%
80%
90%
100%
29% 28% 34% 32% 37%Low Fidelity(0-69%)
Moderate Fidelity (70-79%)
High Fidelity (80-100%)
GAFI by Type of Treatment
SAMHSA 2011 GAIN Summary Analytic Data Set (n=18,907)

53
Summary of Psychometrics
Normative psychometric data and basic demographic information for GAIN scales and data sets (mean, N, standard deviation, Cronbach's alpha and intraclass correlations are available at http://www.gaincc.org/_data/files/Psychometrics_and_Publications/Resources/GAIN-I_Norms.xls– This file is broken up into separate worksheets for all records,
Adolescents (age 12-17), Young Adults (age 18-25), and Adults (age 18 and higher).
– Within each age category, demographics are presented first, followed by overall norms and ICC including across follow-up waves, then intake norms by each of the three main demographic categories of gender, race and age.

54
Accessing GAIN Data
Access to the de-identified pooled SAMHSA/CSAT data set is available through request.
For more information regarding how to request data and what you will need please visit http://gaincc.org/analysis
Summary of what is needed:– Data Sharing Agreement (see DSA Decision Tree at
http://www.gaincc.org/_data/files/Psychometrics_and_Publications/Analysis_Publication/DSA_Decision_Tree.pdf)
– A 1 - 3 page abstract (see Access training memo at http://www.gaincc.org/_data/files/Psychometrics_and_Publications/Analysis_Publication/Access.pdf)
For help please contact [email protected]