Chapter 17 Downline Impacts - Surface Transportation …file/Ch17_Downline_Impacts.pdfChapter 17...
30
Chapter 17 Downline Impacts 17.1 Introduction This chapter describes the impacts from potential increases in downline traffic that could result from construction and operation of each of the build alternatives. The sections that follow describe the downline impacts study area, the methods used to analyze the downline impacts, the affected environment, and the potential downline impacts. The regulations and guidance related to the downline impact analysis are summarized in Section 17.6, Applicable Regulations. Additional information describing the analyses is provided in Appendix V, Downline Analysis. The Surface Transportation Board (Board) regulations establish thresholds for environmental review of potential downline impacts (49 Code of Federal Regulations [C.F.R.] Part 1105.7(e)(11)(v)). The threshold for analysis of potential air quality impacts (C.F.R. Part 1105.7(e)(5)) is generally an increase of at least eight trains per day in areas designated as in attainment under the Clean Air Act, or three trains per day in nonattainment areas. The threshold for analysis of potential noise impacts (C.F.R. Part 1105.7(e)(6)) is generally an increase of at least eight trains per day combined with an incremental increase in noise levels, as measured by a day-night average noise level 1 (DNL), of 3 A-weighted decibels (dBA) or more and an increase to a noise level of 65 DNL or more. The thresholds for analysis of potential energy impacts (C.F.R. Part 1105.7(e)(4)) are specific to diversion of freight shipments from rail to motor carriage; therefore, they are not relevant in this case. Based on its experience applying the thresholds for air and noise, OEA has determined over time that these thresholds should also apply to freight rail safety and grade-crossing safety and delay. In summary, OEA determined that beginning in 2023 or later, project-related increases in rail traffic could exceed air and noise analysis thresholds on 15 downline segments 2 of the existing rail network between the proposed rail line and the Central and Upper-Midwestern United States, as described in Appendix C, Coal Production and Markets. On 14 of these segments, the high production scenario 3 could cause the estimated increase in rail traffic to exceed the analysis thresholds for all build alternatives. 4 On one segment, the medium production scenario could cause the estimated increase in rail traffic to exceed an analysis 1 Terms italicized at first use are defined in Chapter 25, Glossary. 2 To facilitate analysis of potential impacts along the existing rail lines over which trains from the proposed rail line could travel to reach the anticipated destinations, OEA divided these existing rail lines into segments with endpoints at selected junctions in the rail network. 3 The high, medium, and low production scenarios are described in Appendix C, Coal Production and Markets. The implications of these scenarios for rail traffic are summarized in Chapter 2, Section 2.3.3, Rail Traffic. 4 The northern alternatives are the Tongue River Alternatives, Colstrip Alternatives, Tongue River Road Alternatives, and Moon Creek Alternatives. The southern alternatives are the Decker Alternatives. Draft Environmental Impact Statement for the Tongue River Railroad 17-1 April 2015
Transcript of Chapter 17 Downline Impacts - Surface Transportation …file/Ch17_Downline_Impacts.pdfChapter 17...
Chapter 17 Downline Impacts
17.1 Introduction This chapter describes the impacts from potential increases in downline traffic that could result from construction and operation of each of the build alternatives. The sections that follow describe the downline impacts study area, the methods used to analyze the downline impacts, the affected environment, and the potential downline impacts. The regulations and guidance related to the downline impact analysis are summarized in Section 17.6, Applicable Regulations. Additional information describing the analyses is provided in Appendix V, Downline Analysis.
The Surface Transportation Board (Board) regulations establish thresholds for environmental review of potential downline impacts (49 Code of Federal Regulations [C.F.R.] Part 1105.7(e)(11)(v)). The threshold for analysis of potential air quality impacts (C.F.R. Part 1105.7(e)(5)) is generally an increase of at least eight trains per day in areas designated as in attainment under the Clean Air Act, or three trains per day in nonattainment areas. The threshold for analysis of potential noise impacts (C.F.R. Part 1105.7(e)(6)) is generally an increase of at least eight trains per day combined with an incremental increase in noise levels, as measured by a day-night average noise level1 (DNL), of 3 A-weighted decibels (dBA) or more and an increase to a noise level of 65 DNL or more. The thresholds for analysis of potential energy impacts (C.F.R. Part 1105.7(e)(4)) are specific to diversion of freight shipments from rail to motor carriage; therefore, they are not relevant in this case. Based on its experience applying the thresholds for air and noise, OEA has determined over time that these thresholds should also apply to freight rail safety and grade-crossing safety and delay.
In summary, OEA determined that beginning in 2023 or later, project-related increases in rail traffic could exceed air and noise analysis thresholds on 15 downline segments2 of the existing rail network between the proposed rail line and the Central and Upper-Midwestern United States, as described in Appendix C, Coal Production and Markets. On 14 of these segments, the high production scenario3 could cause the estimated increase in rail traffic to exceed the analysis thresholds for all build alternatives.4 On one segment, the medium production scenario could cause the estimated increase in rail traffic to exceed an analysis
1 Terms italicized at first use are defined in Chapter 25, Glossary. 2 To facilitate analysis of potential impacts along the existing rail lines over which trains from the proposed rail line could travel to reach the anticipated destinations, OEA divided these existing rail lines into segments with endpoints at selected junctions in the rail network. 3 The high, medium, and low production scenarios are described in Appendix C, Coal Production and Markets. The implications of these scenarios for rail traffic are summarized in Chapter 2, Section 2.3.3, Rail Traffic. 4 The northern alternatives are the Tongue River Alternatives, Colstrip Alternatives, Tongue River Road Alternatives, and Moon Creek Alternatives. The southern alternatives are the Decker Alternatives.
Draft Environmental Impact Statement for the Tongue River Railroad 17-1 April 2015
Chapter 17
Downline Impacts
threshold for the northern alternatives beginning in 2030, while the high production scenario could cause an increase in rail traffic that exceeds the thresholds for the southern alternatives.
Under coal production scenarios where some Tongue River coal could be exported through terminals on the Pacific Coast, the increase in rail traffic would not exceed the Board’s analysis thresholds as described in Appendix C, Coal Production and Markets, Chapter 8, Coal Production and Transportation Modeling Results, Section 8.4, Coal Distribution.
OEA then analyzed the potential impacts from project-related increased rail traffic on these downline rail segments. In OEA’s experience, the potential for adverse impacts from increased rail traffic on existing rail lines is usually limited to rail safety, air quality, noise and vibration, grade crossing delay and safety, and environmental justice. OEA found that under the high and medium production scenarios, construction and operation of any of the build alternatives could have the following downline impacts.
Freight rail safety. The maximum increase in estimated accident frequency on downline segments is 1.7 accidents per year on Segment 17 (Glendive, MT to Mandan, ND) for the northern alternatives. This assumes the maximum estimated increase in project-related rail traffic of 16 trains per day on Segment 17. For the southern alternatives, the maximum estimated increase in accident frequency, also on Segment 17, is 0.9 accident per year assuming a maximum estimated increase in project-relate rail traffic of 9 trains per day on the segment.
Grade-crossing delay. The maximum estimated increase in project-related rail traffic would have a nominal effect on the free flow of vehicle traffic across at-grade crossings. The level of service (LOS) designation would be reduced from A to B at one downline, at-grade crossing on Segment 6 (Spring Creek, MT to Dutch, WY) for the southern alternatives. No project-related reductions in LOS at at-grade crossing on the downline segments analyzed are estimated in association with the northern alternatives.
Grade-crossing safety. The estimated maximum decrease in the average predicted accident interval for grade crossings on downline segments would occur on Segment 6 (Spring Creek, MT to Dutch, WY), where the predicted interval between accidents would decrease from 110 years (No-Action Alternative) to 83 years (southern alternatives). The smallest interval would occur on Segment 12 (Crawford, NE, to Alliance, NE) where the predicted interval would decrease from 24 years (No-Action Alternative) to 23 years between accidents for the southern alternatives.
Air quality. Downline emissions would not lead to a violation of the National Ambient Air Quality Standards (NAAQS) in attainment areas or increase the severity of conditions in nonattainment areas.
Noise and vibration. Noise levels of 65 day-night average noise level (DNL) or greater with an increase of least 3 A-weighted decibels (dBA) resulting from the estimated maximum increase in project-related rail traffic would be experienced only at receptors on Segment 20 (Fargo, ND to Willmar, MN) on any of the northern alternatives in the
Draft Environmental Impact Statement for the Tongue River Railroad 17-2 April 2015
Chapter 17
Downline Impacts
year 2030.5 Vibration associated with operation of the estimated maximum increase in project-related rail traffic would not exceed applicable regulatory thresholds.
Environmental justice. Noise impacts for the estimated maximum increase in project-related rail traffic on Segment 20 for the northern alternatives, as described above, could result in high and adverse6 impacts on minority and low-income populations. Of the 2,934 affected receptors located along this segment, a disproportionate number are minority and low-income populations.
17.2 Downline Impacts Study Area The study area for potential rail-related downline impacts is defined as the mainline rail lines outside of the project area that could see an increase in train traffic coming from the proposed rail line. These trains would transport coal from the proposed Otter Creek Mine or potentially induced Poker Jim Creek–O’Dell Creek and Canyon Creek Mines to coal-fired power plants or coal export terminals within the United States and Canada (Figure 17-1). These rail lines are owned and operated by the BNSF Railway Company (BNSF) and Montana Rail Link. Potential air quality impacts near the U.S. coal-fired power plants are also included, except that potential changes in greenhouse gas emissions are addressed in Chapter 5, Greenhouse Gases and Climate Change, and Chapter 18, Cumulative Impacts.
5 The maximum increase in the number of trains per day is reached in year 2030 (15.8 trains per day) across Segment 20 in the high production scenario. See Appendix C, Coal Production and Markets. 6 The term high and adverse is used in Executive Order 12898, Federal Actions to Address Environmental Justice in Minority Populations and Low-Income Populations, which directs agencies to identify and consider “disproportionately high and adverse” human health or environmental effects of their actions on minority or low-income populations. When determining whether human health effects are disproportionately high and adverse, agencies are to consider, to the extent practicable, whether the health effects, which may be measured in risks and rates, are significant (as employed by NEPA), or above generally accepted norms. Draft Environmental Impact Statement for the Tongue River Railroad 17-3 April 2015

Chapter 17
Downline Impacts
Draft Environmental Impact Statement for the Tongue River Railroad 17-4 April 2015

Chapter 17
Downline Impacts
17.3 Analysis Methods OEA used the following methods and information sources to evaluate the potential downline impacts of construction and operation of the build alternatives.
OEA determined the destination of coal that would be transported by the proposed rail line. OEA used coal market modeling to determine that the majority of project-related coal traffic would travel to destinations in the Upper Midwest over BNSF rail lines (Appendix C, Coal Production and Markets).
OEA determined environmental analysis thresholds. The Board has specific rail traffic thresholds for environmental analysis (49 C.F.R. Part 1105.7). OEA compared the maximum estimated increase in trains per day for each coal production scenario to the threshold established in the Board’s regulations: generally an increase of eight trains per day except for air quality in nonattainment areas, for which the threshold is three trains per day. As noted previously, only the high production scenario could cause the estimated increase in rail traffic to exceed the analysis thresholds, except in one location where the medium production scenario could cause an exceedance of an analysis threshold.
OEA calculated downline rail traffic. OEA made the following calculations to evaluate the impacts of the proposed rail line on downline rail traffic.
Traffic from the proposed rail line. OEA calculated the number of trains per day under the low, medium, and high production scenarios for the northern and southern alternatives (Appendix C, Coal Production and Markets).
Downline increase in rail traffic attributed to proposed rail line. OEA estimated the maximum increase in rail traffic after considering displacement of existing coal train traffic.7 OEA subtracted the baseline (no action) rail traffic on each segment from the total estimated rail traffic after the proposed rail line would be operational.
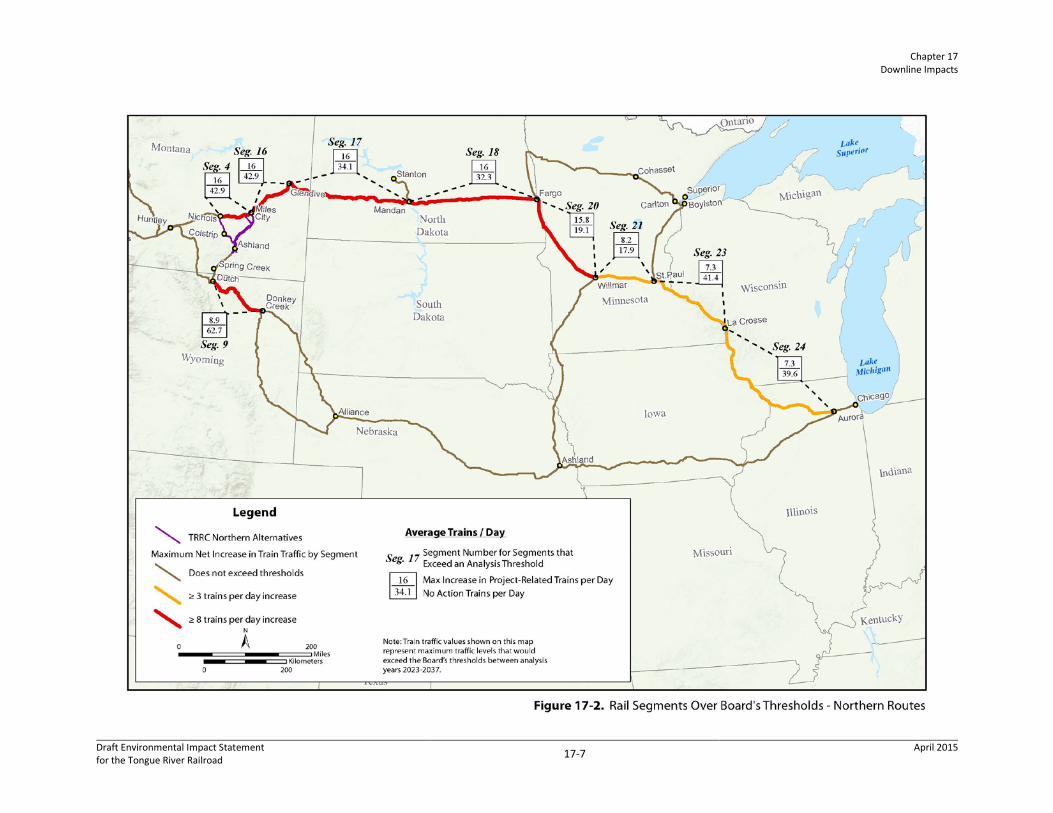
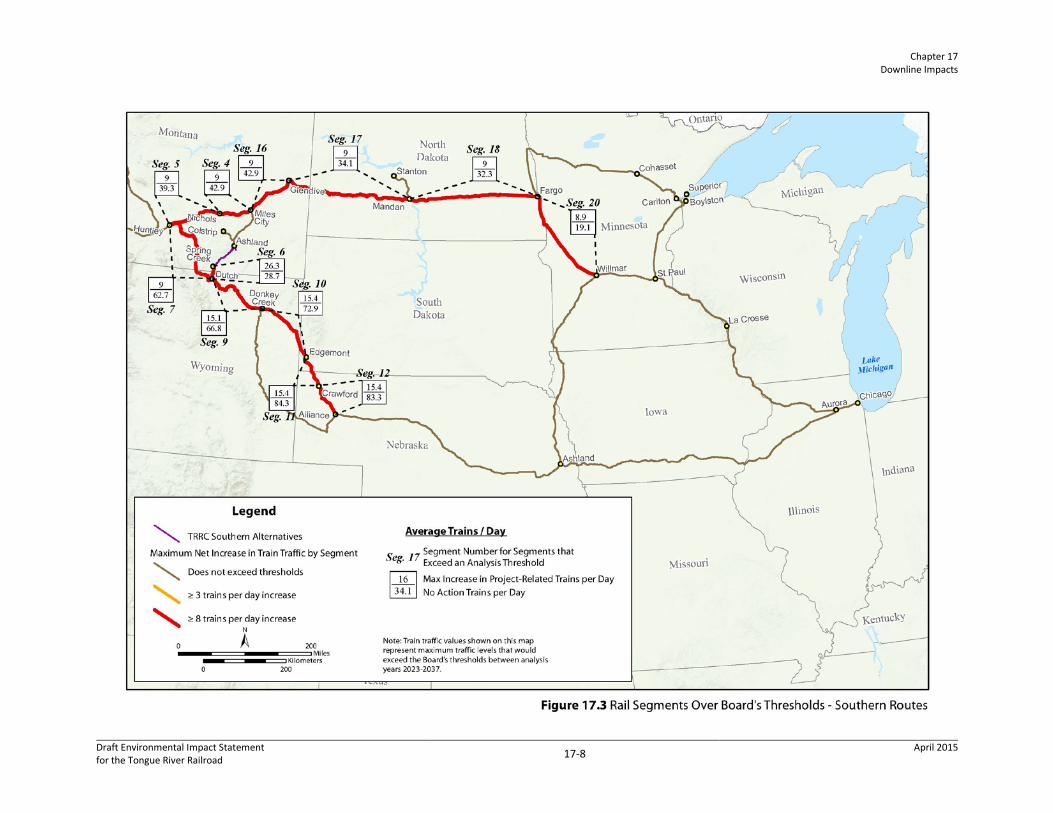
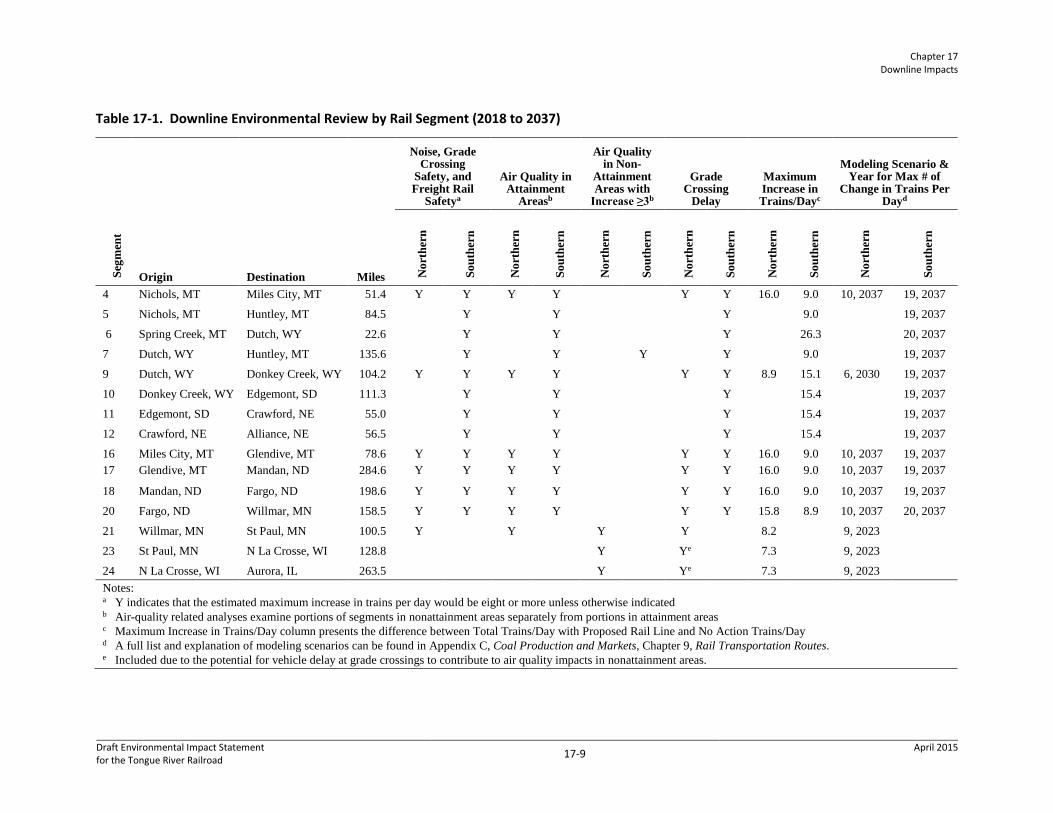
Downline rail traffic that would exceed thresholds. OEA identified the segments where the downline increase in rail traffic (after displacement) would meet or exceed the Board's thresholds for environmental review. OEA applied these thresholds to downline increases in rail traffic on all segments shown in Figure 17-1 and found that 15 out of 53 segments would exceed one or more of the thresholds under the associated maximum estimated increase in trains per day after displacement.8 Figures 17-2 and 17-3 illustrate the downline segments and indicate which segments would exceed a threshold. Table 17-1 provides information about the analyses for each
7 Rail traffic carrying Tongue River coal would add only incrementally to rail traffic carrying coal from other regions because it would displace some of the existing rail traffic (Appendix C, Coal Production and Markets). 8 See Appendix C, Coal Production and Markets, for additional information on all 53 segments (eastbound and westbound traffic).
Draft Environmental Impact Statement for the Tongue River Railroad 17-5 April 2015
Chapter 17
Downline Impacts
segment.9 As indicated, OEA carried these 15 segments forward for further analysis of potential downline impacts. On 14 of these segments, the estimated maximum increases in downline rail traffic would only exceed eight trains per day (or three per day in nonattainment areas) under the high production scenario. On one segment, the medium production scenario could cause the estimated increase in rail traffic to exceed eight trains per day for the northern alternatives beginning in 2030, while the high production scenario could cause an increase that would exceed eight trains per day for the southern alternatives.
Downline impact analysis. OEA then examined the impacts that could result from an increase of at least eight trains per day on existing rail lines. In OEA’s experience, the potential for adverse impacts to result from increased rail traffic on existing lines is usually limited to rail safety, air quality (including an increase of at least three trains per day in nonattainment areas), noise and vibration, grade-crossing delay and safety, and environmental justice.
9 Figure 17-2 provides an illustration of how OEA anticipates displacement of existing coal shipments would affect potential increases in rail traffic. Modeling indicates that, for the northern alternatives, some coal would travel to the west to Huntley, Montana, and then travel southeastward through Dutch and Donkey Creek, Montana, and on to Nebraska and beyond. The overall increase in traffic on this route between the project area and Dutch, Montana, would be small because Tongue River coal shipments going eastward from the project area across North Dakota would displace coal from the Spring Creek area that otherwise would have traveled the route from Dutch to Huntley and then eastward. The Tongue River coal headed eastward from Dutch, Montana, would result in an estimated maximum increase of more than eight trains per day for the high production scenario on the segment to Donkey Creek, but east of Donkey Creek the increase would be less because the Tongue River coal would displace shipments of other Powder River Basin coal headed east toward Chicago.
Draft Environmental Impact Statement for the Tongue River Railroad 17-6 April 2015
Chapter 17
Downline Impacts
Draft Environmental Impact Statement for the Tongue River Railroad 17-7 April 2015
Chapter 17
Downline Impacts
Draft Environmental Impact Statement for the Tongue River Railroad 17-8 April 2015
Chapter 17
Downline Impacts
Table 17-1. Downline Environmental Review by Rail Segment (2018 to 2037) Se
gmen
t
Origin Destination Miles
Noise, Grade Crossing
Safety, and Freight Rail
Safetya
Air Quality in Attainment
Areasb
Air Quality in Non-
Attainment Areas with
Increase ≥3b
Grade Crossing
Delay
Maximum Increase in Trains/Dayc
Modeling Scenario & Year for Max # of
Change in Trains Per Dayd
Nor
ther
n
Sout
hern
Nor
ther
n
Sout
hern
Nor
ther
n
Sout
hern
Nor
ther
n
Sout
hern
Nor
ther
n
Sout
hern
Nor
ther
n
Sout
hern
4 Nichols, MT Miles City, MT 51.4 Y Y Y Y
Y Y 16.0 9.0 10, 2037 19, 2037
5 Nichols, MT Huntley, MT 84.5
Y
Y
Y
9.0
19, 2037
6 Spring Creek, MT Dutch, WY 22.6
Y
Y
Y
26.3
20, 2037
7 Dutch, WY Huntley, MT 135.6
Y
Y
Y
Y
9.0
19, 2037
9 Dutch, WY Donkey Creek, WY 104.2 Y Y Y Y
Y Y 8.9 15.1 6, 2030 19, 2037
10 Donkey Creek, WY Edgemont, SD 111.3
Y
Y
Y
15.4
19, 2037
11 Edgemont, SD Crawford, NE 55.0
Y
Y
Y
15.4
19, 2037
12 Crawford, NE Alliance, NE 56.5
Y
Y
Y
15.4
19, 2037
16 Miles City, MT Glendive, MT 78.6 Y Y Y Y
Y Y 16.0 9.0 10, 2037 19, 2037 17 Glendive, MT Mandan, ND 284.6 Y Y Y Y
Y Y 16.0 9.0 10, 2037 19, 2037
18 Mandan, ND Fargo, ND 198.6 Y Y Y Y
Y Y 16.0 9.0 10, 2037 19, 2037
20 Fargo, ND Willmar, MN 158.5 Y Y Y Y
Y Y 15.8 8.9 10, 2037 20, 2037
21 Willmar, MN St Paul, MN 100.5 Y
Y
Y
Y
8.2
9, 2023 23 St Paul, MN N La Crosse, WI 128.8
Y
Ye
7.3
9, 2023
24 N La Crosse, WI Aurora, IL 263.5
Y
Ye
7.3
9, 2023 Notes:
a Y indicates that the estimated maximum increase in trains per day would be eight or more unless otherwise indicated b Air-quality related analyses examine portions of segments in nonattainment areas separately from portions in attainment areas c Maximum Increase in Trains/Day column presents the difference between Total Trains/Day with Proposed Rail Line and No Action Trains/Day d A full list and explanation of modeling scenarios can be found in Appendix C, Coal Production and Markets, Chapter 9, Rail Transportation Routes. e Included due to the potential for vehicle delay at grade crossings to contribute to air quality impacts in nonattainment areas.
Draft Environmental Impact Statement for the Tongue River Railroad 17-9 April 2015
Chapter 17
Downline Impacts
17.3.1 Transportation
17.3.1.1 Rail Operations and Rail Safety The analysis method for downline rail operations and safety impacts is the same as the method used for direct impact assessment in the project study area (Chapter 3, Section 3.2, Rail Operations and Rail Safety).
OEA evaluated impacts on downline segments where project-related rail traffic would result in an estimated maximum increase of eight or more trains per day. OEA determined that rail traffic would exceed this threshold on 13 downline segments (Table 17-1). For those segments, OEA estimated the maximum number of additional accidents per year based on the highest levels of projected traffic over 20 years.
17.3.1.2 Grade-Crossing Delay and Safety The analysis method for downline grade-crossing safety and delay impacts is the same as the method used for direct impact assessment in the study area (Chapter 3, Section 3.3, Grade-Crossing Delay, and Section 3.4, Grade-Crossing Safety).
OEA evaluated impacts on downline segments where the proposed rail line would result in an estimated increase of eight or more trains per day, or three or more trains per day in nonattainment areas. OEA determined that the maximum increase in rail traffic would exceed these levels on 15 downline segments (Table 17-1). OEA analyzed public grade crossings regardless of the current or projected annual average daily vehicle traffic levels.
17.3.2 Air Quality The analysis method for downline air quality impacts is the same as the method used for direct air quality impact assessment in the study area (Chapter 4, Air Quality and Chapter 6, Coal Dust).
Based on Board regulations (49 C.F.R. Part 1105.7), OEA evaluated air quality impacts for downline segments meeting the following conditions.
The proposed rail line would result in an estimated maximum increase of eight or more trains per day or at least a 100 percent increase in rail traffic (measured in annual gross ton-miles) in areas designated by the U.S Environmental Protection Agency (USEPA) as attainment or maintenance areas under the Clean Air Act for all criteria pollutants. OEA determined that rail traffic would exceed the threshold on 13 segments for attainment and maintenance areas. Portions of two of these 13 segments also pass through designated nonattainment areas.
The proposed rail line would result in an increase of three or more trains per day or a 50 percent increase in rail traffic (measured in annual gross ton-miles) in areas classified as
Draft Environmental Impact Statement for the Tongue River Railroad 17-10 April 2015

Chapter 17
Downline Impacts
Class I or nonattainment areas under the Clean Air Act. OEA determined that the estimated maximum increase in rail traffic would exceed the threshold on two segments that traverse nonattainment areas in addition to the two segments with an estimated increase in rail traffic of more than eight trains per day that also traverse nonattainment areas (Segments 7, 21, 23, and 24).
OEA calculated air quality impacts related to additional trains resulting from the proposed rail line as follows.
OEA added the emissions from new rail traffic in each downline segment.
OEA subtracted the emissions that would be removed if proposed rail line traffic would displace existing rail traffic.
OEA estimated the increase in emissions associated with increased vehicle delays at downline grade crossings.
OEA compared the net change in emissions to the USEPA general conformity de minimis thresholds for criteria pollutants.10
For segments with estimated emissions increases that would exceed the general conformity de minimis thresholds, OEA compared the increases to the sum of county-level emissions for the counties through which each segment passes. This indicates how much rail traffic on that segment contributes to regional emissions.
17.3.3 Noise and Vibration The analysis method for downline noise and vibration impacts is the same as the method used for direct noise and vibration impact assessment in the study area (Chapter 7, Noise and Vibration, Section 7.3, Analysis Methods).
Based on Board regulations (49 C.F.R. Part 1105.7), OEA evaluated noise and vibration impacts on downline segments where project-related rail traffic would result in an estimated maximum increase of eight or more trains per day or at least a 100 percent increase in rail traffic (measured in annual gross ton-miles). OEA determined that the estimated increases in rail traffic would exceed this threshold on 13 segments (Table 17-1). On 12 of these segments, the estimated maximum increases in downline rail traffic would only exceed eight trains per day (or three per day in nonattainment areas) under the high production scenario. On one segment, the medium production
10 The General Conformity Rule defines the characteristics of a conforming project and requires that a federal agency must be able to exercise continuing program control over the operation of the project to be subject to the rule (40 C.F.R. Part 93.153). The Board generally does not exercise continuing program control over rail operations and would not exercise such control over the operation of the proposed rail line. Accordingly, the proposed rail line is not subject to the General Conformity Rule. The rule nevertheless provides useful indicators for assessing potential impacts on air quality. The rule establishes emissions thresholds, or de minimis levels, for use in evaluating the conformity of a project. For a project that is subject to conformity, if the net emission increases due to a project would be less than these thresholds, the project is presumed to conform, and no further conformity evaluation is necessary. For a project that is not subject to conformity, these thresholds can be used to indicate whether further analysis may be warranted.
Draft Environmental Impact Statement for the Tongue River Railroad 17-11 April 2015

Chapter 17
Downline Impacts
scenario could cause the estimated increase in rail traffic to exceed eight trains per day for the northern alternatives beginning in 2030, while the high production scenario could cause an increase that would exceed eight trains per day for the southern alternatives. For these segments, OEA identified noise-sensitive receptors (e.g., schools, libraries, hospitals, residences, and nursing homes) that would experience an increase in noise level of 3 dBA or more and an increase to a noise level of 65 DNL or more.
17.3.4 Environmental Justice The analysis method for downline environmental justice impacts is the same as the method used for direct environmental justice impact assessment in the study area (Chapter 16, Environmental Justice, Section 16.3, Analysis Methods). Based on the results of the downline analyses, OEA evaluated potential environmental justice impacts from increased noise on downline segments where project-related rail traffic would result in an estimated maximum increase of eight or more trains per day or at least a 100 percent increase in rail traffic (measured in annual gross ton-miles) (49 C.F.R. Part 1105.7). OEA determined that the estimated increases in downline rail traffic would exceed this threshold on 13 segments. On 12 of these segments, the estimated maximum increases in downline rail traffic would only exceed eight trains per day (or three per day in nonattainment areas) under the high production scenario. On one segment, the medium production scenario could cause the estimated increase in rail traffic to exceed eight trains per day for the northern alternatives beginning in 2030, while the high production scenario could cause an increase that would exceed eight trains per day for the southern alternatives. Furthermore, Segment 20 (Fargo, ND and Wilmar, MN) would have potentially high and adverse environmental justice impacts resulting from increased noise levels (Section 17.5.3, Noise and Vibration).
OEA determined that potentially high and adverse downline environmental justice impacts would be limited to communities in the nine counties traversed by Segment 20: Clay, Grant, Kandiyohi, Stevens, Swift, Traverse, Pope, and Wilkin Counties, Minnesota; and Richland County, North Dakota. In these counties, OEA determined that the percentage presence of a minority group was higher than its presence in the nine-county area or the respective state. OEA identified low-income populations as those localities where the percentage presence of households or individuals living below the poverty threshold was higher than that in the nine-county area or the respective state.
OEA used data from the U.S. Census Bureau at the smallest geographic unit available to characterize the presence of minority and low-income populations along Segment 20 (U.S. Census Bureau 2010). The geographic unit was the census block11 from the 2010 decennial census for minority data, and census block groups from the 2008 to 2012 5-year American Community Survey for the low-income data (U.S. Census Bureau 2012).
11 Census blocks are typically individual city blocks bounded by streets in urban areas, but can consist of many square miles in rural areas. Census block groups are collections of census blocks. Both are subdivisions of census tracts, areas that are relatively homogenous in population characteristics with an average of about 4,000 inhabitants.
Draft Environmental Impact Statement for the Tongue River Railroad 17-12 April 2015
Chapter 17
Downline Impacts
OEA excluded from the analysis those noise sensitive receptors12 that were located in census blocks within the nine counties for which the 2010 decennial census showed there was no population.
Of the 2,934 sensitive receptors on Segment 20 that would experience adverse noise levels (Section 17.5.3, Noise and Vibration), OEA identified the number that were in minority or low-income populations.
17.4 Affected Environment New rail traffic associated with operation of the proposed rail line would result in changes to rail traffic on existing downline routes (Figures 17-1, 17-2, and 17-3). See Chapter 9, Rail Transportation Routes, of Appendix C, Coal Production and Markets, for more information about the downline routes and existing traffic levels.
17.5 Downline Impacts by Resource OEA analyzed downline transportation, air quality, noise, and environmental justice impacts.
17.5.1 Transportation 17.5.1.1 Rail Operations and Rail Safety
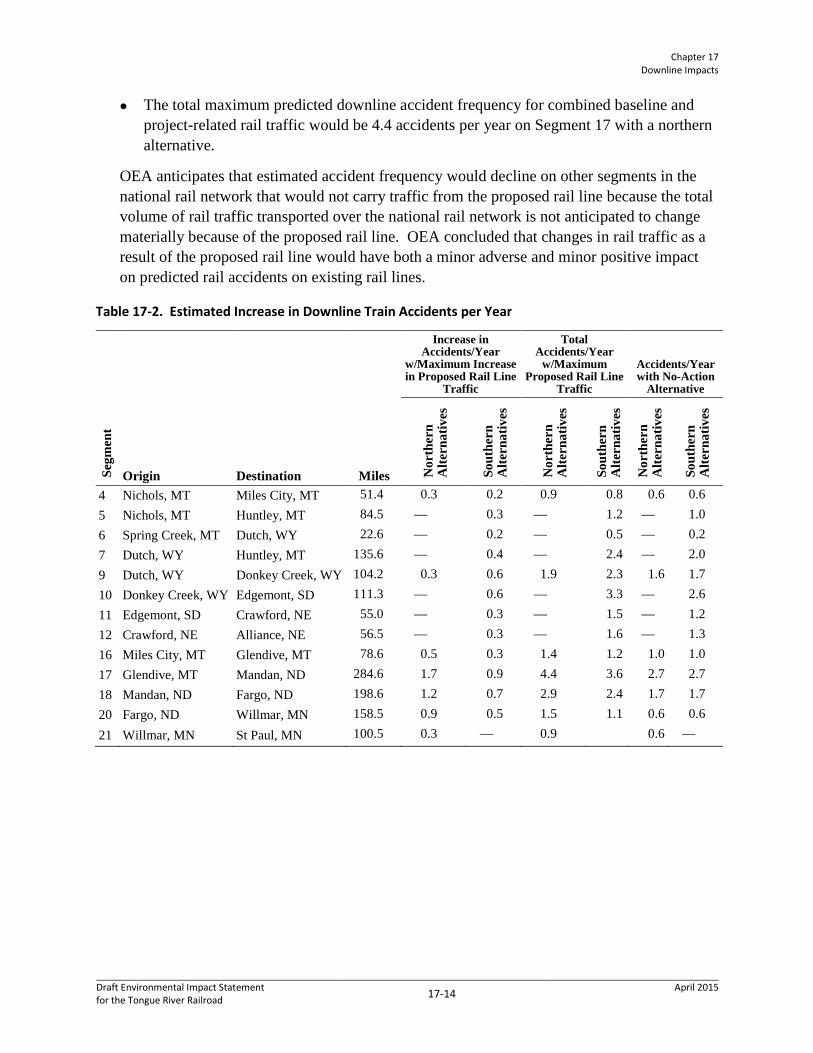
As discussed in Appendix C, Coal Production and Markets, OEA anticipates that the proposed rail line would result in changes to the routes and quantity of rail traffic on existing rail lines, but would result in comparatively small changes in the distances over which the trains travel. As a result, increased rail traffic on some existing rail segments would be accompanied by decreases in traffic on other segments across the rail network. Predicted accident frequency on segments with decreased traffic would be less than under the No- Action Alternative (which would maintain baseline volumes and routes). The proposed rail line would result in little overall change in predicted accident frequency, although the locations of predicted accidents would be redistributed. OEA estimated the rail safety impacts from the estimated maximum increase in project-related rail traffic for 13 downline rail segments with a maximum estimated increase of eight trains per day (Table 17-1) as follows (Table 17-2). See Appendix V, Downline Analysis, for additional information.
The estimated accident frequency for the No-Action Alternative would range from 0.2 to 2.7 accidents per year.
The maximum increase in predicted downline accident frequency, attributed to increased project-related rail traffic, would be 1.7 accidents per year on Segment 17 (the longest segment analyzed) with a northern alternative.
12 As described in Chapter 7, Noise and Vibration, OEA identified potential noise sensitive receptors, including residences, using aerial photography, so it was possible to identify noise sensitive receptors (structures) in areas that census data indicates have no population.
Draft Environmental Impact Statement for the Tongue River Railroad 17-13 April 2015
Chapter 17
Downline Impacts
The total maximum predicted downline accident frequency for combined baseline and project-related rail traffic would be 4.4 accidents per year on Segment 17 with a northern alternative.
OEA anticipates that estimated accident frequency would decline on other segments in the national rail network that would not carry traffic from the proposed rail line because the total volume of rail traffic transported over the national rail network is not anticipated to change materially because of the proposed rail line. OEA concluded that changes in rail traffic as a result of the proposed rail line would have both a minor adverse and minor positive impact on predicted rail accidents on existing rail lines.
Table 17-2. Estimated Increase in Downline Train Accidents per Year
Segm
ent
Origin Destination Miles
Increase in Accidents/Year
w/Maximum Increase in Proposed Rail Line
Traffic
Total Accidents/Year
w/Maximum Proposed Rail Line
Traffic
Accidents/Year with No-Action
Alternative
Nor
ther
n A
ltern
ativ
es
Sout
hern
A
ltern
ativ
es
Nor
ther
n A
ltern
ativ
es
Sout
hern
A
ltern
ativ
es
Nor
ther
n A
ltern
ativ
es
Sout
hern
A
ltern
ativ
es
4 Nichols, MT Miles City, MT 51.4 0.3 0.2 0.9 0.8 0.6 0.6 5 Nichols, MT Huntley, MT 84.5 — 0.3 — 1.2 — 1.0 6 Spring Creek, MT Dutch, WY 22.6 — 0.2 — 0.5 — 0.2 7 Dutch, WY Huntley, MT 135.6 — 0.4 — 2.4 — 2.0 9 Dutch, WY Donkey Creek, WY 104.2 0.3 0.6 1.9 2.3 1.6 1.7 10 Donkey Creek, WY Edgemont, SD 111.3 — 0.6 — 3.3 — 2.6 11 Edgemont, SD Crawford, NE 55.0 — 0.3 — 1.5 — 1.2 12 Crawford, NE Alliance, NE 56.5 — 0.3 — 1.6 — 1.3 16 Miles City, MT Glendive, MT 78.6 0.5 0.3 1.4 1.2 1.0 1.0 17 Glendive, MT Mandan, ND 284.6 1.7 0.9 4.4 3.6 2.7 2.7 18 Mandan, ND Fargo, ND 198.6 1.2 0.7 2.9 2.4 1.7 1.7 20 Fargo, ND Willmar, MN 158.5 0.9 0.5 1.5 1.1 0.6 0.6 21 Willmar, MN St Paul, MN 100.5 0.3 — 0.9 0.6 —
Draft Environmental Impact Statement for the Tongue River Railroad 17-14 April 2015
Chapter 17
Downline Impacts
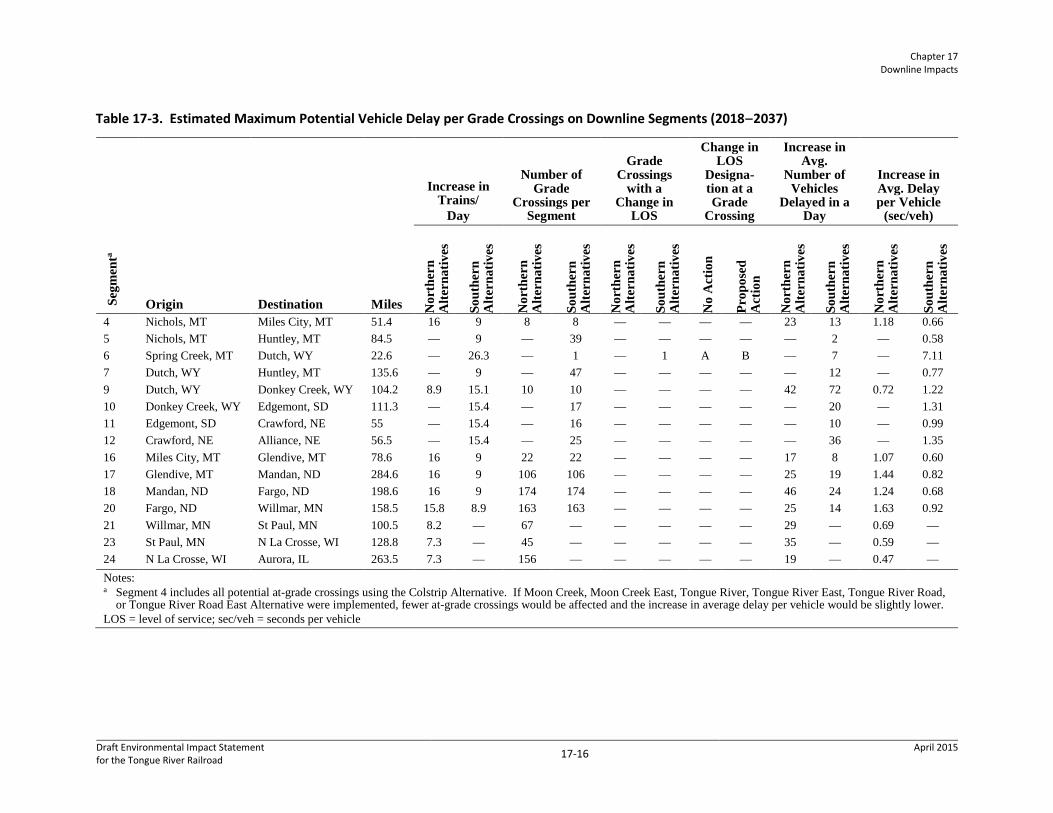
17.5.1.2 Grade-Crossing Delay OEA estimated the grade crossing delay impacts from the estimated maximum increase in project-related rail traffic for 15 downline rail segments (Table 17-1) as follows (Table 17-3). See Appendix V, Downline Analysis, for additional information. The maximum increase in average vehicle delay time per crossing, attributed to rail
traffic associated with the proposed rail line, would range from 0.58 to 7.11 seconds per vehicle. The largest increase in average delay per vehicle would occur at the crossing of Taylor Road on Segment 6 with a southern alternative.
The LOS designation of one crossing would decrease from A to B on Segment 6 with a southern alternative. The LOS designation is a measure of traffic flow, with A being completely free flowing. Traffic is also considered to be free flowing at level B, although less so than at level A.
OEA concluded that these impacts would be negligible except on Segment 6 where there would be a minor adverse impact.
Draft Environmental Impact Statement for the Tongue River Railroad 17-15 April 2015
Chapter 17
Downline Impacts
Table 17-3. Estimated Maximum Potential Vehicle Delay per Grade Crossings on Downline Segments (2018‒2037) Se
gmen
ta Origin Destination Miles
Increase in Trains/
Day
Number of Grade
Crossings per Segment
Grade Crossings
with a Change in
LOS
Change in LOS
Designa-tion at a Grade
Crossing
Increase in Avg.
Number of Vehicles
Delayed in a Day
Increase in Avg. Delay per Vehicle
(sec/veh)
Nor
ther
n A
ltern
ativ
es
Sout
hern
A
ltern
ativ
es
Nor
ther
n A
ltern
ativ
es
Sout
hern
A
ltern
ativ
es
Nor
ther
n A
ltern
ativ
es
Sout
hern
A
ltern
ativ
es
No
Act
ion
Prop
osed
A
ctio
n
Nor
ther
n A
ltern
ativ
es
Sout
hern
A
ltern
ativ
es
Nor
ther
n A
ltern
ativ
es
Sout
hern
A
ltern
ativ
es
4 Nichols, MT Miles City, MT 51.4 16 9 8 8 — — — — 23 13 1.18 0.66 5 Nichols, MT Huntley, MT 84.5 — 9 — 39 — — — — — 2 — 0.58 6 Spring Creek, MT Dutch, WY 22.6 — 26.3 — 1 — 1 A B — 7 — 7.11 7 Dutch, WY Huntley, MT 135.6 — 9 — 47 — — — — — 12 — 0.77 9 Dutch, WY Donkey Creek, WY 104.2 8.9 15.1 10 10 — — — — 42 72 0.72 1.22 10 Donkey Creek, WY Edgemont, SD 111.3 — 15.4 — 17 — — — — — 20 — 1.31 11 Edgemont, SD Crawford, NE 55 — 15.4 — 16 — — — — — 10 — 0.99 12 Crawford, NE Alliance, NE 56.5 — 15.4 — 25 — — — — — 36 — 1.35 16 Miles City, MT Glendive, MT 78.6 16 9 22 22 — — — — 17 8 1.07 0.60 17 Glendive, MT Mandan, ND 284.6 16 9 106 106 — — — — 25 19 1.44 0.82 18 Mandan, ND Fargo, ND 198.6 16 9 174 174 — — — — 46 24 1.24 0.68 20 Fargo, ND Willmar, MN 158.5 15.8 8.9 163 163 — — — — 25 14 1.63 0.92 21 Willmar, MN St Paul, MN 100.5 8.2 — 67 — — — — — 29 — 0.69 — 23 St Paul, MN N La Crosse, WI 128.8 7.3 — 45 — — — — — 35 — 0.59 — 24 N La Crosse, WI Aurora, IL 263.5 7.3 — 156 — — — — — 19 — 0.47 — Notes: a Segment 4 includes all potential at-grade crossings using the Colstrip Alternative. If Moon Creek, Moon Creek East, Tongue River, Tongue River East, Tongue River Road,
or Tongue River Road East Alternative were implemented, fewer at-grade crossings would be affected and the increase in average delay per vehicle would be slightly lower. LOS = level of service; sec/veh = seconds per vehicle
Draft Environmental Impact Statement for the Tongue River Railroad 17-16 April 2015
Chapter 17
Downline Impacts
17.5.1.3 Grade-Crossing Safety OEA estimated the grade-crossing impacts from the estimated maximum increase in project-related rail traffic of at least eight trains per day for 13 downline rail segments (Table 17-1) as follows (Table 17-4). See Appendix V, Downline Analysis, for additional information.
The largest decrease in estimated average predicted accident interval would be 27 years on Segment 6 where the predicted interval between accidents would be reduced from 110 years (No-Action Alternative) to 83 years (southern alternatives).
The lowest estimated average predicted interval between accidents of 24 years on Segment 12 under the No-Action Alternative would decrease to 23 years (southern alternatives).
OEA anticipates that predicted accident intervals would decline on other segments in the national rail network that would not carry traffic from the proposed rail line because the total volume of rail traffic transported over the national rail network would not change materially as a result of the proposed rail line. OEA concluded that the changes in rail traffic as a result of the proposed rail line would have both a minor adverse and minor positive overall impact on predicted accident intervals for grade crossings on existing rail lines.
Draft Environmental Impact Statement for the Tongue River Railroad 17-17 April 2015

Chapter 17
Downline Impacts
Table 17-4. Average Predicted Grade-Crossing Accident Frequencies and Intervals by Segment for the High Coal Production Scenarioa (2018‒2037)
Segm
ent
Ori
gin
Des
tinat
ion
Mile
s
Maximum Increase in Trains/Dayc
Number of At-Grade Crossings
No-Action Alternative With Proposed Rail line
Predicted Annual Accident
Frequencies
Predicted Intervals Between
Accidents (years)
Predicted Annual Accident
Frequencies
Predicted Intervals Between
Accidents (years)
Nor
ther
n A
ltern
ativ
es
Sout
hern
A
ltern
ativ
es
Nor
ther
n
Alte
rnat
ives
Sout
hern
A
ltern
ativ
es
Nor
ther
n
Alte
rnat
ives
Sout
hern
A
ltern
ativ
es
Nor
ther
n
Alte
rnat
ives
Sout
hern
A
ltern
ativ
es
Nor
ther
n
Alte
rnat
ives
Sout
hern
A
ltern
ativ
es
Nor
ther
n
Alte
rnat
ives
Sout
hern
A
ltern
ativ
es
4b Nichols, MT Miles City, MT 51.4 16 9 8 8 0.01889 0.01889 53 53 0.02176 0.02060 46 49 5 Nichols, MT Huntley, MT 84.5 9 39 0.01708 59 0.02137 47 6 Spring Creek, MT Dutch, WY 22.6 26.3 1 0.00909 110 0.01201 83 7 Dutch, WY Huntley, MT 135.6 9 47 0.02389 42 0.02558 39 9 Dutch, WY Donkey Creek, WY 104.2 8.9 15.1 10 10 0.03083 0.03083 32 32 0.03212 0.03376 31 30 10 Donkey Creek, WY Edgemont, SD 111.3 15.4 17 0.03239 31 0.03460 29 11 Edgemont, SD Crawford, NE 55.0 15.4 16 0.03929 25 0.04005 25 12 Crawford, NE Alliance, NE 56.5 15.4 25 0.04116 24 0.04394 23 16 Miles City, MT Glendive, MT 78.6 16 9 22 22 0.01555 0.01555 64 64 0.01790 0.01692 56 59 17 Glendive, MT Mandan, ND 284.6 16 9 106 106 0.01678 0.01678 60 60 0.01989 0.01862 50 54 18 Mandan, ND Fargo, ND 198.6 16 9 174 174 0.021447 0.021447 47 47 0.02573 0.02412 39 41 20 Fargo, ND Willmar, MN 158.5 15.8 8.9 163 163 0.014368 0.014368 70 70 0.02197 0.02092 46 48 21 Willmar, MN St Paul, MN 100.5 8.2 67 0.021489 47 0.02493 40 Notes: a Accident frequency values are averaged across all grade crossings for each segment. Results for segment 9 for the northern alternatives are based on the medium coal
production scenario. b Segment 4, northern alternatives, varies by build alternative because the build alternatives meet the BNSF mainline at various points. The data presented is for Colstrip
Alternative, which incorporates all potential at-grade crossings. c Includes Industrial Demand; see Appendix C, Coal Production and Markets
Draft Environmental Impact Statement for the Tongue River Railroad 17-18 April 2015

Chapter 17
Downline Impacts
17.5.2 Air Quality Most of the downline segments are located in areas that USEPA has designated as in attainment with the NAAQS. Parts of a few segments are in nonattainment areas or are in maintenance status (Table 17-1).
17.5.2.1 Locomotive Exhaust Emissions OEA estimated the impacts of locomotive exhaust emissions for the 15 downline segments (Table 17-1) based on the estimated increase in project-related rail traffic for the high production scenario.
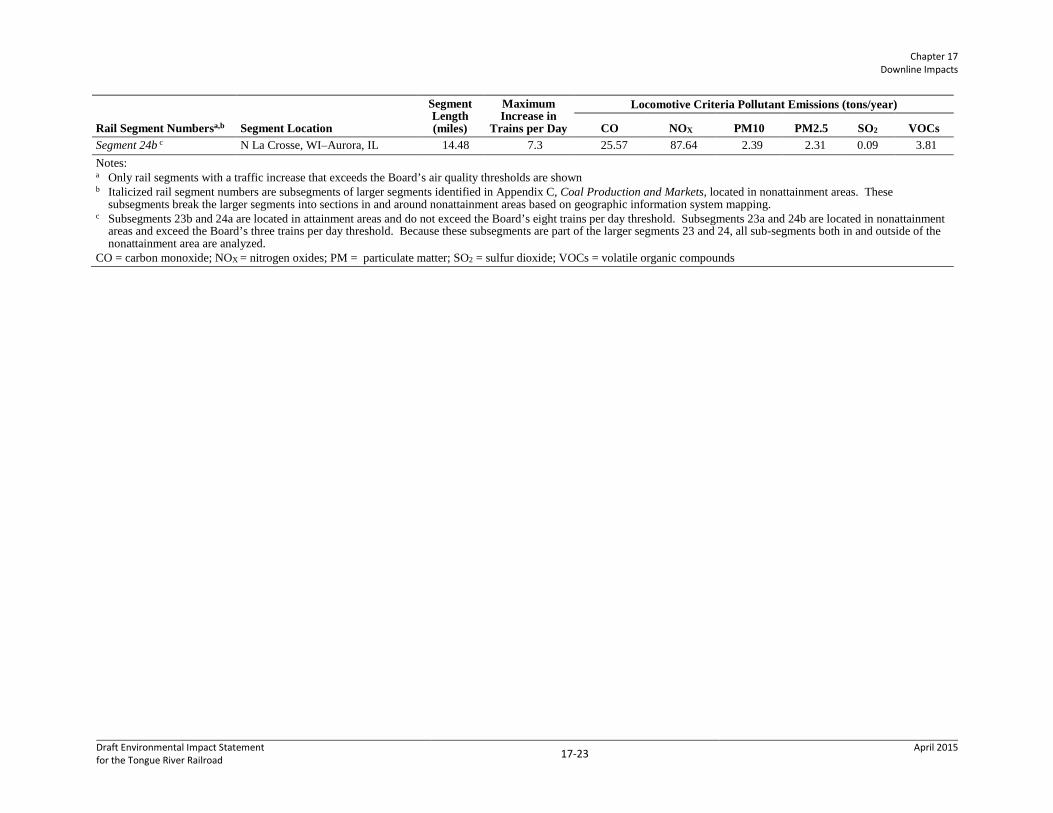
Estimated locomotive emissions increases would exceed the general conformity thresholds of 100 tons per year for either carbon monoxide (CO) or nitrogen oxide (NOX) for all 15 segments (Table 17-5). No segments would have increases in locomotive emissions of particulate matter 10 microns or less in size (PM10), particulate matter 2.5 microns or less in size (PM2.5), sulfur dioxide (SO2), or volatile organic compounds (VOC) that would exceed the general conformity thresholds, which are 100 tons per year for each pollutant.
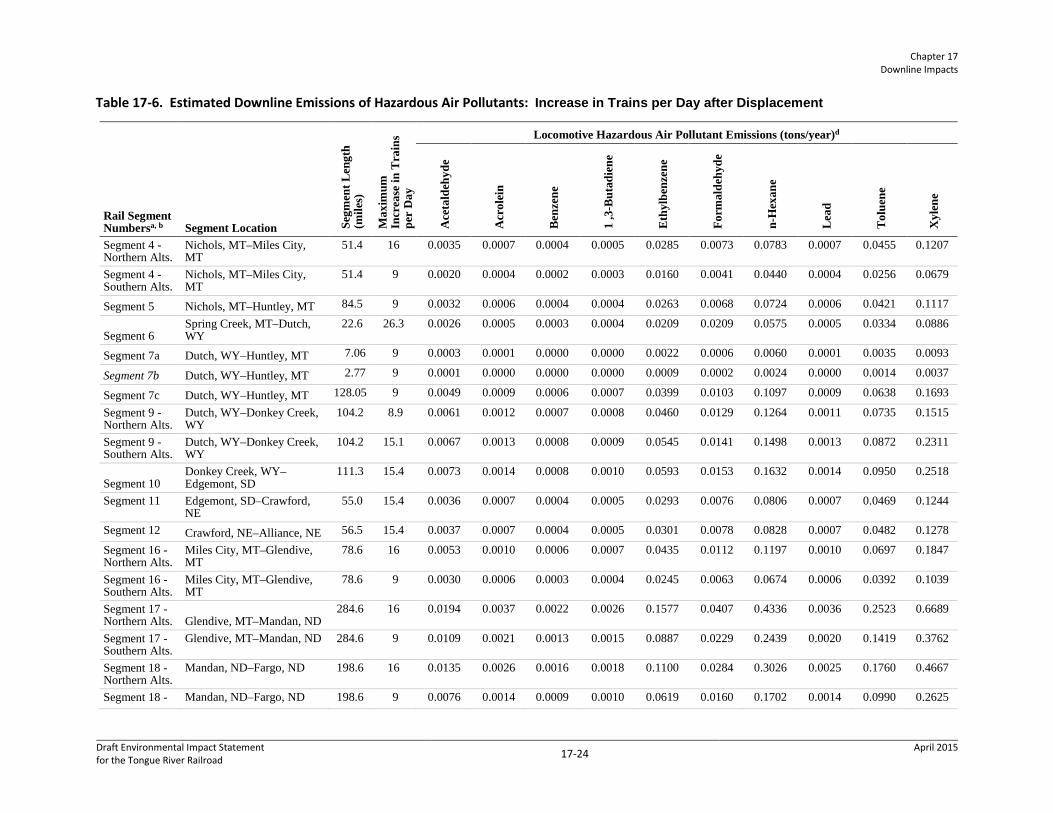
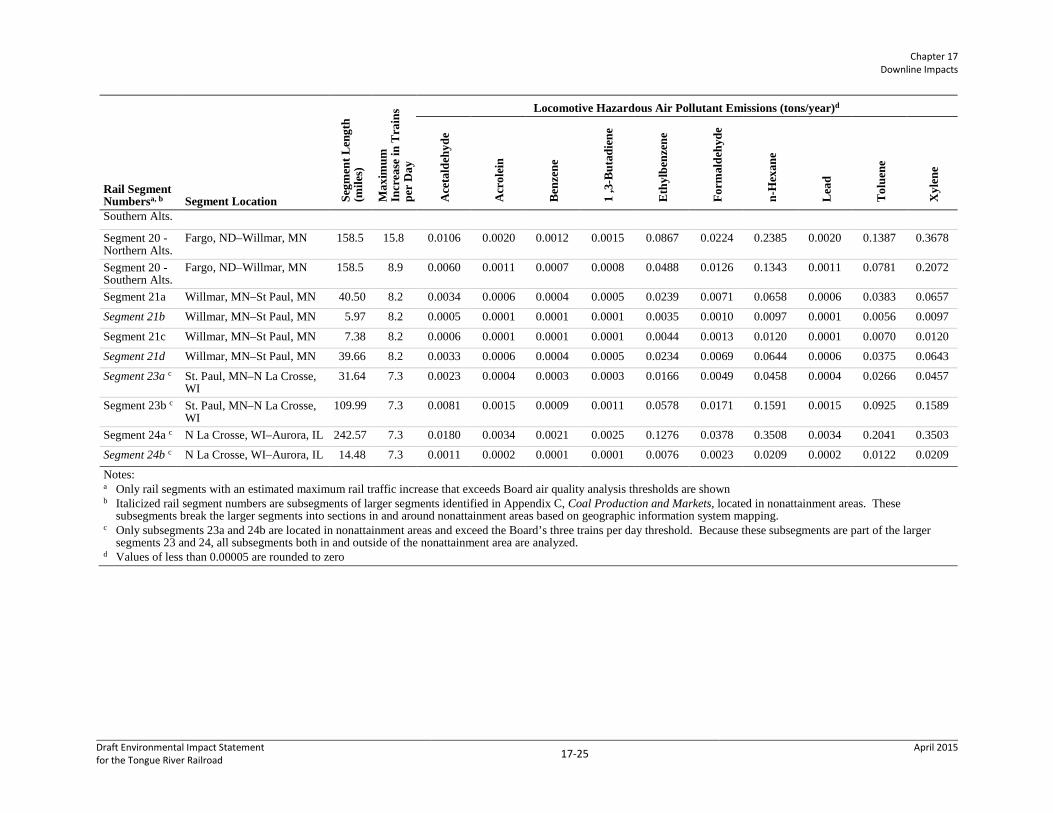
Emissions increases of hazardous air pollutants from locomotives would be less than 0.5 tons per year for any segment and pollutant (Table 17-6).
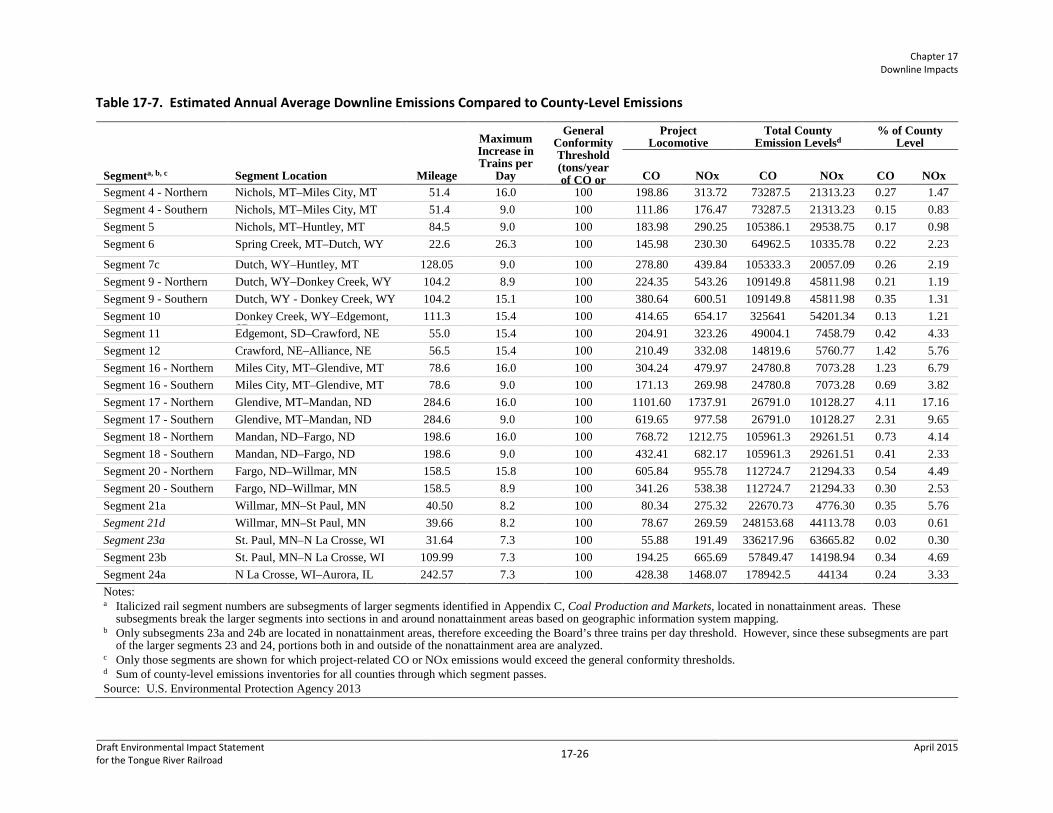
Segment emissions of CO or NOX as a percent of county-level emissions would be higher for segments that are longer, have more rail traffic, and traverse counties with relative low emissions. Emissions would range as follows (Table 17-7).
CO: from 0.02 percent (Segment 23a) to 4.11 percent (Segment 17, northern alternatives).
NOX: from 0.30 percent (Segment 23a) to 17.16 percent (Segment 17, northern alternatives).
The emission contributions would be spread out over the entire length of the rail segments and would be diluted and dispersed by wind and atmospheric turbulence. As a result, increases in concentrations measured at air quality monitoring sites, if any, are expected to be negligible. The increased downline rail traffic associated with the proposed rail line would not lead to a violation of the NAAQS for counties that are in attainment, and would not increase the severity of conditions in counties that are not in attainment.
Downline impacts on ambient pollutant concentrations would be comparable to the impacts estimated for the study area (Chapter 4, Air Quality). Total concentrations at any particular location would vary depending on total train traffic, local background concentrations, and local topographic and meteorological conditions.
Draft Environmental Impact Statement for the Tongue River Railroad 17-19 April 2015
Chapter 17
Downline Impacts
17.5.2.2 Motor Vehicle Emissions OEA estimated the increases in air emissions associated with idling vehicles delayed at downline grade crossings at the 15 downline rail segments that would exceed the traffic threshold (Appendix V, Downline Analysis). Total emission increases due to grade-crossing delays on all 15 segments are estimated as follows.
CO: less than 18.7 tons per year
NOX: less than 2.9 tons per year
PM10: less than 0.08 ton per year
PM2.5: less than 0.08 ton per year
Because these values are far below general conformity thresholds, OEA determined that they would not result in NAAQS violations and do not require further analysis. OEA concluded that these impacts would be negligible. See Appendix V, Downline Analysis, for additional information.
17.5.2.3 Coal Dust Emissions Downline emissions of coal dust particulate matter would be larger than for exhaust particulate matter and would vary with the same factors as discussed for the air quality study area (Chapter 4, Air Quality). The total project-related emissions of particulate matter, including coal dust, are not expected to lead to a violation of the NAAQS along downline rail segments. OEA considers the impacts of coal dust to be de minimis, but recognizes that there could be minor nuisance impacts.
17.5.2.4 Coal Combustion Combustion of coal transported by the proposed rail line could, after displacement of existing emissions, add incrementally to the air emissions near power plants in the United States. These facilities are classified as major stationary sources under the Clean Air Act and are required to obtain air quality permits from their state’s air quality agency. As a condition of permit approval, the facility must demonstrate that its air emissions will comply with all applicable emission standards and will not cause or contribute to a violation of any applicable ambient air quality standard. Air emissions from combustion of coal transported by the proposed rail line would not lead to violation of the NAAQS or state ambient air quality standards, under the requirements in the facilities’ air quality permits. Appendix C, Coal Production and Markets, provides the estimated emissions from combustion of coal transported on the proposed rail line.13
13 The Board has previously questioned whether it is required to examine potential air impacts related to the combustion of coal that is carried by trains on a proposed rail line that it may license. See Tongue River R.R. Co., Inc. –Constr. And Operation –Western Alignment, FD 30186 (Sub-No. 3), slip op. at 10 n.21 (STB served June 15, 2011). Indeed, under NEPA, an agency is not required to examine environmental impacts that are not proximately caused by the agency’s action. Dep’t of Transp. v. Public Citizen, 541 U.S. 752, 767-70 (2004). Nor is an agency required to examine environmental impacts over which it has no authority to act or control. Id. However, out of an abundance of caution, and because one court prior to Public Citizen required
Draft Environmental Impact Statement for the Tongue River Railroad 17-20 April 2015
Chapter 17
Downline Impacts
The following tables illustrate, for each segment, the estimated air emissions increase from proposed rail line traffic under the high production scenario. Table 17-5 shows the contribution of proposed rail line traffic to criteria pollutant emissions. All segments would exceed the general conformity threshold of 100 tons per year for CO or NOX. Table 17-6 shows that proposed rail traffic would contribute less than 0.5 ton per year of hazardous air pollutants for any segment and pollutant. Table 17-7 shows that emissions of CO or NOX, as a percent of county-level emissions, would range from 0.02 to 4.11 percent (CO) and from 0.30 to 17.16 percent (NOX).
the Board to examine the potential air impacts from the combustion of coal by power plants, see Mid States Coal. for Progress v. STB, 345 F.3d 520, 550 (8th Cir. 2003), OEA will examine those potential impacts in this EIS.
Draft Environmental Impact Statement for the Tongue River Railroad 17-21 April 2015

Chapter 17
Downline Impacts
Table 17-5. Estimated Downline Emissions of Criteria Pollutants: Increase in Trains per Day after Displacement
Rail Segment Numbersa,b Segment Location
Segment Length (miles)
Maximum Increase in
Trains per Day
Locomotive Criteria Pollutant Emissions (tons/year)
CO NOX PM10 PM2.5 SO2 VOCs Segment 4 - Northern Alts. Nichols, MT–Miles City, MT 51.4 16 198.86 313.72 7.78 7.54 0.72 14.23 Segment 4 - Southern Alts. Nichols, MT–Miles City, MT 51.4 9 111.86 176.47 4.37 4.24 0.40 8.00 Segment 5 Nichols, MT–Huntley, MT 84.5 9 183.98 290.25 7.19 6.98 0.66 13.17 Segment 6 Spring Creek, MT–Dutch, WY 22.6 26.3 145.98 230.30 5.71 5.54 0.53 10.45 Segment 7a Dutch, WY–Huntley, MT 7.06 9 15.37 24.25 0.60 0.58 0.06 1.10 Segment 7b Dutch, WY–Huntley, MT 2.77 9 6.02 9.50 0.24 0.23 0.02 0.43 Segment 7c Dutch, WY–Huntley, MT 128.05 9 278.80 439.84 10.90 10.58 1.00 19.95 Segment 9 - Northern Alts. Dutch, WY–Donkey Creek, WY 104.2 8.9 224.35 543.26 13.61 13.20 0.81 22.98 Segment 9 - Southern Alts. Dutch, WY–Donkey Creek, WY 104.2 15.1 380.64 600.51 14.88 14.44 1.37 27.24 Segment 10 Donkey Creek, WY–Edgemont, SD 111.3 15.4 414.65 654.17 16.21 15.73 1.49 29.67 Segment 11 Edgemont, SD–Crawford, NE 55.0 15.4 204.91 323.26 8.01 7.77 0.74 14.66 Segment 12 Crawford, NE–Alliance, NE 56.5 15.4 210.49 332.08 8.23 7.98 0.76 15.06 Segment 16 - Northern Alts. Miles City, MT–Glendive, MT 78.6 16 304.24 479.97 11.90 11.54 1.10 21.77 Segment 16 - Southern Alts. Miles City, MT–Glendive, MT 78.6 9 171.13 269.98 6.69 6.49 0.62 12.25 Segment 17 - Northern Alts. Glendive, MT–Mandan, ND 284.6 16 1101.60 1737.91 43.08 41.79 3.97 78.83 Segment 17 - Southern Alts. Glendive, MT–Mandan, ND 284.6 9 619.65 977.58 24.23 23.50 2.23 44.34 Segment 18 - Northern Alts. Mandan, ND–Fargo, ND 198.6 16 768.72 1212.75 30.06 29.16 2.77 55.01 Segment 18 - Southern Alts. Mandan, ND–Fargo, ND 198.6 9 432.41 682.17 16.91 16.40 1.56 30.94 Segment 20 - Northern Alts. Fargo, ND–Willmar, MN 158.5 15.8 605.84 955.78 23.69 22.98 2.18 43.36 Segment 20 - Southern Alts. Fargo, ND–Willmar, MN 158.5 8.9 341.26 538.38 13.34 12.94 1.23 24.42 Segment 21a Willmar, MN–St Paul, MN 40.50 8.2 80.34 275.32 7.49 7.27 0.29 11.96 Segment 21b Willmar, MN–St Paul, MN 5.97 8.2 11.84 40.57 1.10 1.07 0.04 1.76 Segment 21c Willmar, MN–St Paul, MN 7.38 8.2 14.63 50.15 1.37 1.32 0.05 2.18 Segment 21d Willmar, MN–St Paul, MN 39.66 8.2 78.67 269.59 7.34 7.12 0.28 11.71 Segment 23a c St. Paul, MN–N La Crosse, WI 31.64 7.3 55.88 191.49 5.21 5.06 0.20 8.32 Segment 23b c St. Paul, MN–N La Crosse, WI 109.99 7.3 194.25 665.69 18.12 17.58 0.70 28.92 Segment 24a c N La Crosse, WI–Aurora, IL 242.57 7.3 428.38 1468.07 39.96 38.76 1.54 63.78
Draft Environmental Impact Statement for the Tongue River Railroad 17-22 April 2015
Chapter 17
Downline Impacts
Rail Segment Numbersa,b Segment Location
Segment Length (miles)
Maximum Increase in
Trains per Day
Locomotive Criteria Pollutant Emissions (tons/year)
CO NOX PM10 PM2.5 SO2 VOCs Segment 24b c N La Crosse, WI–Aurora, IL 14.48 7.3 25.57 87.64 2.39 2.31 0.09 3.81 Notes: a Only rail segments with a traffic increase that exceeds the Board’s air quality thresholds are shown
b Italicized rail segment numbers are subsegments of larger segments identified in Appendix C, Coal Production and Markets, located in nonattainment areas. These subsegments break the larger segments into sections in and around nonattainment areas based on geographic information system mapping.
c Subsegments 23b and 24a are located in attainment areas and do not exceed the Board’s eight trains per day threshold. Subsegments 23a and 24b are located in nonattainment areas and exceed the Board’s three trains per day threshold. Because these subsegments are part of the larger segments 23 and 24, all sub-segments both in and outside of the nonattainment area are analyzed.
CO = carbon monoxide; NOX = nitrogen oxides; PM = particulate matter; SO2 = sulfur dioxide; VOCs = volatile organic compounds
Draft Environmental Impact Statement for the Tongue River Railroad 17-23 April 2015
Chapter 17
Downline Impacts
Table 17-6. Estimated Downline Emissions of Hazardous Air Pollutants: Increase in Trains per Day after Displacement
Rail Segment Numbersa, b Segment Location Se
gmen
t Len
gth
(mile
s)
Max
imum
In
crea
se in
Tra
ins
per
Day
Locomotive Hazardous Air Pollutant Emissions (tons/year)d
Ace
tald
ehyd
e
Acr
olei
n
Ben
zene
1 ,3
-But
adie
ne
Eth
ylbe
nzen
e
Form
alde
hyde
n-H
exan
e
Lea
d
Tol
uene
Xyl
ene
Segment 4 - Northern Alts.
Nichols, MT–Miles City, MT
51.4 16 0.0035 0.0007 0.0004 0.0005 0.0285 0.0073 0.0783 0.0007 0.0455 0.1207
Segment 4 - Southern Alts.
Nichols, MT–Miles City, MT
51.4 9 0.0020 0.0004 0.0002 0.0003 0.0160 0.0041 0.0440 0.0004 0.0256 0.0679
Segment 5 Nichols, MT–Huntley, MT 84.5 9 0.0032 0.0006 0.0004 0.0004 0.0263 0.0068 0.0724 0.0006 0.0421 0.1117
Segment 6 Spring Creek, MT–Dutch, WY
22.6 26.3 0.0026 0.0005 0.0003 0.0004 0.0209 0.0209 0.0575 0.0005 0.0334 0.0886
Segment 7a Dutch, WY–Huntley, MT 7.06 9 0.0003 0.0001 0.0000 0.0000 0.0022 0.0006 0.0060 0.0001 0.0035 0.0093
Segment 7b Dutch, WY–Huntley, MT 2.77 9 0.0001 0.0000 0.0000 0.0000 0.0009 0.0002 0.0024 0.0000 0.0014 0.0037
Segment 7c Dutch, WY–Huntley, MT 128.05 9 0.0049 0.0009 0.0006 0.0007 0.0399 0.0103 0.1097 0.0009 0.0638 0.1693
Segment 9 - Northern Alts.
Dutch, WY–Donkey Creek, WY
104.2 8.9 0.0061 0.0012 0.0007 0.0008 0.0460 0.0129 0.1264 0.0011 0.0735 0.1515
Segment 9 - Southern Alts.
Dutch, WY–Donkey Creek, WY
104.2 15.1 0.0067 0.0013 0.0008 0.0009 0.0545 0.0141 0.1498 0.0013 0.0872 0.2311
Segment 10 Donkey Creek, WY–Edgemont, SD
111.3 15.4 0.0073 0.0014 0.0008 0.0010 0.0593 0.0153 0.1632 0.0014 0.0950 0.2518
Segment 11 Edgemont, SD–Crawford, NE
55.0 15.4 0.0036 0.0007 0.0004 0.0005 0.0293 0.0076 0.0806 0.0007 0.0469 0.1244
Segment 12 Crawford, NE–Alliance, NE 56.5 15.4 0.0037 0.0007 0.0004 0.0005 0.0301 0.0078 0.0828 0.0007 0.0482 0.1278
Segment 16 - Northern Alts.
Miles City, MT–Glendive, MT
78.6 16 0.0053 0.0010 0.0006 0.0007 0.0435 0.0112 0.1197 0.0010 0.0697 0.1847
Segment 16 - Southern Alts.
Miles City, MT–Glendive, MT
78.6 9 0.0030 0.0006 0.0003 0.0004 0.0245 0.0063 0.0674 0.0006 0.0392 0.1039
Segment 17 - Northern Alts. Glendive, MT–Mandan, ND
284.6 16 0.0194 0.0037 0.0022 0.0026 0.1577 0.0407 0.4336 0.0036 0.2523 0.6689
Segment 17 - Southern Alts.
Glendive, MT–Mandan, ND 284.6 9 0.0109 0.0021 0.0013 0.0015 0.0887 0.0229 0.2439 0.0020 0.1419 0.3762
Segment 18 - Northern Alts.
Mandan, ND–Fargo, ND 198.6 16 0.0135 0.0026 0.0016 0.0018 0.1100 0.0284 0.3026 0.0025 0.1760 0.4667
Segment 18 - Mandan, ND–Fargo, ND 198.6 9 0.0076 0.0014 0.0009 0.0010 0.0619 0.0160 0.1702 0.0014 0.0990 0.2625
Draft Environmental Impact Statement for the Tongue River Railroad 17-24 April 2015
Chapter 17
Downline Impacts
Rail Segment Numbersa, b Segment Location Se
gmen
t Len
gth
(mile
s)
Max
imum
In
crea
se in
Tra
ins
per
Day
Locomotive Hazardous Air Pollutant Emissions (tons/year)d
Ace
tald
ehyd
e
Acr
olei
n
Ben
zene
1 ,3
-But
adie
ne
Eth
ylbe
nzen
e
Form
alde
hyde
n-H
exan
e
Lea
d
Tol
uene
Xyl
ene
Southern Alts.
Segment 20 - Northern Alts.
Fargo, ND–Willmar, MN 158.5 15.8 0.0106 0.0020 0.0012 0.0015 0.0867 0.0224 0.2385 0.0020 0.1387 0.3678
Segment 20 - Southern Alts.
Fargo, ND–Willmar, MN 158.5 8.9 0.0060 0.0011 0.0007 0.0008 0.0488 0.0126 0.1343 0.0011 0.0781 0.2072
Segment 21a Willmar, MN–St Paul, MN 40.50 8.2 0.0034 0.0006 0.0004 0.0005 0.0239 0.0071 0.0658 0.0006 0.0383 0.0657
Segment 21b Willmar, MN–St Paul, MN 5.97 8.2 0.0005 0.0001 0.0001 0.0001 0.0035 0.0010 0.0097 0.0001 0.0056 0.0097
Segment 21c Willmar, MN–St Paul, MN 7.38 8.2 0.0006 0.0001 0.0001 0.0001 0.0044 0.0013 0.0120 0.0001 0.0070 0.0120
Segment 21d Willmar, MN–St Paul, MN 39.66 8.2 0.0033 0.0006 0.0004 0.0005 0.0234 0.0069 0.0644 0.0006 0.0375 0.0643
Segment 23a c St. Paul, MN–N La Crosse, WI
31.64 7.3 0.0023 0.0004 0.0003 0.0003 0.0166 0.0049 0.0458 0.0004 0.0266 0.0457
Segment 23b c St. Paul, MN–N La Crosse, WI
109.99 7.3 0.0081 0.0015 0.0009 0.0011 0.0578 0.0171 0.1591 0.0015 0.0925 0.1589
Segment 24a c N La Crosse, WI–Aurora, IL 242.57 7.3 0.0180 0.0034 0.0021 0.0025 0.1276 0.0378 0.3508 0.0034 0.2041 0.3503
Segment 24b c N La Crosse, WI–Aurora, IL 14.48 7.3 0.0011 0.0002 0.0001 0.0001 0.0076 0.0023 0.0209 0.0002 0.0122 0.0209
Notes: a Only rail segments with an estimated maximum rail traffic increase that exceeds Board air quality analysis thresholds are shown
b Italicized rail segment numbers are subsegments of larger segments identified in Appendix C, Coal Production and Markets, located in nonattainment areas. These subsegments break the larger segments into sections in and around nonattainment areas based on geographic information system mapping.
c Only subsegments 23a and 24b are located in nonattainment areas and exceed the Board’s three trains per day threshold. Because these subsegments are part of the larger segments 23 and 24, all subsegments both in and outside of the nonattainment area are analyzed.
d Values of less than 0.00005 are rounded to zero
Draft Environmental Impact Statement for the Tongue River Railroad 17-25 April 2015
Chapter 17
Downline Impacts
Table 17-7. Estimated Annual Average Downline Emissions Compared to County-Level Emissions
Segmenta, b, c Segment Location Mileage
Maximum Increase in Trains per
Day
General Conformity Threshold (tons/year of CO or
Project Locomotive
Total County Emission Levelsd
% of County Level
CO NOx CO NOx CO NOx Segment 4 - Northern Nichols, MT–Miles City, MT 51.4 16.0 100 198.86 313.72 73287.5 21313.23 0.27 1.47 Segment 4 - Southern Nichols, MT–Miles City, MT 51.4 9.0 100 111.86 176.47 73287.5 21313.23 0.15 0.83 Segment 5 Nichols, MT–Huntley, MT 84.5 9.0 100 183.98 290.25 105386.1 29538.75 0.17 0.98 Segment 6 Spring Creek, MT–Dutch, WY 22.6 26.3 100 145.98 230.30 64962.5 10335.78 0.22 2.23
Segment 7c Dutch, WY–Huntley, MT 128.05 9.0 100 278.80 439.84 105333.3 20057.09 0.26 2.19 Segment 9 - Northern Dutch, WY–Donkey Creek, WY 104.2 8.9 100 224.35 543.26 109149.8 45811.98 0.21 1.19 Segment 9 - Southern Dutch, WY - Donkey Creek, WY 104.2 15.1 100 380.64 600.51 109149.8 45811.98 0.35 1.31 Segment 10 Donkey Creek, WY–Edgemont,
SD 111.3 15.4 100 414.65 654.17 325641 54201.34 0.13 1.21
Segment 11 Edgemont, SD–Crawford, NE 55.0 15.4 100 204.91 323.26 49004.1 7458.79 0.42 4.33 Segment 12 Crawford, NE–Alliance, NE 56.5 15.4 100 210.49 332.08 14819.6 5760.77 1.42 5.76 Segment 16 - Northern Miles City, MT–Glendive, MT 78.6 16.0 100 304.24 479.97 24780.8 7073.28 1.23 6.79 Segment 16 - Southern Miles City, MT–Glendive, MT 78.6 9.0 100 171.13 269.98 24780.8 7073.28 0.69 3.82 Segment 17 - Northern Glendive, MT–Mandan, ND 284.6 16.0 100 1101.60 1737.91 26791.0 10128.27 4.11 17.16 Segment 17 - Southern Glendive, MT–Mandan, ND 284.6 9.0 100 619.65 977.58 26791.0 10128.27 2.31 9.65 Segment 18 - Northern Mandan, ND–Fargo, ND 198.6 16.0 100 768.72 1212.75 105961.3 29261.51 0.73 4.14 Segment 18 - Southern Mandan, ND–Fargo, ND 198.6 9.0 100 432.41 682.17 105961.3 29261.51 0.41 2.33 Segment 20 - Northern Fargo, ND–Willmar, MN 158.5 15.8 100 605.84 955.78 112724.7 21294.33 0.54 4.49 Segment 20 - Southern Fargo, ND–Willmar, MN 158.5 8.9 100 341.26 538.38 112724.7 21294.33 0.30 2.53 Segment 21a Willmar, MN–St Paul, MN 40.50 8.2 100 80.34 275.32 22670.73 4776.30 0.35 5.76 Segment 21d Willmar, MN–St Paul, MN 39.66 8.2 100 78.67 269.59 248153.68 44113.78 0.03 0.61 Segment 23a St. Paul, MN–N La Crosse, WI 31.64 7.3 100 55.88 191.49 336217.96 63665.82 0.02 0.30 Segment 23b St. Paul, MN–N La Crosse, WI 109.99 7.3 100 194.25 665.69 57849.47 14198.94 0.34 4.69 Segment 24a N La Crosse, WI–Aurora, IL 242.57 7.3 100 428.38 1468.07 178942.5 44134 0.24 3.33 Notes: a Italicized rail segment numbers are subsegments of larger segments identified in Appendix C, Coal Production and Markets, located in nonattainment areas. These
subsegments break the larger segments into sections in and around nonattainment areas based on geographic information system mapping. b Only subsegments 23a and 24b are located in nonattainment areas, therefore exceeding the Board’s three trains per day threshold. However, since these subsegments are part
of the larger segments 23 and 24, portions both in and outside of the nonattainment area are analyzed. c Only those segments are shown for which project-related CO or NOx emissions would exceed the general conformity thresholds. d Sum of county-level emissions inventories for all counties through which segment passes. Source: U.S. Environmental Protection Agency 2013
Draft Environmental Impact Statement for the Tongue River Railroad 17-26 April 2015
Chapter 17
Downline Impacts
17.5.3 Noise and Vibration OEA estimated the potential noise and vibration impacts for 13 downline rail segments with a maximum estimated increase of eight trains per day (Table 17-1) as follows.
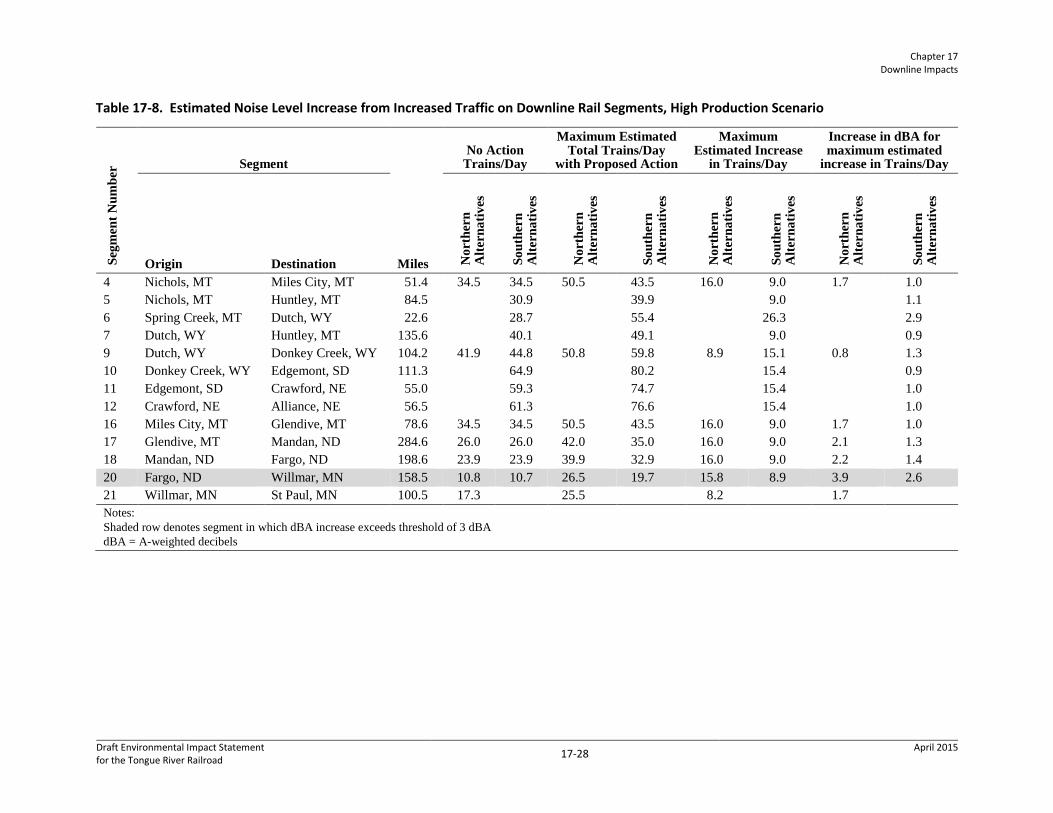
The Board’s 3 dBA or greater noise increase analysis threshold would be exceeded on one downline segment (Segment 20) under the high production scenario for the northern alternatives (Table 17-8) (Appendix V, Downline Analysis).
OEA calculated noise contour distances for the estimated maximum increase in downline rail traffic resulting from the proposed rail line and for the No-Action Alternative for Segment 20 (Fargo, ND to Willmar, MN). OEA used the same assumptions about train characteristics as used to analyze noise impacts in the project area (Chapter 7, Section 7.3, Analysis Methods) except that trains from Fargo to Wahpeton would have a maximum speed of 60 miles per hour while trains from Wahpeton to Willmar would have a maximum speed of 40 miles per hour (Appendix H, Noise and Vibration Impact Assessment Methods). Distances to the horn and wayside 65 DNL contour lines for Segment 20 were calculated using the rail traffic characteristics, including train frequency, length, speed, and the number of locomotives (Table 17-9).
The number of receptors within the 65 DNL contour for wayside and horn noise would be 1,205 for the No-Action Alternative and 2,934 for the proposed rail line under the high production scenario, year 2030. All 2,934 of these receptors would be adversely14 affected by additional traffic resulting from the proposed rail line because they would experience noise levels at 65 DNL or greater with a 3 dBA or greater increase, assuming the high production scenario, year 2030.
Of the 2,934 receptors in the 65 DNL contour, 42 would be affected by wayside noise only. Of the 1,205 receptors within the No-Action Alternative 65 DNL contour, 18 would be affected by wayside noise only.
14 The term adverse is used to describe a noise impact that exceeds the Board’s noise analysis thresholds, as described in Chapter 7, Section 7.3, Analysis Methods.
Draft Environmental Impact Statement for the Tongue River Railroad 17-27 April 2015
Chapter 17
Downline Impacts
Table 17-8. Estimated Noise Level Increase from Increased Traffic on Downline Rail Segments, High Production Scenario Se
gmen
t Num
ber Segment
Miles
No Action Trains/Day
Maximum Estimated Total Trains/Day
with Proposed Action
Maximum Estimated Increase
in Trains/Day
Increase in dBA for maximum estimated
increase in Trains/Day
Origin Destination Nor
ther
n A
ltern
ativ
es
Sout
hern
A
ltern
ativ
es
Nor
ther
n A
ltern
ativ
es
Sout
hern
A
ltern
ativ
es
Nor
ther
n A
ltern
ativ
es
Sout
hern
A
ltern
ativ
es
Nor
ther
n A
ltern
ativ
es
Sout
hern
A
ltern
ativ
es
4 Nichols, MT Miles City, MT 51.4 34.5 34.5 50.5 43.5 16.0 9.0 1.7 1.0 5 Nichols, MT Huntley, MT 84.5 30.9 39.9 9.0 1.1 6 Spring Creek, MT Dutch, WY 22.6 28.7 55.4 26.3 2.9 7 Dutch, WY Huntley, MT 135.6 40.1 49.1 9.0 0.9 9 Dutch, WY Donkey Creek, WY 104.2 41.9 44.8 50.8 59.8 8.9 15.1 0.8 1.3 10 Donkey Creek, WY Edgemont, SD 111.3 64.9 80.2 15.4 0.9 11 Edgemont, SD Crawford, NE 55.0 59.3 74.7 15.4 1.0 12 Crawford, NE Alliance, NE 56.5 61.3 76.6 15.4 1.0 16 Miles City, MT Glendive, MT 78.6 34.5 34.5 50.5 43.5 16.0 9.0 1.7 1.0 17 Glendive, MT Mandan, ND 284.6 26.0 26.0 42.0 35.0 16.0 9.0 2.1 1.3 18 Mandan, ND Fargo, ND 198.6 23.9 23.9 39.9 32.9 16.0 9.0 2.2 1.4 20 Fargo, ND Willmar, MN 158.5 10.8 10.7 26.5 19.7 15.8 8.9 3.9 2.6 21 Willmar, MN St Paul, MN 100.5 17.3 25.5 8.2 1.7 Notes: Shaded row denotes segment in which dBA increase exceeds threshold of 3 dBA dBA = A-weighted decibels
Draft Environmental Impact Statement for the Tongue River Railroad 17-28 April 2015

Chapter 17
Downline Impacts
Table 17-9. Distances (feet) to 65 DNL Noise Contour Line for Segment 20
Horn Wayside No-Action Alternative, Fargo to Wahpeton 666 417 No-Action Alternative, Wahpeton to Willmar 666 305 Proposed Rail Line, Fargo to Wahpeton 1,214 761 Proposed Rail Line, Wahpeton to Willmar 1,214 548
17.5.4 Environmental Justice
17.5.4.1 Sensitive Receptor Analysis OEA evaluated the distribution of the 2,934 noise sensitive receptors located along downline rail Segment 20 to determine if minority and low-income populations would experience disproportionately high and adverse impacts.
Of the 2,934 receptors, 815 (28 percent) are in minority populations. Concentrations of minority populations occur particularly around cities/towns of Moorhead (Clay County), Morris (Stevens County), Benson and Kerkhoven (Swift County) and Pennock and Wilmar (Kandiyohi County). These include a mix of Hispanic, African American, American Indian, and Asian communities. Because the nine-county area, as defined in Chapter 16, Environmental Justice, has a minority presence of 9.2 percent (Appendix V, Downline Analysis), OEA concluded that minority populations would experience disproportionately high and adverse noise impacts from the additional project-related rail traffic under the high production scenario for the northern alternatives.
Of the 2,934 receptors, 1,294 (44 percent) are in low-income populations. Because 11.7 percent of households and 11.9 of individuals in the nine-county area have low incomes, OEA concluded that low-income populations would experience disproportionately high and adverse noise impacts from the additional project-related rail traffic under the high production scenario for the northern alternatives.
Under the No-Action Alternative, no disproportionately high and adverse impacts on minority or low-income populations would result from construction and operation of the proposed rail line.
17.5.5 Mitigation and Unavoidable Environmental Consequences
OEA is not recommending mitigation measures for downline noise impacts on Segment 20 because fluctuations in rail traffic are expected. However, OEA identified grade crossings where substantial noise reductions could be realized if quiet zones were implemented. OEA recommends that a designated community liaison (Chapter 19, Mitigation) consult with the communities along Segment 20 to consider establishing quiet zones where Federal Railroad Administration safety standards could be met. Appendix V, Downline Analysis, provides
Draft Environmental Impact Statement for the Tongue River Railroad 17-29 April 2015
Chapter 17
Downline Impacts
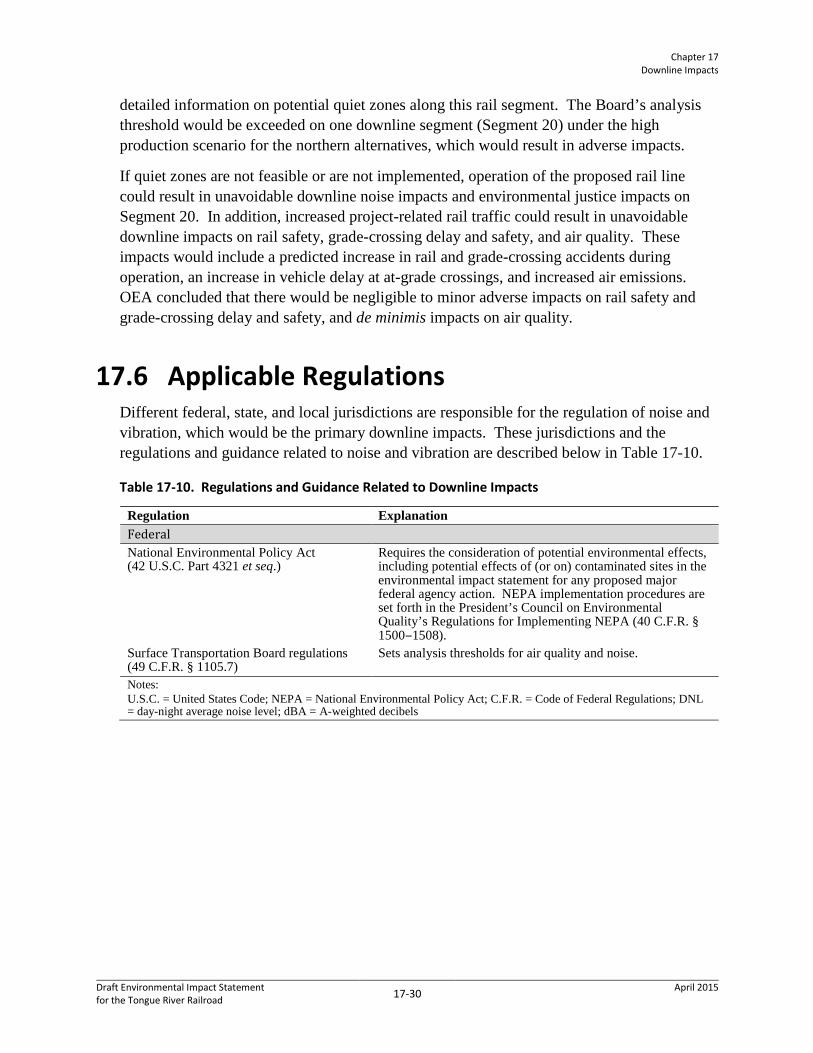
detailed information on potential quiet zones along this rail segment. The Board’s analysis threshold would be exceeded on one downline segment (Segment 20) under the high production scenario for the northern alternatives, which would result in adverse impacts.
If quiet zones are not feasible or are not implemented, operation of the proposed rail line could result in unavoidable downline noise impacts and environmental justice impacts on Segment 20. In addition, increased project-related rail traffic could result in unavoidable downline impacts on rail safety, grade-crossing delay and safety, and air quality. These impacts would include a predicted increase in rail and grade-crossing accidents during operation, an increase in vehicle delay at at-grade crossings, and increased air emissions. OEA concluded that there would be negligible to minor adverse impacts on rail safety and grade-crossing delay and safety, and de minimis impacts on air quality.
17.6 Applicable Regulations Different federal, state, and local jurisdictions are responsible for the regulation of noise and vibration, which would be the primary downline impacts. These jurisdictions and the regulations and guidance related to noise and vibration are described below in Table 17-10.
Table 17-10. Regulations and Guidance Related to Downline Impacts
Regulation Explanation Federal National Environmental Policy Act (42 U.S.C. Part 4321 et seq.)
Requires the consideration of potential environmental effects, including potential effects of (or on) contaminated sites in the environmental impact statement for any proposed major federal agency action. NEPA implementation procedures are set forth in the President’s Council on Environmental Quality’s Regulations for Implementing NEPA (40 C.F.R. § 1500‒1508).
Surface Transportation Board regulations (49 C.F.R. § 1105.7)
Sets analysis thresholds for air quality and noise.
Notes: U.S.C. = United States Code; NEPA = National Environmental Policy Act; C.F.R. = Code of Federal Regulations; DNL = day-night average noise level; dBA = A-weighted decibels
Draft Environmental Impact Statement for the Tongue River Railroad 17-30 April 2015