CHAPTER 16—Solutions COSTING SYSTEMS: JOB ORDER COSTING · Job order costing recognizes...
36
Full file at https://fratstock.eu DQ1. DQ2. DQ3. DQ4. and applied overhead costs. COSTING SYSTEMS: JOB ORDER COSTING Discussion Questions the cost of all jobs in process while process costing uses many Work in Process Inventory accounts, one for each process, department, or work cell. Job order first traces these costs to processes, departments, or work cells and then assigns costing is used by companies making special or unique products or services while costs to products. Job order costing measures cost for each completed unit while process costing measures cost in terms of units completed during a specific period. Job order costing uses a single Work in Process Inventory account to summarize The matching rule tracks or matches costs against the revenues they generate each process costing is used by companies making similar or identical products or in long production runs. CHAPTER 16—Solutions costs are matched against the revenues generated. Cost of Goods Sold increases and Finished Goods decreases. terials Inventory account and increase the Work in Process Inventory account. In addition, the costs of the requested materials decrease the appropriate accounts period. Costs flow into and out of the inventory accounts adhering to this rule. in the materials subsidiary ledger and increase the appropriate job order cost cards. The accounting concept of cost measurement focuses on determining the amount of the cost. The accounting concept of cost recognition determines when a cost should be recorded. And, the matching concept compares revenues with the costs that were required to generate them. Job order costing recognizes production costs for specific jobs; process costing ess Inventory and increase Finished Goods Inventory. When goods are sold, their head costs as they are incurred, and reconciling the difference between the actual Direct Materials . When direct materials arrive, the cost of the items increases the Materials Inventory account. Following a materials request, the items requested are issued to the production departments. Direct materials costs then decrease the Ma- Direct Labor . When incurred, direct labor costs increase the Work in Process Inven- Overhead . An estimated amount of overhead increases the Work in Process Inven- Estimated and actual overhead costs are recognized and measured using the four steps. The four-step process involves planning an estimated rate at which overhead tory as work is done. The completed cost of goods produced decrease Work in Proc- costs will be assigned to products or services, assigning overhead costs at this pre- determined rate to products or services during production, measuring actual over- tory account and, at the same time, increase the appropriate job order cost cards. 16-1 © 2014 Cengage Learning. All Rights Reserved. May not be scanned, copied, duplicated, or posted to a publicly accessible website, in whole or in part.
-
Upload
doankhuong -
Category
Documents
-
view
263 -
download
0
Transcript of CHAPTER 16—Solutions COSTING SYSTEMS: JOB ORDER COSTING · Job order costing recognizes...
Full file at https://fratstock.eu
DQ1.
DQ2.
DQ3.
DQ4.
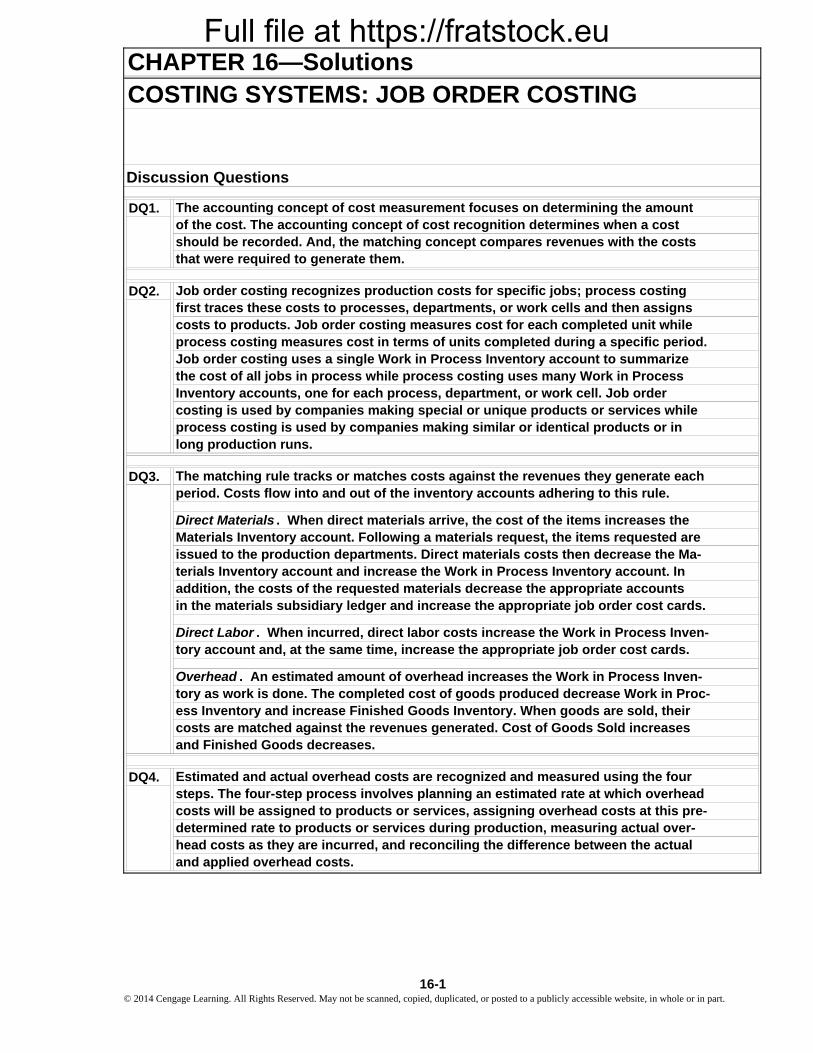
and applied overhead costs.
COSTING SYSTEMS: JOB ORDER COSTING
Discussion Questions
the cost of all jobs in process while process costing uses many Work in Process Inventory accounts, one for each process, department, or work cell. Job order
first traces these costs to processes, departments, or work cells and then assigns
costing is used by companies making special or unique products or services while
costs to products. Job order costing measures cost for each completed unit while process costing measures cost in terms of units completed during a specific period. Job order costing uses a single Work in Process Inventory account to summarize
The matching rule tracks or matches costs against the revenues they generate each
process costing is used by companies making similar or identical products or in long production runs.
CHAPTER 16—Solutions
costs are matched against the revenues generated. Cost of Goods Sold increasesand Finished Goods decreases.
terials Inventory account and increase the Work in Process Inventory account. Inaddition, the costs of the requested materials decrease the appropriate accounts
period. Costs flow into and out of the inventory accounts adhering to this rule.
in the materials subsidiary ledger and increase the appropriate job order cost cards.
The accounting concept of cost measurement focuses on determining the amount of the cost. The accounting concept of cost recognition determines when a cost should be recorded. And, the matching concept compares revenues with the costs that were required to generate them.
Job order costing recognizes production costs for specific jobs; process costing
ess Inventory and increase Finished Goods Inventory. When goods are sold, their
head costs as they are incurred, and reconciling the difference between the actual
Direct Materials . When direct materials arrive, the cost of the items increases theMaterials Inventory account. Following a materials request, the items requested areissued to the production departments. Direct materials costs then decrease the Ma-
Direct Labor . When incurred, direct labor costs increase the Work in Process Inven-
Overhead . An estimated amount of overhead increases the Work in Process Inven-
Estimated and actual overhead costs are recognized and measured using the four steps. The four-step process involves planning an estimated rate at which overhead
tory as work is done. The completed cost of goods produced decrease Work in Proc-
costs will be assigned to products or services, assigning overhead costs at this pre-determined rate to products or services during production, measuring actual over-
tory account and, at the same time, increase the appropriate job order cost cards.
16-1 © 2014 Cengage Learning. All Rights Reserved. May not be scanned, copied, duplicated, or posted to a publicly accessible website, in whole or in part.
Full file at https://fratstock.eu
DQ5.
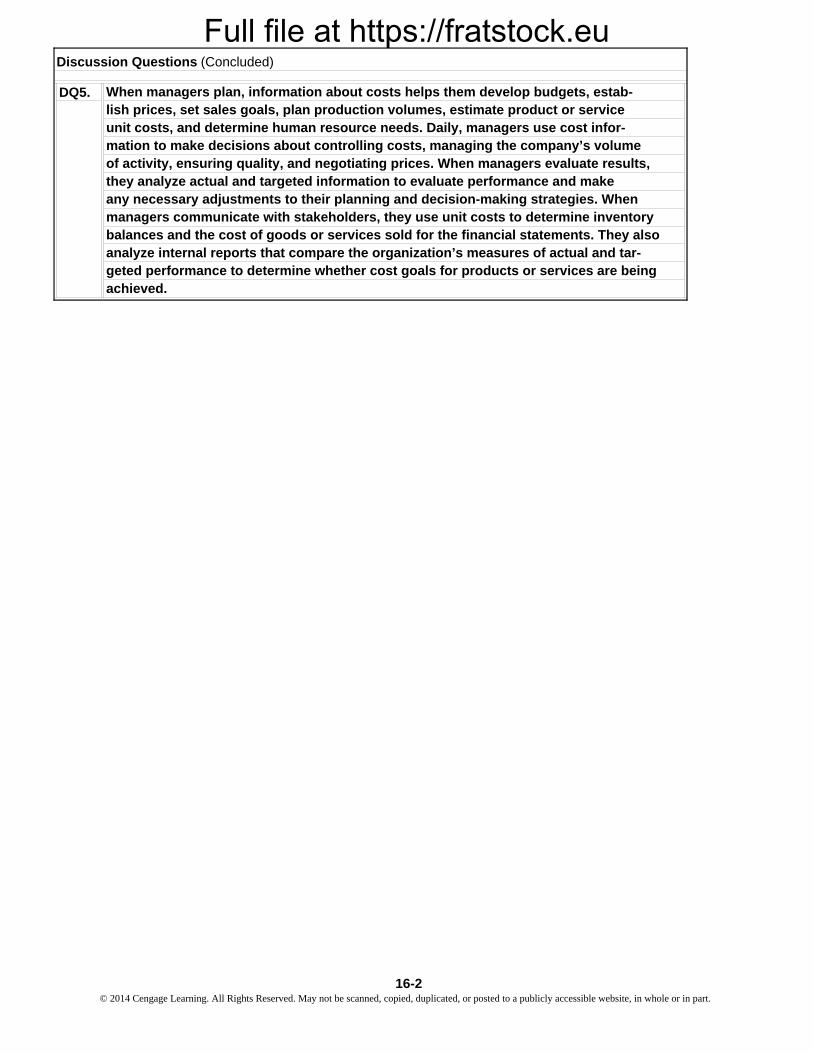
Discussion Questions (Concluded)
When managers plan, information about costs helps them develop budgets, estab-
unit costs, and determine human resource needs. Daily, managers use cost infor-
balances and the cost of goods or services sold for the financial statements. They also analyze internal reports that compare the organization’s measures of actual and tar-
of activity, ensuring quality, and negotiating prices. When managers evaluate results, mation to make decisions about controlling costs, managing the company’s volume
lish prices, set sales goals, plan production volumes, estimate product or service
they analyze actual and targeted information to evaluate performance and make any necessary adjustments to their planning and decision-making strategies. When managers communicate with stakeholders, they use unit costs to determine inventory
geted performance to determine whether cost goals for products or services are being achieved.
16-2© 2014 Cengage Learning. All Rights Reserved. May not be scanned, copied, duplicated, or posted to a publicly accessible website, in whole or in part.
Full file at https://fratstock.eu
a. d.
b. e.
c. f.
a.
b.
c.
d.
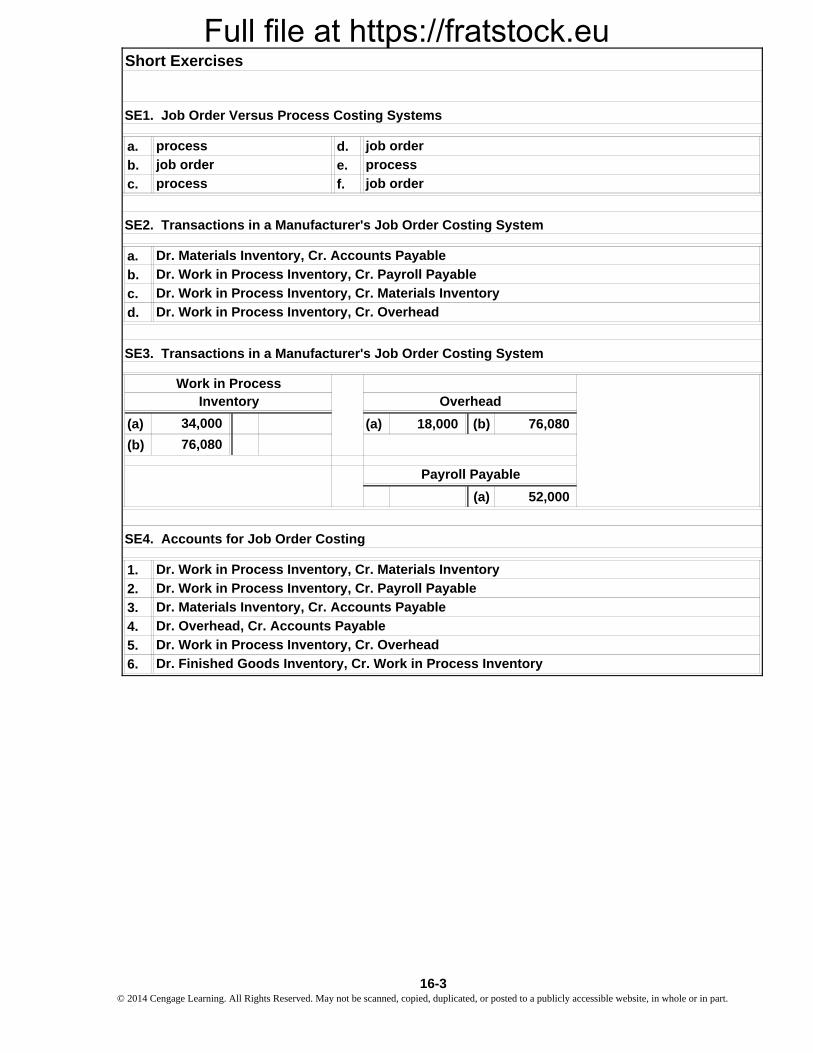
(a) (a) 18,000 (b) 76,080
(b)
(a) 52,000
1.
2.
3.
4.
5.
6.
Dr. Work in Process Inventory, Cr. Payroll Payable
Dr. Materials Inventory, Cr. Accounts Payable
Dr. Work in Process Inventory, Cr. Overhead
Dr. Work in Process Inventory, Cr. Materials Inventory
SE3. Transactions in a Manufacturer's Job Order Costing System
76,080
Payroll Payable
34,000
Work in ProcessInventory
SE1. Job Order Versus Process Costing Systems
job orderprocess
job order
process
SE2. Transactions in a Manufacturer's Job Order Costing System
process
job order
Overhead
SE4. Accounts for Job Order Costing
Short Exercises
Dr. Work in Process Inventory, Cr. Materials Inventory
Dr. Work in Process Inventory, Cr. Payroll Payable
Dr. Materials Inventory, Cr. Accounts Payable
Dr. Overhead, Cr. Accounts Payable
Dr. Work in Process Inventory, Cr. Overhead
Dr. Finished Goods Inventory, Cr. Work in Process Inventory
16-3 © 2014 Cengage Learning. All Rights Reserved. May not be scanned, copied, duplicated, or posted to a publicly accessible website, in whole or in part.
Full file at https://fratstock.eu
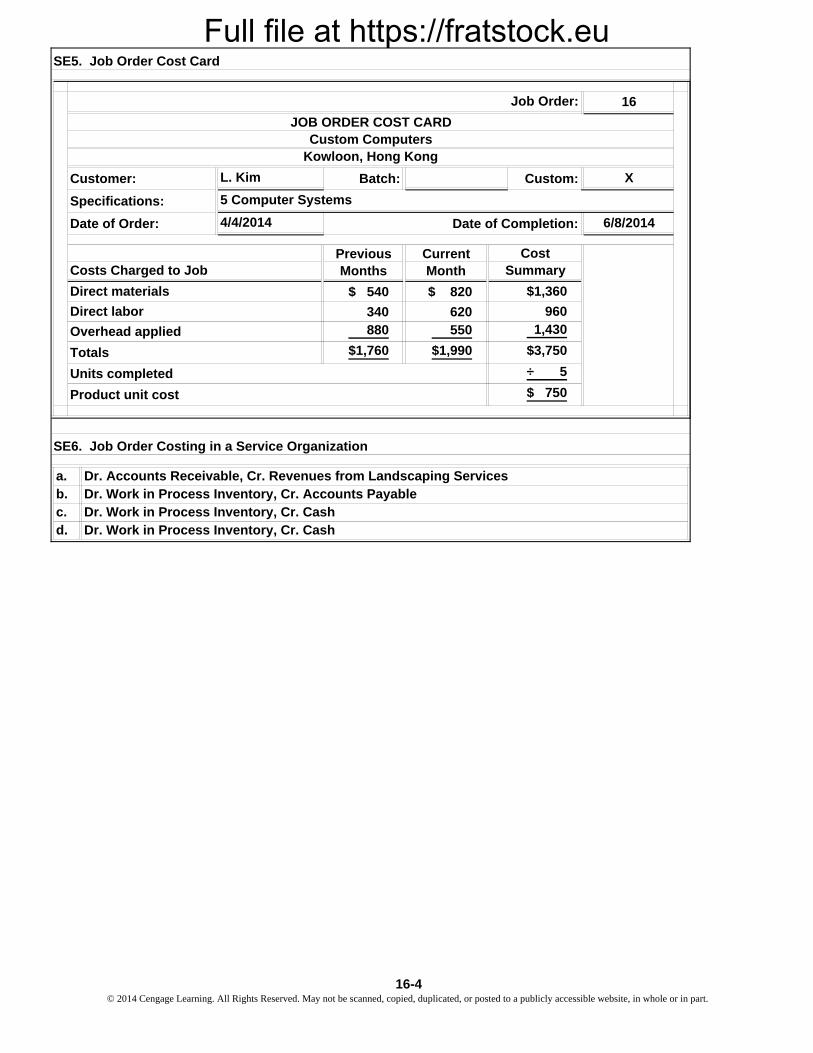
16
X
6/8/2014
Previous CurrentMonths Month
$ 540 $ 820
340 620 880 550
$1,760 $1,990
JOB ORDER COST CARD
÷ 5
$ 750
Kowloon, Hong Kong
Units completed
Product unit cost
Direct materials
L. Kim
1,430
5 Computer Systems
Overhead applied
960
Customer:
Specifications:
Totals
Costs Charged to Job
$1,360
$3,750
Summary
Direct labor
Cost
SE5. Job Order Cost Card
Date of Order:
Batch: Custom:
Custom Computers
Dr. Work in Process Inventory, Cr. Cash
a.b.c.d.
Job Order:
Date of Completion:4/4/2014
Dr. Accounts Receivable, Cr. Revenues from Landscaping ServicesDr. Work in Process Inventory, Cr. Accounts PayableDr. Work in Process Inventory, Cr. Cash
SE6. Job Order Costing in a Service Organization
16-4© 2014 Cengage Learning. All Rights Reserved. May not be scanned, copied, duplicated, or posted to a publicly accessible website, in whole or in part.
Full file at https://fratstock.eu
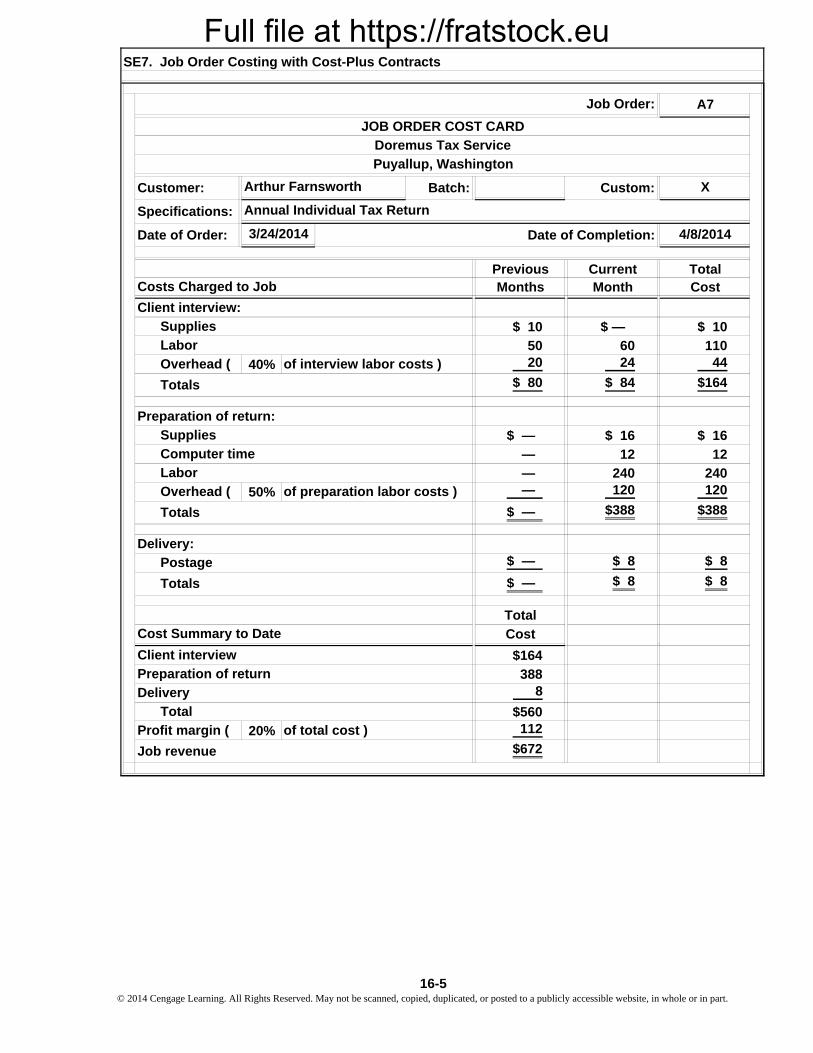
A7
X
4/8/2014
Previous Current TotalMonths Month Cost
$ 10 $ — $ 10
50 60 110
40% 20 24 44
$ 80 $ 84 $164
$ — $ 16 $ 16
— 12 12
— 240 240
50% — 120 120
$ — $388 $388
$ — $ 8 $ 8
$ — $ 8 $ 8
Total
Cost
$164
388 8
$560
20% 112
$672
Costs Charged to Job
SE7. Job Order Costing with Cost-Plus Contracts
JOB ORDER COST CARD
Annual Individual Tax Return
Computer time
Puyallup, Washington
Customer:
Overhead (
Labor
Preparation of return:
Postage
Totals
Totals
Profit margin ( of total cost )
Job revenue
Client interview
Preparation of return
Labor
Delivery
Total
Cost Summary to Date
Supplies
Delivery:
Job Order:
Batch:
Doremus Tax Service
Overhead ( of preparation labor costs )
3/24/2014Date of Order:
Totals
Supplies
of interview labor costs )
Client interview:
Custom:
Date of Completion:
Arthur Farnsworth
Specifications:
16-5 © 2014 Cengage Learning. All Rights Reserved. May not be scanned, copied, duplicated, or posted to a publicly accessible website, in whole or in part.
Full file at https://fratstock.eu
$27,00025,870
$ 1,130
service requests
=
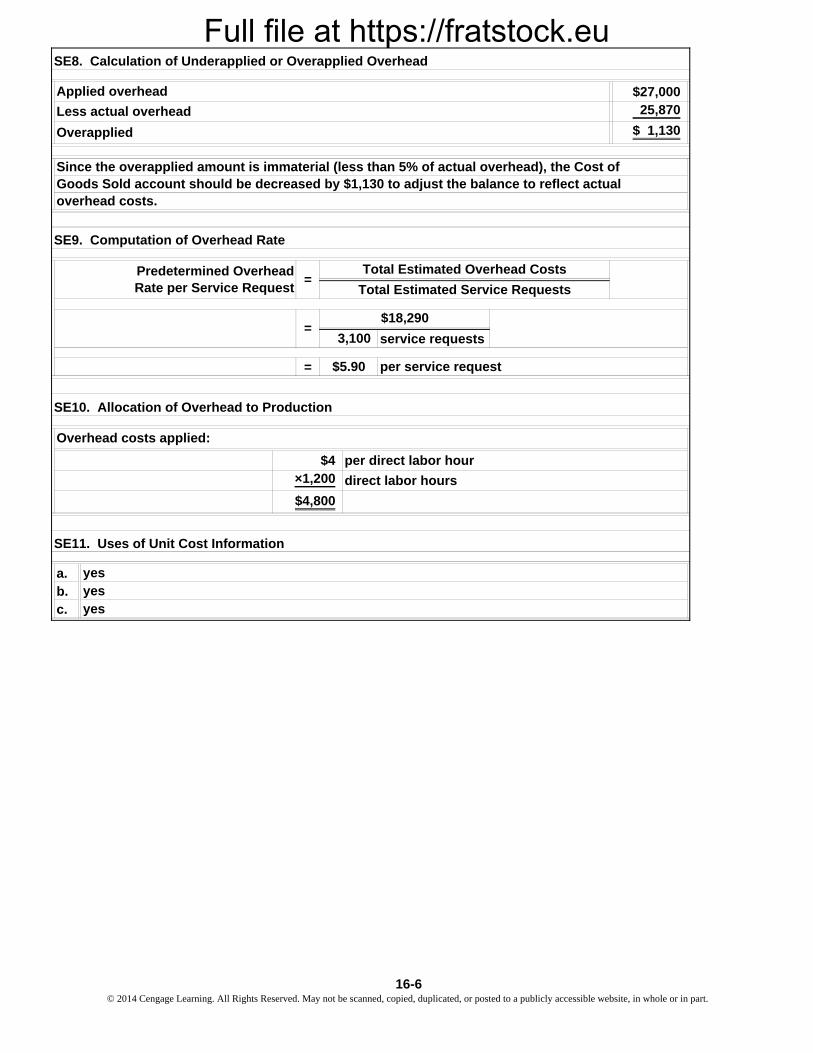
a.b.c.
yesyesyes
=$18,290
3,100
Overhead costs applied:
$4×1,200
SE9. Computation of Overhead Rate
Predetermined OverheadRate per Service Request Total Estimated Service Requests
=Total Estimated Overhead Costs
SE10. Allocation of Overhead to Production
SE8. Calculation of Underapplied or Overapplied Overhead
Applied overhead
Less actual overhead
Overapplied
per direct labor hour
$5.90 per service request
Since the overapplied amount is immaterial (less than 5% of actual overhead), the Cost of Goods Sold account should be decreased by $1,130 to adjust the balance to reflect actual overhead costs.
$4,800
SE11. Uses of Unit Cost Information
direct labor hours
16-6© 2014 Cengage Learning. All Rights Reserved. May not be scanned, copied, duplicated, or posted to a publicly accessible website, in whole or in part.
Full file at https://fratstock.eu
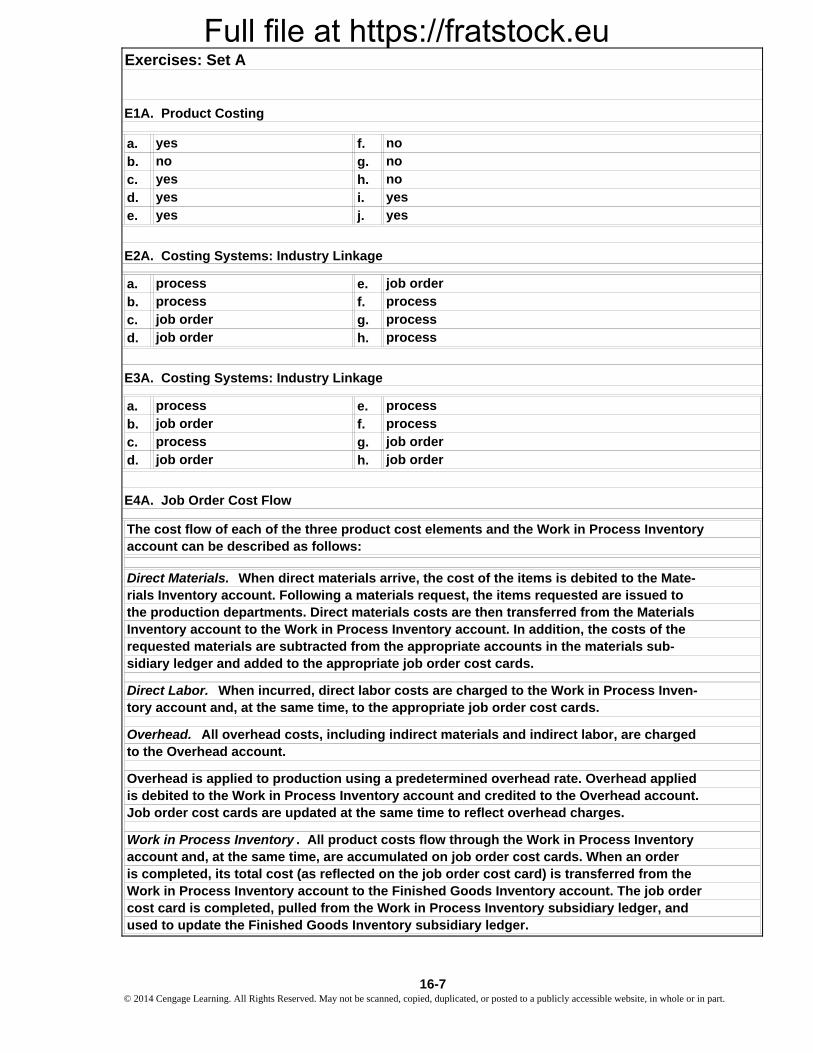
a. f.b. g.c. h.d. i.e. j.
a. e.b. f.c. g.d. h.
a. e.b. f.c. g.d. h.
process processjob order processprocess job orderjob order
Job order cost cards are updated at the same time to reflect overhead charges.
the production departments. Direct materials costs are then transferred from the Materials
is debited to the Work in Process Inventory account and credited to the Overhead account.
rials Inventory account. Following a materials request, the items requested are issued to Direct Materials. When direct materials arrive, the cost of the items is debited to the Mate-
E4A. Job Order Cost Flow
Inventory account to the Work in Process Inventory account. In addition, the costs of the
account can be described as follows:The cost flow of each of the three product cost elements and the Work in Process Inventory
is completed, its total cost (as reflected on the job order cost card) is transferred from the
Work in Process Inventory . All product costs flow through the Work in Process Inventory
Overhead is applied to production using a predetermined overhead rate. Overhead applied
processjob orderjob order process
job order
processprocess
Exercises: Set A
process job order
yes
E1A. Product Costing
sidiary ledger and added to the appropriate job order cost cards.
tory account and, at the same time, to the appropriate job order cost cards.
to the Overhead account.Overhead. All overhead costs, including indirect materials and indirect labor, are charged
used to update the Finished Goods Inventory subsidiary ledger.
no
requested materials are subtracted from the appropriate accounts in the materials sub-
Direct Labor. When incurred, direct labor costs are charged to the Work in Process Inven-
Work in Process Inventory account to the Finished Goods Inventory account. The job order cost card is completed, pulled from the Work in Process Inventory subsidiary ledger, and
account and, at the same time, are accumulated on job order cost cards. When an order
yes yes
no no
yesyesyes
no
E2A. Costing Systems: Industry Linkage
E3A. Costing Systems: Industry Linkage
16-7 © 2014 Cengage Learning. All Rights Reserved. May not be scanned, copied, duplicated, or posted to a publicly accessible website, in whole or in part.
Full file at https://fratstock.eu
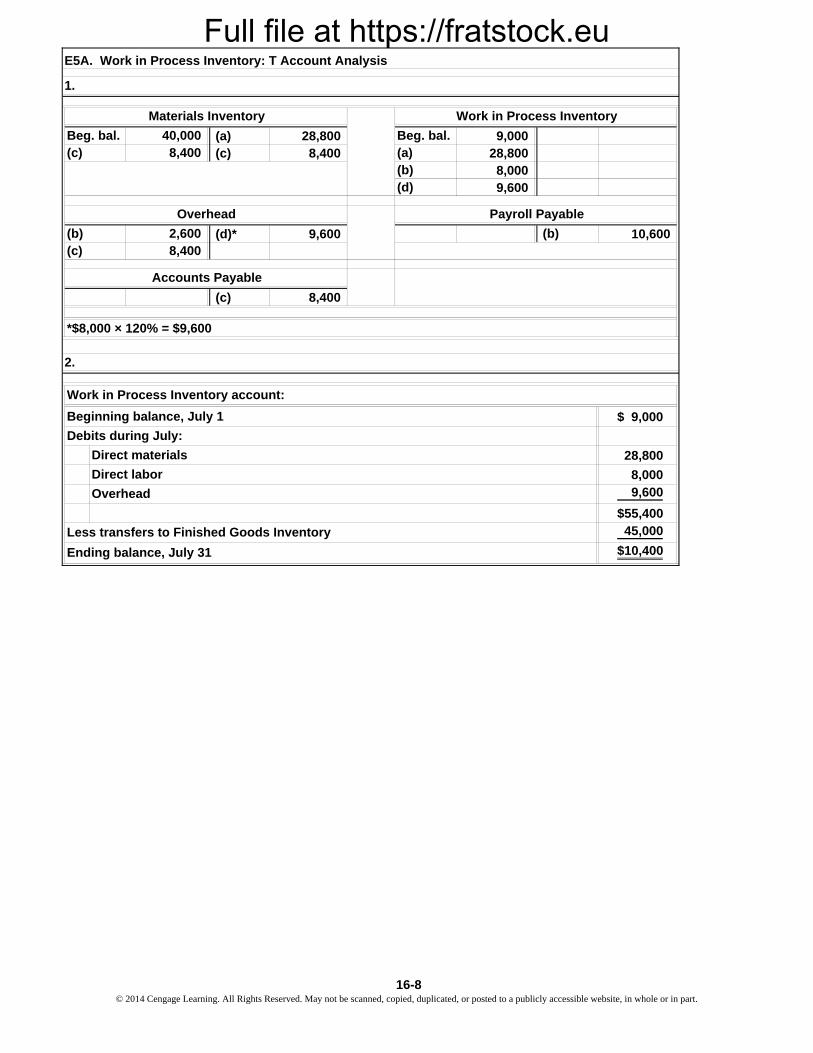
(a) 28,800 9,000 (c) 8,400 28,800
8,0009,600
(d)* 9,600 10,600
(c) 8,400
$ 9,000
28,800
8,000 9,600
$55,40045,000
$10,400
(d)
Beg. bal.
Direct labor
E5A. Work in Process Inventory: T Account Analysis
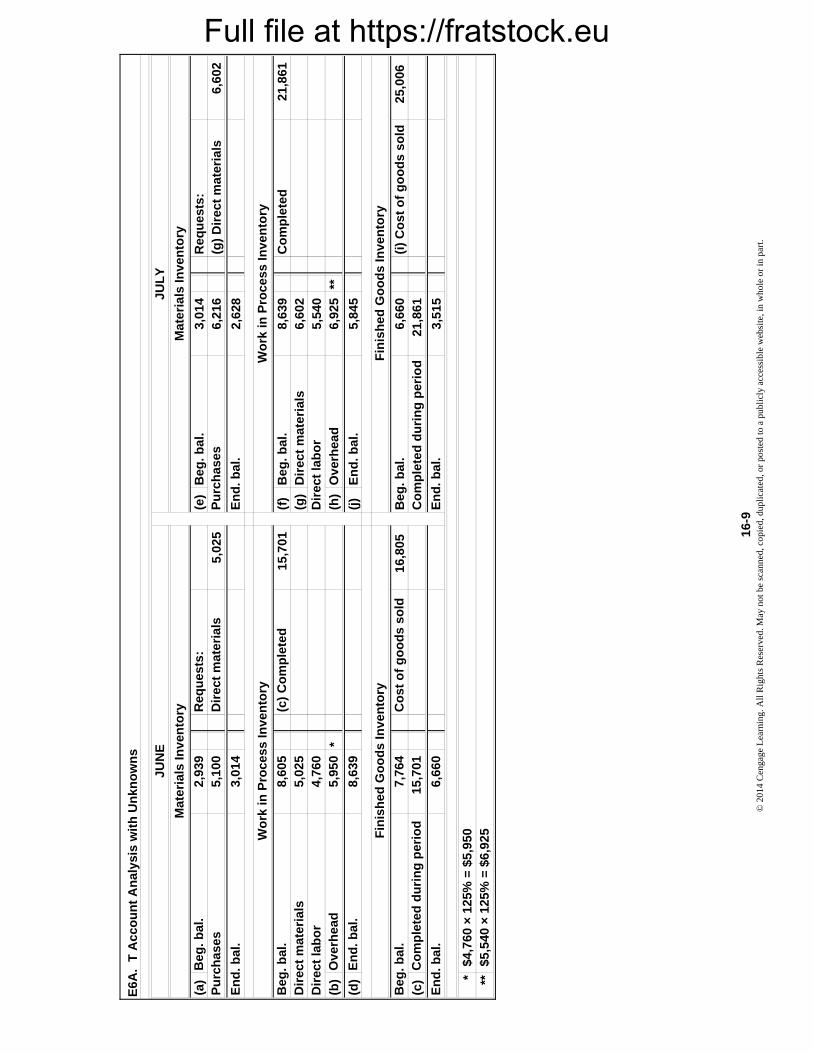
1.
Materials Inventory Work in Process Inventory
(a)
Direct materials
Work in Process Inventory account:
40,000Beg. bal.(c) 8,400
(b)
Beginning balance, July 1
8,400
Overhead Payroll Payable
2,600
*$8,000 × 120% = $9,600
Less transfers to Finished Goods Inventory
Overhead
Accounts Payable
Debits during July:
2.
Ending balance, July 31
(c) (b)(b)
16-8© 2014 Cengage Learning. All Rights Reserved. May not be scanned, copied, duplicated, or posted to a publicly accessible website, in whole or in part.
Full file at https://fratstock.eu
(a)
(e)
Beg
. bal
.3,
014
Req
ues
ts:
5,02
56,
216
(g)
Dir
ect
mat
eria
ls6,
602
2,62
8
15,7
01(f
)B
eg. b
al.
8,63
9C
om
ple
ted
21,8
61(g
)D
irec
t m
ater
ials
6,
602
5,54
0(b
)*
(h)
Ove
rhea
d
6,92
5**
(d)
(j)
En
d. b
al.
5,84
5
16,8
05B
eg. b
al.
6,66
0(i
) C
ost
of
go
od
s so
ld25
,006
(c)
Co
mp
lete
d d
uri
ng
per
iod
21,8
61
3,51
5
* **$5
,540
× 1
25%
= $
6,92
5
Co
st o
f g
oo
ds
sold
En
d. b
al.
En
d. b
al.
$4,7
60 ×
125
% =
$5,
950Fin
ish
ed G
oo
ds
Inve
nto
ry
7,76
4
8,63
9E
nd
. bal
.
6,66
0
15,7
01
Mat
eria
ls In
ven
tory
Wo
rk in
Pro
cess
Inve
nto
ry
Fin
ish
ed G
oo
ds
Inve
nto
ry
E6A
. T
Acc
ou
nt
An
alys
is w
ith
Un
kno
wn
s
Co
mp
lete
d d
uri
ng
per
iod
Ove
rhea
d
Req
ues
ts:
JUL
YJU
NE
Beg
. bal
.
Mat
eria
ls In
ven
tory
2,93
9
(c)
Co
mp
lete
dD
irec
t m
ater
ials
8,
605
Beg
. bal
.5,
025
Dir
ect
lab
or
Beg
. bal
.
5,95
0D
irec
t la
bo
r 4,
760
En
d. b
al.
Pu
rch
ases
5,10
0D
irec
t m
ater
ials
Pu
rch
ases
En
d. b
al.
3,01
4
Wo
rk in
Pro
cess
Inve
nto
ry
16-
9©
201
4 C
enga
ge L
earn
ing.
All
Rig
hts
Res
erve
d. M
ay n
ot b
e sc
anne
d, c
opie
d, d
upli
cate
d, o
r po
sted
to a
pub
licl
y ac
cess
ible
web
site
, in
who
le o
r in
par
t.
Full file at https://fratstock.eu
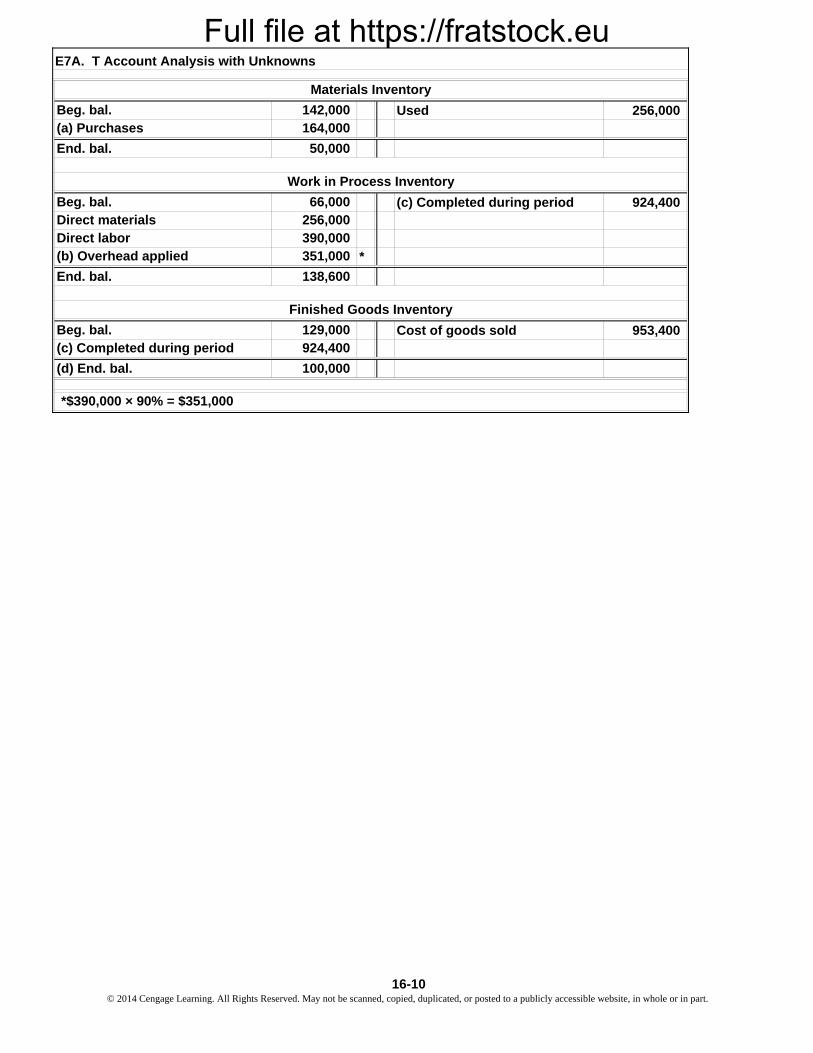
Used 256,000
(c) Completed during period 924,400
*
Cost of goods sold 953,400
Finished Goods Inventory
924,400
100,000
(c) Completed during period
(d) End. bal.
256,000
*$390,000 × 90% = $351,000
129,000Beg. bal.
138,600
E7A. T Account Analysis with Unknowns
66,000
Materials Inventory
Work in Process Inventory
End. bal.
Beg. bal.Direct materials Direct labor (b) Overhead applied
390,000
142,000164,000
50,000
Beg. bal.(a) Purchases
End. bal.
351,000
16-10© 2014 Cengage Learning. All Rights Reserved. May not be scanned, copied, duplicated, or posted to a publicly accessible website, in whole or in part.
Full file at https://fratstock.eu
6/1 300 6/4 290 6/4 250 6/16 2,0506/2 50 6/15 1,000
6/15 800
End. bal. 60 End. bal. —
6/16 2,050 6/20 1,460
End. bal. 590 6/10 350 6/30 706/15 3006/30 180
End. bal. —
6/10 350 6/20 2,000
End. bal. 350 End. bal. 2,000
6/30 30 6/30 150
End. bal. 30 End. bal. 150
6/15 1,300
6/2 50
End. bal. 350
6/20 2,000
6/30 70
End. bal. 1,530
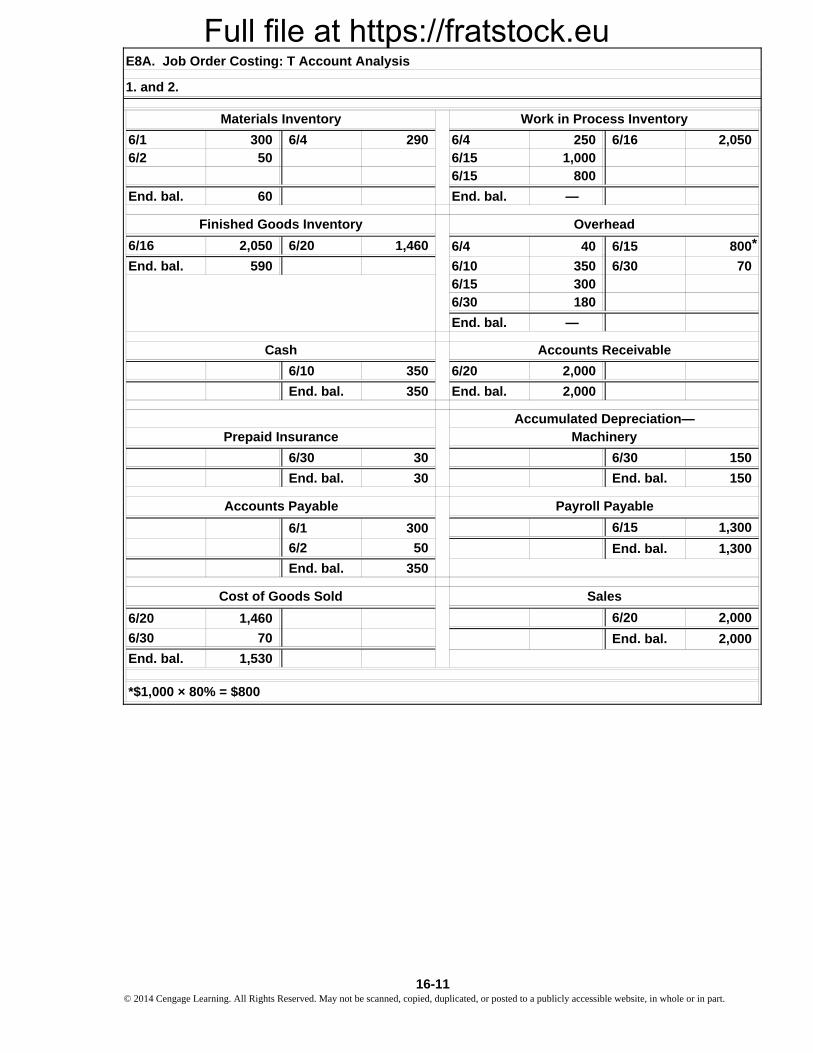
E8A. Job Order Costing: T Account Analysis
1. and 2.
Overhead
Materials Inventory Work in Process Inventory
Finished Goods Inventory
Accounts Receivable
Accumulated Depreciation—
6/4 40 6/15 800
Prepaid Insurance
Cash
Machinery
Accounts Payable Payroll Payable
6/1
End. bal.
Cost of Goods Sold Sales
300
End. bal. 1,300
1,4606/20
2,000
*$1,000 × 80% = $800
*
16-11 © 2014 Cengage Learning. All Rights Reserved. May not be scanned, copied, duplicated, or posted to a publicly accessible website, in whole or in part.
Full file at https://fratstock.eu
Z-6
X
2/24/2014
Previous Total
Months Cost
$17,000
10,500
( $20.00
120
210
150
50
10,600
$38,100÷ 50
$ 762Product unit cost
(
(Finishing hours )
Units completed
Total overhead
(
Total direct materials
Sawing
Assembly
Finishing
Assembly
1,000
2,000
$10,600
2,500
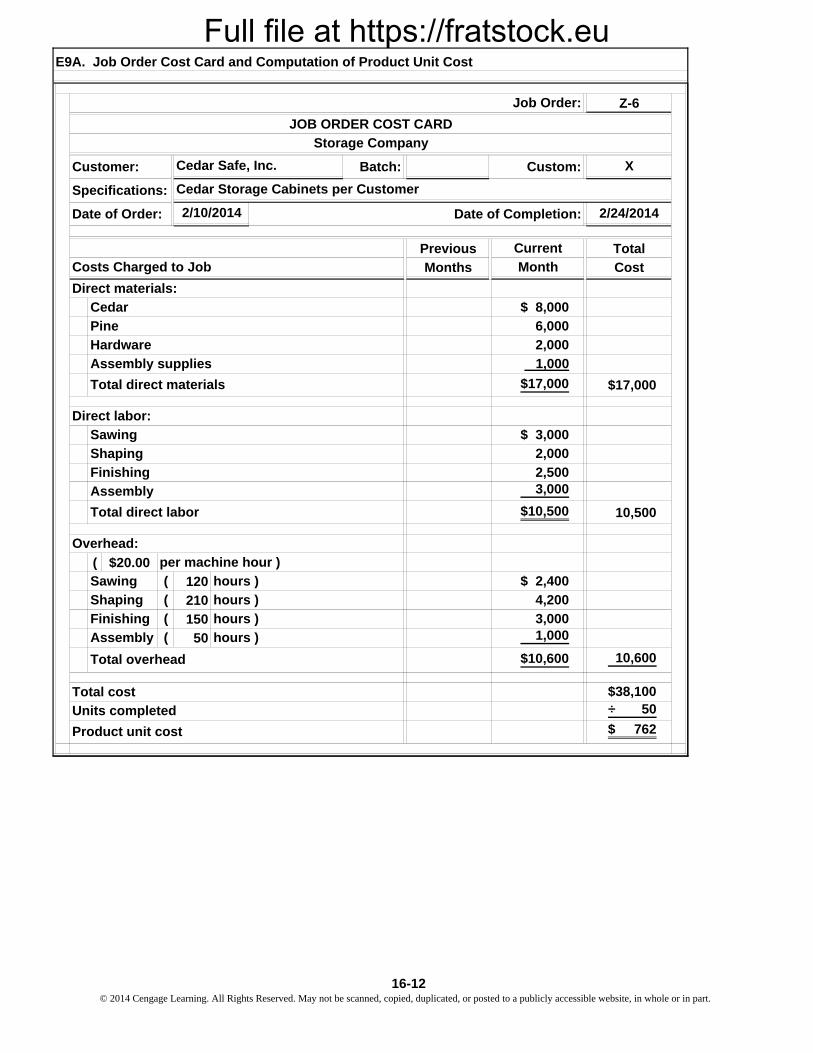
E9A. Job Order Cost Card and Computation of Product Unit Cost
Current
JOB ORDER COST CARD
Storage Company
Month
$17,000
$ 8,000
$ 2,400
Total cost
Direct materials:
2/10/2014
Costs Charged to Job
Shaping
3,000
$ 3,000
$10,500
4,200
hours )
Total direct labor
6,000
2,000
1,000
3,000
Pine
Assembly supplies
hours )
Sawing
Direct labor:
Overhead:
per machine hour )
Shaping
(
Custom:Customer:
Specifications:
hours )
Cedar
Hardware
Cedar Safe, Inc.
Cedar Storage Cabinets per Customer
Date of Order:
Batch:
Date of Completion:
Job Order:
16-12© 2014 Cengage Learning. All Rights Reserved. May not be scanned, copied, duplicated, or posted to a publicly accessible website, in whole or in part.
Full file at https://fratstock.eu
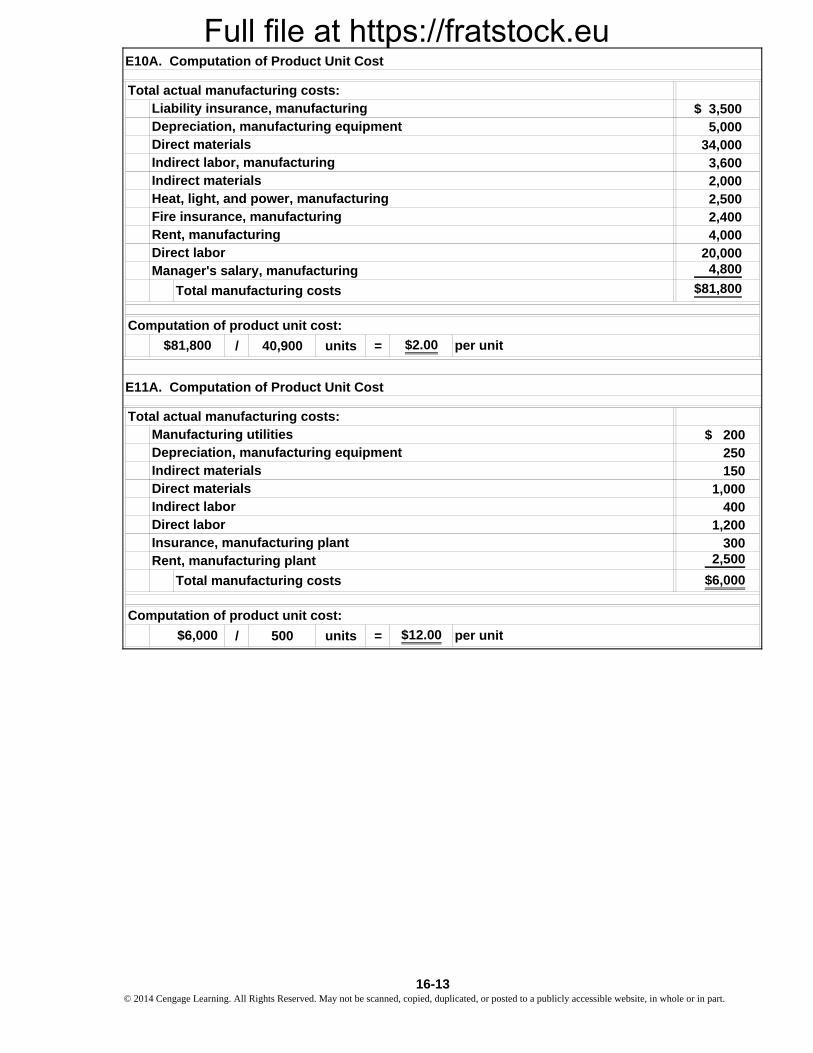
$ 3,5005,000
34,0003,6002,0002,5002,4004,000
20,0004,800
$81,800
/ 40,900 units = $2.00
$ 200250150
1,000400
1,200300
2,500
$6,000
/ 500 units = $12.00$6,000
Insurance, manufacturing plantRent, manufacturing plant
Total actual manufacturing costs:
Direct labor
Computation of product unit cost:
Manufacturing utilities
Indirect labor
Indirect materialsDirect materials
Total manufacturing costs
Depreciation, manufacturing equipment
Liability insurance, manufacturing
Fire insurance, manufacturingRent, manufacturing
per unit
per unit
Total manufacturing costs
Direct labor
E10A. Computation of Product Unit Cost
Depreciation, manufacturing equipment
Total actual manufacturing costs:
$81,800
Heat, light, and power, manufacturing
Direct materials
Computation of product unit cost:
Indirect materials
Manager's salary, manufacturing
Indirect labor, manufacturing
E11A. Computation of Product Unit Cost
16-13 © 2014 Cengage Learning. All Rights Reserved. May not be scanned, copied, duplicated, or posted to a publicly accessible website, in whole or in part.
Full file at https://fratstock.eu
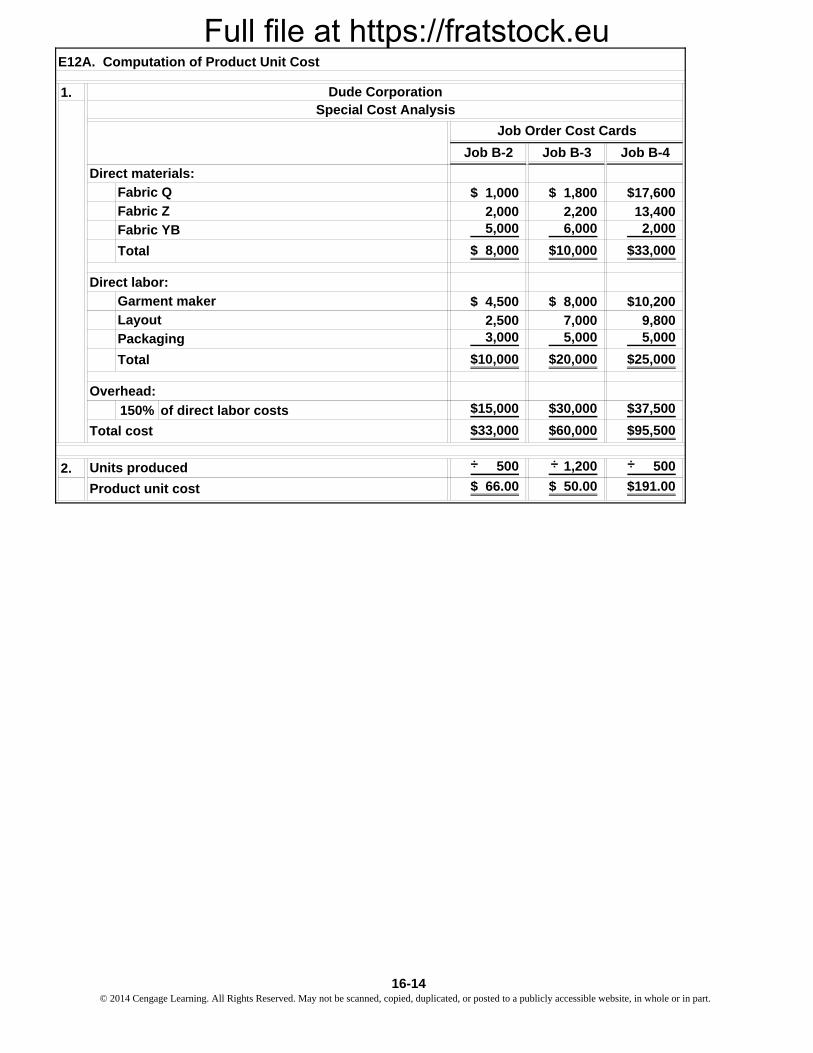
1.
Job B-2 Job B-3 Job B-4
$ 1,000 $ 1,800 $17,600
2,000 2,200 13,4005,000 6,000 2,000
$ 8,000 $10,000 $33,000
$ 4,500 $ 8,000 $10,200
2,500 7,000 9,8003,000 5,000 5,000
$10,000 $20,000 $25,000
150% of direct labor costs $15,000 $30,000 $37,500
$33,000 $60,000 $95,500
2. 500 1,200 500
$ 66.00 $ 50.00 $191.00
Job Order Cost Cards
Overhead:
Total cost
Direct materials:
Fabric YB
Special Cost AnalysisDude Corporation
Fabric Z
Total
Total
Packaging
Garment maker
Direct labor:
Units produced
Product unit cost
E12A. Computation of Product Unit Cost
Fabric Q
Layout
÷ ÷÷
16-14© 2014 Cengage Learning. All Rights Reserved. May not be scanned, copied, duplicated, or posted to a publicly accessible website, in whole or in part.
Full file at https://fratstock.eu
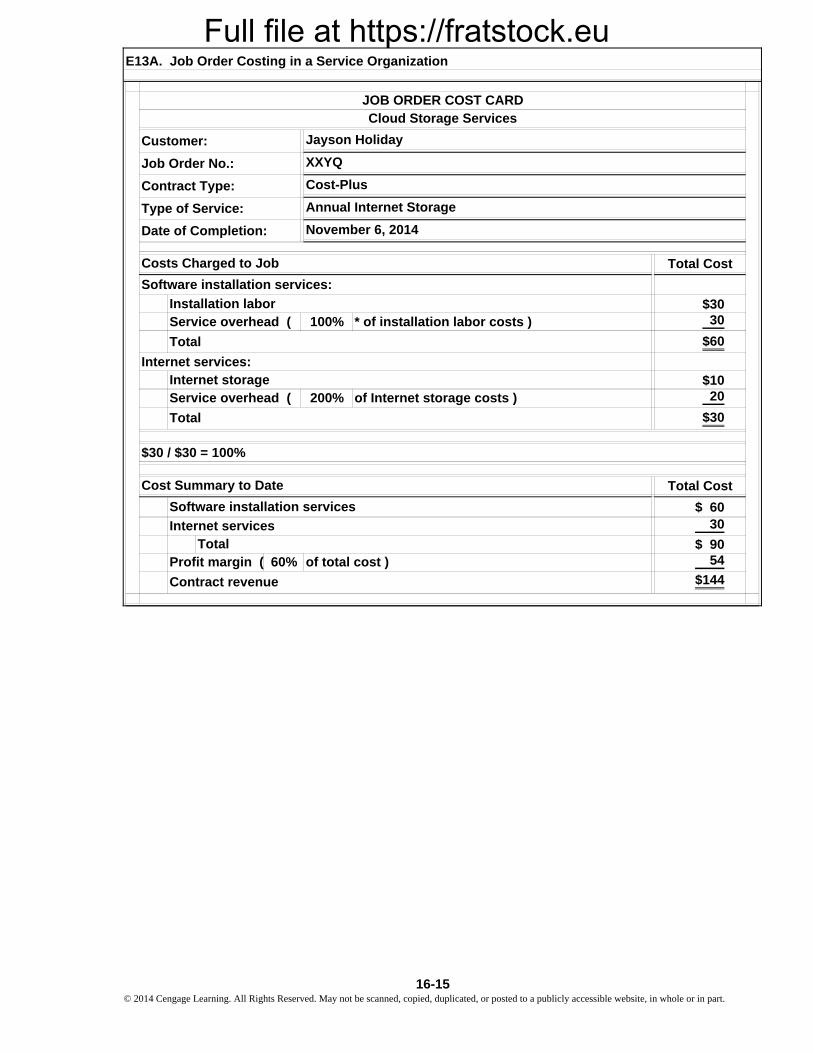
Total Cost
$3030
$60
$1020
$30
Total Cost
$ 6030
$ 9054
$144Contract revenue
Software installation services:
Total
JOB ORDER COST CARD
E13A. Job Order Costing in a Service Organization
Internet services:Internet storage
Installation labor
Jayson Holiday
Costs Charged to Job
Cloud Storage Services
Cost-Plus
Profit margin (
November 6, 2014
Software installation services
Total
100%
XXYQ
$30 / $30 = 100%
Total
* of installation labor costs )
of Internet storage costs )
Service overhead (
Service overhead (
Annual Internet Storage
200%
Date of Completion:
60% of total cost )
Cost Summary to Date
Internet services
Customer:
Job Order No.:
Contract Type:
Type of Service:
16-15 © 2014 Cengage Learning. All Rights Reserved. May not be scanned, copied, duplicated, or posted to a publicly accessible website, in whole or in part.
Full file at https://fratstock.eu
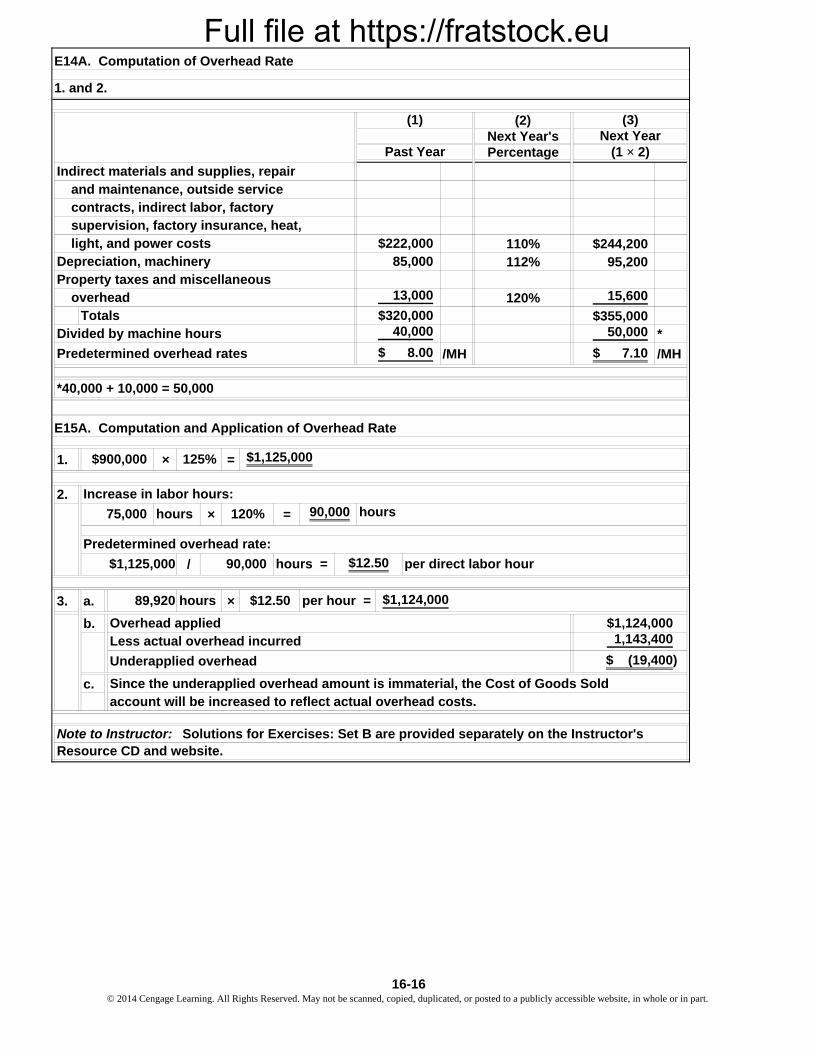
(2)Next Year'sPercentage
110% $244,200112% 95,200
120% 15,600
$355,00050,000 *
/MH $ 7.10 /MH
1. × =
2.
× =
/
3. a. ×
b.
c.
E15A. Computation and Application of Overhead Rate
Overhead applied
125%
75,000 120%
$900,000
Depreciation, machinery
overhead
Next Year
E14A. Computation of Overhead Rate
Divided by machine hours
Predetermined overhead rates
Indirect materials and supplies, repair
1. and 2.
and maintenance, outside service contracts, indirect labor, factory
(3)
(1 × 2)
hours
Increase in labor hours:
$1,125,000 $12.50 per direct labor hour
90,000 hours
$1,124,000
Since the underapplied overhead amount is immaterial, the Cost of Goods Sold account will be increased to reflect actual overhead costs.
Predetermined overhead rate:
$222,000
Property taxes and miscellaneous
supervision, factory insurance, heat,
89,920 hours $12.50
Totals
light, and power costs
$ 8.00
40,000$320,000
13,000
85,000
*40,000 + 10,000 = 50,000
90,000 hours =
$1,125,000
$1,124,0001,143,400
$ (19,400)
Less actual overhead incurred
Underapplied overhead
(1)
Past Year
per hour =
Note to Instructor: Solutions for Exercises: Set B are provided separately on the Instructor's Resource CD and website.
16-16© 2014 Cengage Learning. All Rights Reserved. May not be scanned, copied, duplicated, or posted to a publicly accessible website, in whole or in part.
Full file at https://fratstock.eu
Req
ues
ts82
,320
(e)
Beg
. bal
.38
,910
(h)
Req
ues
ts93
,080
(a)
96,1
20
En
d. b
al.
41,9
50
(c)
Co
mp
lete
d21
2,73
0(f
)B
eg. b
al.
45,7
70C
om
ple
ted
221,
400
(h)
Dir
ect
mat
eria
ls
93,0
80(b
)*
72,2
50(i
)O
verh
ead
57,8
00**
(d)
(k)
En
d. b
al.
47,5
00
Co
st o
f g
oo
ds
sold
209,
050
(g)
Beg
. bal
.47
,940
(j)
Co
st o
f g
oo
ds
sold
218,
160
(c)
221,
400
En
d. b
al.
51,1
80
* **
Pro
ble
ms
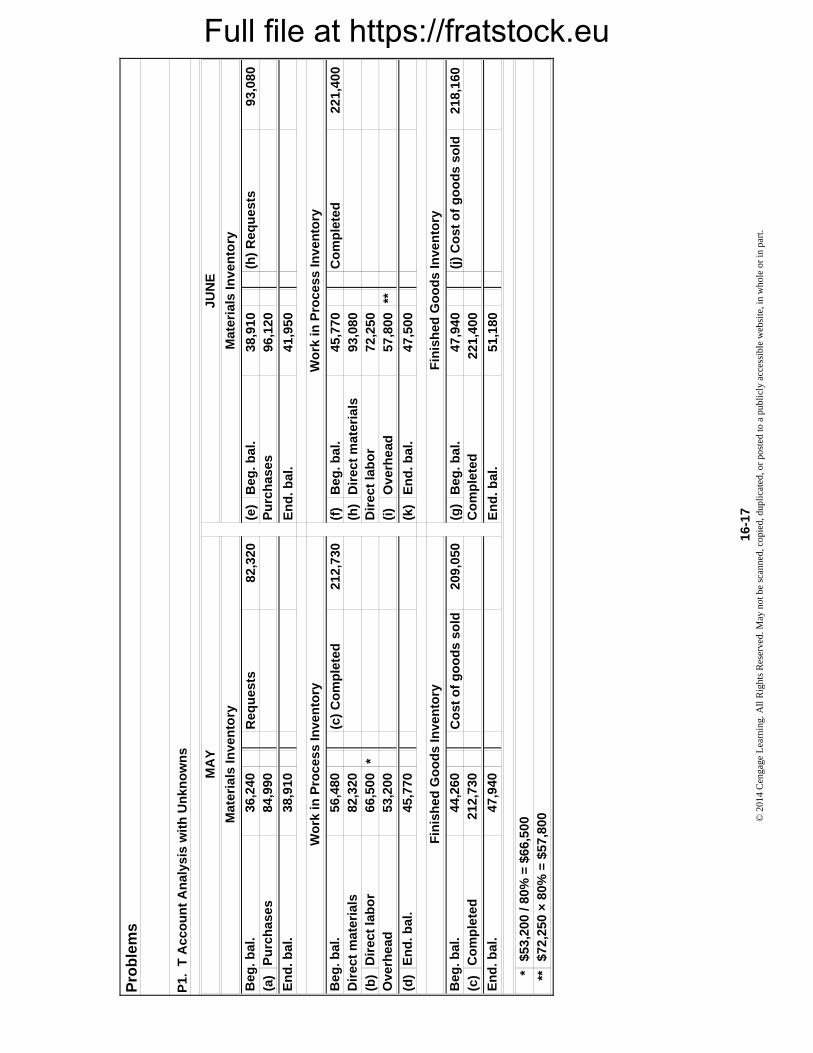
$53,
200
/ 80%
= $
66,5
00$7
2,25
0 ×
80%
= $
57,8
00
Beg
. bal
.
Wo
rk in
Pro
cess
Inve
nto
ry
En
d. b
al.
45,7
70
Fin
ish
ed G
oo
ds
Inve
nto
ry
212,
730
Dir
ect
lab
or
Dir
ect
lab
or
Beg
. bal
.D
irec
t m
ater
ials
Ove
rhea
d66
,500
44,2
60C
om
ple
ted
82,3
20
38,9
10
JUN
E
Mat
eria
ls In
ven
tory
Pu
rch
ases
84,9
90
MA
Y
Co
mp
lete
d
56,4
80
53,2
00
En
d. b
al.
En
d. b
al.
47,9
40
Mat
eria
ls In
ven
tory
Wo
rk in
Pro
cess
Inve
nto
ry
Fin
ish
ed G
oo
ds
Inve
nto
ry
P1.
T A
cco
un
t A
nal
ysis
wit
h U
nkn
ow
ns
Beg
. bal
.36
,240
Pu
rch
ases
16-
17©
201
4 C
enga
ge L
earn
ing.
All
Rig
hts
Res
erve
d. M
ay n
ot b
e sc
anne
d, c
opie
d, d
upli
cate
d, o
r po
sted
to a
pub
licl
y ac
cess
ible
web
site
, in
who
le o
r in
par
t.
Full file at https://fratstock.eu
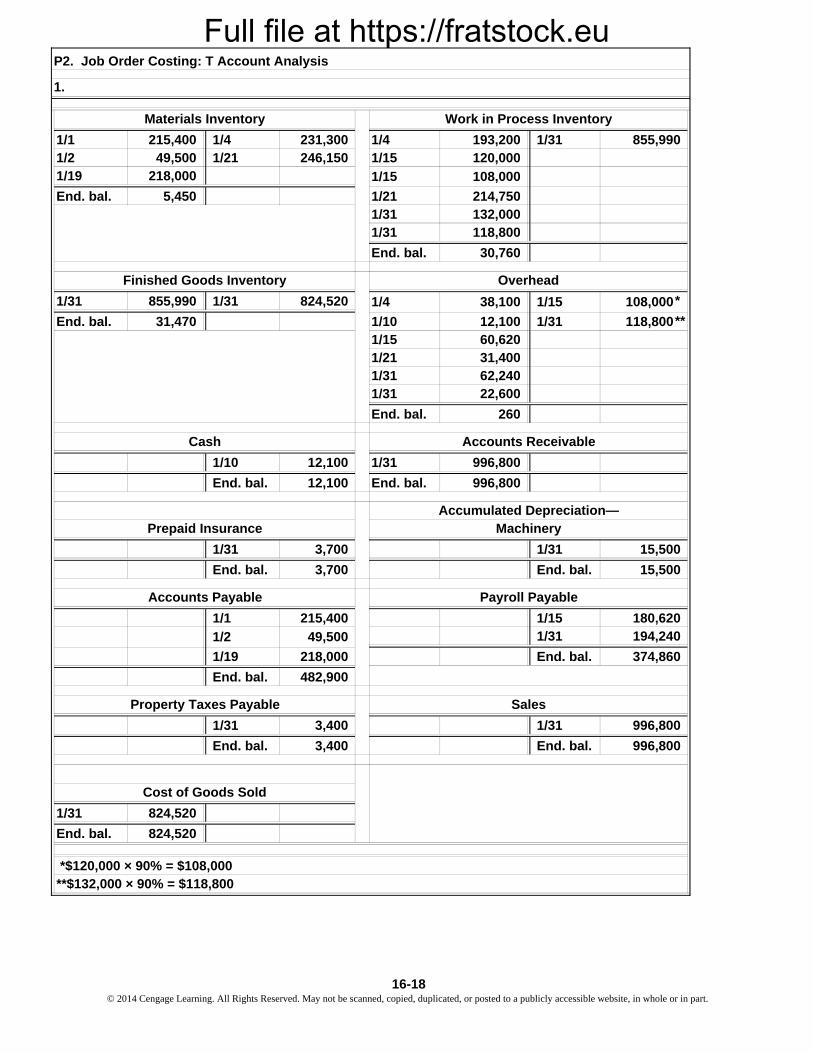
1/1 215,400 1/4 231,300 1/4 193,200 1/31 855,9901/2 49,500 1/21 246,150 1/15 120,0001/19 218,000
End. bal. 5,450 1/21 214,7501/31 132,0001/31 118,800
End. bal. 30,760
1/31 855,990 1/31 824,520
End. bal. 31,470 1/10 12,100 1/31 118,8001/15 60,6201/21 31,4001/31 62,2401/31 22,600
End. bal. 260
1/10 12,100 1/31 996,800
End. bal. 12,100 End. bal. 996,800
1/31 3,700 1/31 15,500
End. bal. 3,700 End. bal. 15,500
1/1 215,400 1/15 180,6201/31 194,240
1/19 218,000 End. bal. 374,860
End. bal. 482,900
1/31 3,400 1/31 996,800
End. bal. 3,400 End. bal. 996,800
1/31 824,520
End. bal. 824,520
1/2 49,500
Payroll Payable
Work in Process Inventory
Accumulated Depreciation—
P2. Job Order Costing: T Account Analysis
1.
Cost of Goods Sold
1/15 108,000
Accounts Receivable
Finished Goods Inventory
Materials Inventory
108,000
Cash
Prepaid Insurance
Overhead
Machinery
1/4 38,100 1/15
**$132,000 × 90% = $118,800 *$120,000 × 90% = $108,000
Accounts Payable
SalesProperty Taxes Payable
*
**
16-18© 2014 Cengage Learning. All Rights Reserved. May not be scanned, copied, duplicated, or posted to a publicly accessible website, in whole or in part.
Full file at https://fratstock.eu
X
X
1/4/2014
PreviousMonths
( 90%
Y
X
1/21/2014
PreviousMonths
( 90%
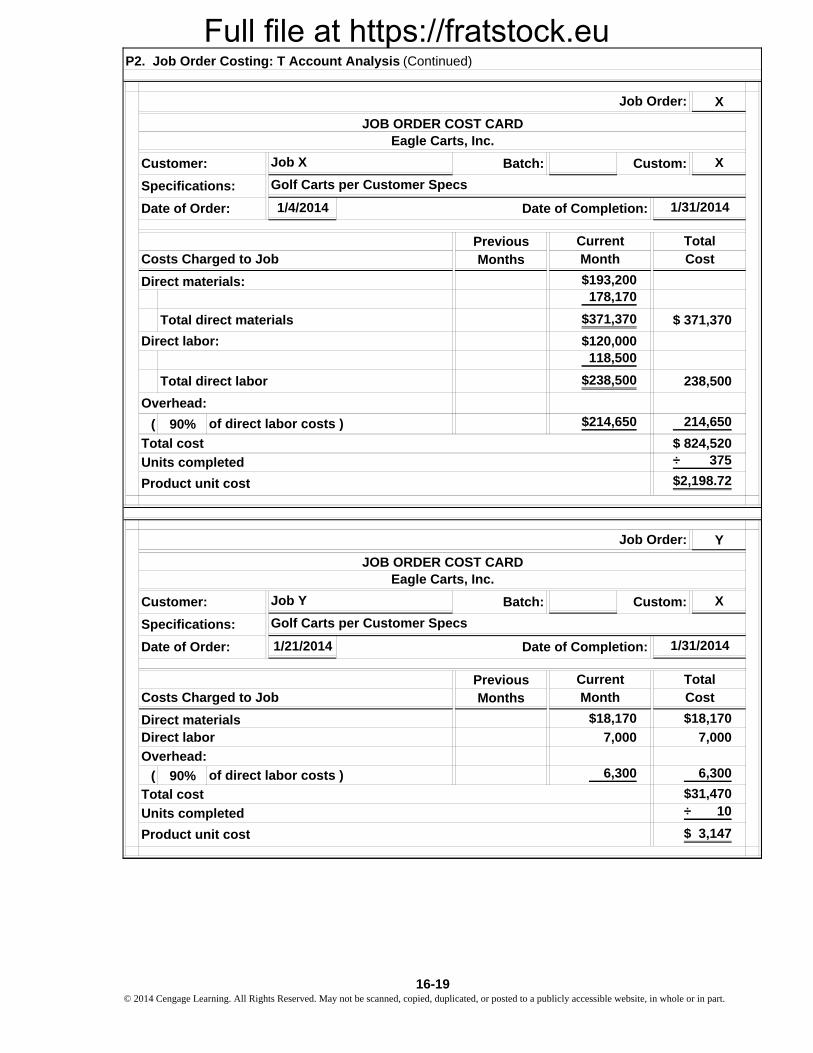
P2. Job Order Costing: T Account Analysis (Continued)
Overhead:
JOB ORDER COST CARD
Job X
Total direct labor
Eagle Carts, Inc.
Costs Charged to Job
Total cost
Total
214,650$214,650of direct labor costs )
118,500
$193,200
Units completed
$ 824,520÷ 375
$2,198.72Product unit cost
Golf Carts per Customer Specs
$238,500
Direct labor:
238,500
$371,370
Cost
Direct materials:178,170
Job Order:
Custom:
Total direct materials
CurrentMonth
$ 371,370
$120,000
Product unit cost
Overhead:
$18,170
Golf Carts per Customer Specs
Direct labor
1/31/2014Date of Order:
Customer:
Specifications:
Batch:
Customer:
JOB ORDER COST CARD
Total cost
$ 3,147
Job Order:
7,000
$31,470
Costs Charged to Job CostMonthTotal
6,300of direct labor costs )
÷ 10
Current
Eagle Carts, Inc.
6,300
7,000
$18,170
Date of Order:
Direct materials
1/31/2014
Batch:
Specifications:
Date of Completion:
Date of Completion:
Custom:Job Y
Units completed
16-19 © 2014 Cengage Learning. All Rights Reserved. May not be scanned, copied, duplicated, or posted to a publicly accessible website, in whole or in part.
Full file at https://fratstock.eu
Z
X
1/21/2014
Previous
Months
(
38,100
12,100
60,620
31,400
62,240
22,600
260
—
824,520
260
824,780
Current
Month
Date of Completion:
Custom:Job Z
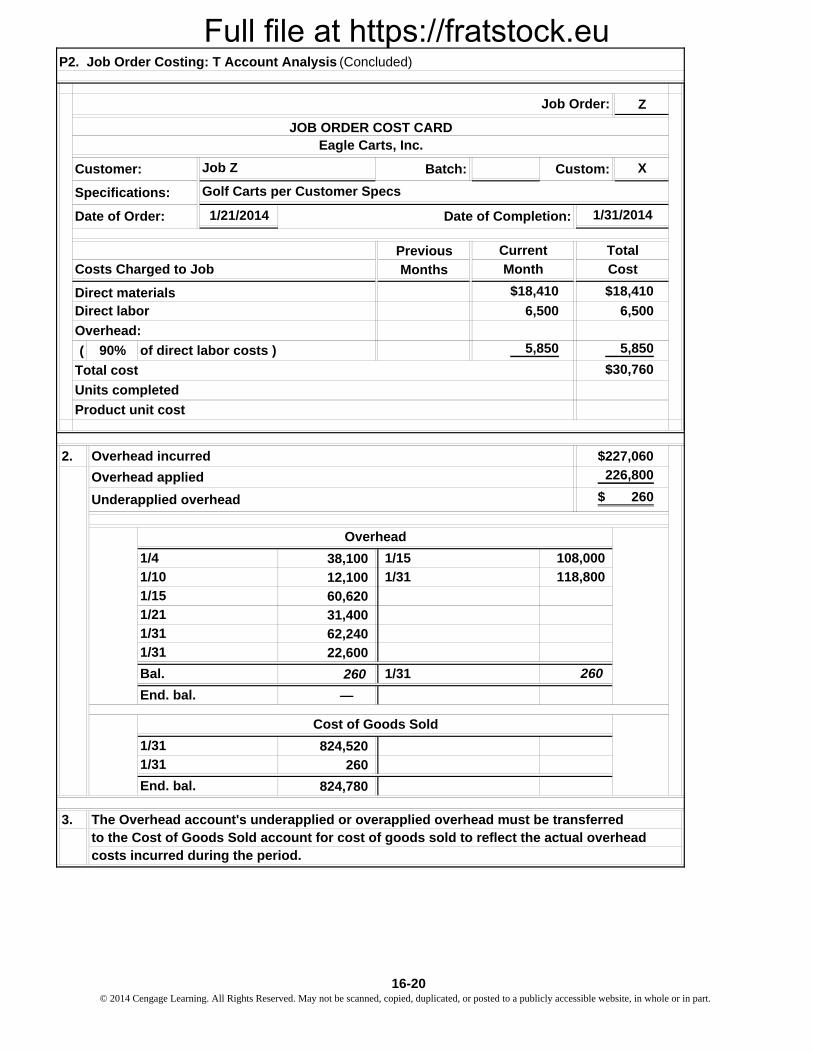
P2. Job Order Costing: T Account Analysis (Concluded)
1/31/2014
Job Order:
Date of Order:
Customer:
Specifications:
Batch:
Product unit cost
Cost
Direct materials
Total cost
Total
$30,760
6,500
Overhead:
JOB ORDER COST CARD
Direct labor
Golf Carts per Customer Specs
5,850
Costs Charged to Job
of direct labor costs )
$18,410
Units completed
5,850
Eagle Carts, Inc.
90%
6,500
$18,410
1/31
Overhead applied
Underapplied overhead
End. bal.
End. bal.
1/31
1/31
1/15
Overhead incurred $227,060
Overhead
108,000
1/31
226,800
$ 260
118,800
Cost of Goods Sold
2.
1/10
1/15
1/21
1/31
1/31
3.
Bal. 260
The Overhead account's underapplied or overapplied overhead must be transferredto the Cost of Goods Sold account for cost of goods sold to reflect the actual overhead costs incurred during the period.
1/4
16-20© 2014 Cengage Learning. All Rights Reserved. May not be scanned, copied, duplicated, or posted to a publicly accessible website, in whole or in part.
Full file at https://fratstock.eu
15,112 6/30 185,073 a
37,240
23,680
38,960
25,960
33,748
20,411 b
6/15 30,784 c
a 6/29 33,748 d
End. bal. 64,532
6/29 25,960
End. bal. 49,640
183,000
183,000
a
b
c
d
183,000Beg. bal.
End. bal.
Materials Inventory
End. bal.
17,120
19,193
Cost of Goods Sold
6/23
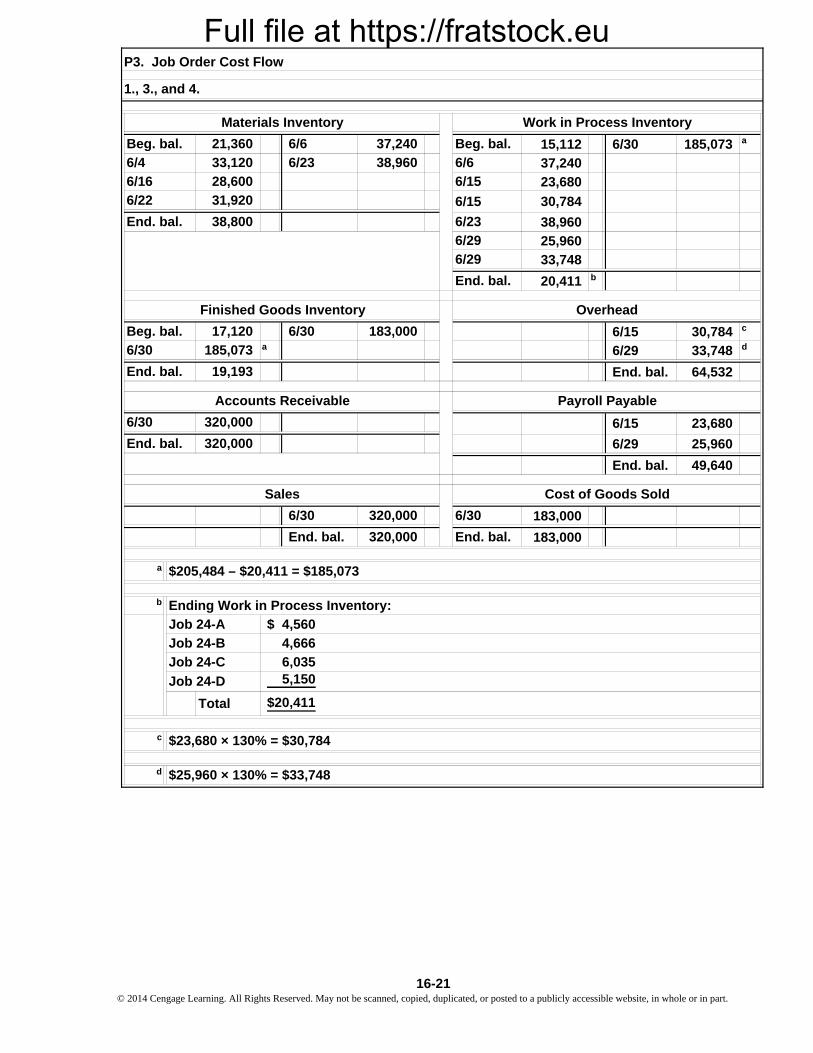
P3. Job Order Cost Flow
38,960
6/6
Work in Process Inventory
1., 3., and 4.
6/22
Overhead
30,784
6/30
Sales
6/30
Ending Work in Process Inventory:
$25,960 × 130% = $33,748
5,150Job 24-D
End. bal. 320,000
320,000End. bal.
33,120
Beg. bal.
6/4
320,000
23,680
Payroll Payable
End. bal.
Accounts Receivable
6/30 6/15320,000
6/16
Beg. bal.
6/6
6/15
38,800
28,600
31,920
21,360
6/23
37,240
Finished Goods Inventory
6/30
185,0736/30
6/29
Total
$205,484 – $20,411 = $185,073
Job 24-A
Job 24-B
End. bal.
6/15
6/29
$ 4,560
4,666
6,035Job 24-C
$23,680 × 130% = $30,784
$20,411
16-21 © 2014 Cengage Learning. All Rights Reserved. May not be scanned, copied, duplicated, or posted to a publicly accessible website, in whole or in part.
Full file at https://fratstock.eu
DirectLabor Overhead Total
$1,290 $1,677 $ 4,5601,380 1,794 4,6661,760 2,288 6,0351,540 2,002 5,150
$5,970 $7,761 $20,411
$ 15,112190,372
$205,48420,411
$185,073
4.$4,560
9601,248
$6,768
/ 1,800
$6,035
1,6102,093
$9,738
/ 900
Total cost
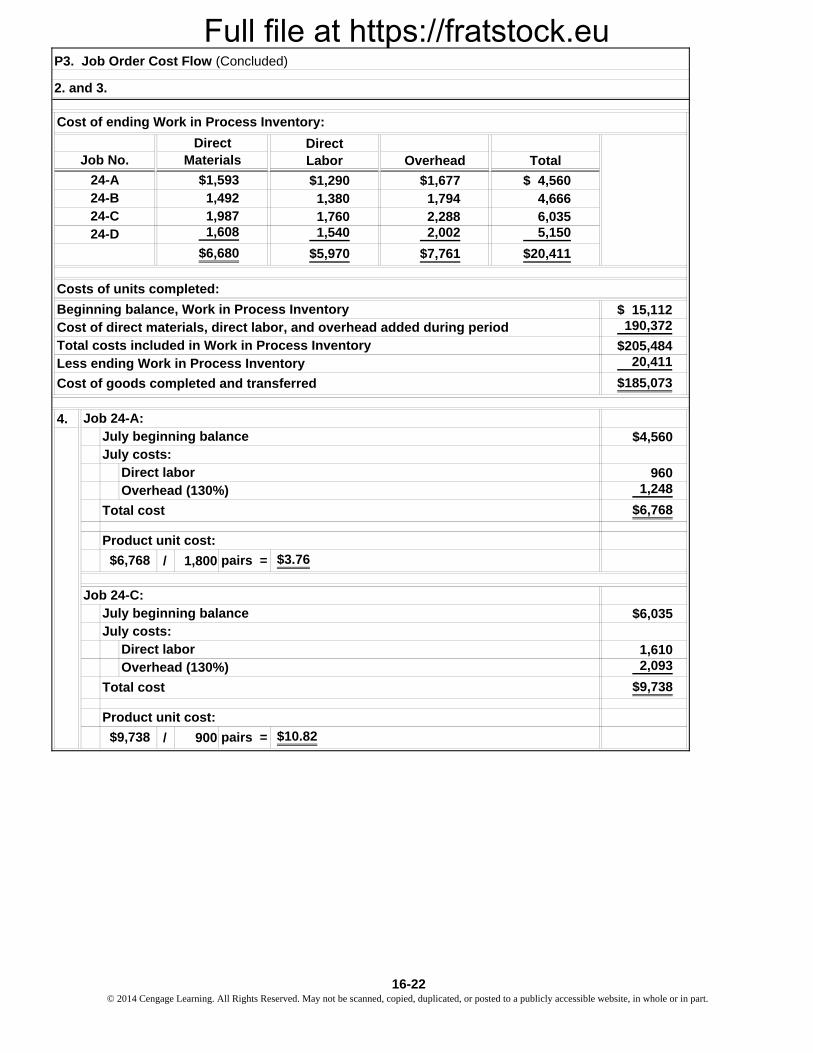
Product unit cost:
$9,738 pairs = $10.82
July beginning balanceJuly costs:
Direct laborOverhead (130%)
Job 24-C:
Overhead (130%)
Total cost
Product unit cost:
$6,768 pairs = $3.76
Less ending Work in Process Inventory
Cost of goods completed and transferred
Cost of direct materials, direct labor, and overhead added during periodTotal costs included in Work in Process Inventory
Beginning balance, Work in Process Inventory
24-B
Job No.
24-A
Direct
P3. Job Order Cost Flow (Concluded)
2. and 3.
1,9871,60824-D
24-C
July costs:Direct labor
Costs of units completed:
Job 24-A:July beginning balance
$1,5931,492
$6,680
Cost of ending Work in Process Inventory:
Materials
16-22© 2014 Cengage Learning. All Rights Reserved. May not be scanned, copied, duplicated, or posted to a publicly accessible website, in whole or in part.
Full file at https://fratstock.eu
1.
(2) (3)Projected Projection
Percentage This YearIncrease (1 × 2)
130% $ 30,550130% 37,180110% 20,350140% 21,000120% 9,360110% 13,310
120% 25,560130% 7,800
$165,110
$165,110 68,786
2. OverheadApplied
$ 29,52034,08023,52032,64027,12019,440
$166,320
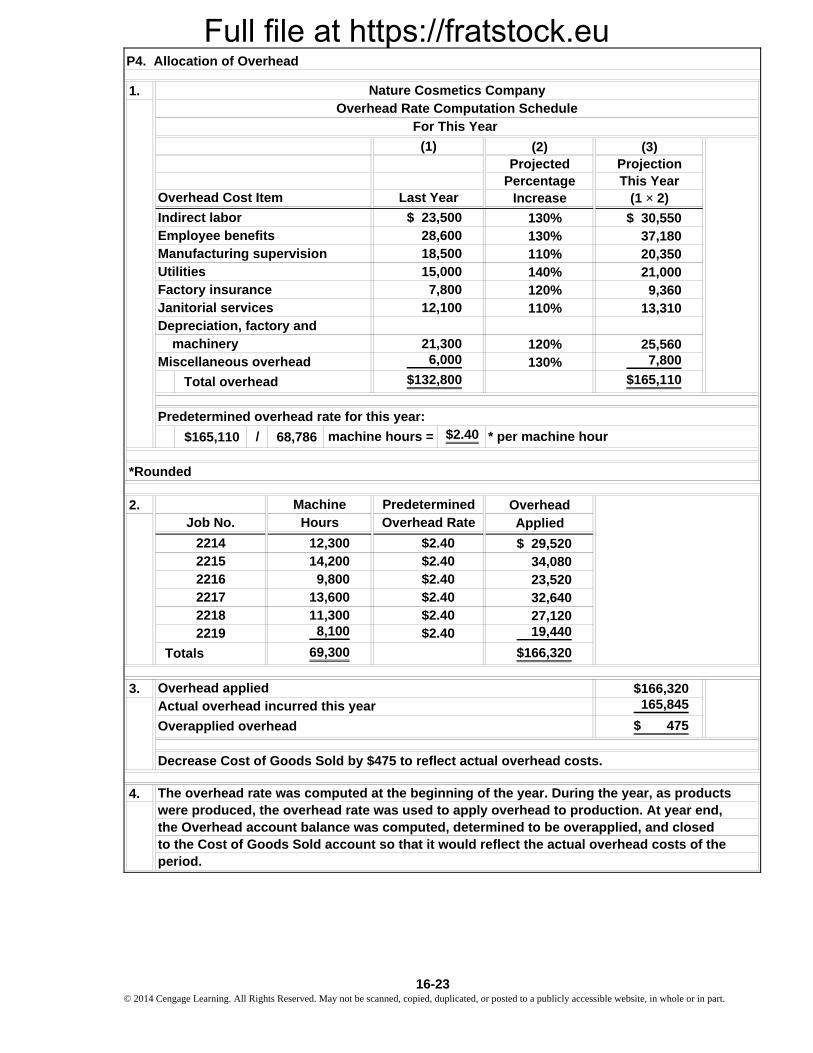
3. $166,320165,845
$ 475
4.
period.
The overhead rate was computed at the beginning of the year. During the year, as products were produced, the overhead rate was used to apply overhead to production. At year end,the Overhead account balance was computed, determined to be overapplied, and closed to the Cost of Goods Sold account so that it would reflect the actual overhead costs of the
Overapplied overhead
Overhead appliedActual overhead incurred this year
Decrease Cost of Goods Sold by $475 to reflect actual overhead costs.
13,60011,3008,100
69,300
22142215
$2.40$2.40
12,30014,2009,800
$2.40$2.40$2.40$2.40
22182219
Totals
2217
machinery
Total overhead
Indirect laborEmployee benefitsManufacturing supervision
2216
Miscellaneous overhead
Job No.Machine
Hours
Overhead Cost Item
P4. Allocation of Overhead
Predetermined overhead rate for this year:
/
UtilitiesFactory insurance
* per machine hour$2.40
28,60018,50015,000
21,3006,000
7,80012,100
PredeterminedOverhead Rate
machine hours =
$132,800
Janitorial servicesDepreciation, factory and
Last Year
$ 23,500
Nature Cosmetics Company
*Rounded
Overhead Rate Computation ScheduleFor This Year
(1)
16-23 © 2014 Cengage Learning. All Rights Reserved. May not be scanned, copied, duplicated, or posted to a publicly accessible website, in whole or in part.
Full file at https://fratstock.eu
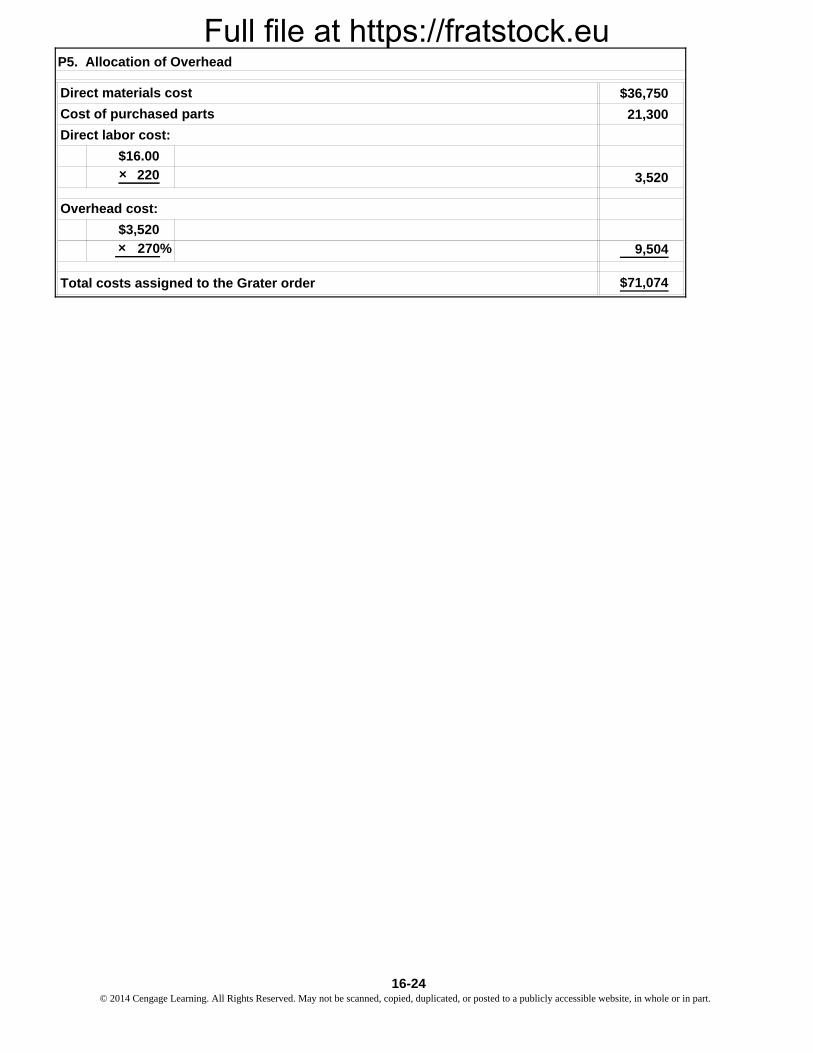
$36,750
21,300
3,520
9,504
$71,074
Direct materials cost
Cost of purchased parts
$16.00
220
270%
Total costs assigned to the Grater order
Overhead cost:
$3,520
P5. Allocation of Overhead
Direct labor cost:
×
×
16-24© 2014 Cengage Learning. All Rights Reserved. May not be scanned, copied, duplicated, or posted to a publicly accessible website, in whole or in part.
Full file at https://fratstock.eu
Req
ues
ts77
,000
(e)
Beg
. bal
.27
,000
(h)
Req
ues
ts50
,000
(a)
31,0
00
En
d. b
al.
8,00
0
(c)
Co
mp
lete
d16
4,00
0(f
)B
eg. b
al.
38,5
64C
om
ple
ted
167,
000
(h)
Dir
ect
mat
eria
ls
50,0
00(b
)*
44,0
00(i
)O
verh
ead
48,4
00**
(d)
(k)
En
d. b
al.
13,9
64
Co
st o
f g
oo
ds
sold
188,
000
(g)
Beg
. bal
.12
,000
(j)
Co
st o
f g
oo
ds
sold
160,
000
(c)
167,
000
En
d. b
al.
19,0
00
* **
Dir
ect
lab
or
Wo
rk in
Pro
cess
Inve
nto
ry
En
d. b
al.
Ove
rhea
d
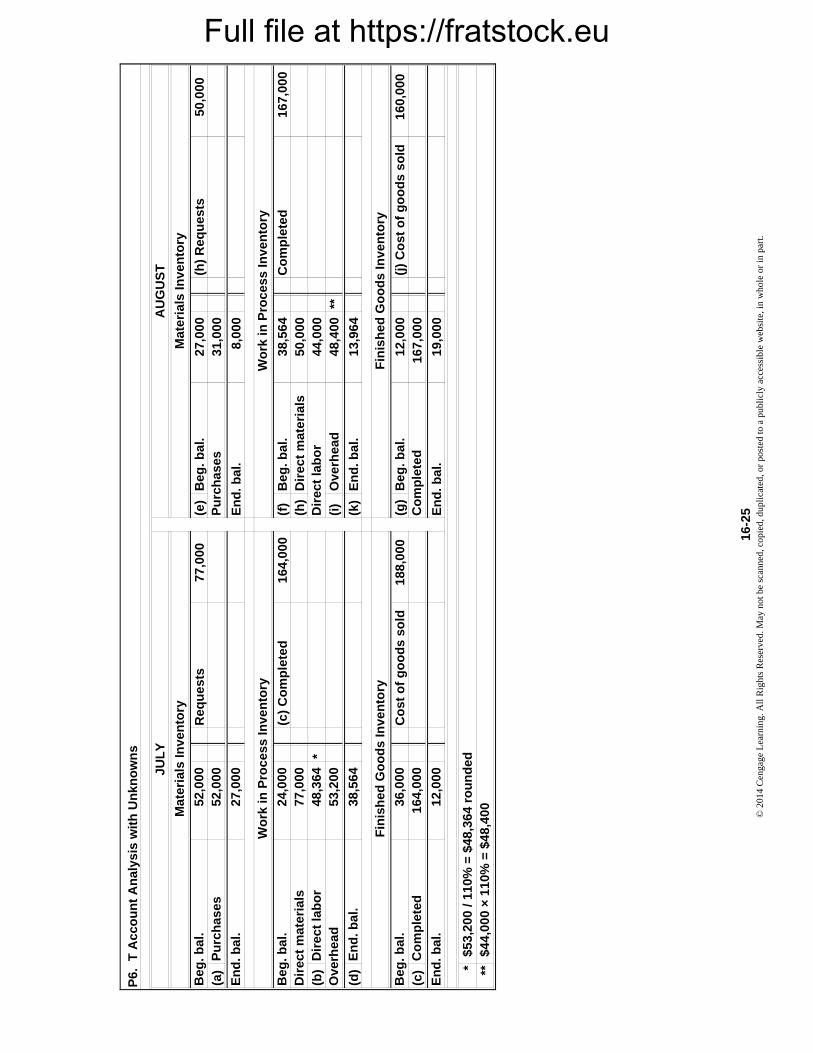
$53,
200
/ 110
% =
$48
,364
ro
un
ded
27,0
00
Pu
rch
ases
52,0
00JUL
Y
Dir
ect
mat
eria
ls
Dir
ect
lab
or
24,0
00
Beg
. bal
.
Beg
. bal
.
Beg
. bal
.
77,0
00
Pu
rch
ases
P6.
T A
cco
un
t A
nal
ysis
wit
h U
nkn
ow
ns
52,0
00
AU
GU
ST
Mat
eria
ls In
ven
tory
Mat
eria
ls In
ven
tory
Fin
ish
ed G
oo
ds
Inve
nto
ry
36,0
00
Fin
ish
ed G
oo
ds
Inve
nto
ry
53,2
0048
,364
Wo
rk in
Pro
cess
Inve
nto
ry
38,5
64
164,
000
Co
mp
lete
dC
om
ple
ted
12,0
00E
nd
. bal
.
$44,
000
× 1
10%
= $
48,4
00
En
d. b
al.
16-
25©
201
4 C
enga
ge L
earn
ing.
All
Rig
hts
Res
erve
d. M
ay n
ot b
e sc
anne
d, c
opie
d, d
upli
cate
d, o
r po
sted
to a
pub
licl
y ac
cess
ible
web
site
, in
who
le o
r in
par
t.
Full file at https://fratstock.eu
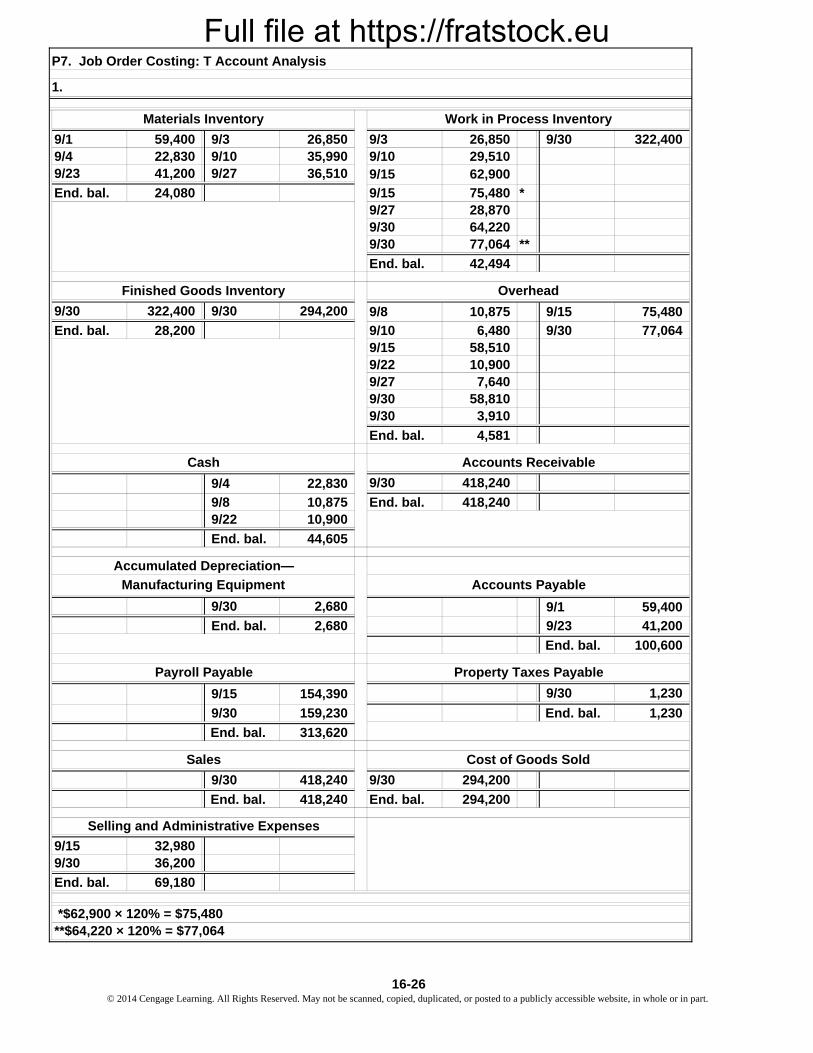
9/1 59,400 9/3 26,850 9/3 26,850 9/30 322,4009/4 22,830 9/10 35,990 9/10 29,5109/23 41,200 9/27 36,510
End. bal. 24,080 9/15 75,480 *9/27 28,8709/30 64,2209/30 77,064 **
End. bal. 42,494
9/30 322,400 9/30 294,200
End. bal. 28,200 9/10 6,480 9/30 77,0649/15 58,5109/22 10,9009/27 7,6409/30 58,8109/30 3,910
End. bal. 4,581
9/30 418,240
9/8 10,875 End. bal. 418,2409/22 10,900
End. bal. 44,605
9/30 2,680
End. bal. 2,680 9/23 41,200
End. bal. 100,600
9/30 1,230
9/30 159,230 End. bal. 1,230
End. bal. 313,620
9/30 418,240 9/30 294,200
End. bal. 418,240 End. bal. 294,200
9/15 32,9809/30 36,200
End. bal. 69,180
Cost of Goods Sold
Property Taxes Payable
Selling and Administrative Expenses
Sales
9/15 154,390
P7. Job Order Costing: T Account Analysis
*$62,900 × 120% = $75,480
9/4 22,830
Overhead
10,875
62,9009/15
Accounts Receivable
9/8 75,480
Finished Goods Inventory
9/15
**$64,220 × 120% = $77,064
Work in Process InventoryMaterials Inventory
1.
Cash
59,400
Accumulated Depreciation—
Accounts PayableManufacturing Equipment
Payroll Payable
9/1
16-26© 2014 Cengage Learning. All Rights Reserved. May not be scanned, copied, duplicated, or posted to a publicly accessible website, in whole or in part.
Full file at https://fratstock.eu
A
X
9/3/14
Previous
Months
( 120%
B
X
9/27/14
Previous
Months
( 120%
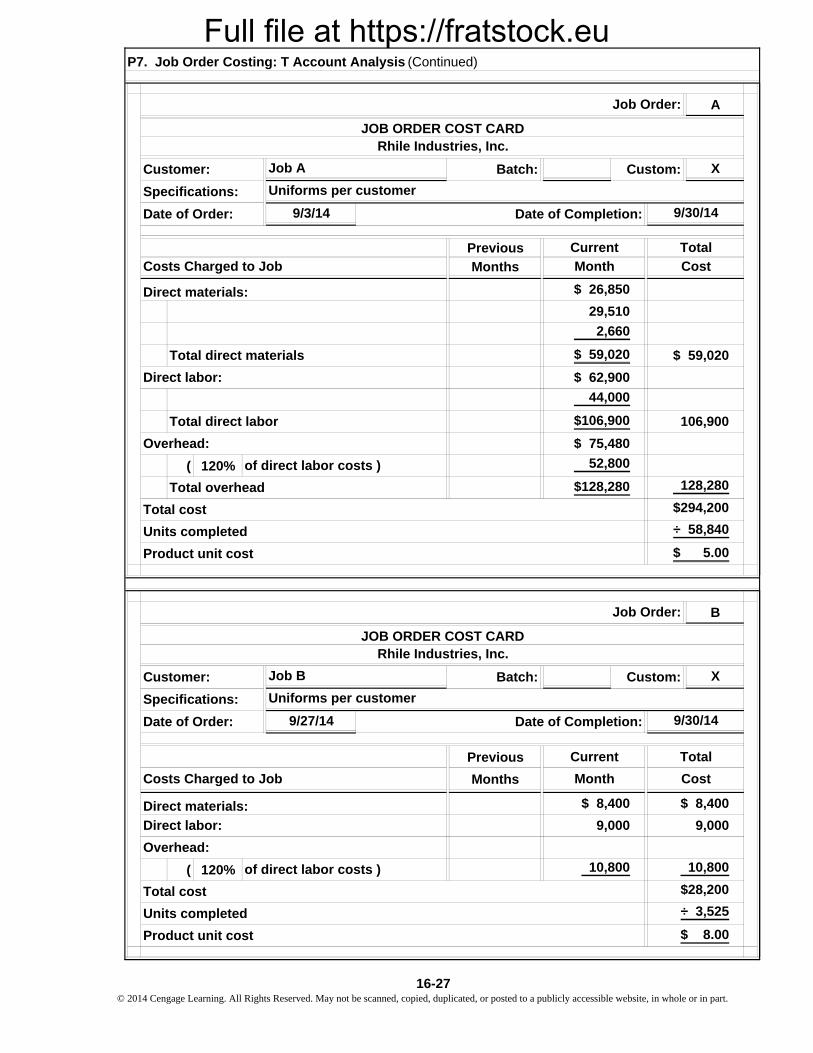
Product unit cost $ 8.00
Total cost $28,200
Units completed ÷ 3,525
of direct labor costs ) 10,800 10,800
Overhead:
Direct materials: $ 8,400 $ 8,400
9,000 9,000Direct labor:
Cost
Current Total
Costs Charged to Job Month
Date of Order: Date of Completion: 9/30/14
Specifications: Uniforms per customer
Rhile Industries, Inc.
Customer: Job B Batch: Custom:
Job Order:
JOB ORDER COST CARD
9/30/14
Job Order:
Rhile Industries, Inc.
Current
Date of Completion:
Customer: Batch:
Date of Order:
Specifications:
JOB ORDER COST CARD
Uniforms per customer
Custom:
Units completed
Product unit cost
Total
Costs Charged to Job
÷ 58,840
128,280
P7. Job Order Costing: T Account Analysis (Continued)
$294,200
$128,280
Total direct materials
$ 75,480
$106,900 106,900
Direct labor:
of direct labor costs )
Total cost
44,000
$ 59,020
2,660
$ 62,900
52,800
Job A
Direct materials: $ 26,850
Month Cost
$ 59,020
29,510
$ 5.00
Total overhead
Overhead:
Total direct labor
16-27 © 2014 Cengage Learning. All Rights Reserved. May not be scanned, copied, duplicated, or posted to a publicly accessible website, in whole or in part.
Full file at https://fratstock.eu
C
X
9/27/14
Previous
Months
120%
2.
10,875
6,480
58,510
10,900
7,640
58,810
3,910
4,581
—
294,200
4,581
298,781
3.
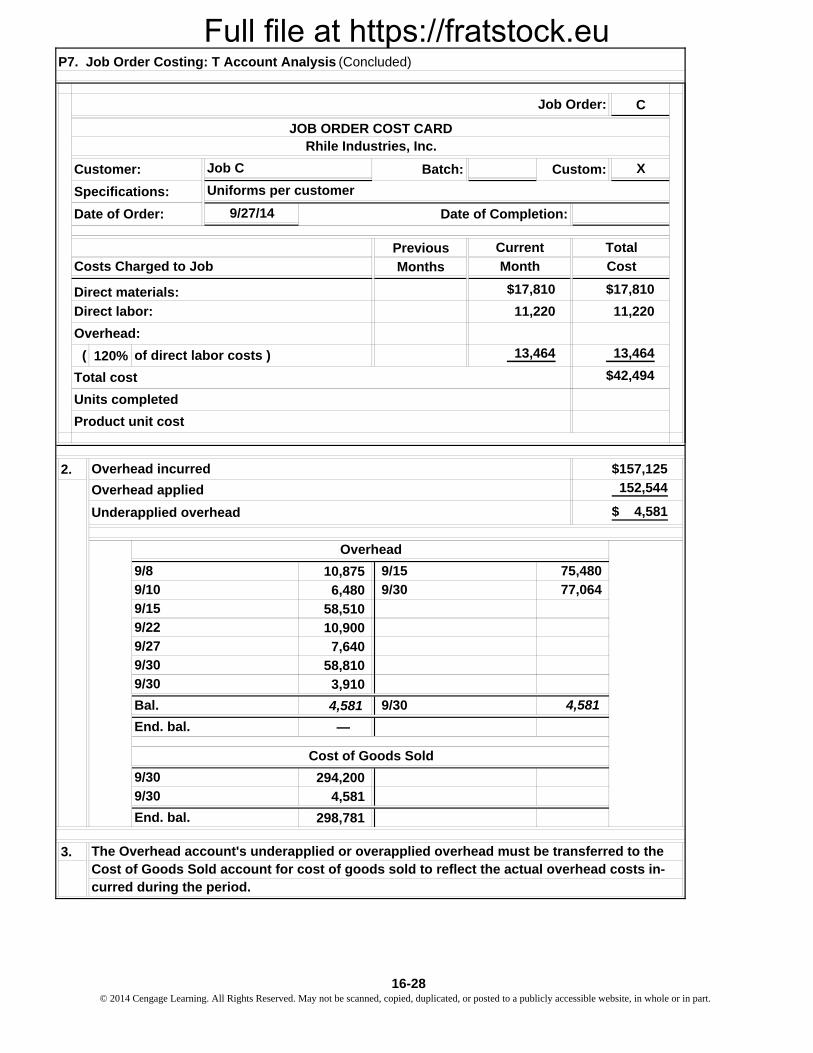
P7. Job Order Costing: T Account Analysis (Concluded)
Job Order:
JOB ORDER COST CARDRhile Industries, Inc.
Customer: Job C Batch:
Specifications: Uniforms per customer
Date of Order: Date of Completion:
Custom:
Current Total
Costs Charged to Job Month Cost
Direct materials: $17,810
11,220
$17,810
11,220
13,464 13,464
Direct labor:
of direct labor costs )(
Overhead:
Total cost $42,494
Units completed
Product unit cost
77,064
Overhead incurred
Overhead applied
Underapplied overhead
Cost of Goods Sold
75,480
9/30
9/30
Bal.
Overhead
9/8
9/10
9/15
4,581
9/22
9/27
9/30
The Overhead account's underapplied or overapplied overhead must be transferred to the Cost of Goods Sold account for cost of goods sold to reflect the actual overhead costs in-curred during the period.
End. bal.
9/30
9/30
End. bal.
$157,125
152,544
$ 4,581
9/15
9/30
16-28© 2014 Cengage Learning. All Rights Reserved. May not be scanned, copied, duplicated, or posted to a publicly accessible website, in whole or in part.
Full file at https://fratstock.eu
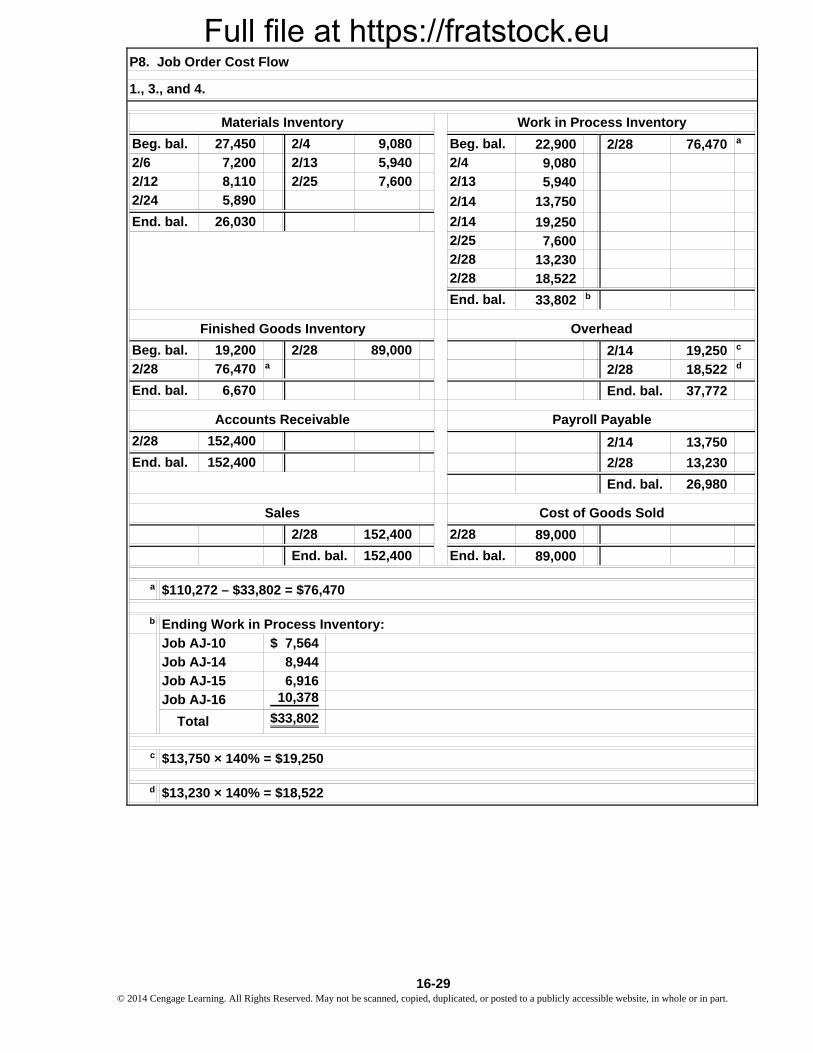
22,900 2/28 76,470 a
9,080
5,940
19,250
7,600
13,230
18,522
33,802 b
2/14 19,250 c
a 2/28 18,522 d
End. bal. 37,772
2/28 13,230
End. bal. 26,980
89,000
89,000
a
b
c
d
Total
8,944
$ 7,564
10,3786,916Job AJ-15
Job AJ-16$33,802
Job AJ-10
Job AJ-14
2/14
2/25
$110,272 – $33,802 = $76,470
2/28
2/28
Finished Goods Inventory
2/28
76,470
End. bal.
Materials Inventory
8,110
5,890
7,600
27,450
2/13
9,080
1., 3., and 4.
2/12
Beg. bal.
2/4
2/13
26,030
2/25
Accounts Receivable
2/28 2/14152,400
Payroll Payable
7,200
Beg. bal.
2/6
152,400
End. bal.
13,750
2/28
End. bal. 152,400
Ending Work in Process Inventory:
$13,230 × 140% = $18,522
$13,750 × 140% = $19,250
2/28
152,400
End. bal.
Work in Process Inventory
2/14
Sales Cost of Goods Sold
P8. Job Order Cost Flow
5,940
2/4
Beg. bal.
6,670
2/28
End. bal.
13,7502/24
19,200 89,000
Overhead
End. bal.
16-29 © 2014 Cengage Learning. All Rights Reserved. May not be scanned, copied, duplicated, or posted to a publicly accessible website, in whole or in part.
Full file at https://fratstock.eu
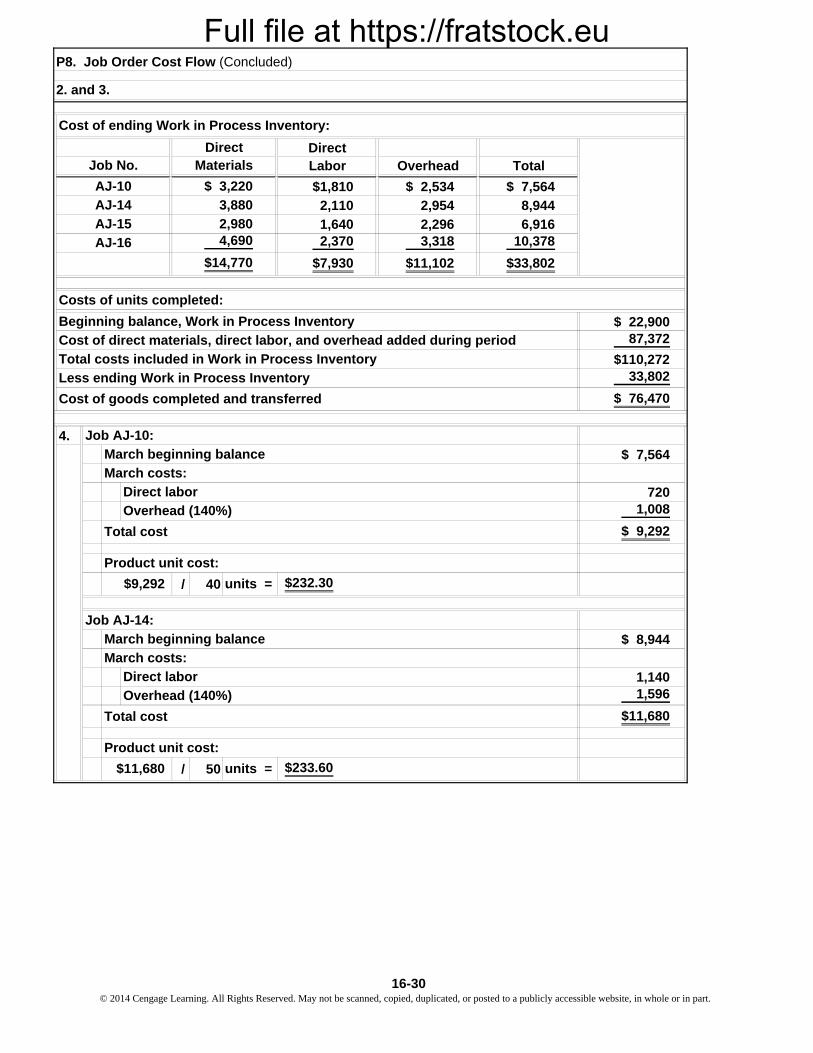
DirectLabor Overhead Total
$1,810 $ 2,534 $ 7,564
2,110 2,954 8,944
1,640 2,296 6,9162,370 3,318 10,378
$7,930 $11,102 $33,802
$ 22,90087,372
$110,27233,802
$ 76,470
4.
$ 7,564
7201,008
$ 9,292
/ 40
$ 8,944
1,1401,596
$11,680
/ 50
Cost of ending Work in Process Inventory:
Materials
$ 3,220
3,880
$14,770
AJ-15
March costs:
Direct labor
Costs of units completed:
Job AJ-10:
March beginning balance
P8. Job Order Cost Flow (Concluded)
2. and 3.
2,9804,690AJ-16
Cost of direct materials, direct labor, and overhead added during period
Total costs included in Work in Process Inventory
Beginning balance, Work in Process Inventory
AJ-14
Job No.
AJ-10
Direct
Less ending Work in Process Inventory
Cost of goods completed and transferred
Overhead (140%)
Total cost
Product unit cost:
$9,292 units = $232.30
Job AJ-14:
March beginning balance
March costs:
Direct labor
Overhead (140%)
Total cost
Product unit cost:
$11,680 units = $233.60
16-30© 2014 Cengage Learning. All Rights Reserved. May not be scanned, copied, duplicated, or posted to a publicly accessible website, in whole or in part.
Full file at https://fratstock.eu
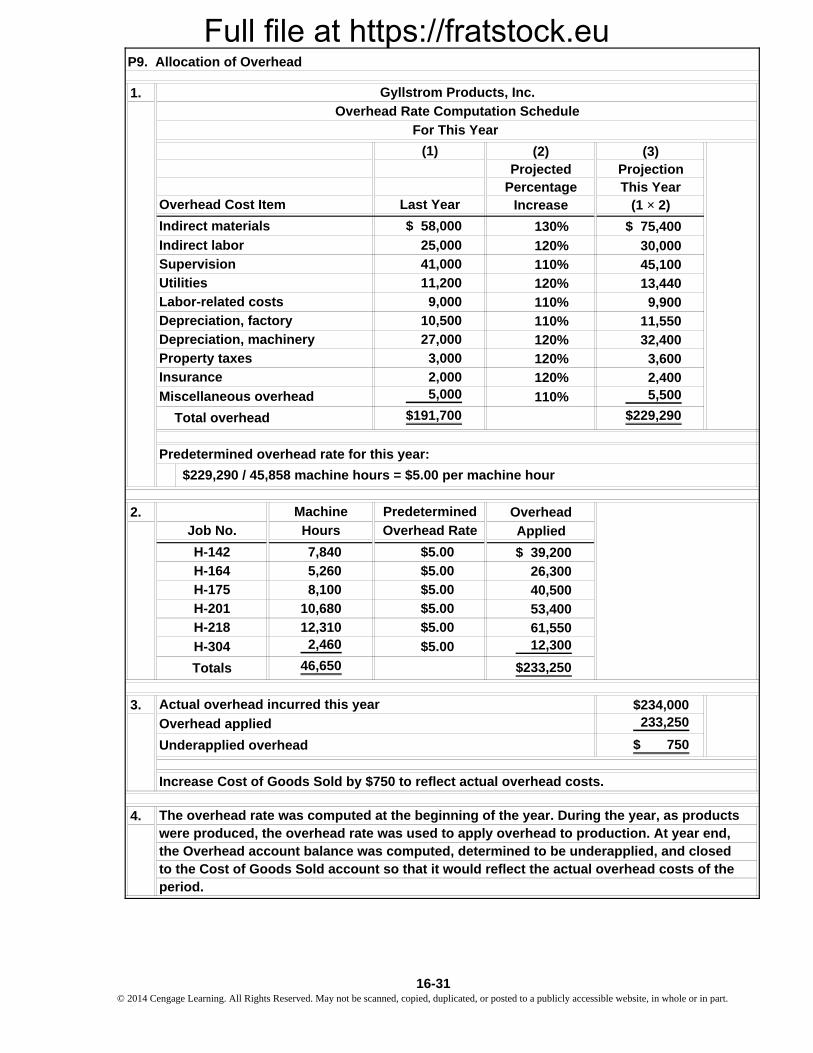
1.
(2) (3)Projected Projection
Percentage This YearIncrease (1 × 2)
130% $ 75,400
120% 30,000
110% 45,100
120% 13,440
110% 9,900
110% 11,550
120% 32,400
120% 3,600
120% 2,400
110% 5,500
$229,290
2. Overhead
Applied
$ 39,200
26,300
40,500
53,400
61,55012,300
$233,250
3. $234,000233,250
$ 750
4.
Predetermined
Overhead Rate
Insurance
Total overhead
2,000
$229,290 / 45,858 machine hours = $5.00 per machine hour
Job No.
Machine
Hours
Gyllstrom Products, Inc.
Overhead Rate Computation Schedule
For This Year
(1)
Predetermined overhead rate for this year:
Last Year
$ 58,000
10,500
9,000
Depreciation, machinery
3,000
P9. Allocation of Overhead
25,000
41,000
11,200
5,000
$191,700
Supervision
Utilities
Labor-related costs
Depreciation, factory
Miscellaneous overhead
Overhead Cost Item
27,000
H-175
H-201
Property taxes
Indirect materials
Indirect labor
$5.00
$5.00
$5.00
$5.00
H-218
H-304
Totals
$5.00
$5.00
7,840
5,260
8,100
10,680
12,3102,460
46,650
H-142
H-164
Actual overhead incurred this year
Overhead applied
Increase Cost of Goods Sold by $750 to reflect actual overhead costs.
Underapplied overhead
were produced, the overhead rate was used to apply overhead to production. At year end,the Overhead account balance was computed, determined to be underapplied, and closed to the Cost of Goods Sold account so that it would reflect the actual overhead costs of the period.
The overhead rate was computed at the beginning of the year. During the year, as products
16-31 © 2014 Cengage Learning. All Rights Reserved. May not be scanned, copied, duplicated, or posted to a publicly accessible website, in whole or in part.
Full file at https://fratstock.eu
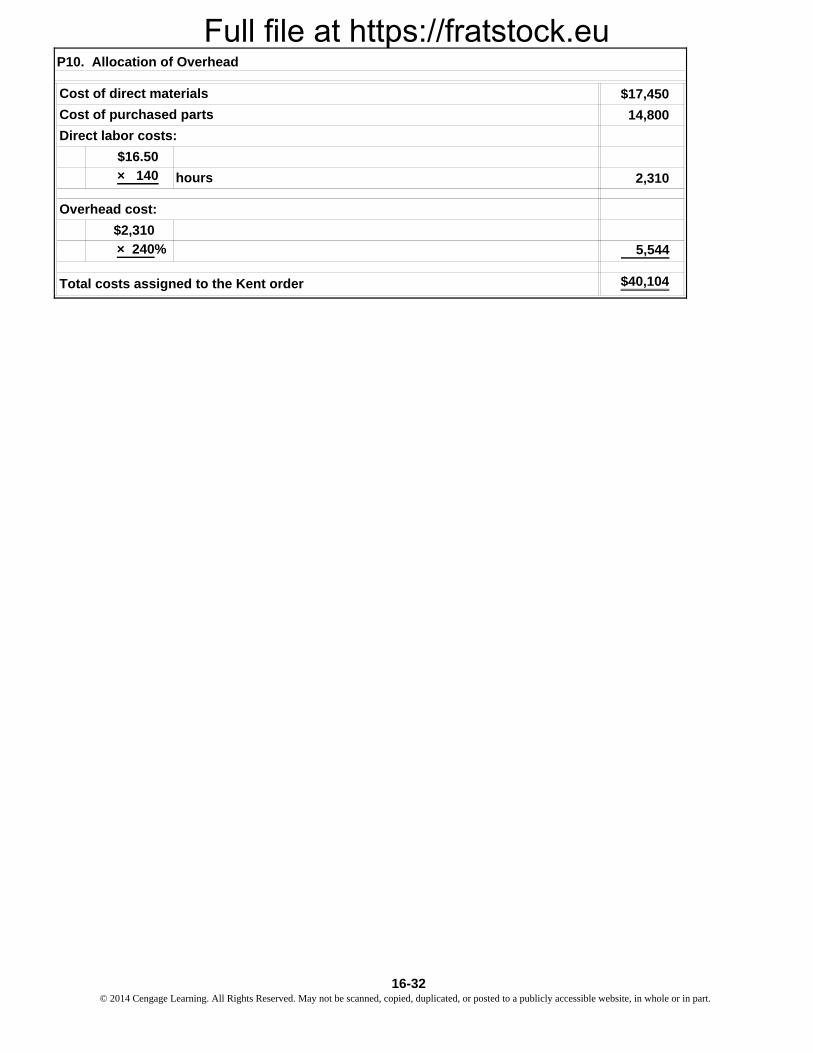
$17,450
14,800
2,310
5,544
$40,104
$16.50
Total costs assigned to the Kent order
hours
Overhead cost:
× 140
× 240%
$2,310
P10. Allocation of Overhead
Cost of direct materials
Cost of purchased parts
Direct labor costs:
16-32© 2014 Cengage Learning. All Rights Reserved. May not be scanned, copied, duplicated, or posted to a publicly accessible website, in whole or in part.
Full file at https://fratstock.eu
1. a.
b.
c.
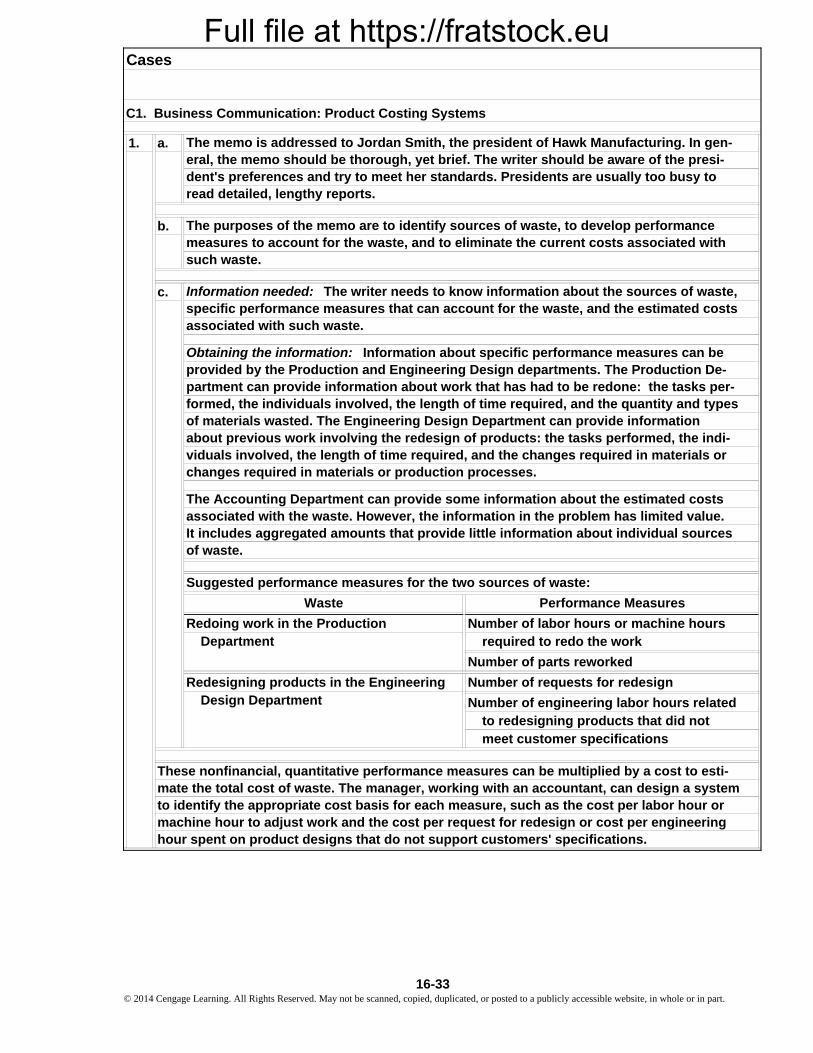
It includes aggregated amounts that provide little information about individual sources of waste.
Obtaining the information: Information about specific performance measures can be
Information needed: The writer needs to know information about the sources of waste,
about previous work involving the redesign of products: the tasks performed, the indi-viduals involved, the length of time required, and the changes required in materials or changes required in materials or production processes.
partment can provide information about work that has had to be redone: the tasks per-formed, the individuals involved, the length of time required, and the quantity and types of materials wasted. The Engineering Design Department can provide information
Waste Performance Measures
specific performance measures that can account for the waste, and the estimated costs associated with such waste.
provided by the Production and Engineering Design departments. The Production De-
The purposes of the memo are to identify sources of waste, to develop performance measures to account for the waste, and to eliminate the current costs associated with such waste.
The memo is addressed to Jordan Smith, the president of Hawk Manufacturing. In gen-eral, the memo should be thorough, yet brief. The writer should be aware of the presi-dent's preferences and try to meet her standards. Presidents are usually too busy to read detailed, lengthy reports.
required to redo the workRedoing work in the Production
Department
Design DepartmentRedesigning products in the Engineering
Number of engineering labor hours relatedto redesigning products that did not meet customer specifications
associated with the waste. However, the information in the problem has limited value.
Number of parts reworked
Number of requests for redesign
The Accounting Department can provide some information about the estimated costs
Cases
C1. Business Communication: Product Costing Systems
to identify the appropriate cost basis for each measure, such as the cost per labor hour or machine hour to adjust work and the cost per request for redesign or cost per engineering hour spent on product designs that do not support customers' specifications.
Suggested performance measures for the two sources of waste:
Number of labor hours or machine hours
These nonfinancial, quantitative performance measures can be multiplied by a cost to esti-mate the total cost of waste. The manager, working with an accountant, can design a system
16-33 © 2014 Cengage Learning. All Rights Reserved. May not be scanned, copied, duplicated, or posted to a publicly accessible website, in whole or in part.
Full file at https://fratstock.eu
d.
2.
III.
IV.
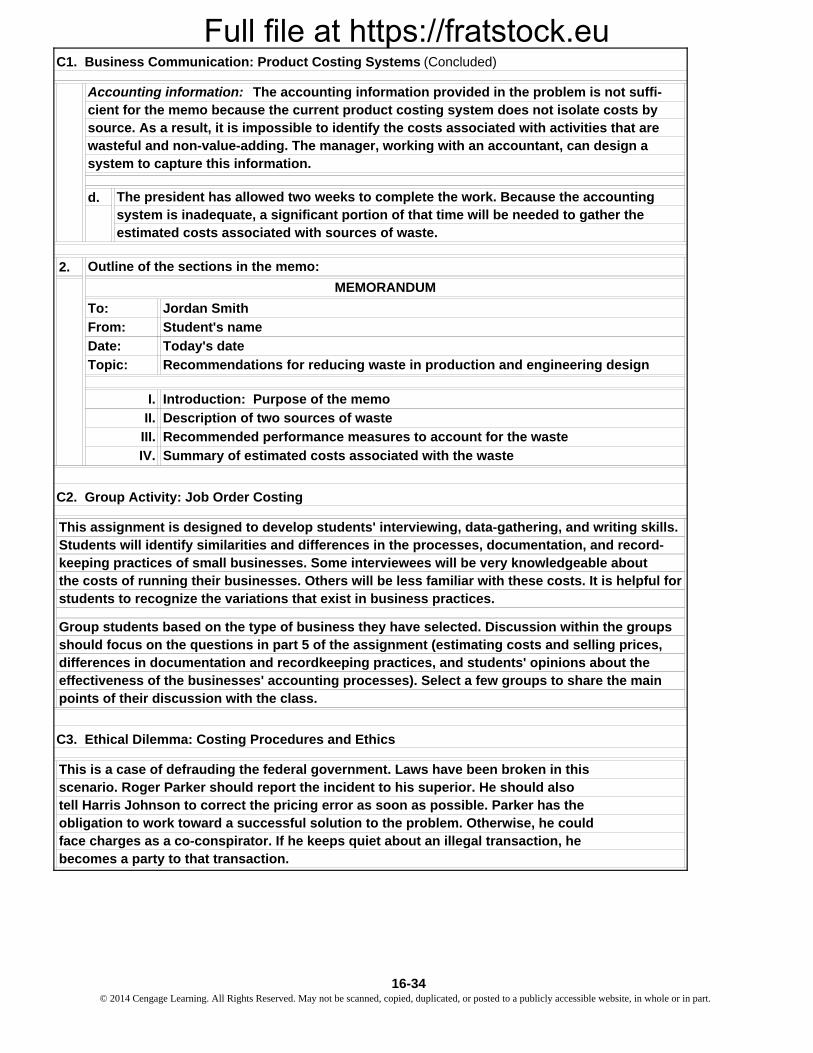
Recommendations for reducing waste in production and engineering design
Introduction: Purpose of the memo
Description of two sources of waste
Recommended performance measures to account for the waste
Summary of estimated costs associated with the waste
Topic:
I.
II.
Today's date
C1. Business Communication: Product Costing Systems (Concluded)
Date:
Jordan Smith
Student's name
Outline of the sections in the memo:
MEMORANDUM
To:
From:
the costs of running their businesses. Others will be less familiar with these costs. It is helpful for students to recognize the variations that exist in business practices.
should focus on the questions in part 5 of the assignment (estimating costs and selling prices, Group students based on the type of business they have selected. Discussion within the groups
C2. Group Activity: Job Order Costing
This assignment is designed to develop students' interviewing, data-gathering, and writing skills. Students will identify similarities and differences in the processes, documentation, and record-
differences in documentation and recordkeeping practices, and students' opinions about the
keeping practices of small businesses. Some interviewees will be very knowledgeable about
C3. Ethical Dilemma: Costing Procedures and Ethics
effectiveness of the businesses' accounting processes). Select a few groups to share the main points of their discussion with the class.
This is a case of defrauding the federal government. Laws have been broken in thisscenario. Roger Parker should report the incident to his superior. He should alsotell Harris Johnson to correct the pricing error as soon as possible. Parker has the obligation to work toward a successful solution to the problem. Otherwise, he couldface charges as a co-conspirator. If he keeps quiet about an illegal transaction, hebecomes a party to that transaction.
The president has allowed two weeks to complete the work. Because the accounting system is inadequate, a significant portion of that time will be needed to gather the estimated costs associated with sources of waste.
system to capture this information.
Accounting information: The accounting information provided in the problem is not suffi-cient for the memo because the current product costing system does not isolate costs by source. As a result, it is impossible to identify the costs associated with activities that are wasteful and non-value-adding. The manager, working with an accountant, can design a
16-34© 2014 Cengage Learning. All Rights Reserved. May not be scanned, copied, duplicated, or posted to a publicly accessible website, in whole or in part.
Full file at https://fratstock.eu
1.
2.
3.
4.
a.
b.
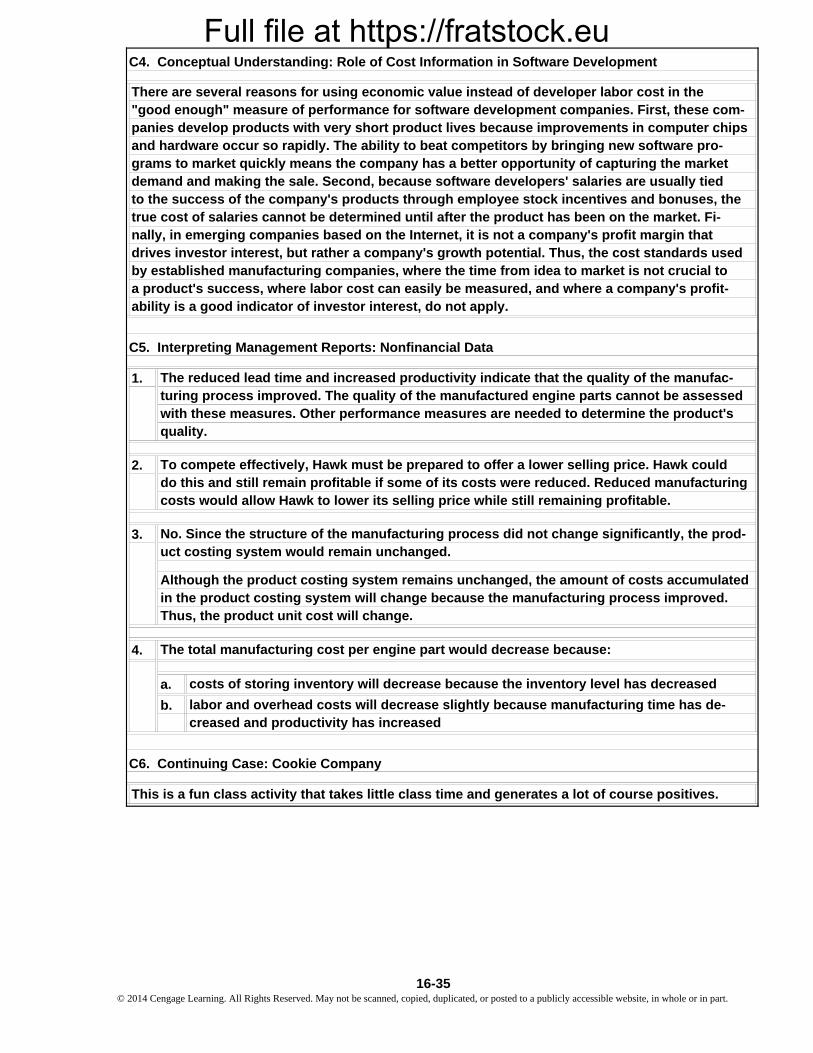
costs of storing inventory will decrease because the inventory level has decreased
C5. Interpreting Management Reports: Nonfinancial Data
The reduced lead time and increased productivity indicate that the quality of the manufac-
costs would allow Hawk to lower its selling price while still remaining profitable.
turing process improved. The quality of the manufactured engine parts cannot be assessed
The total manufacturing cost per engine part would decrease because:
Although the product costing system remains unchanged, the amount of costs accumulated in the product costing system will change because the manufacturing process improved. Thus, the product unit cost will change.
No. Since the structure of the manufacturing process did not change significantly, the prod-uct costing system would remain unchanged.
with these measures. Other performance measures are needed to determine the product's quality.
creased and productivity has increasedlabor and overhead costs will decrease slightly because manufacturing time has de-
To compete effectively, Hawk must be prepared to offer a lower selling price. Hawk could do this and still remain profitable if some of its costs were reduced. Reduced manufacturing
C6. Continuing Case: Cookie Company
This is a fun class activity that takes little class time and generates a lot of course positives.
by established manufacturing companies, where the time from idea to market is not crucial toa product's success, where labor cost can easily be measured, and where a company's profit-ability is a good indicator of investor interest, do not apply.
to the success of the company's products through employee stock incentives and bonuses, the true cost of salaries cannot be determined until after the product has been on the market. Fi-
There are several reasons for using economic value instead of developer labor cost in the "good enough" measure of performance for software development companies. First, these com-panies develop products with very short product lives because improvements in computer chipsand hardware occur so rapidly. The ability to beat competitors by bringing new software pro-
C4. Conceptual Understanding: Role of Cost Information in Software Development
drives investor interest, but rather a company's growth potential. Thus, the cost standards used nally, in emerging companies based on the Internet, it is not a company's profit margin that
grams to market quickly means the company has a better opportunity of capturing the market demand and making the sale. Second, because software developers' salaries are usually tied
16-35 © 2014 Cengage Learning. All Rights Reserved. May not be scanned, copied, duplicated, or posted to a publicly accessible website, in whole or in part.

Full file at https://fratstock.eu