Chapter 16 Exploring, Displaying, and Examining Data McGraw-Hill/Irwin Copyright © 2011 by The...
33
Chapter 16 Chapter 16 Exploring, Displaying, Exploring, Displaying, and Examining Data and Examining Data McGraw-Hill/Irwin Copyright © 2011 by The McGraw-Hill Companies, Inc. All Rights Reserved.
-
Upload
easter-floyd -
Category
Documents
-
view
237 -
download
9
Transcript of Chapter 16 Exploring, Displaying, and Examining Data McGraw-Hill/Irwin Copyright © 2011 by The...

Chapter 16Chapter 16
Exploring, Displaying, Exploring, Displaying, and Examining Dataand Examining Data
McGraw-Hill/Irwin Copyright © 2011 by The McGraw-Hill Companies, Inc. All Rights Reserved.

16-2
Learning ObjectivesLearning Objectives
Understand . . .• That exploratory data analysis techniques
provide insights and data diagnostics by emphasizing visual representations of the data.
• How cross-tabulation is used to examine relationships involving categorical variables, serves as a framework for later statistical testing, and makes an efficient tool for data visualization and later decision-making.

16-3
Research as Research as Competitive AdvantageCompetitive Advantage
“As data availability continues to increase, theimportance of identifying/filtering and analyzingrelevant data can be a powerful way to gain aninformation advantage over our competition.”
Tom H.C. Anderson founder & managing partner
Anderson Analytics, LLC

16-4
PulsePoint: PulsePoint: Research RevelationResearch Revelation
65 The percent boost in company revenue created by best practices in data quality.

16-5
Researcher Skill Improves Data Researcher Skill Improves Data DiscoveryDiscovery
DDW is a global player in research services. As this ad proclaims, you can “push data into a template and get the job done,” but you are unlikely to make discoveries using a template process.

16-6
Exploratory Data AnalysisExploratory Data Analysis
ConfirmatoryExploratory

16-7
Data Exploration, Examination, Data Exploration, Examination, and Analysis in the Research and Analysis in the Research ProcessProcess

16-8
Research Values the Research Values the UnexpectedUnexpected
“It is precisely because the unexpected jolts us out of our preconceived notions, our assumptions, our certainties, that it is such a fertile source of innovation.”
Peter Drucker, authorInnovation and Entrepreneurship
16-9
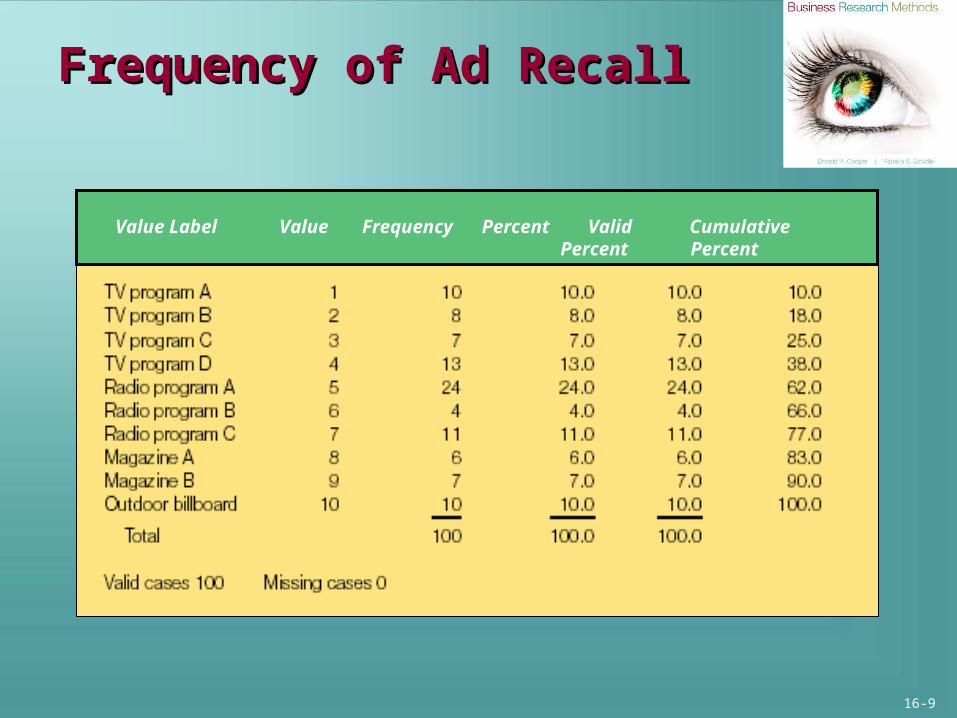
Frequency of Ad RecallFrequency of Ad Recall
Value Label Value Frequency Percent Valid Cumulative Percent Percent

16-10
Bar ChartBar Chart

16-11
Pie ChartPie Chart

16-12
Frequency TableFrequency Table

16-13
Histogram Histogram

16-14
Stem-and-Leaf DisplayStem-and-Leaf Display
455666788889
12466799
02235678
02268
24
018
3
1
06
3
36
3
6
8
5
6
7
8
9
10
11
12
13
14
15
16
17
18
19
20
21
16-15
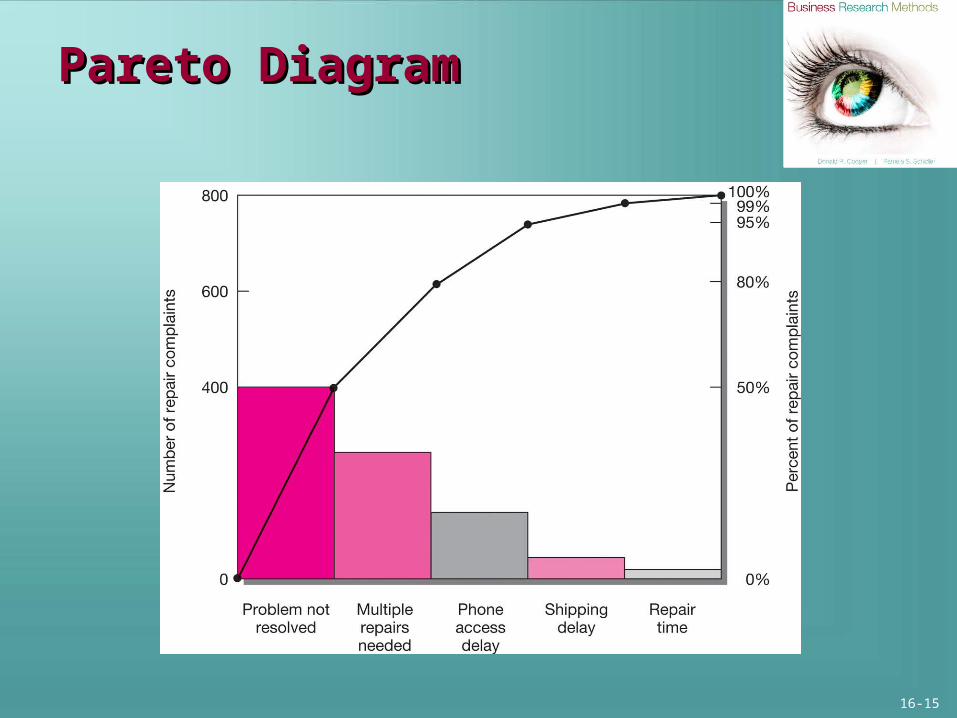
Pareto DiagramPareto Diagram

16-16
Boxplot ComponentsBoxplot Components

16-17
Diagnostics with BoxplotsDiagnostics with Boxplots

16-18
Boxplot ComparisonBoxplot Comparison

16-19
MappingMapping

16-20
Geograph: Geograph: Digital Camera OwnershipDigital Camera Ownership

16-21
SPSS Cross-TabulationSPSS Cross-Tabulation

16-22
Percentages in Percentages in Cross-TabulationCross-Tabulation
16-23
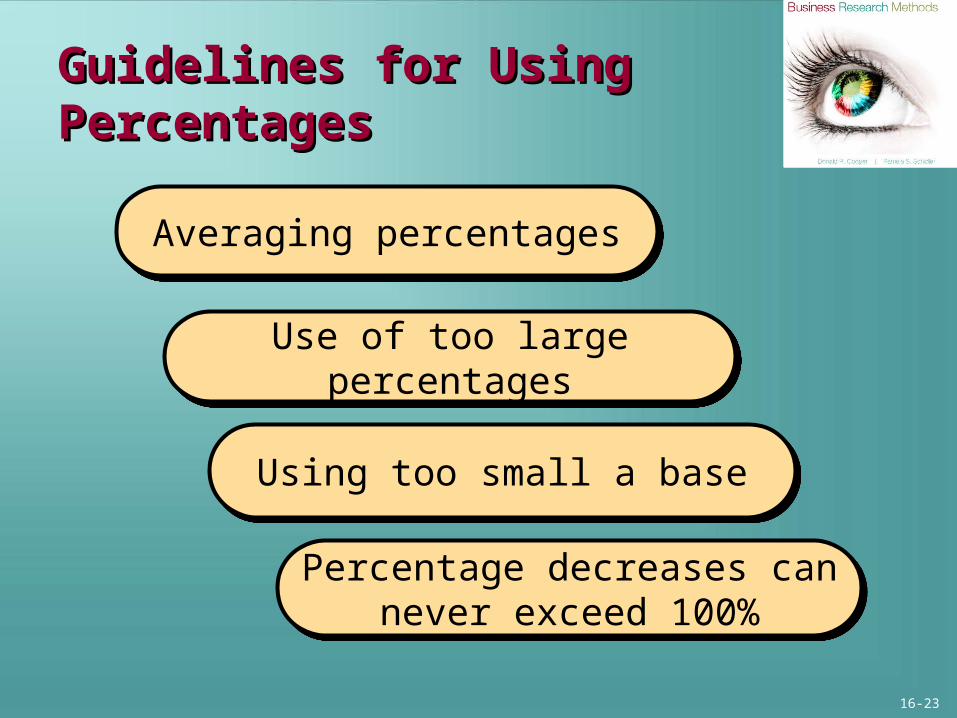
Guidelines for Using Guidelines for Using PercentagesPercentages
Averaging percentagesAveraging percentages
Use of too large percentagesUse of too large percentages
Using too small a baseUsing too small a base
Percentage decreases can never exceed 100%
Percentage decreases can never exceed 100%

16-24
Cross-Tabulation with Control Cross-Tabulation with Control and Nested Variablesand Nested Variables
16-25
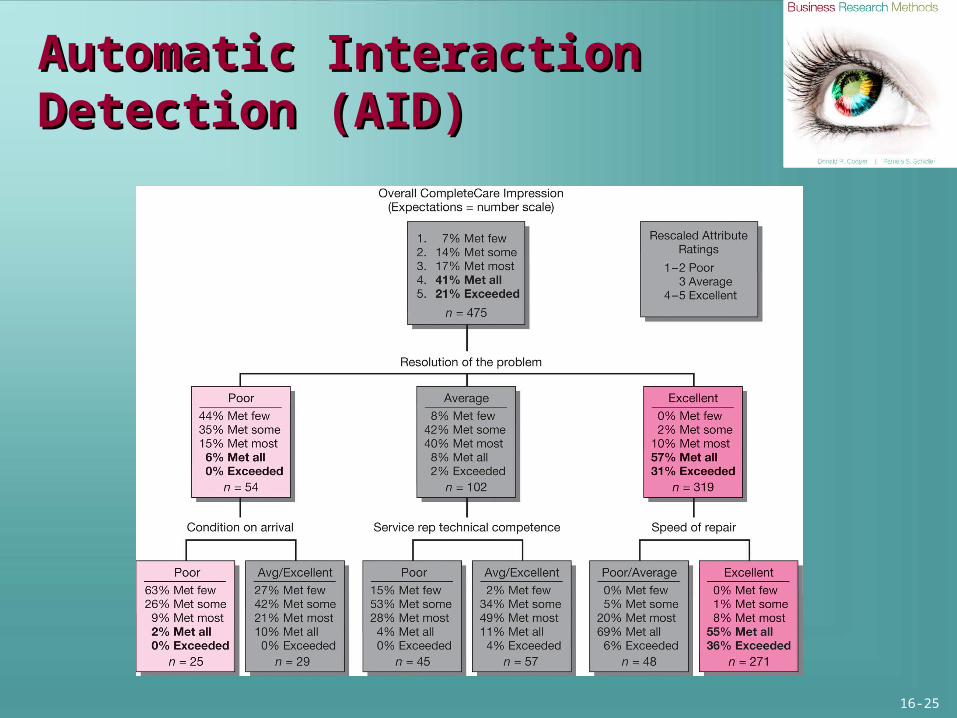
Automatic Interaction Detection Automatic Interaction Detection (AID)(AID)

16-26
Exploratory Data Analysis Exploratory Data Analysis
This Booth Research Services ad suggests that the researcher’s role is to make sense of data displays.
Great data exploration and analysis delivers insight from data.

16-27
Key TermsKey Terms
• Automatic interaction detection (AID)
• Boxplot• Cell• Confirmatory data
analysis• Contingency table• Control variable• Cross-tabulation• Exploratory data
analysis (EDA)
• Five-number summary• Frequency table• Histogram• Interquartile range (IQR)• Marginals• Nonresistant statistics• Outliers• Pareto diagram• Resistant statistics• Stem-and-leaf display

Working with
Data Tables
McGraw-Hill/Irwin Copyright © 2011 by The McGraw-Hill Companies, Inc. All Rights Reserved.

16-29
Original Data TableOriginal Data Table
Our grateful appreciation to eMarketer for the use of their table.

16-30
Arranged by SpendingArranged by Spending

16-31
Arranged by Arranged by No. of PurchasesNo. of Purchases

16-32
Arranged by Avg. Transaction, Arranged by Avg. Transaction, HighestHighest

16-33
Arranged by Avg. Transaction, Arranged by Avg. Transaction, LowestLowest