Lake Salvador Shoreline Protection – Demonstration Project BA-15
Upload
domenic-woodCategory
view
218download
3
Chapter 15
Financial Statement Analysis
Demonstration Problems
© 2016 Pearson Education, Ltd.15-1

Data for Sun Rise, Inc. follow:
Demonstration of E15-15
SUN RISE, INC.Comparative Income Statement
Years Ended December 31, 2016 and 20152016 2015
Net Sales Revenue $500,000 $430,000Expenses:
Cost of Goods Sold 225,000 210,000Selling and Administrative Expenses 107,000 98,000Other Expenses 15,000 11,000Total Expenses 347,000 319,000
Net Income $153,000 $111,000
Requirements
1. Prepare a horizontal analysis of the comparative income statement of Sun Rise, Inc. Round percentage changes to one decimal place.
2. Why did 2016 net income increase by a higher percentage than net sales revenue?
© 2016 Pearson Education, Ltd.15-2

SUN RISE, INC.Comparative Income Statement
Years Ended December 31, 2016 and 2015Increase (Decrease)
2016 2015 Amount PercentageNet Sales Revenue $500,000 $430,000 $70,000Expenses:
Cost of Goods Sold 225,000 210,000Selling and Administrative Expenses 107,000 98,000Other Expenses 15,000 11,000Total Expenses 347,000 319,000
Net Income $153,000 $111,000
Calculation:
═ $500,000 − $430,000
═ $70,000
Demonstration of E15-15-Req. 1
© 2016 Pearson Education, Ltd.15-3
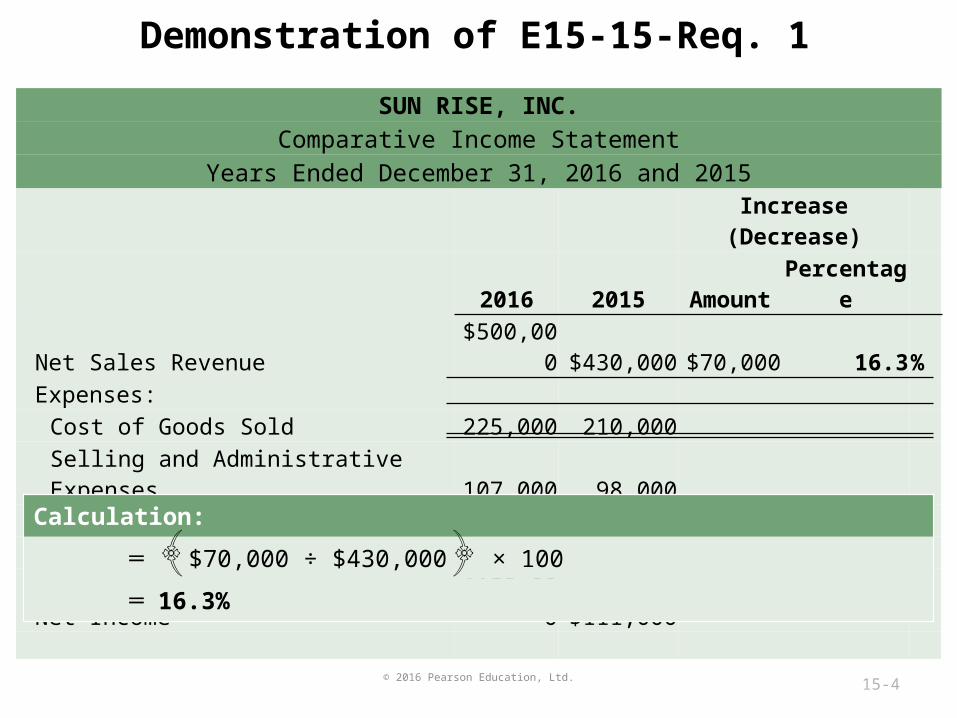
SUN RISE, INC.Comparative Income Statement
Years Ended December 31, 2016 and 2015Increase (Decrease)
2016 2015 Amount PercentageNet Sales Revenue $500,000 $430,000 $70,000 16.3%Expenses:
Cost of Goods Sold 225,000 210,000Selling and Administrative Expenses 107,000 98,000Other Expenses 15,000 11,000Total Expenses 347,000 319,000
Net Income $153,000 $111,000
Calculation:
═ ﴾$70,000 ÷ $430,000 ﴿ × 100
═ 16.3%
Demonstration of E15-15-Req. 1
© 2016 Pearson Education, Ltd.15-4

SUN RISE, INC.Comparative Income Statement
Years Ended December 31, 2016 and 2015Increase (Decrease)
2016 2015 Amount PercentageNet Sales Revenue $500,000 $430,000 $70,000 16.3%Expenses:
Cost of Goods Sold 225,000 210,000 15,000Selling and Administrative Expenses 107,000 98,000Other Expenses 15,000 11,000Total Expenses 347,000 319,000
Net Income $153,000 $111,000
Calculation:
═ $225,000 − $210,000
═ $15,000
Demonstration of E15-15-Req. 1
© 2016 Pearson Education, Ltd.15-5

SUN RISE, INC.Comparative Income Statement
Years Ended December 31, 2016 and 2015Increase (Decrease)
2016 2015 Amount PercentageNet Sales Revenue $500,000 $430,000 $70,000 16.3%Expenses:
Cost of Goods Sold 225,000 210,000 15,000 7.1Selling and Administrative Expenses 107,000 98,000Other Expenses 15,000 11,000Total Expenses 347,000 319,000
Net Income $153,000 $111,000
Calculation:
═ ﴾$15,000 ÷ $210,000 ﴿ × 100
═ 7.1%
Demonstration of E15-15-Req. 1
© 2016 Pearson Education, Ltd.15-6

SUN RISE, INC.Comparative Income Statement
Years Ended December 31, 2016 and 2015Increase (Decrease)
2016 2015 Amount PercentageNet Sales Revenue $500,000 $430,000 $70,000 16.3%Expenses:
Cost of Goods Sold 225,000 210,000 15,000 7.1Selling and Administrative Expenses 107,000 98,000 9,000 Other Expenses 15,000 11,000Total Expenses 347,000 319,000
Net Income $153,000 $111,000
Calculation:
═ $107,000 − $98,000
═ $9,000
Demonstration of E15-15-Req. 1
© 2016 Pearson Education, Ltd.15-7

SUN RISE, INC.Comparative Income Statement
Years Ended December 31, 2016 and 2015Increase (Decrease)
2016 2015 Amount PercentageNet Sales Revenue $500,000 $430,000 $70,000 16.3%Expenses:
Cost of Goods Sold 225,000 210,000 15,000 7.1Selling and Administrative Expenses 107,000 98,000 9,000 9.2Other Expenses 15,000 11,000Total Expenses 347,000 319,000
Net Income $153,000 $111,000
Calculation:
═ ﴾$9,000 ÷ $98,000 ﴿ × 100
═ 9.2%
Demonstration of E15-15-Req. 1
© 2016 Pearson Education, Ltd.15-8

SUN RISE, INC.Comparative Income Statement
Years Ended December 31, 2016 and 2015Increase (Decrease)
2016 2015 Amount PercentageNet Sales Revenue $500,000 $430,000 $70,000 16.3%Expenses:
Cost of Goods Sold 225,000 210,000 15,000 7.1Selling and Administrative Expenses 107,000 98,000 9,000 9.2Other Expenses 15,000 11,000 3,000 Total Expenses 347,000 319,000
Net Income $153,000 $111,000
Calculation:
═ $15,000 − $11,000
═ $3,000
Demonstration of E15-15-Req. 1
© 2016 Pearson Education, Ltd.15-9

SUN RISE, INC.Comparative Income Statement
Years Ended December 31, 2016 and 2015Increase (Decrease)
2016 2015 Amount PercentageNet Sales Revenue $500,000 $430,000 $70,000 16.3%Expenses:
Cost of Goods Sold 225,000 210,000 15,000 7.1Selling and Administrative Expenses 107,000 98,000 9,000 9.2Other Expenses 15,000 11,000 3,000 27.3Total Expenses 347,000 319,000
Net Income $153,000 $111,000
Calculation:
═ ﴾$3,000 ÷ $11,000 ﴿ × 100
═ 27.3%
Demonstration of E15-15-Req. 1
© 2016 Pearson Education, Ltd.15-10

SUN RISE, INC.Comparative Income Statement
Years Ended December 31, 2016 and 2015Increase (Decrease)
2016 2015 Amount PercentageNet Sales Revenue $500,000 $430,000 $70,000 16.3%Expenses:
Cost of Goods Sold 225,000 210,000 15,000 7.1Selling and Administrative Expenses 107,000 98,000 9,000 9.2Other Expenses 15,000 11,000 3,000 27.3Total Expenses 347,000 319,000 28,000
Net Income $153,000 $111,000
Calculation:
═ $347,000 − $319,000
═ $28,000
Demonstration of E15-15-Req. 1
© 2016 Pearson Education, Ltd.15-11

SUN RISE, INC.Comparative Income Statement
Years Ended December 31, 2016 and 2015Increase (Decrease)
2016 2015 Amount PercentageNet Sales Revenue $500,000 $430,000 $70,000 16.3%Expenses:
Cost of Goods Sold 225,000 210,000 15,000 7.1Selling and Administrative Expenses 107,000 98,000 9,000 9.2Other Expenses 15,000 11,000 3,000 27.3Total Expenses 347,000 319,000 28,000 8.8
Net Income $153,000 $111,000
Calculation:
═ ﴾$28,000 ÷ $319,000 ﴿ × 100
═ 8.8%
Demonstration of E15-15-Req. 1
© 2016 Pearson Education, Ltd.15-12

SUN RISE, INC.Comparative Income Statement
Years Ended December 31, 2016 and 2015Increase (Decrease)
2016 2015 Amount PercentageNet Sales Revenue $500,000 $430,000 $70,000 16.3%Expenses:
Cost of Goods Sold 225,000 210,000 15,000 7.1Selling and Administrative Expenses 107,000 98,000 9,000 9.2Other Expenses 15,000 11,000 3,000 27.3Total Expenses 347,000 319,000 28,000 8.8
Net Income $153,000 $111,000 $42,000
Calculation:
═ $153,000 − $111,000
═ $42,000
Demonstration of E15-15-Req. 1
© 2016 Pearson Education, Ltd.15-13

SUN RISE, INC.Comparative Income Statement
Years Ended December 31, 2016 and 2015Increase (Decrease)
2016 2015 Amount PercentageNet Sales Revenue $500,000 $430,000 $70,000 16.3%Expenses:
Cost of Goods Sold 225,000 210,000 15,000 7.1Selling and Administrative Expenses 107,000 98,000 9,000 9.2Other Expenses 15,000 11,000 3,000 27.3Total Expenses 347,000 319,000 28,000 8.8
Net Income $153,000 $111,000 $42,000 37.8%
Calculation:
═ ﴾$42,000 ÷ $111,000 ﴿ × 100
═ 37.8%
Demonstration of E15-15-Req. 1
© 2016 Pearson Education, Ltd.15-14

SUN RISE, INC.Comparative Income Statement
Years Ended December 31, 2016 and 2015Increase (Decrease)
2016 2015 Amount PercentageNet Sales Revenue $500,000 $430,000 $70,000 16.3%Expenses:
Cost of Goods Sold 225,000 210,000 15,000 7.1Selling and Administrative Expenses 107,000 98,000 9,000 9.2Other Expenses 15,000 11,000 3,000 27.3Total Expenses 347,000 319,000 28,000 8.8
Net Income $153,000 $111,000 $42,000 37.8%
Net income increased by a higher percentage than total net sales revenue during
2015 because revenues increased at a higher rate than total expenses.
Demonstration of E15-15-Req. 2
© 2016 Pearson Education, Ltd.15-15

Comet, Inc. net revenue and net income for the following five-year period, using 2013 as the base year, follow:
Demonstration of E15-16
Requirements
1. Compute trend analysis for net revenue and net income. Round to the nearest full percent.
2. Which grew faster during the period, net revenue or net income?
2017 2016 2015 2014 2013
Net Revenue $870,000 $860,000 $842,000 $730,000 $800,000
Net Income $70,000 $64,000 $55,000 $40,000 $50,000
© 2016 Pearson Education, Ltd.15-16

Calculation:
Trend Percentages ═ ﴾Any period amount ÷ Base period amount ﴿ × 100
═ ﴾$800,000 ÷ $800,000 ﴿ × 100
═ 100%
2017 2016 2015 2014 2013
Net Revenue $870,000 $860,000 $842,000 $730,000 $800,000
Trend Percentages 100%
Net Income $70,000 $64,000 $55,000 $40,000 $50,000
Trend Percentages
Demonstration of E15-16-Req. 1
© 2016 Pearson Education, Ltd.15-17

Calculation:
Trend Percentages ═ ﴾Any period amount ÷ Base period amount ﴿ × 100
═ ﴾$730,000 ÷ $800,000 ﴿ × 100
═ 91%
2017 2016 2015 2014 2013
Net Revenue $870,000 $860,000 $842,000 $730,000 $800,000
Trend Percentages 91% 100%
Net Income $70,000 $64,000 $55,000 $40,000 $50,000
Trend Percentages
Demonstration of E15-16-Req. 1
© 2016 Pearson Education, Ltd.15-18

Calculation:
Trend Percentages ═ ﴾Any period amount ÷ Base period amount ﴿ × 100
═ ﴾$842,000 ÷ $800,000 ﴿ × 100
═ 105%
2017 2016 2015 2014 2013
Net Revenue $870,000 $860,000 $842,000 $730,000 $800,000
Trend Percentages 105% 91% 100%
Net Income $70,000 $64,000 $55,000 $40,000 $50,000
Trend Percentages
Demonstration of E15-16-Req. 1
© 2016 Pearson Education, Ltd.15-19

Calculation:
Trend Percentages ═ ﴾Any period amount ÷ Base period amount ﴿ × 100
═ ﴾$860,000 ÷ $800,000 ﴿ × 100
═ 108%
2017 2016 2015 2014 2013
Net Revenue $870,000 $860,000 $842,000 $730,000 $800,000
Trend Percentages 108% 105% 91% 100%
Net Income $70,000 $64,000 $55,000 $40,000 $50,000
Trend Percentages
Demonstration of E15-16-Req. 1
© 2016 Pearson Education, Ltd.15-20

Calculation:
Trend Percentages ═ ﴾Any period amount ÷ Base period amount ﴿ × 100
═ ﴾$870,000 ÷ $800,000 ﴿ × 100
═ 109%
2017 2016 2015 2014 2013
Net Revenue $870,000 $860,000 $842,000 $730,000 $800,000
Trend Percentages 109% 108% 105% 91% 100%
Net Income $70,000 $64,000 $55,000 $40,000 $50,000
Trend Percentages
Demonstration of E15-16-Req. 1
© 2016 Pearson Education, Ltd.15-21

Calculation:
Trend Percentages ═ ﴾Any period amount ÷ Base period amount ﴿ × 100
═ ﴾$50,000 ÷ $50,000 ﴿ × 100
═ 100%
2017 2016 2015 2014 2013
Net Revenue $870,000 $860,000 $842,000 $730,000 $800,000
Trend Percentages 109% 108% 105% 91% 100%
Net Income $70,000 $64,000 $55,000 $40,000 $50,000
Trend Percentages 100%
Demonstration of E15-16-Req. 1
© 2016 Pearson Education, Ltd.15-22

Calculation:
Trend Percentages ═ ﴾Any period amount ÷ Base period amount ﴿ × 100
═ ﴾$40,000 ÷ $50,000 ﴿ × 100
═ 80%
2017 2016 2015 2014 2013
Net Revenue $870,000 $860,000 $842,000 $730,000 $800,000
Trend Percentages 109% 108% 105% 91% 100%
Net Income $70,000 $64,000 $55,000 $40,000 $50,000
Trend Percentages 80% 100%
Demonstration of E15-16-Req. 1
© 2016 Pearson Education, Ltd.15-23

Calculation:
Trend Percentages ═ ﴾Any period amount ÷ Base period amount ﴿ × 100
═ ﴾$55,000 ÷ $50,000 ﴿ × 100
═ 110%
2017 2016 2015 2014 2013
Net Revenue $870,000 $860,000 $842,000 $730,000 $800,000
Trend Percentages 109% 108% 105% 91% 100%
Net Income $70,000 $64,000 $55,000 $40,000 $50,000
Trend Percentages 110% 80% 100%
Demonstration of E15-16-Req. 1
© 2016 Pearson Education, Ltd.15-24

Calculation:
Trend Percentages ═ ﴾Any period amount ÷ Base period amount ﴿ × 100
═ ﴾$64,000 ÷ $50,000 ﴿ × 100
═ 128%
2017 2016 2015 2014 2013
Net Revenue $870,000 $860,000 $842,000 $730,000 $800,000
Trend Percentages 109% 108% 105% 91% 100%
Net Income $70,000 $64,000 $55,000 $40,000 $50,000
Trend Percentages 128% 110% 80% 100%
Demonstration of E15-16-Req. 1
© 2016 Pearson Education, Ltd.15-25

Calculation:
Trend Percentages ═ ﴾Any period amount ÷ Base period amount ﴿ × 100
═ ﴾$70,000 ÷ $50,000 ﴿ × 100
═ 140%
2017 2016 2015 2014 2013
Net Revenue $870,000 $860,000 $842,000 $730,000 $800,000
Trend Percentages 109% 108% 105% 91% 100%
Net Income $70,000 $64,000 $55,000 $40,000 $50,000
Trend Percentages 140% 128% 110% 80% 100%
Demonstration of E15-16-Req. 1
© 2016 Pearson Education, Ltd.15-26

Net income grew at a faster rate (40%) than net revenue (9%).
2017 2016 2015 2014 2013
Net Revenue $870,000 $860,000 $842,000 $730,000 $800,000
Trend Percentages 109% 108% 105% 91% 100%
Net Income $70,000 $64,000 $55,000 $40,000 $50,000
Trend Percentages 140% 128% 110% 80% 100%
Demonstration of E15-16-Req. 2
© 2016 Pearson Education, Ltd.15-27

The following data are adapted from the financial statements of Landmark, Inc.:
Demonstration of E15-24
Requirement
Prepare Landmark’s condensed balance sheet as of December 31, 2016.
Total Current Assets $ 800,000Accumulated Depreciation 1,500,000Total Liabilities 1,200,000Preferred Stock 0Debt Ratio 75%Current Ratio 1.2
© 2016 Pearson Education, Ltd.15-28

Total Current Assets $ 800,000 Preferred Stock $0
Accu. Depreciation 1,500,000 Debt Ratio 75%
Total Liabilities 1,200,000 Current Ratio 1.2
LANDMARK, INC.Balance Sheet
December 31, 2015Assets Liabilities
Total Current Assets $800,000 Total Current Liabilities
Plant Assets Long-term Liabilities
Less: Accumulated Depreciation Total Liabilities
Plant Assets, Net Stockholders’ Equity
Total AssetsTotal Liabilities and Stockholder’s Equity
Demonstration of E15-24
© 2016 Pearson Education, Ltd.15-29

Total Current Assets $ 800,000 Preferred Stock $0
Accu. Depreciation 1,500,000 Debt Ratio 75%
Total Liabilities 1,200,000 Current Ratio 1.2
LANDMARK, INC.Balance Sheet
December 31, 2015Assets Liabilities
Total Current Assets $800,000 Total Current Liabilities $666,667
Plant Assets Long-term Liabilities
Less: Accumulated Depreciation Total Liabilities
Plant Assets, Net Stockholders’ Equity
Total AssetsTotal Liabilities and Stockholder’s Equity
Calculation:
Current Liabilities ═ Current Assets ÷ Current Ratio
═ $800,000 ÷ 1.2
═ $666,667
Demonstration of E15-24
15-30

Total Current Assets $ 800,000 Preferred Stock $0
Accu. Depreciation 1,500,000 Debt Ratio 75%
Total Liabilities 1,200,000 Current Ratio 1.2
LANDMARK, INC.Balance Sheet
December 31, 2015Assets Liabilities
Total Current Assets $800,000 Total Current Liabilities $666,667
Plant Assets Long-term Liabilities
Less: Accumulated Depreciation Total Liabilities 1,200,000
Plant Assets, Net Stockholders’ Equity
Total AssetsTotal Liabilities and Stockholder’s Equity
Demonstration of E15-24
© 2016 Pearson Education, Ltd.15-31

Total Current Assets $ 800,000 Preferred Stock $0
Accu. Depreciation 1,500,000 Debt Ratio 75%
Total Liabilities 1,200,000 Current Ratio 1.2
LANDMARK, INC.Balance Sheet
December 31, 2015Assets Liabilities
Total Current Assets $800,000 Total Current Liabilities $666,667
Plant Assets Long-term Liabilities 533,333
Less: Accumulated Depreciation Total Liabilities 1,200,000
Plant Assets, Net Stockholders’ Equity
Total AssetsTotal Liabilities and Stockholder’s Equity
Calculation:
Long-term Liabilities ═ Total Liabilities − Current Liabilities
═ $1,200,000 − $666,667
═ $533,333
Demonstration of E15-24
15-32

LANDMARK, INC.Balance Sheet
December 31, 2015Assets Liabilities
Total Current Assets $800,000 Total Current Liabilities $666,667
Plant Assets Long-term Liabilities 533,333
Less: Accumulated Depreciation Total Liabilities 1,200,000
Plant Assets, Net Stockholders’ Equity
Total Assets $1,600,000Total Liabilities and Stockholder’s Equity
Total Current Assets $ 800,000 Preferred Stock $0
Accu. Depreciation 1,500,000 Debt Ratio 75%
Total Liabilities 1,200,000 Current Ratio 1.2
Calculation:
Total Assets ═ Total Liabilities ÷ Debt ratio
═ $1,200,000 ÷ 75%
═ $1,600,000
Demonstration of E15-24
15-33

Total Current Assets $ 800,000 Preferred Stock $0
Accu. Depreciation 1,500,000 Debt Ratio 75%
Total Liabilities 1,200,000 Current Ratio 1.2
LANDMARK, INC.Balance Sheet
December 31, 2015Assets Liabilities
Total Current Assets $800,000 Total Current Liabilities $666,667
Plant Assets Long-term Liabilities 533,333
Less: Accumulated Depreciation Total Liabilities 1,200,000
Plant Assets, Net Stockholders’ Equity
Total Assets $1,600,000Total Liabilities and Stockholder’s Equity $1,600,000
Demonstration of E15-24
© 2016 Pearson Education, Ltd.15-34

Total Current Assets $ 800,000 Preferred Stock $0
Accu. Depreciation 1,500,000 Debt Ratio 75%
Total Liabilities 1,200,000 Current Ratio 1.2
LANDMARK, INC.Balance Sheet
December 31, 2015Assets Liabilities
Total Current Assets $800,000 Total Current Liabilities $666,667
Plant Assets Long-term Liabilities 533,333
Less: Accumulated Depreciation Total Liabilities 1,200,000
Plant Assets, Net $800,000 Stockholders’ Equity
Total Assets $1,600,000Total Liabilities and Stockholder’s Equity $1,600,000
Calculation:
Plant Assets, Net ═ Total Assets − Total Current Assets
═ $1,600,000 − $800,000
═ $800,000
Demonstration of E15-24
15-35

Total Current Assets $ 800,000 Preferred Stock $0
Accu. Depreciation 1,500,000 Debt Ratio 75%
Total Liabilities 1,200,000 Current Ratio 1.2
LANDMARK, INC.Balance Sheet
December 31, 2015Assets Liabilities
Total Current Assets $800,000 Total Current Liabilities $666,667
Plant Assets Long-term Liabilities 533,333
Less: Accumulated Depreciation $1,500,000 Total Liabilities 1,200,000
Plant Assets, Net $800,000 Stockholders’ Equity
Total Assets $1,600,000Total Liabilities and Stockholder’s Equity $1,600,000
Demonstration of E15-24
© 2016 Pearson Education, Ltd.15-36

Total Current Assets $ 800,000 Preferred Stock $0
Accu. Depreciation 1,500,000 Debt Ratio 75%
Total Liabilities 1,200,000 Current Ratio 1.2
LANDMARK, INC.Balance Sheet
December 31, 2015Assets Liabilities
Total Current Assets $800,000 Total Current Liabilities $666,667
Plant Assets $2,300,000 Long-term Liabilities 533,333
Less: Accumulated Depreciation $1,500,000 Total Liabilities 1,200,000
Plant Assets, Net $800,000 Stockholders’ Equity $400,000
Total Assets $1,600,000Total Liabilities and Stockholder’s Equity $1,600,000
Calculation:
Plant Assets ═ Plant Assets + Accumulated Depreciation
═ $800,000 + $1,500,000
═ $2,300,000
Demonstration of E15-24
15-37

Total Current Assets $ 800,000 Preferred Stock $0
Accu. Depreciation 1,500,000 Debt Ratio 75%
Total Liabilities 1,200,000 Current Ratio 1.2
LANDMARK, INC.Balance Sheet
December 31, 2015
Assets Liabilities
Total Current Assets $800,000 Total Current Liabilities $666,667
Plant Assets $2,300,000 Long-term Liabilities 533,333
Less: Accumulated Depreciation $1,500,000 Total Liabilities 1,200,000
Plant Assets, Net $800,000 Stockholders’ Equity $400,000
Total Assets $1,600,000Total Liabilities and Stockholder’s Equity $1,600,000
Calculation:
Stockholder’s Equity ═ Total Liabilities and Stockholder’s Equity − Total Liabilities
═ $1,600,000 − $1,200,000
═ $400,000
Demonstration of E15-24
15-38

LANDMARK, INC.Balance Sheet
December 31, 2016
Assets Liabilities
Total Current Assets $800,000 Total Current Liabilities $666,667
Plant Assets $2,300,000 Long-term Liabilities 533,333
Less: Accumulated Depreciation $1,500,000 Total Liabilities 1,200,000
Plant Assets, Net $800,000 Stockholders’ Equity $400,000
Total Assets $1,600,000Total Liabilities and Stockholder’s Equity $1,600,000
Demonstration of E15-24
© 2016 Pearson Education, Ltd.15-39