Chapter 14 Taxation, Business Regulation, and Foreign ... · tax instruments, corporate income ......
28
Chapter 14 Taxation, Business Regulation, and Foreign Direct Investment in East Asia Sastra Sudsawasd National Institute of Development Administration (NIDA), Thailand March 2008 This chapter should be cited as Sudsawasd, S. (2008), ‘Taxation, Business Regulation, and Foreign Direct Investment in East Asia’, in Soesastro, H. (ed.), Deepening Economic Integration- The ASEAN Economic Community and Beyond-, ERIA Research Project Report 2007-1-2, Chiba: IDE-JETRO, pp.239-265.
Transcript of Chapter 14 Taxation, Business Regulation, and Foreign ... · tax instruments, corporate income ......

Chapter 14
Taxation, Business Regulation, and Foreign Direct Investment in East Asia Sastra Sudsawasd National Institute of Development Administration (NIDA), Thailand March 2008 This chapter should be cited as Sudsawasd, S. (2008), ‘Taxation, Business Regulation, and Foreign Direct Investment in East Asia’, in Soesastro, H. (ed.), Deepening Economic Integration- The ASEAN Economic Community and Beyond-, ERIA Research Project Report 2007-1-2, Chiba: IDE-JETRO, pp.239-265.

239
Chapter 14
Taxation, Business Regulation, and Foreign Direct Investment in East Asia
Sasatra Sudsawasd
INTRODUCTION
Many countries worldwide have experienced remarkable growth in FDI flows and
greater economic integration in recent years. Not surprisingly, there is increasing
recognition of FDI as an important means of achieving deeper economic integration.
Because it encourages the growth of dynamic production networks, investment is
regarded as a key driver of regional economic integration, and the role of FDI in
economic development, especially of developing countries, is widely accepted.
As a result, governments increasingly adopt tax instruments in order to compete
for and attract new FDIs. The commonly used tax instruments are the provision of tax
incentives and low corporate income tax rates. The effectiveness of these two measures,
however, is still unclear. Hence, the first aim of this research is to review the tax
instruments used in East Asia. Second, it will empirically examine the effects of those
tax instruments, corporate income taxes and tax treaties in particular, on FDI inflows.
Another important concern of this research is the relationship between business
regulations and FDI inflows. It is known that more efficient and transparent regulation
systems are associated with lower business costs, which, in turn, foster a good
investment environment. Although the positive effects of efficient regulation systems on
FDI are somewhat expected, there is a scarcity of supporting empirical research due
mainly to the limited amount of business-regulation data available.
Fortunately, the World Bank recently published a series of business-regulation
indicators derived from numerous surveys conducted in 178 countries worldwide1 .
Hence, another objective of this study is to examine whether and how business
regulations affect the investment decisions of multinational firms. The findings will

240
point to which regulation policies are crucial in enhancing a country’s attractiveness as
an FDI destination.
In summary, this research aims to accomplish several things. First, it seeks to
present an overview of tax instruments used in East Asia, which is done in Section 2.
Then, by using econometric frameworks in Sections 3 and 4, it examines the effects of
corporate income tax rates and tax treaties on FDI flows to East Asian countries and to
ASEAN-5 countries in Section 3. An empirical examination of the relationship between
various business-regulation indicators and FDI inflows is provided in Section 4. The
paper concludes with the policy implications for deepening economic integration in East
Asia in Section 5.
2. AN OVERVIEW OF TAX INSTRUMENTS IN EAST ASIA
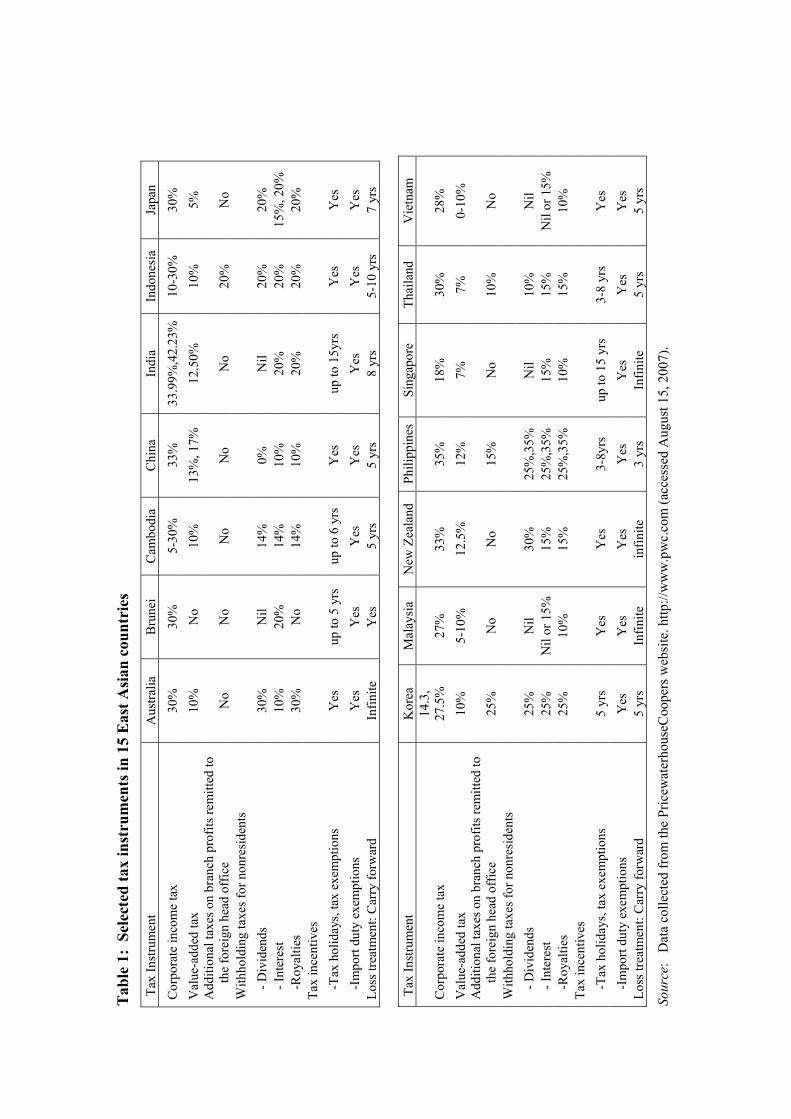
This section presents an overview of tax instruments used in 15 East Asian
countries. Summaries of selected tax instruments are shown in Table 1 below. These
selected tax instruments include tax incentive provisions2. Although the tax incentive
schemes in the East Asian countries studied vary considerably, they share similar
characteristics such as the provision of tax holidays and import duty exemptions.
Tax incentives are widely used, despite the inconclusiveness of evidence on the
cost-effectiveness of using these incentives in encouraging new investments (Zee et al.,
2002). In the East Asian context, Morisset and Pirnia (2000) and Chalk (2001) reviewed
the literature on the effectiveness of tax incentives on FDI inflows in the region. They
pointed out that even if tax policy mattered, it is not the most important consideration
for multinational firms when selecting a recipient for FDI compared to other factors
such as political and economic stability, labor cost, size of domestic market, and the
availability of basic infrastructure and raw materials. Nonetheless, they accepted that
tax incentives provisions are still important tools for investment promotions, especially
in developing countries.
Tab
le 1
: Se
lect
ed ta
x in
stru
men
ts in
15
Eas
t Asi
an c
ount
ries
Tax
Inst
rum
ent
Aus
tralia
B
rune
i C
ambo
dia
Chi
na
Indi
a In
done
sia
Japa
n C
orpo
rate
inco
me
tax
30%
30
%
5-30
%
33%
33
.99%
,42.
23%
10-3
0%
30%
V
alue
-add
ed ta
x
10%
N
o 10
%
13%
, 17%
12
.50%
10
%
5%
Add
ition
al ta
xes o
n br
anch
pro
fits r
emitt
ed to
the
fore
ign
head
off
ice
N
o N
o N
o N
o N
o 20
%
No
With
hold
ing
taxe
s for
non
resi
dent
s
- D
ivid
ends
30
%
Nil
14%
0%
N
il 20
%
20%
- Int
eres
t 10
%
20%
14
%
10%
20
%
20%
15
%, 2
0%
-Roy
altie
s 30
%
No
14%
10
%
20%
20
%
20%
Ta
x in
cent
ives
-T
ax h
olid
ays,
tax
exem
ptio
ns
Yes
up
to 5
yrs
up
to 6
yrs
Yes
up
to 1
5yrs
Y
es
Yes
-Im
port
duty
exe
mpt
ions
Y
es
Yes
Y
es
Yes
Y
es
Yes
Y
es
Loss
trea
tmen
t: C
arry
forw
ard
Infin
ite
Yes
5
yrs
5 yr
s 8
yrs
5-10
yrs
7
yrs
Tax
Inst
rum
ent
Kor
ea
Mal
aysi
a N
ew Z
eala
nd
Phili
ppin
esSi
ngap
ore
Thai
land
V
ietn
am
Cor
pora
te in
com
e ta
x 14
.3,
27.5
%
27%
33
%
35%
18
%
30%
28
%
Val
ue-a
dded
tax
10
%
5-10
%
12.5
%
12%
7%
7%
0-
10%
A
dditi
onal
taxe
s on
bran
ch p
rofit
s rem
itted
to
t
he fo
reig
n he
ad o
ffic
e
25%
N
o N
o 15
%
No
10%
N
o W
ithho
ldin
g ta
xes f
or n
onre
side
nts
- Div
iden
ds
25%
N
il 30
%
25%
,35%
Nil
10%
N
il
- Int
eres
t 25
%
Nil
or 1
5%15
%
25%
,35%
15%
15
%
Nil
or 1
5%
-R
oyal
ties
25%
10
%
15%
25
%,3
5%10
%
15%
10
%
Tax
ince
ntiv
es
-Tax
hol
iday
s, ta
x ex
empt
ions
5
yrs
Yes
Y
es
3-8y
rs
up to
15
yrs
3-8
yrs
Yes
-Im
port
duty
exe
mpt
ions
Y
es
Yes
Y
es
Yes
Y
es
Yes
Y
es
Loss
trea
tmen
t: C
arry
forw
ard
5 yr
s In
finite
in
finite
3
yrs
Infin
ite
5 yr
s 5
yrs
Sour
ce:
Dat
a co
llect
ed fr
om th
e Pr
icew
ater
hous
eCoo
pers
web
site
. http
://w
ww
.pw
c.co
m (a
cces
sed
Aug
ust 1
5, 2
007)
.

242
Additionally, a study by Halvorsen (1995) analyzed the cost-effectiveness of
various fiscal incentive instruments in Thailand and found little justification for the use
of such incentives. However, he acknowledged the need for correct incentives when the
objective is to alter the composition of investments, not to promote or attract
investments in general.
Fletcher (2002) analyzed tax incentives in the Lower Mekong (Cambodia, Lao
PDR, and Viet Nam) region and found that tax incentives are not a primary driver of
FDI inflows. Although his findings could be interpreted as evidence of the
ineffectiveness of tax incentives, the methodology he used was somewhat questionable
because he defined tax incentives simply as the natural log of the number of lines in the
description PricewaterhouseCoopers provided in its tax summary. By defining tax
incentives in this manner, the correct measure of the tax incentive schemes that could be
more generous with the shorter number of lines may not be provided.
On the issue of corporate income taxes, Singapore offers one of the lowest tax
rates in the region. Its tax rate is flat at 18 percent, around half of the tax rates in China
and the Philippines. Theoretically, lower corporate income tax rates increase the net
return on capital, which, in turn, encourages new investment and capital inflows3.
Empirical evidence also points to the same direction. A country with higher tax rates
appears to be less attractive for investment inflows (e.g., Hartman, 1984; Shah and
Slemrod, 1990). With its low corporate income tax rate, Singapore is a very attractive
investment destination in East Asia.
There is pressure on countries to lower their corporate income tax rates to ensure
their competitive position in today’s global economy. Many countries have attempted to
shift their tax system from income-based taxes to consumption-based taxes such as the
value-added (VAT) tax. 4 As a result, the world has been experiencing more tax
competition as economies globalize and capital mobility increases.
This inevitably leads to a “race-to-the-bottom” situation, which could harm all
countries involved as collected tax revenues decrease, leading to less provision of public
goods. In addition, tax competition itself makes economic integration difficult.

Tab
le 2
: D
ate
of c
oncl
usio
n of
bila
tera
l tax
trea
ties
Coun
try
Austr
alia
Japa
n Th
ailan
d Ph
ilippin
es
Malay
sia
Vietn
am
China
Si
ngap
ore
India
Indon
esia
Kore
a Br
unei
Laos
My
anma
r NZ
Au
strali
a -
Mar-6
9 Au
g-89
Ma
y-79
Aug-
80
Apr-9
2
Feb-
69
Jul-9
1 Ap
r-92
Jul-8
2
Jan-
95
Japa
n Ma
r-69
-
Feb-
80
Feb-
99
Oct-9
5 Se
p-83
Ap
r-94
Mar-8
9 Ma
r-82
Oct-9
8
Jan-
63
Thail
and
Aug-
89
-
Jul-8
2 Ma
r-82
Dec-9
2 Oc
t-86
Sep-
75
Mar-8
5 Ju
n-01
Au
g-74
Jun-
97
Oc
t-98
Philip
pines
Ma
y-79
Feb-
80
Jul-8
2 -
Apr-8
2 No
v-01
Nov-9
9 Au
g-77
Fe
b-90
Ju
n-81
Fe
b-84
Apr-8
0 Ma
laysia
Au
g-80
Fe
b-99
Ma
r-82
Apr-8
2 -
Sep-
95
Nov-8
5 Oc
t-04
May-0
1 Se
p-91
Ma
r-76
Vietn
am
Apr-9
2 Oc
t-95
Dec-9
2 No
v-01
Sep-
95
- Ma
y-95
Mar-9
4 Se
p-94
De
c-97
May-9
4
Ch
ina
Se
p-83
Oc
t-86
Nov-9
9 No
v-85
May-9
5 -
Apr-8
6 Ju
l-94
Nov-0
1 Ma
r-94
Ja
n-99
Sep-
86
Sing
apor
e Fe
b-69
Ap
r-94
Sep-
75
Aug-
77
Oct-0
4 Ma
r-94
Apr-8
6 -
Jan-
94
May-9
0 No
v-79
Aug-
05
Fe
b-99
Au
g-73
Ind
ia Ju
l-91
Mar-8
9 Ma
r-85
Feb-
90
May-0
1 Se
p-94
Ju
l-94
Jan-
94
- Au
g-87
Ju
l-85
Oc
t-86
Indon
esia
Apr-9
2 Ma
r-82
Jun-
01
Jun-
81
Sep-
91
Dec-9
7 No
v-01
May-9
0 Au
g-87
-
Nov-8
8 Fe
b-00
Apr-0
3 Ma
r-87
Ko
rea
Jul-8
2 Oc
t-98
Aug-
74
Feb-
84
Ma
y-94
Mar-9
4 No
v-79
Jul-8
5 No
v-88
-
Nov-0
4 Fe
b-02
Oc
t-81
Brun
ei
Aug-
05
Fe
b-00
-
Laos
Ju
n-97
Jan-
99
No
v-04
-
Myan
mar
Fe
b-99
Apr-0
3 Fe
b-02
-
Ne
w Ze
aland
Ja
n-95
Ja
n-63
Oc
t-98
Apr-8
0 Ma
r-76
Se
p-86
Au
g-73
Oc
t-86
Mar-8
7 Oc
t-81
-
Sour
ce: I
nter
natio
nal B
urea
u fo
r Fis
cal D
ocum
enta
tion
web
site
. http
://w
ww
.ibfd
.org
(acc
esse
d Se
ptem
ber 1
5, 2
007)
.
Tab
le 3
: D
ivid
end
with
hold
ing
tax
rate
s in
tax
trea
ties
Contr
actin
g Stat
e
Austr
alia
Japa
n Th
ailan
d Ph
ilippin
es
Malay
sia
Vietn
am
China
Si
ngap
ore
India
Indon
esia
Kore
a Br
unei
Laos
My
anma
r NZ
Au
strali
a -
15
%
15%
,20%
15
%,25
%
0%
0%
0%
15
%
15%
15
%
15
%
Japa
n 15
%
-
10
%,25
%
5%,15
%
0%
10%
0%
15
%
10%
,15%
5%
,15%
15%
Th
ailan
d 15
%,20
%
20%
-
15
%,20
%
0%
0%
15%
,20%
0%
15
%,20
%
15%
, 20%
15
%, 2
0%
15
%
15
%
Philip
pines
15
%,25
%
10%
,25%
15
%,20
%
-
0%
0%
10%
,15%
0%
15
%,20
%
15%
, 20%
10
%,15
%
15
%
Malay
sia
0%,15
%
5%,15
%
15%
,20%
15
%,25
%
-
0%
10%
0%
10
%
15%
15
%
15
%
Vietn
am
15%
10
%
15%
10
%,15
%
10%
-
10
%
0%
10%
15
%
10%
Ch
ina
10
%
15%
,20%
10
%,15
%
0%
0%
-
0%
10%
10
%
5%,10
%
5%
15%
Si
ngap
ore
15%
5%
,15%
20
%
15%
,25%
5%
,10%
0%
7%
,12%
-
10
%,15
%
10%
,15%
10
%,15
%
10%
5%,10
%
15%
Ind
ia 15
%
15%
15
%,20
%
15%
,20%
10
%
0%
10%
0%
-
10
%,15
%
15%
, 20%
15%
Ind
ones
ia 15
%
10%
,15%
15
%,20
%
15%
,20%
0%
0%
10
%
0%
10%
,15%
-
10
%,15
%
15%
15
%
Kore
a 15
%
5%,15
%
15%
,20%
10
%,15
%
0%
0%
5%,10
%
0%
15%
,20%
10
%,15
%
-
5%
,10%
10
%
15%
Br
unei
0%
15%
-
La
os
15%
5%
5%
,10%
-
Myan
mar
0%
10
%
-
Ne
w Ze
aland
15
%
15%
15
%
15%
0%
15%
0%
15
%
15%
15
%
-
N
ote:
The
rate
s pr
ovid
ed a
re th
e m
axim
um w
ithho
ldin
g ra
tes
shou
ld a
con
tract
ing
stat
e im
pose
a w
ithho
ldin
g ta
x on
div
iden
ds in
the
futu
re. W
here
a tr
eaty
rate
is
high
er th
an th
e do
mes
tic ra
te, t
he la
tter i
s app
licab
le. I
f the
trea
ty p
rovi
des f
or a
rate
low
er th
an th
e do
mes
tic ra
te, t
he re
duce
d tre
aty
rate
may
be
appl
ied
at so
urce
. So
urce
: Dat
a ar
e co
llect
ed fr
om th
e In
tern
atio
nal B
urea
u fo
r Fis
cal D
ocum
enta
tion
web
site
. http
://w
ww
.ibfd
.org
(acc
esse
d Se
ptem
ber 1
5, 2
007)
.

244
Another tax instrument worth considering is the bilateral tax treaty agreements.
Tables 2 and 3 below provide a summary of conclusion date and dividend withholding
tax rate of the existing bilateral tax treaty agreements across 15 East Asian countries.
Apparently, there is a lack of a comprehensive network of tax treaty agreements within
East Asia. This lack is associated with double taxation, tax avoidance, and inconsistent
definition of tax bases. In addition, it increases business costs, compliance costs, and
administrative costs.
While many East Asian countries (e.g., Singapore and Indonesia) have extensive
bilateral treaty networks, many others (e.g., Brunei, Lao, Myanmar) have very limited
networks with other East Asian countries. Cambodia, though not reported, does not
have tax treaty agreements with any of the 15 East Asian countries. Several ASEAN
member countries also offer more favorable treaty agreements to non-ASEAN member
countries than they do to ASEAN member countries (Farrow and Jogarajan, 2006). This
is an impediment to economic integration in East Asia.
The bilateral tax treaty agreements of each East Asian country differ substantially
among themselves. For instance, New Zealand offers a single, flat withholding tax rate
on dividends to all bilateral treaty partners. This flat tax rate results in lower business
and administrative costs compared to other tax rate regimes.
Many tax treaties were concluded a long time ago. Some of them, such as Japan’s
and New Zealand’s treaties, are more than 40 years old, which means they may be
obsolete and out of step with the changes that have happened in the global economy
since then. It is time-consuming and costly to revise each bilateral tax treaty separately.
This may also result in tax treaties with less bargaining power than treaties that are
negotiated as a whole region. One possible direction to take in order to deepen the
process of economic integration in East Asia is to develop a standard regional
framework of tax treaty agreements to be implemented across the entire East Asia. Such
framework will definitely enhance regional economic integration.
245
3. CORPORATE INCOME TAX, TAX TREATY,
AND FOREIGN DIRECT INVESTMENT
3.1. Model specification
This section analyzes factor determinants of bilateral FDI inflows and undertakes an
empirical assessment of the impacts of tax instruments; namely, corporate income taxes
and tax treaties on FDI inflows to East Asian countries and specifically to ASEAN-5
countries.5 The model used is simply a modification of the standard gravity model of
bilateral FDI flows, augmented by adding corporate tax rates and tax treaty variables as
parameters of interest. The model specification is in the form:
,ln
lnlnlnlnln
65
43210
ijtijtij
jtitjtitijt
ZDist
GDPPCGDPPCGDPGDPFDI
εββ
βββββ
+++
++++=
where FDI denotes flows of outward FDI from FDI home country; i to FDI recipient
country j in year t; Z is the set of parameters of interest; and ijtε is a residual term,
which may not be a well-behaved white noise. To remedy potential estimation errors, a
country-specific effect and a time-specific effect are introduced to capture omitted
country, time-invariant effects and omitted time-variant effects.
FDI flows are basically determined by traditional gravity variables including GDP
(GDP) and GDP per capita (GDPPC) of FDI home and recipient countries, capturing
the sizes of economies and proxy of labor costs. In addition, FDI flows are determined
by the distance (Dist) between FDI home and recipient countries’ proxy for
transportation and other trade costs that may influence firms’ investment decisions.
For the parameters of interest, the effects of corporate income tax rates (Tax) in
FDI home and recipient countries are examined. The estimated effects are hypothesized
to be positive in the case of home country tax rates )( iTax and negative in the case of
recipient country tax rates )( jTax . As stated, an increase in the corporate income tax rate
246
lowers the level of investment by increasing the net return to capital. This encourages
capital outflows. Hence, the estimated coefficient of iTax is expected to be positive.
Likewise, recipient countries with higher corporate income tax rates would be less
attractive for foreign investments, resulting to less capital inflows. Thus, the estimated
coefficient of jTax is hypothesized to be negative. This research also examines the
sensitivity of the difference between FDI recipient and home countries’ corporate
income tax rates )( itjt TaxTax − , which is hypothesized to have a negative impact on FDI
inflows.
Tax treaties, which are the rules on how taxes paid in an FDI recipient country are
treated in an FDI home country, are expected to have some influence on the level of
FDI inflows. Tax treaties are believed to increase investment since they indicate the tax
cooperation between treaty partners and claim to remove tax barriers to investment
(Davies, 2003; Blonigen and Davies, 2002). However, it is less certain whether tax
treaties can actually increase investment. Since tax treaties reduce double taxation and
minimize opportunities for tax avoidance and other tax savings, treaties may hamper the
level of investment outflows instead (Blonigen and Davies, 2002). Hence, the effects of
tax treaties on FDI flows are theoretically ambiguous. What is more important at this
point is empirical evidence. Unfortunately, the existing empirical evidence on the
effects of tax treaties on FDI flows showed mixed results and hardly support the theory
that tax treaty formation is associated with more FDI inflows.
For instance, Blonigen and Davies (2002) used panel data of OECD countries
over the period 1992 to 2002 and found strong negative impacts of tax treaties on FDI
flows. Their findings are in contrast with the FDI promotion rationale for tax treaty
formation. Later, Davies (2003) used the same panel data as Blonigen and Davies
(2002) to estimate the effect of U.S. treaty renegotiations on FDI from 1966 to 2000 and
found tax treaties to have an insignificant effect.
In particular, there is scarcity of literature examining the impacts of tax treaties in
East Asia. Thus, another aim of this research is to examine the impact of tax treaties
)(Treaty on FDI inflows to East Asian countries as well as to the ASEAN-5 countries.
In line with this aim, the Treaty variable is added in the models described above. The
247
findings in this section will provide more insight on factors determining FDI inflows to
East Asia.
3.2. Data and empirical issues
The analysis was limited to FDI outflows from 30 OECD countries to 11 East
Asian countries over the period 1990 to 20036. Data on FDI outflows were obtained
from the Source OECD database. Data on GDP and GDP per capita were collected from
the World Development Indicators. All data are in U.S. dollars and are adjusted for
inflation. Distance between the FDI host and recipient countries data were obtained
from Andrew Rose’s (2005) data set.
For the Tax variable, corporate income tax rates were measured by the apparent
average tax rates (e.g., Benassy-Quere et al., 2003; Desai et al., 2004) expressed as
percentages of GDP, which is calculated by taking the ratio of the actual tax collected to
GDP multiplied by 100. Data on corporate income taxes were collected from the
Government Financial Statistics. The Treaty variable is a dummy variable, which takes
a value of one when tax treaties for bilateral FDI partners are in force and zero
otherwise. Tax treaties defined by income tax treaties were collected from the
International Bureau for Fiscal Documentation.
For the estimation technique, this research implemented the ordinal least square
regression (OLS) model estimator. As previously mentioned, an error term may not be a
white noise leading to estimation errors. Thus, this research introduced unobservable
recipient country and/or time fixed effects error components to capture the influence
individual recipient country characteristics and individual year characteristics may have
on FDI inflows. These estimations are known as one-way fixed effects and two-way
fixed effects model estimators. In all estimators, robust standard errors are employed.
3.3. Empirical findings
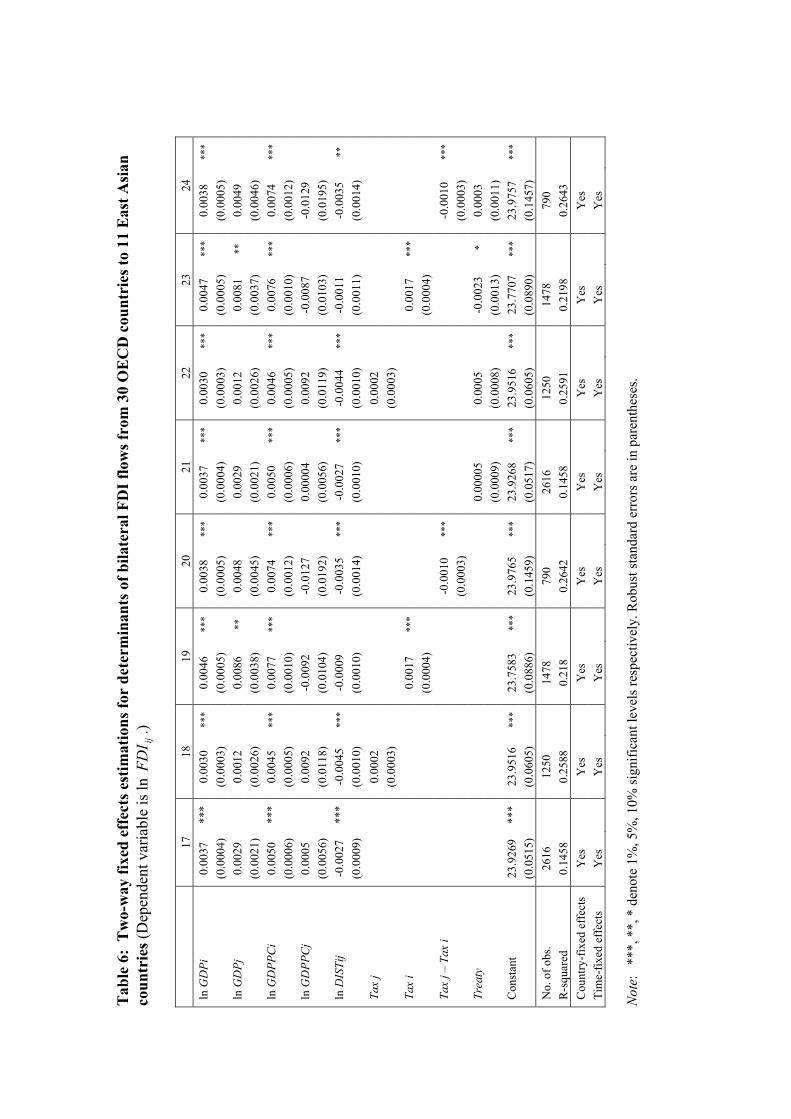
All estimation results are reported in Tables 4 to 9. Note that the estimated time
effects are rarely significant. The findings suggest no common unobservable time
248
factors influencing the level of FDI flows to East Asian countries during the sample
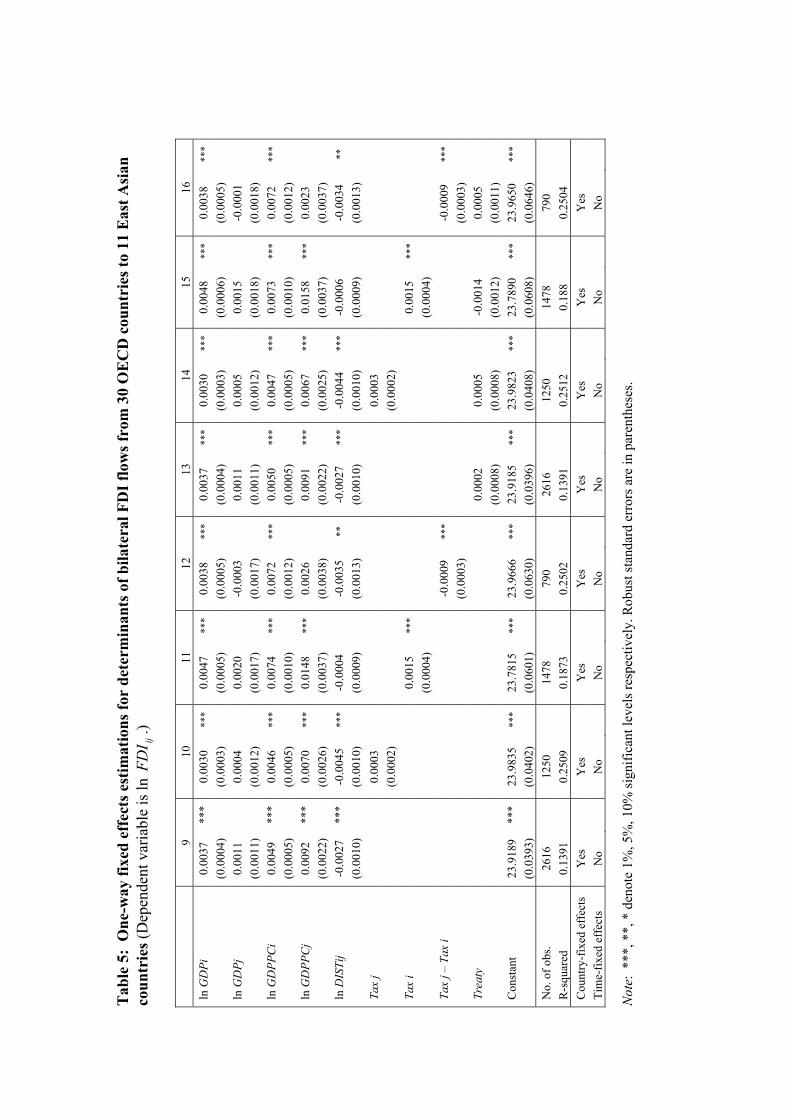
periods. Hence, the following analysis was based mainly on the one-way fixed effects
model estimations. The findings are summarized next.
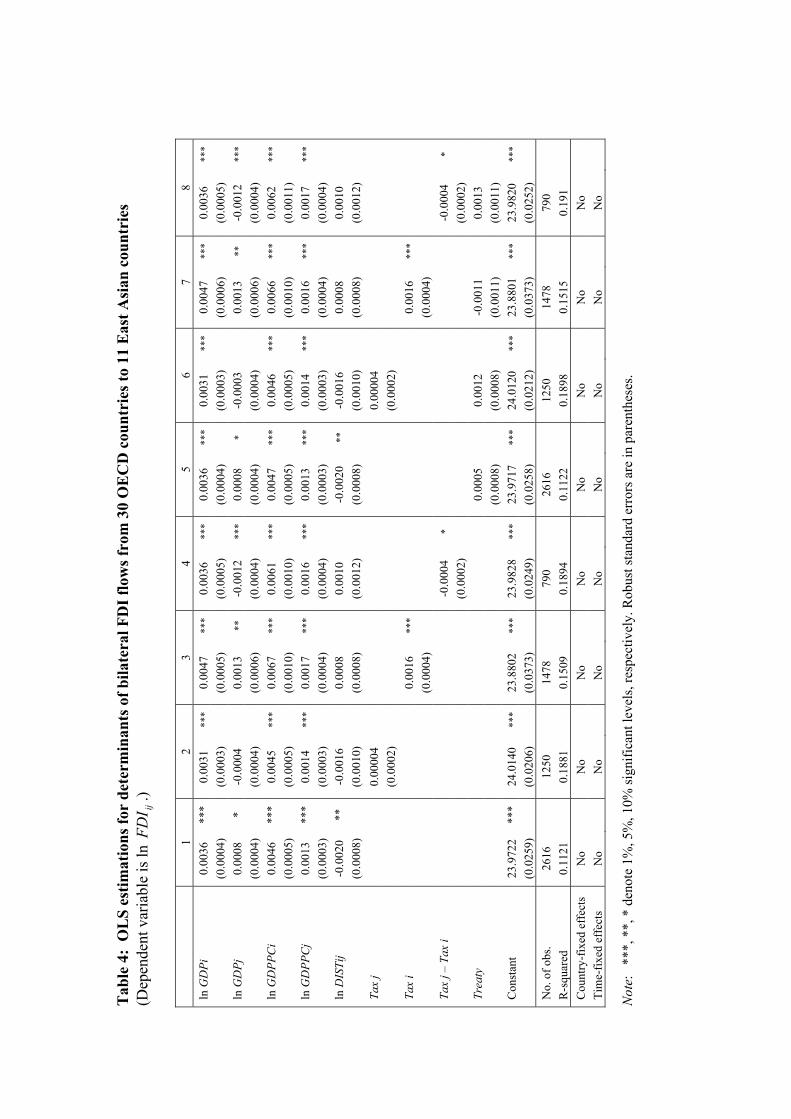
First, the coefficient of FDI home country GDP levels is significantly positive.
This indicates that the size of FDI home countries is relevant to firms’ investment
decisions. The larger the size of the home country, the higher are the FDI outflows
expected. On the other hand, it was found that the size of FDI recipient country GDP
levels did not have a strong influence on the decision to invest for OECD multinational
firms, especially in the case of the 11 East Asian recipient countries’ estimation.
Second, this research used GDP per capita to proxy labor costs in FDI home and
recipient countries. The estimation suggests that labor costs in the OECD home
countries are positively associated with FDI outflows. Thus, OECD investors are
sensitive to their domestic labor costs. From the estimation of the ASEAN-5 recipient
countries, labor costs in recipient countries were found to be significantly related to the
level of FDI inflows. Moreover, from the estimation of the 11 East Asian recipient
countries, the estimated coefficient of recipient labor costs turned out to be positive and
significant. This is perhaps because some of the 11 East Asian countries (e.g., Japan and
Singapore) are developed countries. The level of FDI flows to these countries is
probably not induced by lower labor costs, but by their highly developed capital markets.
Consequently, the estimated coefficient of the jGDPPC variable was found to be
positive.
Third, FDI flows were found to be a negative function of the distance between
FDI home and recipient countries. This finding indicates that transportation costs
between home and recipient countries are another relevant factor on firms’ decisions to
invest in East Asian countries. Investors from OECD member countries tend to prefer
investing in recipient countries that are nearer the home countries.
Corporate income tax rates were introduced next. Interestingly, the recipient
country tax rates )( jTax variable appears to be insignificant. The findings indicate that
corporate income tax rates of East Asian countries do not have a significant impact on
the level of FDI inflows from the 30 OECD countries. In contrast, when the home
country corporate income tax rates )( iTax variable was included, the coefficient of
249
iTax variable turned out to be significant and positive. These findings point to the
importance of OECD home countries’ tax policies on firms’ decisions to invest in East
Asian countries. A home country with higher corporate income tax rates is highly likely
to invest more in East Asia.
When the sensitivity of the difference between FDI recipient country and home
country corporate tax rates was assessed, the estimated coefficient was significantly
negative. Now home country corporate income tax rates become relevant to firms’
investment decisions. This finding contradicted earlier findings on the jTax variable. It
is not clear whether the significant effects of the tax rates differentials are the results of
either of these two factors: the relevance of the home and recipient countries’ tax
policies or the home countries’ tax policies dictating the outcomes. The findings,
however, suggest that both the FDI home and recipient countries’ tax policies may exert
some influence on the level of FDI flows. While holding all other factors equal, an
increase in the recipient country’s tax rates reduces its attractiveness as an FDI
destination.
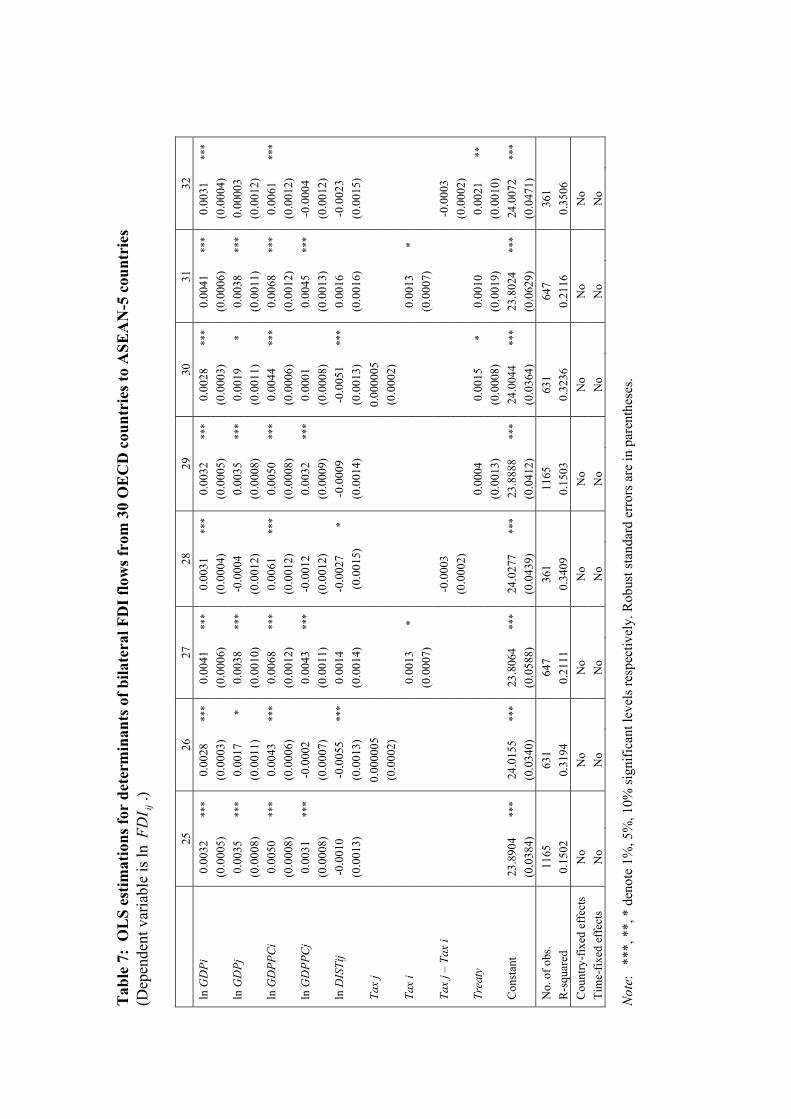
Regarding the impacts of bilateral income tax treaties on FDI flows, several
findings are worth noting. First, the impacts are not significantly different from zero
when data from all 11 East Asian recipient countries are estimated. This suggests that
the level of FDI decisions is not affected by the formation of tax treaties alone. However,
when the estimation includes only the ASEAN-5 recipient countries, the estimated
effects become different. Now with the inclusion of the recipient country tax rates or the
tax rates differentials variables, the estimations show the positive impact of tax treaties
on the level of FDI inflows. Compare this with the insignificant impact of tax treaties
when the home country tax rates variable is included. Nonetheless, the findings provide
some evidence supporting the view of the FDI promotion rationale for tax treaty
formation, especially in the case of the ASEAN-5 countries.
Tab
le 4
: O
LS
estim
atio
ns fo
r de
term
inan
ts o
f bila
tera
l FD
I flo
ws f
rom
30
OE
CD
cou
ntri
es to
11
Eas
t Asi
an c
ount
ries
(D
epen
dent
var
iabl
e is
ln
ijFD
I.)
1
2 3
4 5
6 7
8 ln
GD
Pi
0.00
36
***
0.00
31
***
0.00
47
***
0.00
36
***
0.00
36
***
0.00
31
***
0.00
47
***
0.00
36
***
(0
.000
4)
(0
.000
3)
(0.0
005)
(0
.000
5)
(0.0
004)
(0
.000
3)
(0.0
006)
(0
.000
5)
ln
GD
Pj
0.00
08
* -0
.000
4
0.00
13
**-0
.001
2 **
*0.
0008
*
-0.0
003
0.
0013
**
-0.0
012
***
(0
.000
4)
(0
.000
4)
(0.0
006)
(0
.000
4)
(0.0
004)
(0
.000
4)
(0.0
006)
(0
.000
4)
ln
GD
PPC
i 0.
0046
**
* 0.
0045
**
*0.
0067
**
*0.
0061
**
*0.
0047
**
*0.
0046
**
*0.
0066
**
*0.
0062
**
*
(0.0
005)
(0.0
005)
(0
.001
0)
(0.0
010)
(0
.000
5)
(0.0
005)
(0
.001
0)
(0.0
011)
ln G
DPP
Cj
0.00
13
***
0.00
14
***
0.00
17
***
0.00
16
***
0.00
13
***
0.00
14
***
0.00
16
***
0.00
17
***
(0
.000
3)
(0
.000
3)
(0.0
004)
(0
.000
4)
(0.0
003)
(0
.000
3)
(0.0
004)
(0
.000
4)
ln
DIS
Tij
-0.0
020
**
-0.0
016
0.
0008
0.00
10
-0
.002
0 **
-0.0
016
0.
0008
0.00
10
(0.0
008)
(0.0
010)
(0
.000
8)
(0.0
012)
(0
.000
8)
(0.0
010)
(0
.000
8)
(0.0
012)
Tax
j
0.
0000
4
0.00
004
(0.0
002)
(0
.000
2)
Tax
i
0.
0016
**
*
0.
0016
**
*
(0.0
004)
(0
.000
4)
Tax
j – T
ax i
-0.0
004
*
-0
.000
4 *
(0
.000
2)
(0.0
002)
Trea
ty
0.00
05
0.
0012
-0.0
011
0.
0013
(0
.000
8)
(0.0
008)
(0
.001
1)
(0.0
011)
Con
stan
t 23
.972
2 **
* 24
.014
0 **
*23
.880
2 **
*23
.982
8 **
*23
.971
7 **
*24
.012
0 **
*23
.880
1**
*23
.982
0 **
*
(0.0
259)
(0.0
206)
(0
.037
3)
(0.0
249)
(0
.025
8)
(0.0
212)
(0
.037
3)
(0.0
252)
No.
of o
bs.
2616
1250
1478
790
26
16
12
50
14
78
79
0
R-s
quar
ed
0.11
21
0.
1881
0.15
09
0.
1894
0.11
22
0.
1898
0.15
15
0.
191
C
ount
ry-f
ixed
eff
ects
No
N
o
No
N
o
No
N
o
No
N
o
Tim
e-fix
ed e
ffec
ts
No
N
o
No
N
o
No
N
o
No
N
o
Not
e:
***,
**,
* d
enot
e 1%
, 5%
, 10%
sign
ifica
nt le
vels
, res
pect
ivel
y. R
obus
t sta
ndar
d er
rors
are
in p
aren
thes
es.
Tab
le 5
: O
ne-w
ay fi
xed
effe
cts e
stim
atio
ns fo
r de
term
inan
ts o
f bila
tera
l FD
I flo
ws f
rom
30
OE
CD
cou
ntri
es to
11
Eas
t Asi
an
coun
trie
s (D
epen
dent
var
iabl
e is
ln
ijFD
I.)
9
10
11
12
13
14
15
16
ln G
DPi
0.
0037
**
* 0.
0030
**
*0.
0047
**
*0.
0038
**
*0.
0037
**
*0.
0030
**
*0.
0048
**
*0.
0038
**
*
(0.0
004)
(0.0
003)
(0
.000
5)
(0.0
005)
(0
.000
4)
(0.0
003)
(0
.000
6)
(0.0
005)
ln G
DPj
0.
0011
0.00
04
0.
0020
-0.0
003
0.
0011
0.00
05
0.
0015
-0.0
001
(0.0
011)
(0.0
012)
(0
.001
7)
(0.0
017)
(0
.001
1)
(0.0
012)
(0
.001
8)
(0.0
018)
ln G
DPP
Ci
0.00
49
***
0.00
46
***
0.00
74
***
0.00
72
***
0.00
50
***
0.00
47
***
0.00
73
***
0.00
72
***
(0
.000
5)
(0
.000
5)
(0.0
010)
(0
.001
2)
(0.0
005)
(0
.000
5)
(0.0
010)
(0
.001
2)
ln
GD
PPC
j 0.
0092
**
* 0.
0070
**
*0.
0148
**
*0.
0026
0.00
91
***
0.00
67
***
0.01
58
***
0.00
23
(0.0
022)
(0.0
026)
(0
.003
7)
(0.0
038)
(0
.002
2)
(0.0
025)
(0
.003
7)
(0.0
037)
ln D
ISTi
j -0
.002
7 **
* -0
.004
5 **
*-0
.000
4
-0.0
035
**-0
.002
7 **
*-0
.004
4 **
*-0
.000
6
-0.0
034
**
(0.0
010)
(0.0
010)
(0
.000
9)
(0.0
013)
(0
.001
0)
(0.0
010)
(0
.000
9)
(0.0
013)
Tax
j
0.
0003
0.00
03
(0.0
002)
(0
.000
2)
Tax
i
0.
0015
**
*
0.
0015
**
*
(0.0
004)
(0
.000
4)
Tax
j – T
ax i
-0.0
009
***
-0.0
009
***
(0
.000
3)
(0.0
003)
Trea
ty
0.00
02
0.
0005
-0.0
014
0.
0005
(0
.000
8)
(0.0
008)
(0
.001
2)
(0.0
011)
Con
stan
t 23
.918
9 **
* 23
.983
5 **
*23
.781
5 **
*23
.966
6 **
*23
.918
5 **
*23
.982
3 **
*23
.789
0**
*23
.965
0 **
*
(0.0
393)
(0.0
402)
(0
.060
1)
(0.0
630)
(0
.039
6)
(0.0
408)
(0
.060
8)
(0.0
646)
No.
of o
bs.
2616
1250
1478
790
26
16
12
50
14
78
79
0
R-s
quar
ed
0.13
91
0.
2509
0.18
73
0.
2502
0.13
91
0.
2512
0.18
8
0.25
04
C
ount
ry-f
ixed
eff
ects
Yes
Yes
Yes
Yes
Yes
Yes
Yes
Yes
Tim
e-fix
ed e
ffec
ts
No
N
o
No
N
o
No
N
o
No
N
o
Not
e: *
**, *
*, *
den
ote
1%, 5
%, 1
0% si
gnifi
cant
leve
ls re
spec
tivel
y. R
obus
t sta
ndar
d er
rors
are
in p
aren
thes
es.
Tab
le 6
: T
wo-
way
fixe
d ef
fect
s est
imat
ions
for
dete
rmin
ants
of b
ilate
ral F
DI f
low
s fro
m 3
0 O
EC
D c
ount
ries
to 1
1 E
ast A
sian
co
untr
ies (
Dep
ende
nt v
aria
ble
is ln
ij
FDI
.)
17
18
19
20
21
22
23
24
ln G
DPi
0.
0037
**
* 0.
0030
**
*0.
0046
**
*0.
0038
**
*0.
0037
**
*0.
0030
**
*0.
0047
**
*0.
0038
**
*
(0.0
004)
(0.0
003)
(0
.000
5)
(0.0
005)
(0
.000
4)
(0.0
003)
(0
.000
5)
(0.0
005)
ln G
DPj
0.
0029
0.00
12
0.
0086
**
0.
0048
0.00
29
0.
0012
0.00
81
**0.
0049
(0
.002
1)
(0
.002
6)
(0.0
038)
(0
.004
5)
(0.0
021)
(0
.002
6)
(0.0
037)
(0
.004
6)
ln
GD
PPC
i 0.
0050
**
* 0.
0045
**
*0.
0077
**
*0.
0074
**
*0.
0050
**
*0.
0046
**
*0.
0076
**
*0.
0074
**
*
(0.0
006)
(0.0
005)
(0
.001
0)
(0.0
012)
(0
.000
6)
(0.0
005)
(0
.001
0)
(0.0
012)
ln G
DPP
Cj
0.00
05
0.
0092
-0.0
092
-0
.012
7
0.00
004
0.
0092
-0.0
087
-0
.012
9
(0
.005
6)
(0
.011
8)
(0.0
104)
(0
.019
2)
(0.0
056)
(0
.011
9)
(0.0
103)
(0
.019
5)
ln
DIS
Tij
-0.0
027
***
-0.0
045
***
-0.0
009
-0
.003
5 **
*-0
.002
7 **
*-0
.004
4 **
*-0
.001
1
-0.0
035
**
(0.0
009)
(0.0
010)
(0
.001
0)
(0.0
014)
(0
.001
0)
(0.0
010)
(0
.001
1)
(0.0
014)
Tax
j
0.
0002
0.00
02
(0.0
003)
(0
.000
3)
Tax
i
0.
0017
**
*
0.
0017
**
*
(0.0
004)
(0
.000
4)
Tax
j – T
ax i
-0.0
010
***
-0.0
010
***
(0
.000
3)
(0.0
003)
Trea
ty
0.00
005
0.
0005
-0.0
023
*
0.00
03
(0.0
009)
(0
.000
8)
(0.0
013)
(0
.001
1)
C
onst
ant
23.9
269
***
23.9
516
***
23.7
583
***
23.9
765
***
23.9
268
***
23.9
516
***
23.7
707
***
23.9
757
***
(0
.051
5)
(0
.060
5)
(0.0
886)
(0
.145
9)
(0.0
517)
(0
.060
5)
(0.0
890)
(0
.145
7)
N
o. o
f obs
. 26
16
12
50
14
78
79
0
2616
1250
1478
790
R
-squ
ared
0.
1458
0.25
88
0.
218
0.
2642
0.14
58
0.
2591
0.21
98
0.
2643
Cou
ntry
-fix
ed e
ffec
tsY
es
Y
es
Y
es
Y
es
Y
es
Y
es
Y
es
Y
es
Ti
me-
fixed
eff
ects
Y
es
Y
es
Y
es
Y
es
Y
es
Y
es
Y
es
Y
es
Not
e:
***,
**,
* d
enot
e 1%
, 5%
, 10%
sign
ifica
nt le
vels
resp
ectiv
ely.
Rob
ust s
tand
ard
erro
rs a
re in
par
enth
eses
.
Tab
le 7
: O
LS
estim
atio
ns fo
r de
term
inan
ts o
f bila
tera
l FD
I flo
ws f
rom
30
OE
CD
cou
ntri
es to
ASE
AN
-5 c
ount
ries
(D
epen
dent
var
iabl
e is
ln
ijFD
I.)
25
26
27
28
29
30
31
32
ln
GD
Pi
0.00
32
***
0.00
28
***
0.00
41
***
0.00
31
***
0.00
32
***
0.00
28
***
0.00
41
***
0.00
31
***
(0
.000
5)
(0
.000
3)
(0.0
006)
(0
.000
4)
(0
.000
5)
(0.0
003)
(0
.000
6)
(0.0
004)
ln
GD
Pj
0.00
35
***
0.00
17
*
0.00
38
***
-0.0
004
0.
0035
**
*0.
0019
*
0.00
38
***
0.00
003
(0.0
008)
(0.0
011)
(0
.001
0)
(0.0
012)
(0.0
008)
(0
.001
1)
(0.0
011)
(0
.001
2)
ln G
DPP
Ci
0.00
50
***
0.00
43
***
0.00
68
***
0.00
61
***
0.00
50
***
0.00
44
***
0.00
68
***
0.00
61
***
(0
.000
8)
(0
.000
6)
(0.0
012)
(0
.001
2)
(0
.000
8)
(0.0
006)
(0
.001
2)
(0.0
012)
ln
GD
PPC
j 0.
0031
**
* -0
.000
2
0.00
43
***
-0.0
012
0.
0032
**
*0.
0001
0.00
45
***
-0.0
004
(0.0
008)
(0.0
007)
(0
.001
1)
(0.0
012)
(0.0
009)
(0
.000
8)
(0.0
013)
(0
.001
2)
ln D
ISTi
j -0
.001
0
-0.0
055
***
0.00
14
-0
.002
7 *
-0
.000
9
-0.0
051
***
0.00
16
-0
.002
3
(0
.001
3)
(0
.001
3)
(0.0
014)
(0
.001
5)
(0.0
014)
(0
.001
3)
(0.0
016)
(0
.001
5)
Tax
j
0.
0000
05
0.00
0005
(0.0
002)
(0
.000
2)
Tax
i
0.
0013
*
0.
0013
*
(0
.000
7)
(0.0
007)
Tax
j – T
ax i
-0.0
003
-0
.000
3
(0
.000
2)
(0
.000
2)
Trea
ty
0.00
04
0.
0015
*
0.00
10
0.
0021
**
(0
.001
3)
(0.0
008)
(0
.001
9)
(0.0
010)
C
onst
ant
23.8
904
***
24.0
155
***
23.8
064
***
24.0
277
***
23.8
888
***
24.0
044
***
23.8
024
***
24.0
072
***
(0
.038
4)
(0
.034
0)
(0.0
588)
(0
.043
9)
(0
.041
2)
(0.0
364)
(0
.062
9)
(0.0
471)
N
o. o
f obs
. 11
65
63
1
647
36
1
1165
631
64
7
361
R
-squ
ared
0.
1502
0.31
94
0.
2111
0.34
09
0.
1503
0.32
36
0.
2116
0.35
06
C
ount
ry-f
ixed
eff
ects
No
N
o
No
N
o
No
N
o
No
N
o
Tim
e-fix
ed e
ffec
ts
No
N
o
No
N
o
No
N
o
No
N
o
Not
e:
***,
**,
* d
enot
e 1%
, 5%
, 10%
sign
ifica
nt le
vels
resp
ectiv
ely.
Rob
ust s
tand
ard
erro
rs a
re in
par
enth
eses
.

Tab
le 8
: O
ne-w
ay fi
xed
effe
cts e
stim
atio
ns fo
r de
term
inan
ts o
f bila
tera
l FD
I flo
ws f
rom
30
OE
CD
cou
ntri
es to
ASE
AN
-5
coun
trie
s (D
epen
dent
var
iabl
e is
ln
ijFD
I.)
33
34
35
36
37
38
39
40
ln
GD
Pi
0.00
32
***
0.00
28
***
0.00
41
***
0.00
31
***
0.00
32
***
0.00
28
***
0.00
41
***
0.00
32
***
(0
.000
5)
(0
.000
3)
(0.0
006)
(0
.000
4)
(0
.000
5)
(0.0
003)
(0
.000
6)
(0.0
004)
ln
GD
Pj
0.00
22
**
0.00
14
0.
0018
0.00
04
0.
0022
**
0.00
16
0.
0018
0.00
15
(0.0
010)
(0.0
012)
(0
.001
6)
(0.0
016)
(0.0
011)
(0
.001
2)
(0.0
019)
(0
.001
7)
ln G
DPP
Ci
0.00
51
***
0.00
43
***
0.00
69
***
0.00
61
***
0.00
51
***
0.00
44
***
0.00
69
***
0.00
60
***
(0
.000
9)
(0
.000
6)
(0.0
012)
(0
.001
2)
(0
.000
9)
(0.0
006)
(0
.001
2)
(0.0
012)
ln
GD
PPC
j 0.
0093
**
0.
0017
0.01
41
**-0
.003
8
0.00
95
**0.
0009
0.01
41
**-0
.005
8 *
(0.0
047)
(0.0
031)
(0
.006
9)
(0.0
035)
(0.0
045)
(0
.003
1)
(0.0
068)
(0
.003
5)
ln D
ISTi
j -0
.001
2
-0.0
055
***
0.00
10
-0
.002
7 *
-0.0
013
-0
.005
1 **
*0.
0010
-0.0
021
(0.0
013)
(0.0
014)
(0
.001
3)
(0.0
014)
(0.0
014)
(0
.001
4)
(0.0
015)
(0
.001
4)
Tax
j
0.
0001
0.00
01
(0.0
002)
(0
.000
2)
Tax
i
0.
0013
*
0.00
13
*
(0.0
007)
(0
.000
7)
Tax
j – T
ax i
-0.0
006
**
-0
.000
6 **
*
(0.0
002)
(0.0
002)
Tr
eaty
-0
.000
2
0.00
15
*
-0.0
0004
0.
0025
**
(0
.001
3)
(0.0
008)
(0
.002
0)
(0.0
010)
C
onst
ant
23.8
840
***
24.0
059
***
23.7
630
***
24.0
236
***
23.8
844
***
24.0
031
***
23.7
632
***
24.0
020
***
(0
.057
7)
(0
.043
6)
(0.0
999)
(0
.044
6)
(0
.058
4)
(0.0
440)
(0
.101
9)
(0.0
478)
N
o. o
f obs
. 11
65
63
1
647
36
1
1165
631
64
7
361
R
-squ
ared
0.
1568
0.32
00
0.
2189
0.34
70
0.
1569
0.32
41
0.
2189
0.35
95
C
ount
ry-f
ixed
eff
ects
Yes
Yes
Yes
Yes
Yes
Yes
Yes
Yes
Tim
e-fix
ed e
ffec
ts
No
N
o
No
N
o
No
N
o
No
N
o
Not
e:
***
, **,
* d
enot
e 1%
, 5%
, 10%
sign
ifica
nt le
vels
resp
ectiv
ely.
Rob
ust s
tand
ard
erro
rs a
re in
par
enth
eses
.

Tab
le 9
: T
wo-
way
fixe
d ef
fect
s est
imat
ions
for
dete
rmin
ants
of b
ilate
ral F
DI f
low
s fro
m 3
0 O
EC
D c
ount
ries
to A
SEA
N-5
co
untr
ies (
Dep
ende
nt v
aria
ble
is ln
ij
FDI
.)
41
42
43
44
45
46
47
47
ln G
DPi
0.
0032
**
* 0.
0028
**
*0.
0040
**
*0.
0033
**
*0.
0033
**
*0.
0028
**
*0.
0041
**
*0.
0033
**
*
(0.0
005)
(0.0
003)
(0
.000
5)
(0.0
004)
(0.0
005)
(0
.000
3)
(0.0
005)
(0
.000
4)
ln G
DPj
0.
0058
**
0.
0053
*
0.01
00
* 0.
0015
0.00
58
**0.
0052
*
0.00
98
* 0.
0018
(0
.002
5)
(0
.003
1)
(0.0
055)
(0
.003
2)
(0
.002
5)
(0.0
031)
(0
.005
7)
(0.0
032)
ln
GD
PPC
i 0.
0051
**
* 0.
0042
**
*0.
0069
**
*0.
0059
**
*0.
0051
**
*0.
0043
**
*0.
0069
**
*0.
0059
**
*
(0.0
009)
(0.0
006)
(0
.001
1)
(0.0
011)
(0.0
009)
(0
.000
6)
(0.0
011)
(0
.001
1)
ln G
DPP
Cj
-0.0
095
-0
.031
3
-0.0
020
0.
0223
-0.0
095
-0
.030
1
-0.0
019
0.
0281
(0
.013
6)
(0
.024
0)
(0.0
118)
(0
.028
1)
(0
.013
6)
(0.0
242)
(0
.011
8)
(0.0
282)
ln
DIS
Tij
-0.0
013
-0
.005
5 **
*0.
0010
-0.0
025
* -0
.001
4
-0.0
051
***
0.00
07
-0
.001
9
(0
.001
3)
(0
.001
4)
(0.0
015)
(0
.001
4)
(0
.001
4)
(0.0
014)
(0
.001
8)
(0.0
014)
Tax
j
0.
0000
2
0.00
002
(0.0
003)
(0
.000
3)
Tax
i
0.
0016
**
0.
0016
**
(0
.000
7)
(0.0
008)
Tax
j – T
ax i
-0.0
009
***
-0.0
010
***
(0
.000
2)
(0
.000
3)
Trea
ty
-0.0
005
0.
0014
*
-0.0
008
0.
0024
**
(0
.001
3)
(0.0
008)
(0
.002
1)
(0.0
010)
C
onst
ant
23.9
117
***
24.1
710
***
23.7
174
***
23.8
304
***
23.9
125
***
24.1
604
***
23.7
232
***
23.7
802
***
(0
.096
5)
(0
.134
5)
(0.1
596)
(0
.142
7)
(0
.097
3)
(0.1
369)
(0
.164
5)
(0.1
482)
N
o. o
f obs
. 11
65
63
1
647
36
1
1165
631
64
7
361
R
-squ
ared
0.
1643
0.32
89
0.
2569
0.39
54
0.
1644
0.33
26
0.
2572
0.40
7
Cou
ntry
-fix
ed e
ffec
tsY
es
Y
es
Y
es
Y
es
Y
es
Y
es
Y
es
Y
es
Ti
me-
fixed
eff
ects
Y
es
Y
es
Y
es
Y
es
Y
es
Y
es
Y
es
Y
es
N
ote:
*
**, *
*, *
den
ote
1%, 5
%, 1
0% si
gnifi
cant
leve
ls re
spec
tivel
y. R
obus
t sta
ndar
d er
rors
are
in p
aren
thes
es.
256
4. BUSINESS REGULATION
AND FOREIGN DIRECT INVESTMENT
4.1. Model specification and methodology
The World Bank recently conducted the Doing Business Project, which involved
publishing a series of Doing Business annual reports since 2004. The project’s main
objective was to provide quantitative indicators of business regulations and their
enforcement across 178 countries. The Doing Business 2008 annual report discussed
business regulations involving the 10 stages of business’ life; namely, starting a
business; dealing with licenses; employing workers; registering property; getting credit;
protecting investors; paying taxes; trading across borders; enforcing contracts; and
closing business7.
These business regulation indicators are linked to such activities as investment
and trade and have found widespread use in a broad range of research. For instance, by
using these indicator data, DJankov et al. (2007) found significant effects of time costs
on trade. Their findings highlight the importance of reducing trade costs in stimulating
trade. DJankov et al. (2002) also used data of regulation costs of entry in their study.
They found that countries with heavier regulation costs had higher levels of corruption
and a larger unofficial economy.
The main interest of this research is FDI environments, particularly how business
regulations may directly affect FDI inflows. By employing the World Bank’s Doing
Business Project database, this research is able to identify whether and how various
business regulation indicators affect aggregate FDI inflows. The findings will point to
which stages regulations should be considered for reforms in order to enhance the
investment environment.
Following Hsiao and Hsiao (2004), the aggregate FDI inflows are basically
determined by the FDI recipient country’s GDP ( jGDP ), the rest of the world’s GDP
( ROWGDP ), the recipient-country’s wage rate proxy by GDP per capita ( jtGDP ), the
recipient country’s openness ( jOPENESS ), and real exchange rates ( jREER ). In
addition, the standard model is augmented by adding a dummy variable of developing
257
countries ( jDeveloping ) to capture the effects that developing countries have on FDI
inflows and adding a set of business regulation indicators ( R ) for the purpose of the
investigation. The model is specified below:
,ln
ln lnlnlnln
765
43210
jtjtjtjt
jtjtROWtjtjt
RDevelopingREER
OPENESSGDPPCGDPGDPFDI
εβββ
βββββ
++++
++++=
where a jDeveloping variable takes a value of one for developing countries and zero
otherwise.8
Data on aggregate FDI flows are in real U.S. million dollars and collected from
the International Monetary Fund’s (IMF) International Financial Statistics (IFS)-2007
CD-ROM. All explanatory variables, except business regulation indicators, are defined
as before and data are obtained mainly from the World Bank’s World Development
Indicators (WDI)-2007 CD-ROM. The real effective exchange rate is defined as the
nominal exchange rate adjusted for the effects of inflation by multiplying the ratio of a
recipient country’s consumer price index to another major country’s consumer price
index. This research chooses the U.S. to be the comparison base country. Finally,
openness is simply measured by the sum of a recipient country’s imports and exports
divided by its GDP.
For the methodology used, the standard OLS estimator was employed due to the
small data set constraint. Although some data on business regulation indicators were
available starting 2003, the bulk was not be obtainable until 2005. As a result, it was not
appropriate to limit the study to East Asia alone. Therefore, this research extended the
scope of the analysis to include all the 98 countries from which data were available over
the period 2003 to 2005.9
4.2. Empirical findings
Estimation results are reported in Table 10. When pooling data of all countries are
used, all estimated coefficients are significant. Most of them have the expected signs.
For instance, the larger a recipient country’s GDP is, the higher is its level of FDI
inflows. Recipient country GDP per capita is found to be negatively related with the
258
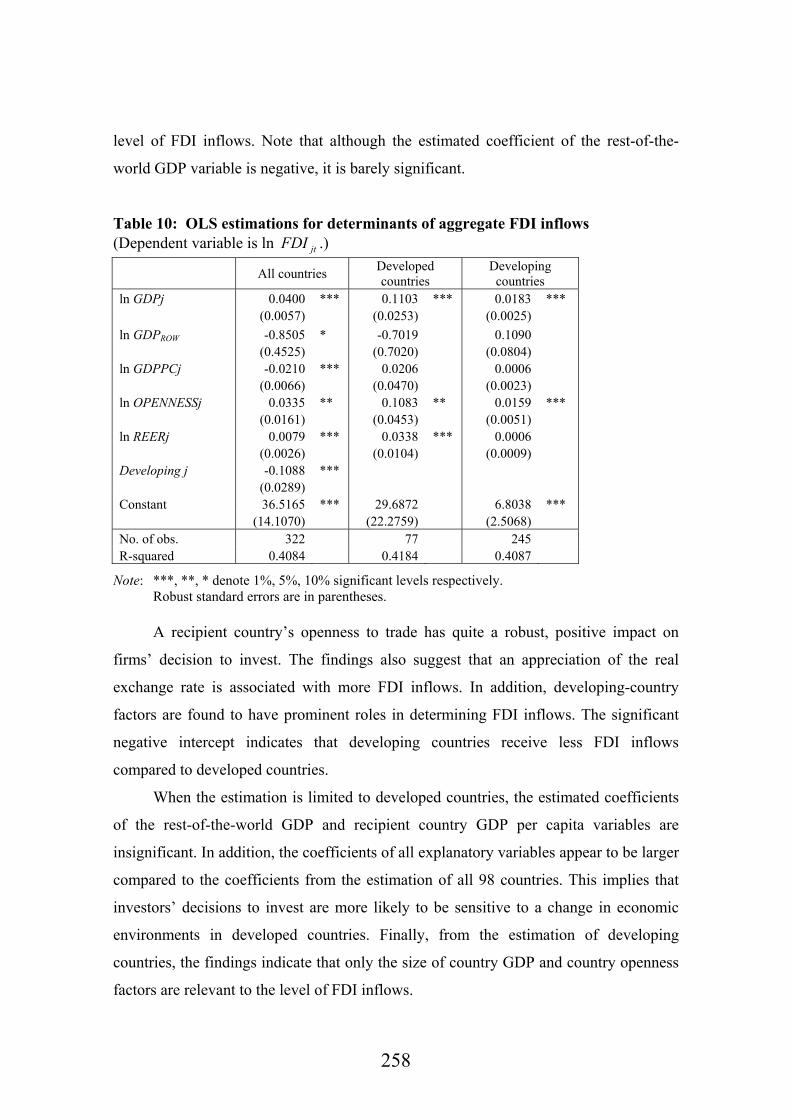
level of FDI inflows. Note that although the estimated coefficient of the rest-of-the-
world GDP variable is negative, it is barely significant.
Table 10: OLS estimations for determinants of aggregate FDI inflows (Dependent variable is ln jtFDI .)
All countries Developed countries
Developing countries
ln GDPj 0.0400 *** 0.1103 *** 0.0183 *** (0.0057) (0.0253) (0.0025) ln GDPROW -0.8505 * -0.7019 0.1090 (0.4525) (0.7020) (0.0804) ln GDPPCj -0.0210 *** 0.0206 0.0006 (0.0066) (0.0470) (0.0023) ln OPENNESSj 0.0335 ** 0.1083 ** 0.0159 *** (0.0161) (0.0453) (0.0051) ln REERj 0.0079 *** 0.0338 *** 0.0006 (0.0026) (0.0104) (0.0009) Developing j -0.1088 *** (0.0289) Constant 36.5165 *** 29.6872 6.8038 *** (14.1070) (22.2759) (2.5068) No. of obs. 322 77 245 R-squared 0.4084 0.4184 0.4087
Note: ***, **, * denote 1%, 5%, 10% significant levels respectively. Robust standard errors are in parentheses.
A recipient country’s openness to trade has quite a robust, positive impact on
firms’ decision to invest. The findings also suggest that an appreciation of the real
exchange rate is associated with more FDI inflows. In addition, developing-country
factors are found to have prominent roles in determining FDI inflows. The significant
negative intercept indicates that developing countries receive less FDI inflows
compared to developed countries.
When the estimation is limited to developed countries, the estimated coefficients
of the rest-of-the-world GDP and recipient country GDP per capita variables are
insignificant. In addition, the coefficients of all explanatory variables appear to be larger
compared to the coefficients from the estimation of all 98 countries. This implies that
investors’ decisions to invest are more likely to be sensitive to a change in economic
environments in developed countries. Finally, from the estimation of developing
countries, the findings indicate that only the size of country GDP and country openness
factors are relevant to the level of FDI inflows.
259
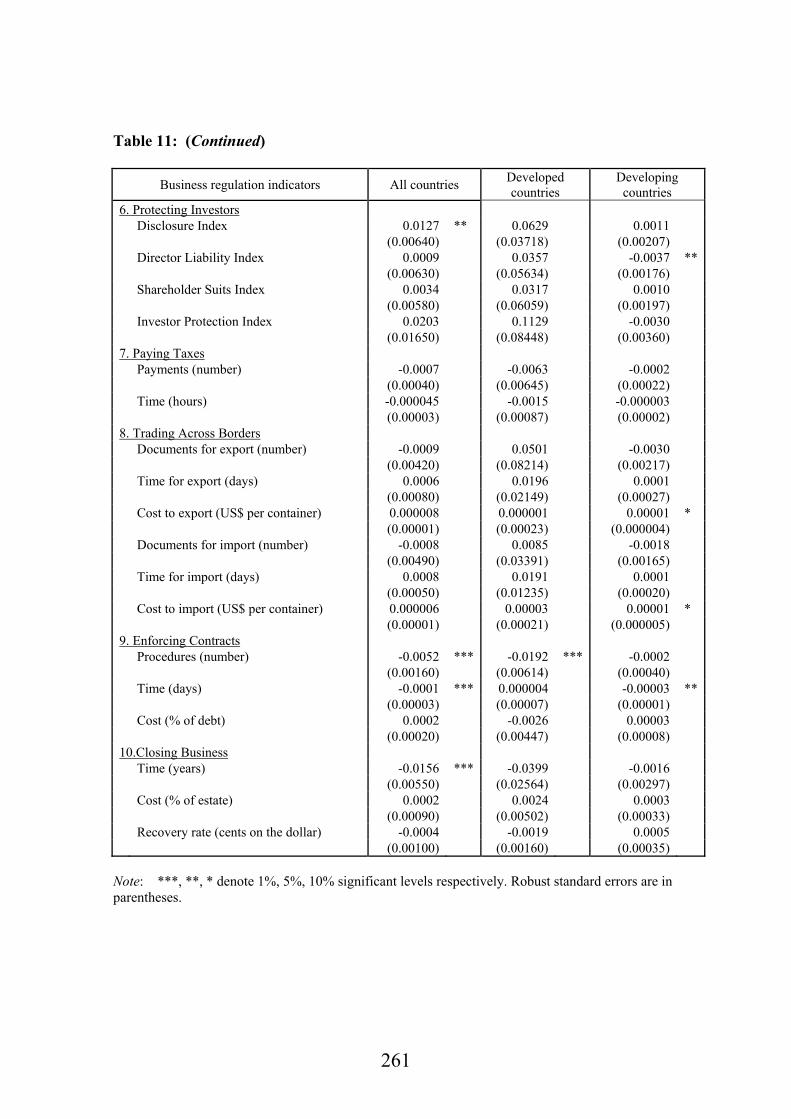
Now the analysis will focus on business-regulation variables. The estimated
coefficients of various business-regulation indicators are summarized in Table 11 below.
The findings suggest that not all business regulations are related to FDI inflows. From
the total of 38 indicators, only 10 indicators were found to be significant. Moreover, the
number of significant indicators was reduced to five when the estimation included only
developed countries. In contrast, the number of significant indicators increased to 12 in
the estimation of developing countries. This indicates that a larger number of business-
regulation indicators are relevant to investment decisions in developing countries. Other
findings on developing countries are highlighted next.
First, the number of procedures and the time involved in starting a new business
are significantly related to investment decisions. There are less FDI inflows to a country
that requires a large number of official procedures to start up a new business or where it
takes a long time to complete a procedure in starting up a business. The difficulty in
hiring new workers and the high cost involved in terminating redundant workers also
have significant negative impacts on the level of FDI inflows.
This research also noted the negative effects of the number of procedures legally
required to register property. The indicators on protecting investors measured the
strength of shareholder protection against directors’ conflict of interest. Though all
indicators appeared insignificant in the case of developing countries, the disclosure
index indicator was shown to be significant when all 98 countries were included. This
finding underscores the importance of corporate transparency in promoting good
investment environments.
For indicators on enforcing contracts, FDI inflows were negatively influenced by
the efficiency of the judicial system in resolving commercial disputes and by the time
that elapses from the moment a plaintiff files a lawsuit in court until restitution is made.
Hence, a country with a more efficient judicial system definitely becomes more
attractive as an FDI destination.
Finally, in a last stage of business’s life--closing a business--none of the
indicators was shown to be significant in the case of developing countries. Nonetheless,
in the estimation of all countries, a higher level of FDI inflows is associated with a
shorter time in the bankruptcy process.

260
Table 11: Estimated coefficients of various business regulation indicators (Dependent variable is ln jtFDI .)
Business regulation indicators All countries Developed countries
Developing countries
1. Starting a Business Procedures (numbers) -0.0101 *** -0.0172 -0.0022 ** (0.00320) (0.01053) (0.00095) Duration (days) -0.0006 *** -0.0005 -0.0002 ** (0.00020) (0.00150) (0.00007) Cost (% of income per capita) 0.000017 -0.0031 0.00001 (0.00003) (0.00214) (0.00001) Paid in Min. Capital (% of income per capita) -0.000047 * -0.0001 ** -0.000001 (0.00003) (0.00006) (0.00001) 2. Dealing with Licenses Procedures (numbers) 0.0018 0.0171 0.0010 (0.00160) (0.02301) (0.00085) Duration (days) 0.000001 0.0001 -0.00001 (0.00006) (0.00058) (0.00003) Cost (% of income per capita) 0.000005 ** -0.0016 ** 0.000003 (0.00000) (0.00063) (0.00000) 3. Employing Workers Difficulty of Hiring Index 0.000033 0.0023 * -0.0002 *** (0.00032) (0.00130) (0.00007) Rigidity of Hours Index -0.0002 -0.0004 0.0003 *** (0.00060) (0.00260) (0.00011) Difficulty of Firing Index -0.0004 -0.0007 0.0002 (0.00040) (0.00220) (0.00016) Rigidity of Employment Index -0.0003 0.0009 0.0002 (0.00080) (0.00266) (0.00015) Nonwage labor cost (% of salary) 0.0007 0.0003 0.0008 (0.00200) (0.00646) (0.00050) Firing costs (weeks of wages) -0.0005 *** -0.0017 -0.0002 *** (0.00020) (0.00111) (0.00006) 4. Registering Property Procedures (numbers) -0.0102 * -0.0155 -0.0040 *** (0.00600) (0.02135) (0.00139) Duration (days) 0.000018 0.0009 ** -0.000003 (0.00005) (0.00041) (0.00002) Cost (% of property value) 0.0022 0.0111 -0.0001 (0.00160) (0.00904) (0.00043) 5. Getting Credit Legal Rights Index 0.0096 0.0374 -0.0003 (0.01160) (0.04393) (0.00167) Credit Information Index 0.0058 0.0088 0.0008 (0.00470) (0.02852) (0.00131) Public registry coverage (% adults) 0.0009 0.0021 -0.0016 *** (0.00130) (0.00149) (0.00059) Private bureau coverage (% adults) 0.0001 -0.0010 0.0004 * (0.00070) (0.00137) (0.00021)
261
Table 11: (Continued)
Business regulation indicators All countries Developed countries
Developing countries
6. Protecting Investors Disclosure Index 0.0127 ** 0.0629 0.0011 (0.00640) (0.03718) (0.00207) Director Liability Index 0.0009 0.0357 -0.0037 ** (0.00630) (0.05634) (0.00176) Shareholder Suits Index 0.0034 0.0317 0.0010 (0.00580) (0.06059) (0.00197) Investor Protection Index 0.0203 0.1129 -0.0030 (0.01650) (0.08448) (0.00360) 7. Paying Taxes Payments (number) -0.0007 -0.0063 -0.0002 (0.00040) (0.00645) (0.00022) Time (hours) -0.000045 -0.0015 -0.000003 (0.00003) (0.00087) (0.00002) 8. Trading Across Borders Documents for export (number) -0.0009 0.0501 -0.0030 (0.00420) (0.08214) (0.00217) Time for export (days) 0.0006 0.0196 0.0001 (0.00080) (0.02149) (0.00027) Cost to export (US$ per container) 0.000008 0.000001 0.00001 * (0.00001) (0.00023) (0.000004) Documents for import (number) -0.0008 0.0085 -0.0018 (0.00490) (0.03391) (0.00165) Time for import (days) 0.0008 0.0191 0.0001 (0.00050) (0.01235) (0.00020) Cost to import (US$ per container) 0.000006 0.00003 0.00001 * (0.00001) (0.00021) (0.000005) 9. Enforcing Contracts Procedures (number) -0.0052 *** -0.0192 *** -0.0002 (0.00160) (0.00614) (0.00040) Time (days) -0.0001 *** 0.000004 -0.00003 ** (0.00003) (0.00007) (0.00001) Cost (% of debt) 0.0002 -0.0026 0.00003 (0.00020) (0.00447) (0.00008) 10.Closing Business Time (years) -0.0156 *** -0.0399 -0.0016 (0.00550) (0.02564) (0.00297) Cost (% of estate) 0.0002 0.0024 0.0003 (0.00090) (0.00502) (0.00033) Recovery rate (cents on the dollar) -0.0004 -0.0019 0.0005 (0.00100) (0.00160) (0.00035)
Note: ***, **, * denote 1%, 5%, 10% significant levels respectively. Robust standard errors are in parentheses.

262
5. POLICY IMPLICATIONS
This research provides an overview of tax instruments in East Asia where tax
instruments generally vary regionwide. There is increasing pressure on countries to
lower their corporate income tax rates to ensure their competitiveness as capital
mobility increases. Despite the fact that the effectiveness of tax instruments on
attracting FDI inflows remains unclear, East Asian countries offer generous packages of
tax incentives. The lack of a regional framework for tax harmonization may result in
unnecessary competition within the region.
Empirical evidence on key determinants of bilateral FDI inflows confirms
existing literature. FDI inflows are basically determined by the size of FDI home
countries’ GDP, labor costs in FDI home countries, and distance between FDI home and
recipient countries. In addition, the significant relationship between home-country
corporate income tax rates and FDI outflows from 30 OECD countries was found. There
was, however, inadequate evidence that recipient-country corporate income tax rates
have a significant impact on FDI inflows to East Asian countries. Bilateral income tax
treaties were also found to positively affect the level of FDI inflows to the ASEAN-5.
These findings support the view of the FDI promotion rationale for tax treaty formation.
The lack of a comprehensive network of tax treaty agreements within the East
Asia region may increase business costs and be a major obstacle to the regional
economic integration process. Besides, many tax treaties were concluded a long time
ago and could be out of date. It is crucial that these tax treaties be revised. Hence, the
development of a regional tax regime and a comprehensive tax treaties network with a
standard framework for the East Asia region would definitely contribute to a good
investment environment in the region.
Finally, the efficiency of business regulations in the various stages of business life,
from starting a business to closing a business, was found to have critical roles in
multinational firms’ investment decisions. Thus, improvements in the domestic business
environment, including economic regulations, corporate governance, and labor laws,
would increase FDI inflows and would also be a key driver toward a single investment
and production base in the East Asia region.
263
REFERENCES
Benassy-Quere, Agnes; Lionel Fontagne; and Amina Lahreche-Revil (2003). “Tax
Competition and Foreign Direct Investment,” CEPII Working Paper, No. 2003-17.
Blonigen, Bruce A. and Ronald B. Davies (2002). “Do Bilateral Tax Treaties Promote
Foreign Direct Investment?” NBER Working Paper, No.8834.
Chalk, Nigel A. (2001). “Tax Incentives in the Philippines: A Regional Perspective,”
IMF Working Paper, No.WP/01/181. Washington, D.C.: International Monetary
Fund.
Davies, Ronald B. (2003). “Tax Treaties, Renegotiations, and Foreign Direct
Investment,” Research Paper, Department of Economics, University of Oregon.
Desai, Mihir A.; C. Fritz Foley; nd James R. Hines Jr. (2004). Foreign Direct
Investment in a World of Multiple Taxes,” Journal of Public Economics, Vol. 88,
pp.2727-2744.
Djankov, Simeon; Caroline Freund; and Cong S. Pham (2007). “Trading on Time,”
Research Paper, http://www.doingbusiness.org (accessed December 28, 2007).
Djankov, Simeon; Rafael La Porta; Frolencio Lopez-De-Silanes; and Andrei Shleifer
(2002). “The Regulation of Entry,” Quarterly Journal of Economics, Vol.117,
pp.1-37.
Farrow, Ian and Sunita Jogarajan (2006). “ASEAN Tax Regimes and the Integration of
the Priority Sectors: Issues and Options,” REPSF Project No. 05/500.
Fletcher, Kevin (2002). “Tax Incentives in Cambodia, Lao PDR, and Vietnam,” paper
prepared for the IMF Conference on Foreign Direct Investment: Opportunities and
Challenges for Cambodia, Lao PDR, and Vietnam.
Hall, Robert E. (1997). “Potential Disruption from the Move to a Consumption Tax,”
American Economic Review, Vol.87, pp.147-150.
Halvorsen, Robert (1995). “Fiscal Incentives for Investment in Thailand,” in Fiscal
Incentives for Investment and Innovation, edited by Anwar Shah, New York:
Oxford University Press.
Hartman D. G. (1984). “Tax Policy and Foreign Direct Investment in the United
States,” National Tax Journal, Vol. 37, pp.475-488.
264
Hassett, Kevin A. and R. Glenn Hubbard (2002). “Tax Policy and Business
Investment,” in Handbook of Public Economics, vol. 3, eds. Alan J. Auerbach and
Martin Feldstein, Netherlands: Elsevier Science B.V.
Hsian, Frank S. T. and Mei-Chu W. Hsiao (2004). “The Chaotic Attractor of Foreign
Direct Investment—Why China? A Panel Data Analysis,” Journal of Asian
Economics, Vol. 15, pp.641-670.
Morisset, Jacques and Neda Pirnia (2000). “How Tax Policy and Incentives Affect
Foreign Direct Investment,” Policy Research Working Paper Series, No.2509,
Washington D.C.: World Bank.
Rose, Andrew (2005). "Which International Institutions Promote International Trade?"
Review of International Economics, Vol. 13, pp.682-698.
Shah, Anwar and Joel Slemrod (1990) “Tax Sensitivity of Foreign Direct Investment:
an Empirical Assessment,” Policy Research Working Paper Series, No.434,
Washington D.C.: World Bank.
Sudsawasd, Sasatra and Robert E. Moore (2008). “Foreign Direct Investment and Tax
Policy,” ISP Working Paper Series (forthcoming), Georgia State University.
Zee, Howell H.; Janet G. Stotsky; and Eduardo Ley (2002). “Tax Incentives for
Business Investment: A Primer for Policy Makers in Developing Countries,”
World Development, Vol. 30, pp.1497-1516.
ACKNOWLEDGEMENT
I am grateful to Varachat numchaisri and Siam Sakaew for their outstanding research
assistance and Dr. Wisarn Pupphavesa for his invaluable advice. The earlier drafts
received very helpful comments from participants in the Economic Research Institute
for ASEAN and East Asia (ERIA) Workshops. The remaining errors are mine.
265
NOTES
1 For more details on business regulation indicators, see http://www.doingbusiness.org (accessed
December 28, 2007). 2 Tax incentives are defined as tax provisions granted only to qualified projects for which provisions
are not applicable in general. 3 For theoretical links between tax policy and investment, see Sasatra and Moore (2008) and Hassett
and Hubbard (2002). 4 Hall (1997) provided a detailed analysis on the move to a consumption tax base. 5 The ASEAN-5 countries are Indonesia, Malaysia, Philippines, Singapore, and Thailand. 6 The 30 OECD countries are Australia, Austria, Belgium, Canada, Czech Republic, Denmark,
Finland, France, Germany, Greece, Hungary, Iceland, Ireland, Italy, Japan, Korea, Luxembourg,
Mexico, Netherlands, New Zealand, Norway, Poland, Portugal, Slovak Republic, Spain, Sweden,
Switzerland, Turkey, United Kingdom, and United States. The 11 East Asian countries are Australia,
China, Japan, Indonesia, India, Korea, Malaysia, New Zealand, Philippines, Singapore, and Thailand. 7 For details on business regulation indicators in each of 10 stages of business life, see the Doing
Business 2008 annual report. 8 The World categorizes developing countries into low- and middle-income countries. See
http://www.worldbank.org/depweb/english/beyond/global/glossary.html (accessed November 1,
2007). 9 The 98 countries are the United States, the United Kingdom, Belgium, Denmark, France, Germany,
Italy, Norway, Sweden, Switzerland, Canada, Japan, Finland, Greece, Iceland, Portugal, Spain,
Australia, South Africa, Argentina, Bolivia, Brazil, Chile, Costa Rica, Dominican Republic, Ecuador,
El Salvador, Guatemala, Honduras, Mexico, Nicaragua, Panama, Peru, Uruguay, Guyana, Jamaica,
Israel, Jordan, Kuwait, Oman, Saudi Arabia, Egypt, Bangladesh, Cambodia, Sri Lanka, India,
Indonesia, Korea Rep., Malaysia, Maldives, Nepal, Pakistan, Philippines, Singapore, Thailand,
Angola, Botswana, Burundi, Cameroon, Chad, Congo, Republic of Democratic Rec. Congo, Benin,
Ghana, Cote d'Ivoire, Kenya, Lesotho, Madagascar, Malawi, Mali, Mauritius, Mozambique, Niger,
Nigeria, Rwanda, Senegal, Sierra Leone, Namibia, Togo, Tunisia, Burkina, Faso, Zambia, Solomon
Islands, Armenia, Albania, Georgia, Kyrgyz Republic, Bulgaria, Moldova, Czech Republic, Latvia,
Hungary, Lithuania, Mongolia, Croatia, Slovenia, Poland, and Romania.