CHAPTER 12 - JICA12-1 CHAPTER 12 HIGHWAY DESIGN 12.1 FLYOVER LAYOUT Flyover layout is summarized in...
117
Transcript of CHAPTER 12 - JICA12-1 CHAPTER 12 HIGHWAY DESIGN 12.1 FLYOVER LAYOUT Flyover layout is summarized in...
12-1
CHAPTER 12
HIGHWAY DESIGN
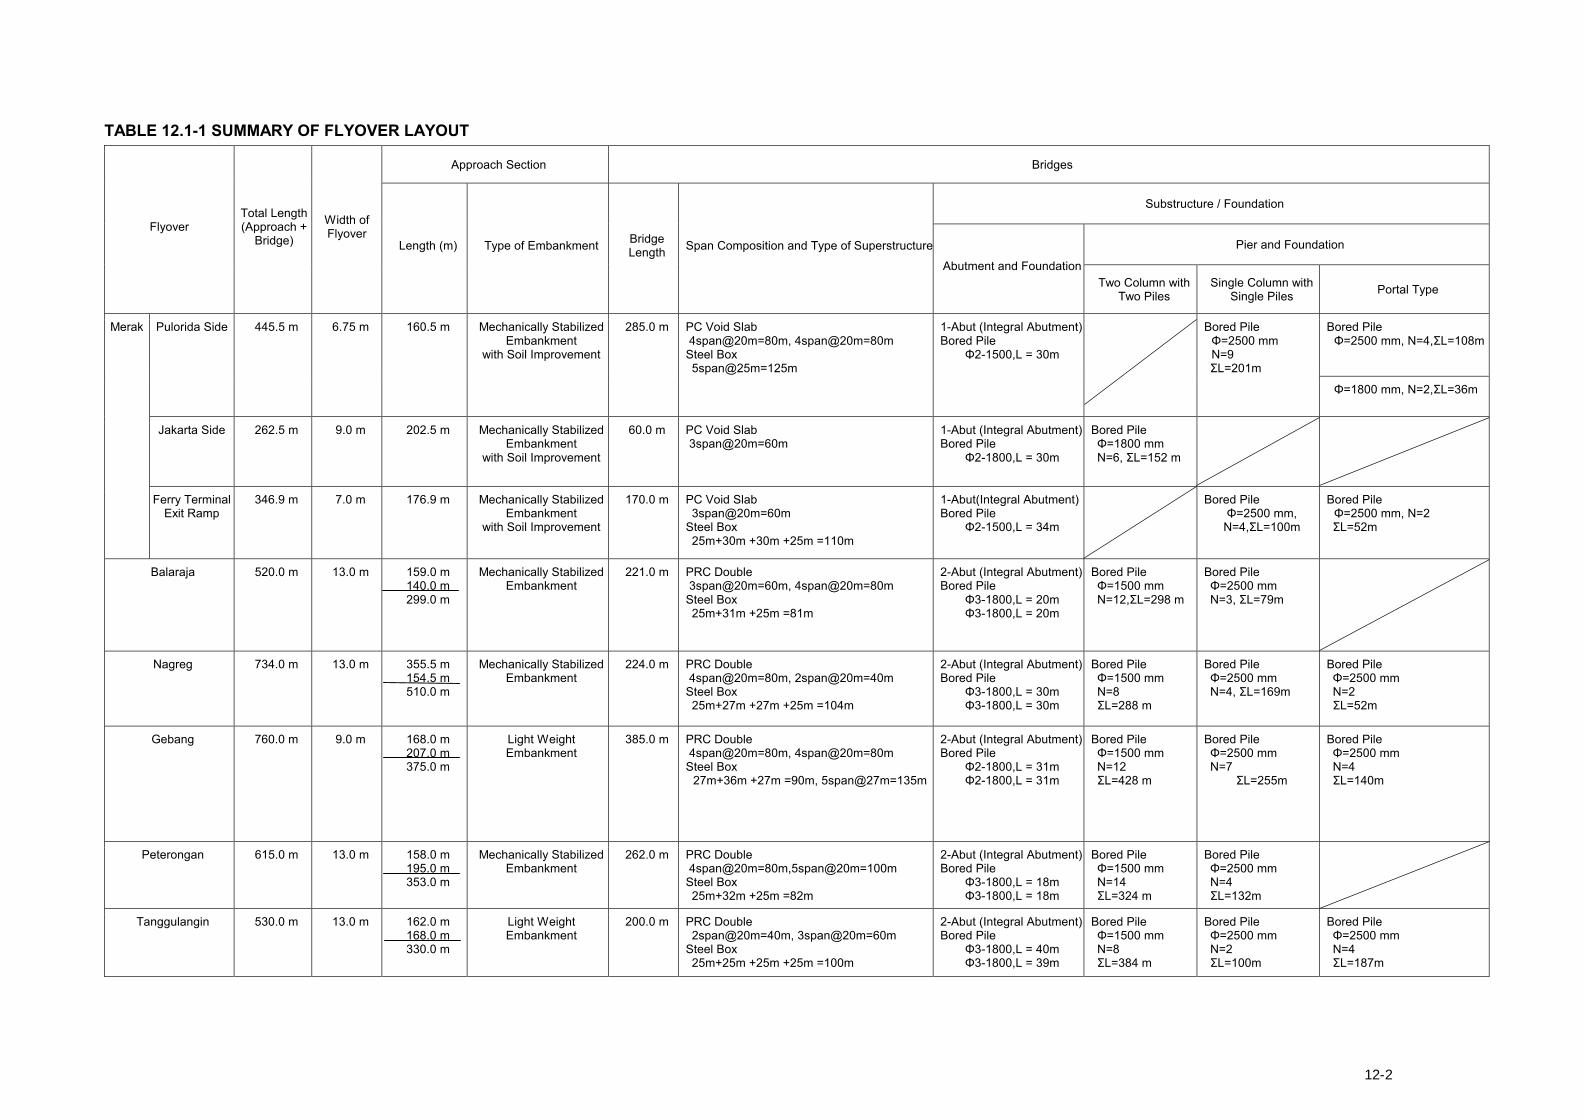
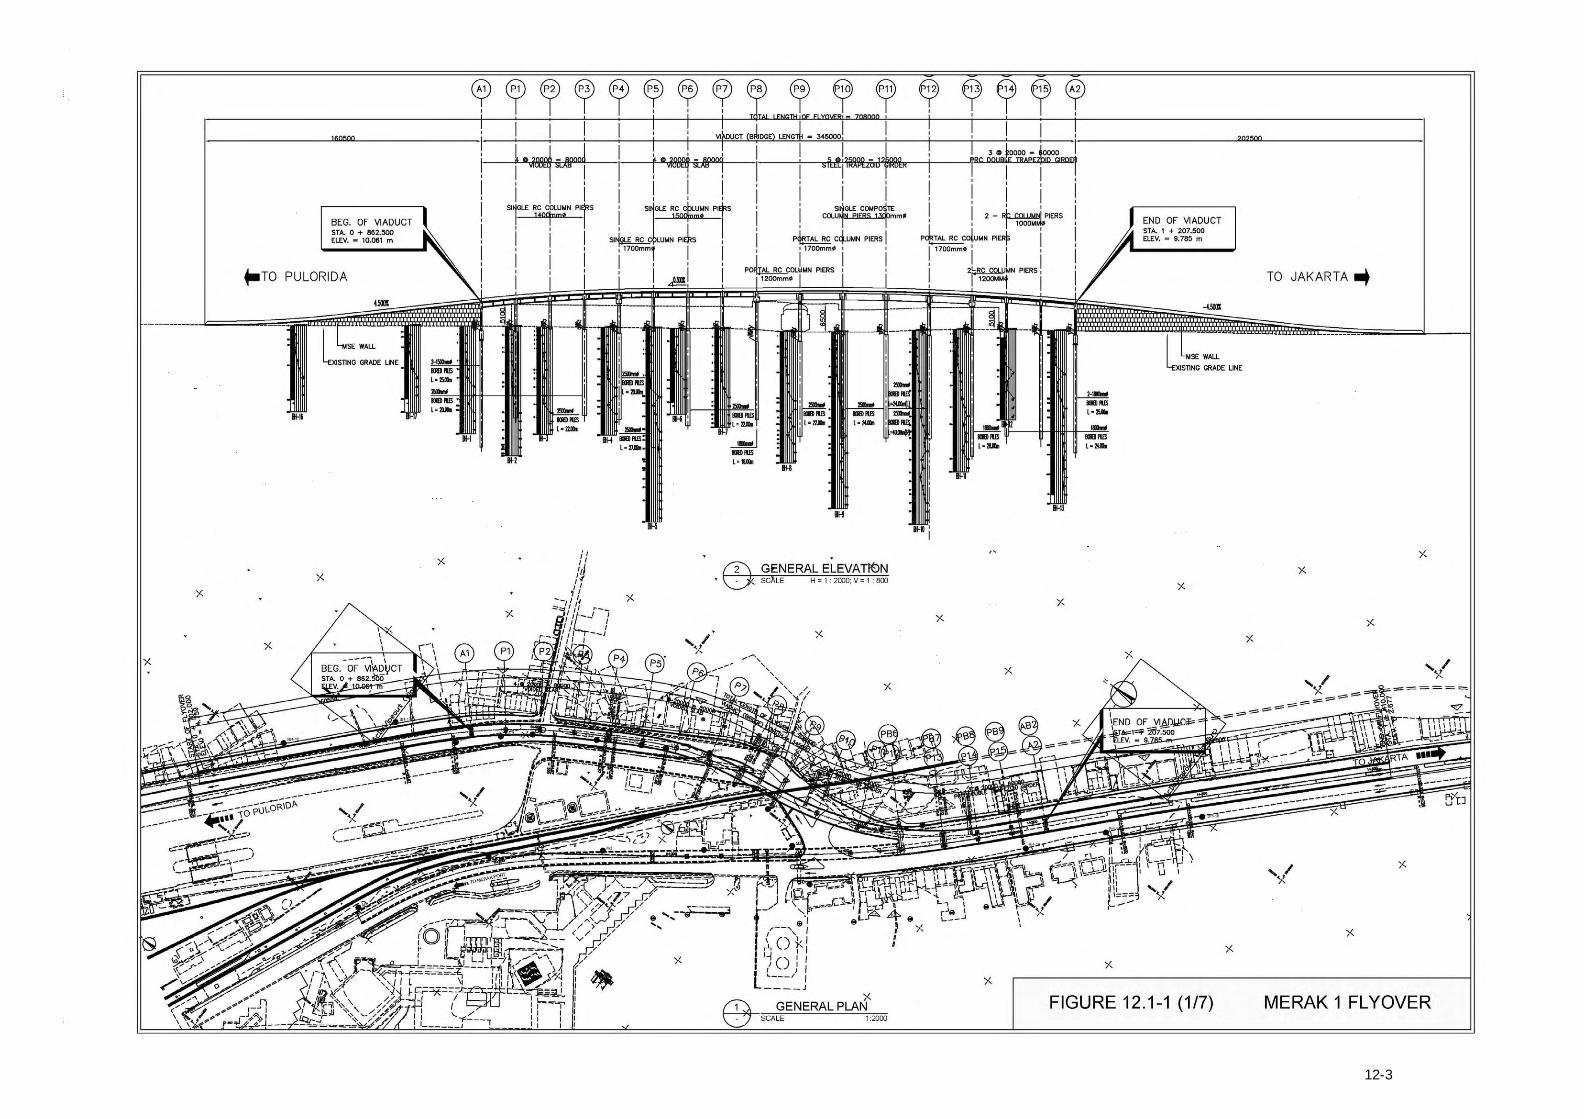
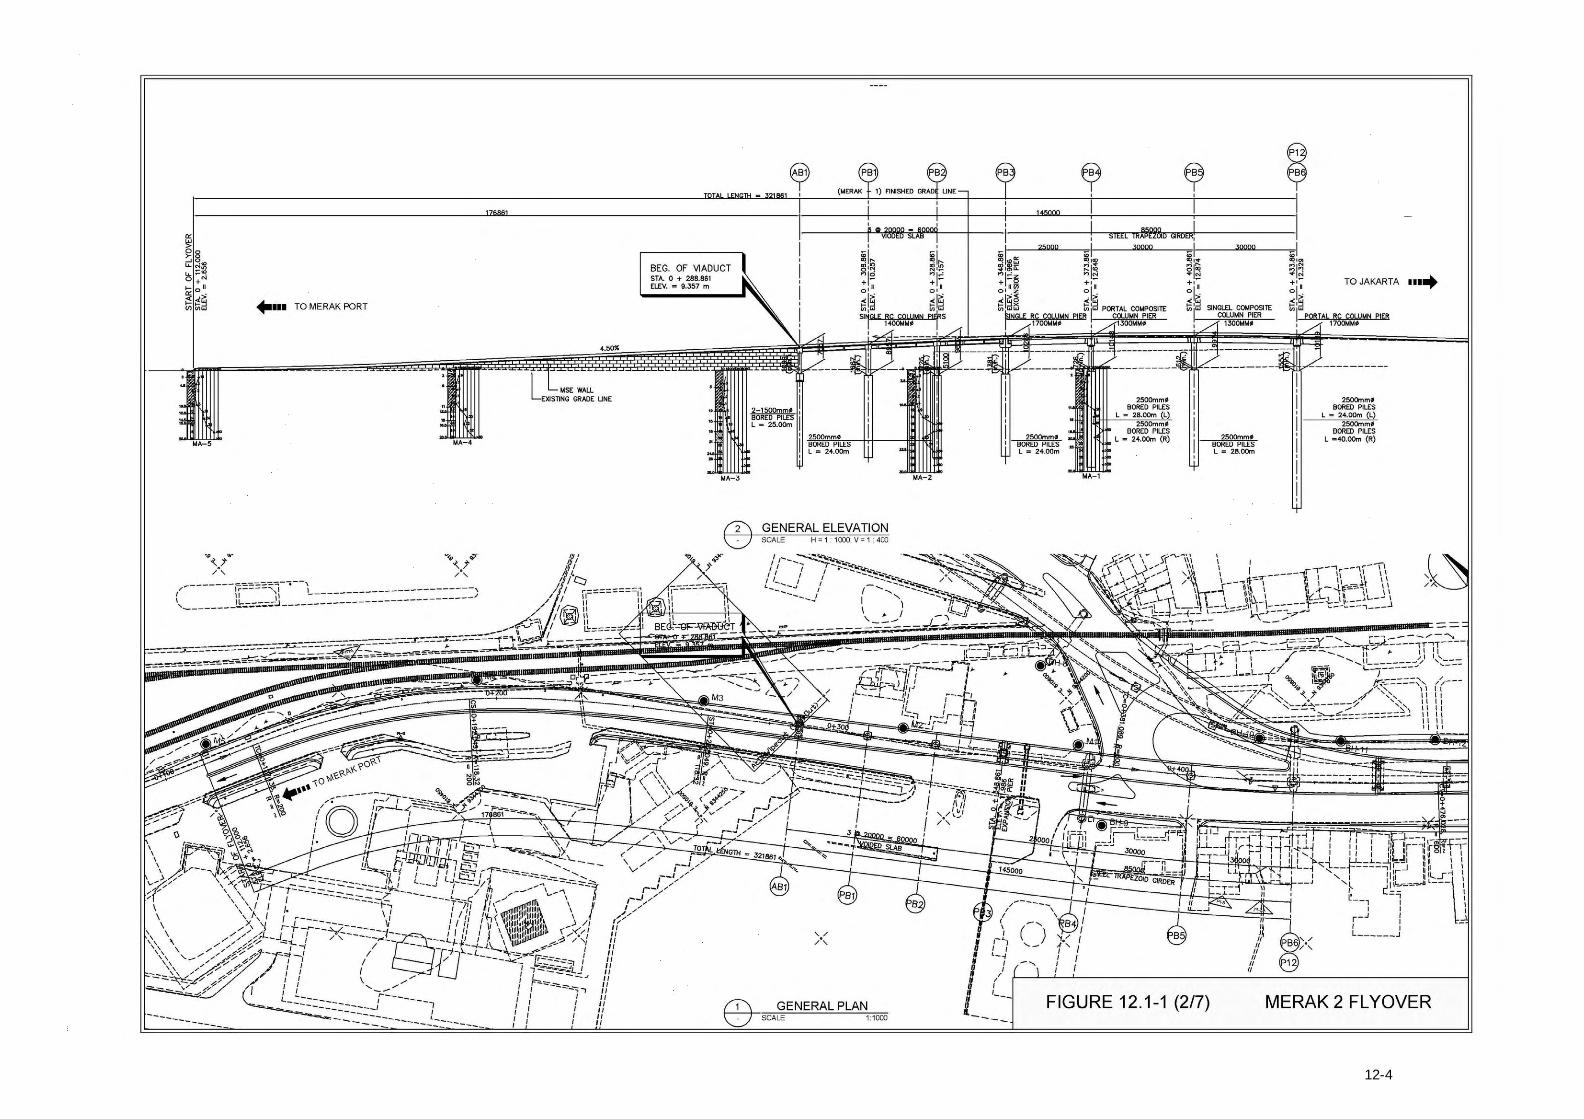
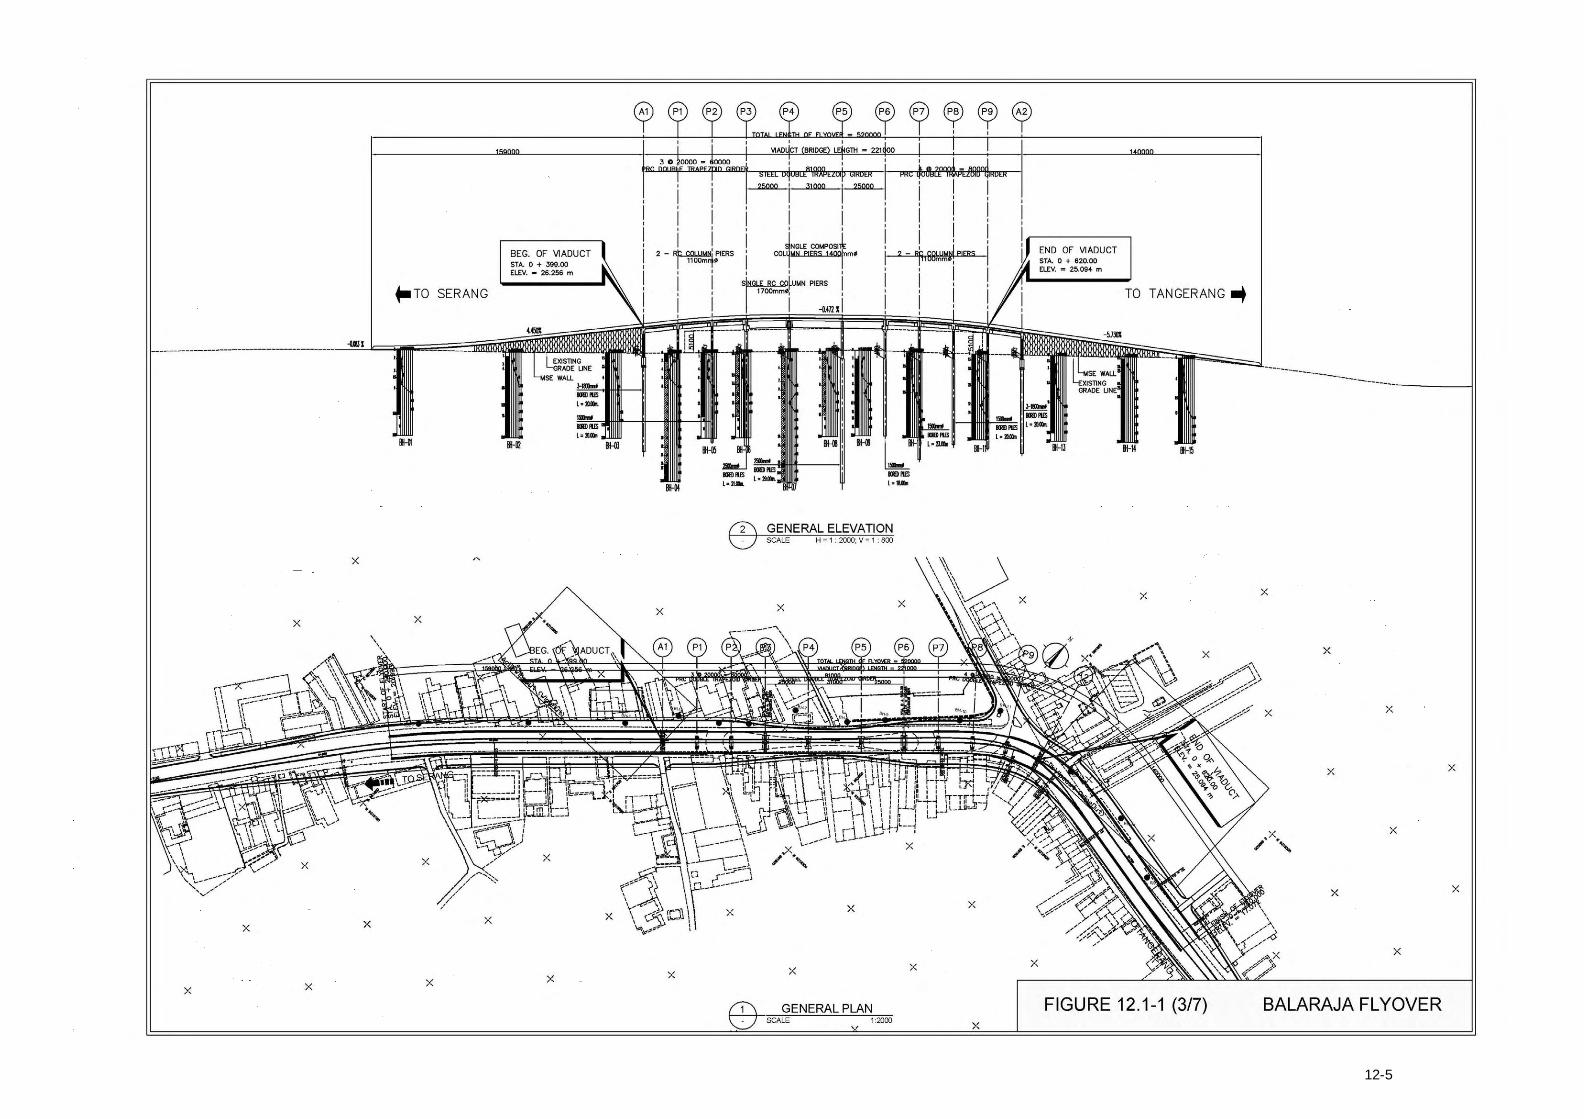
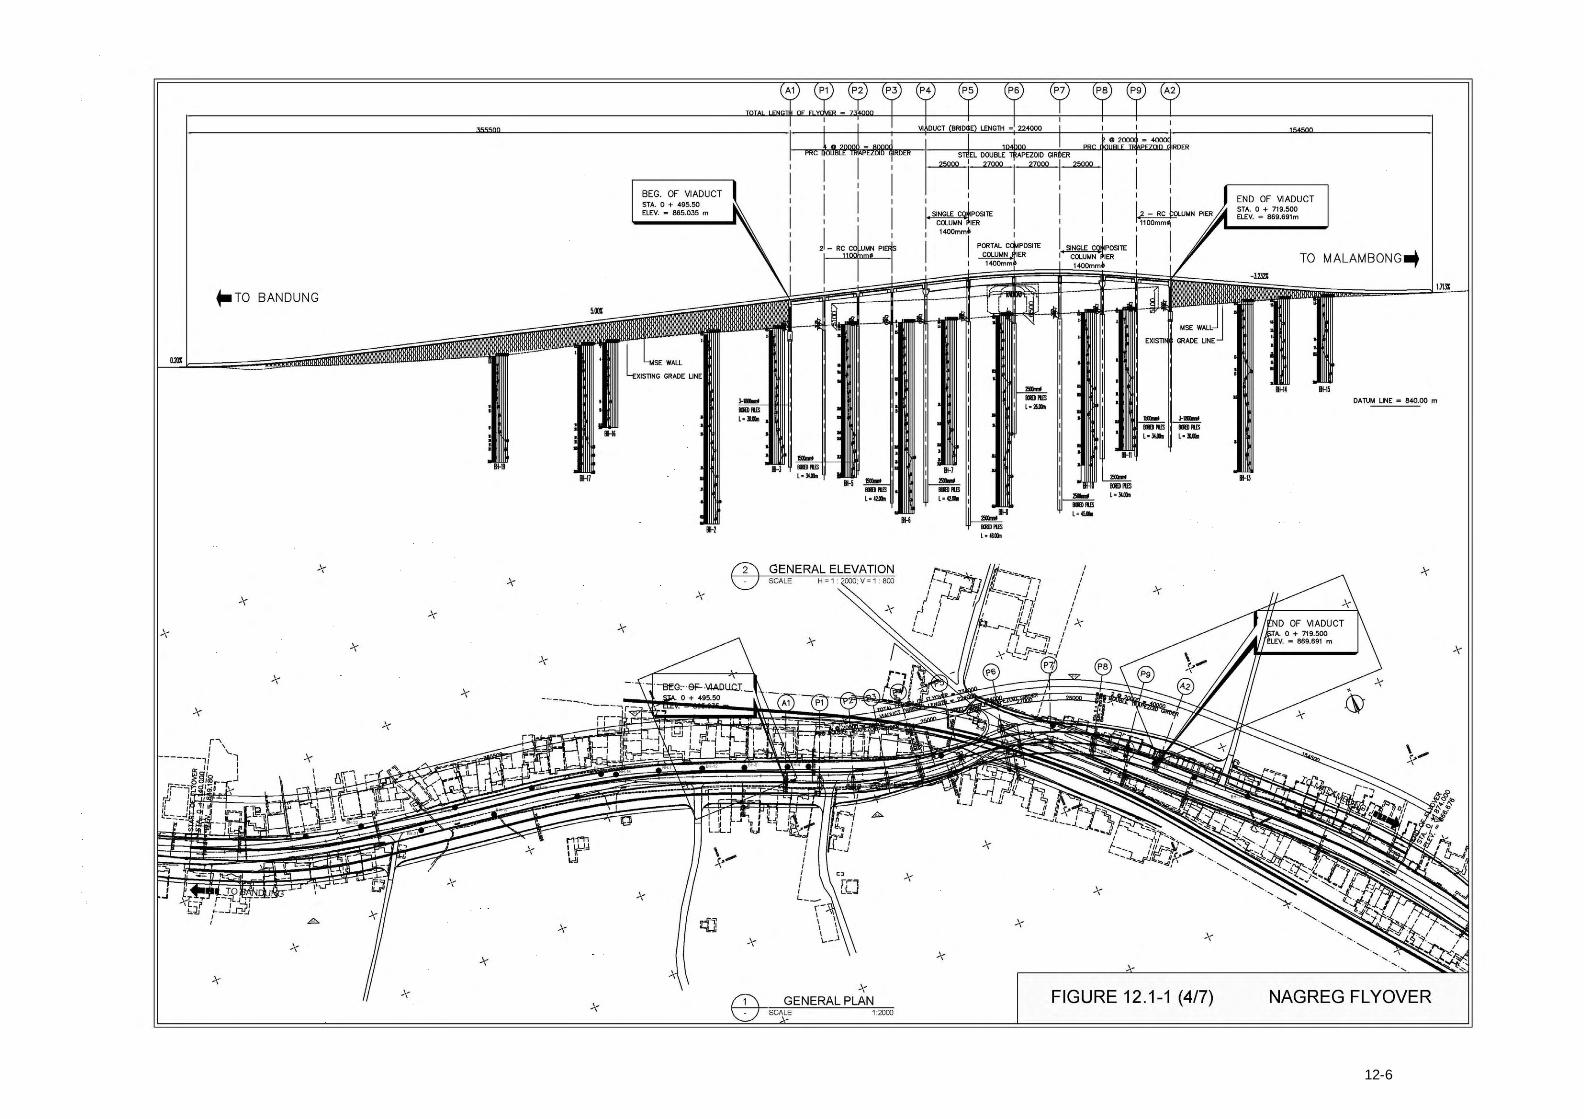
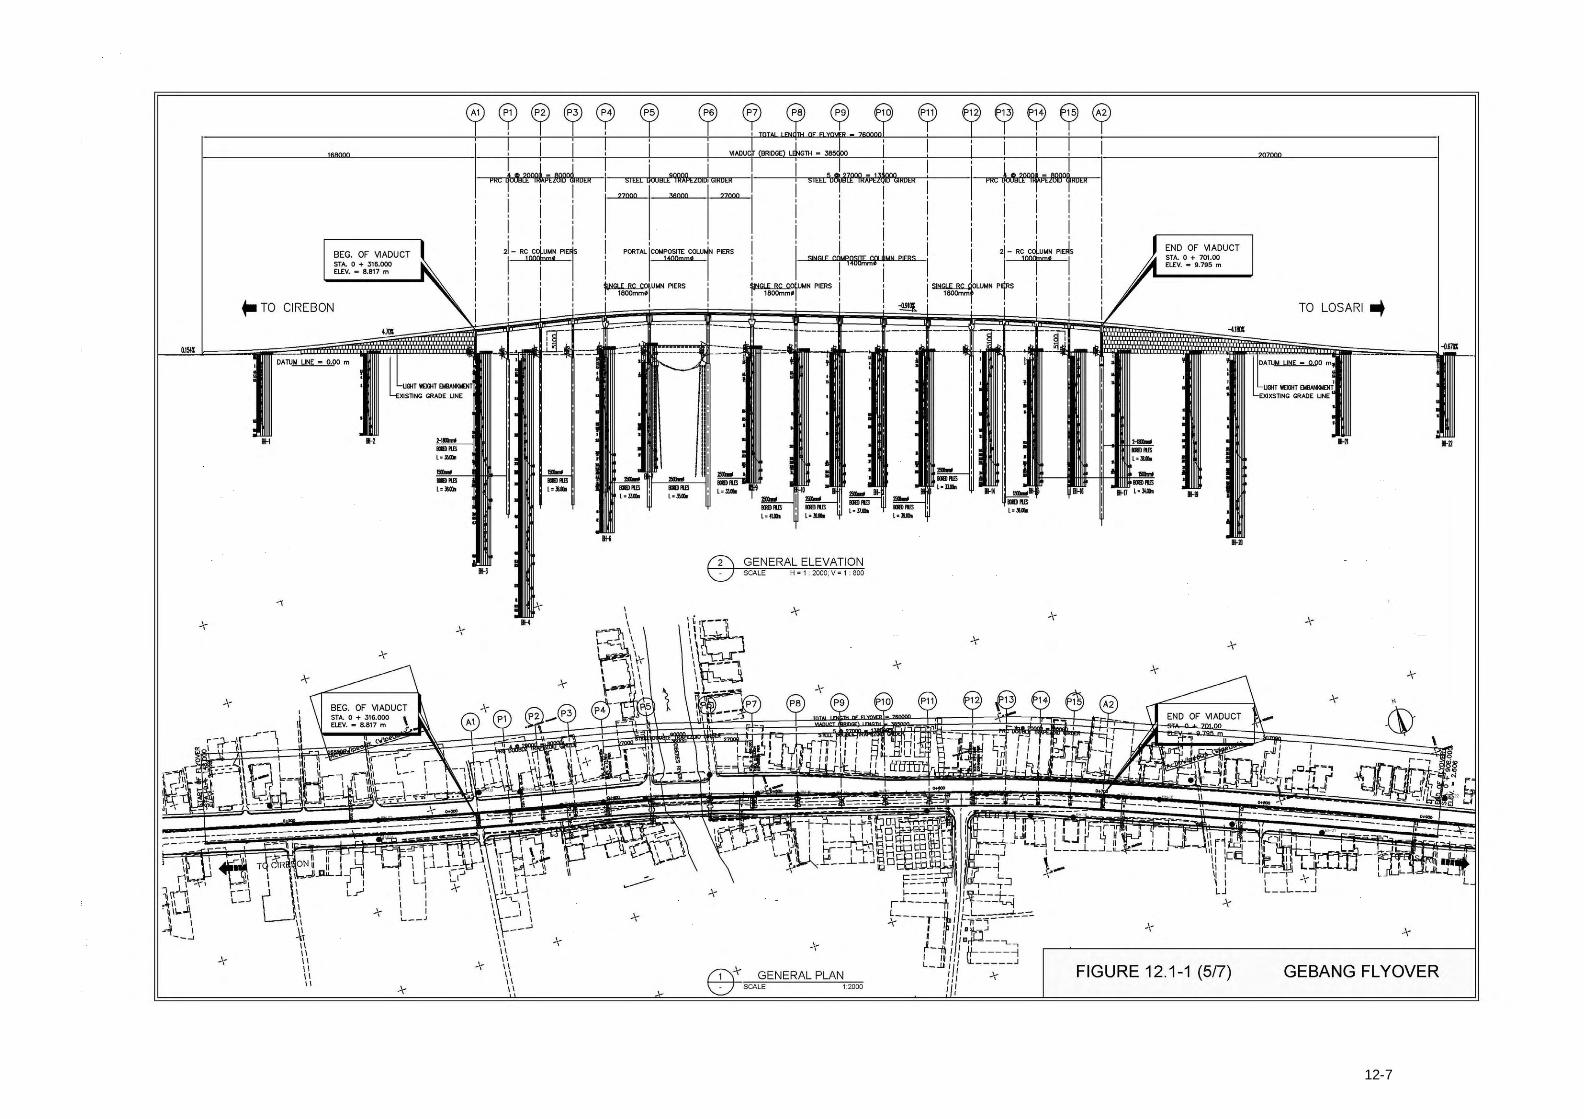
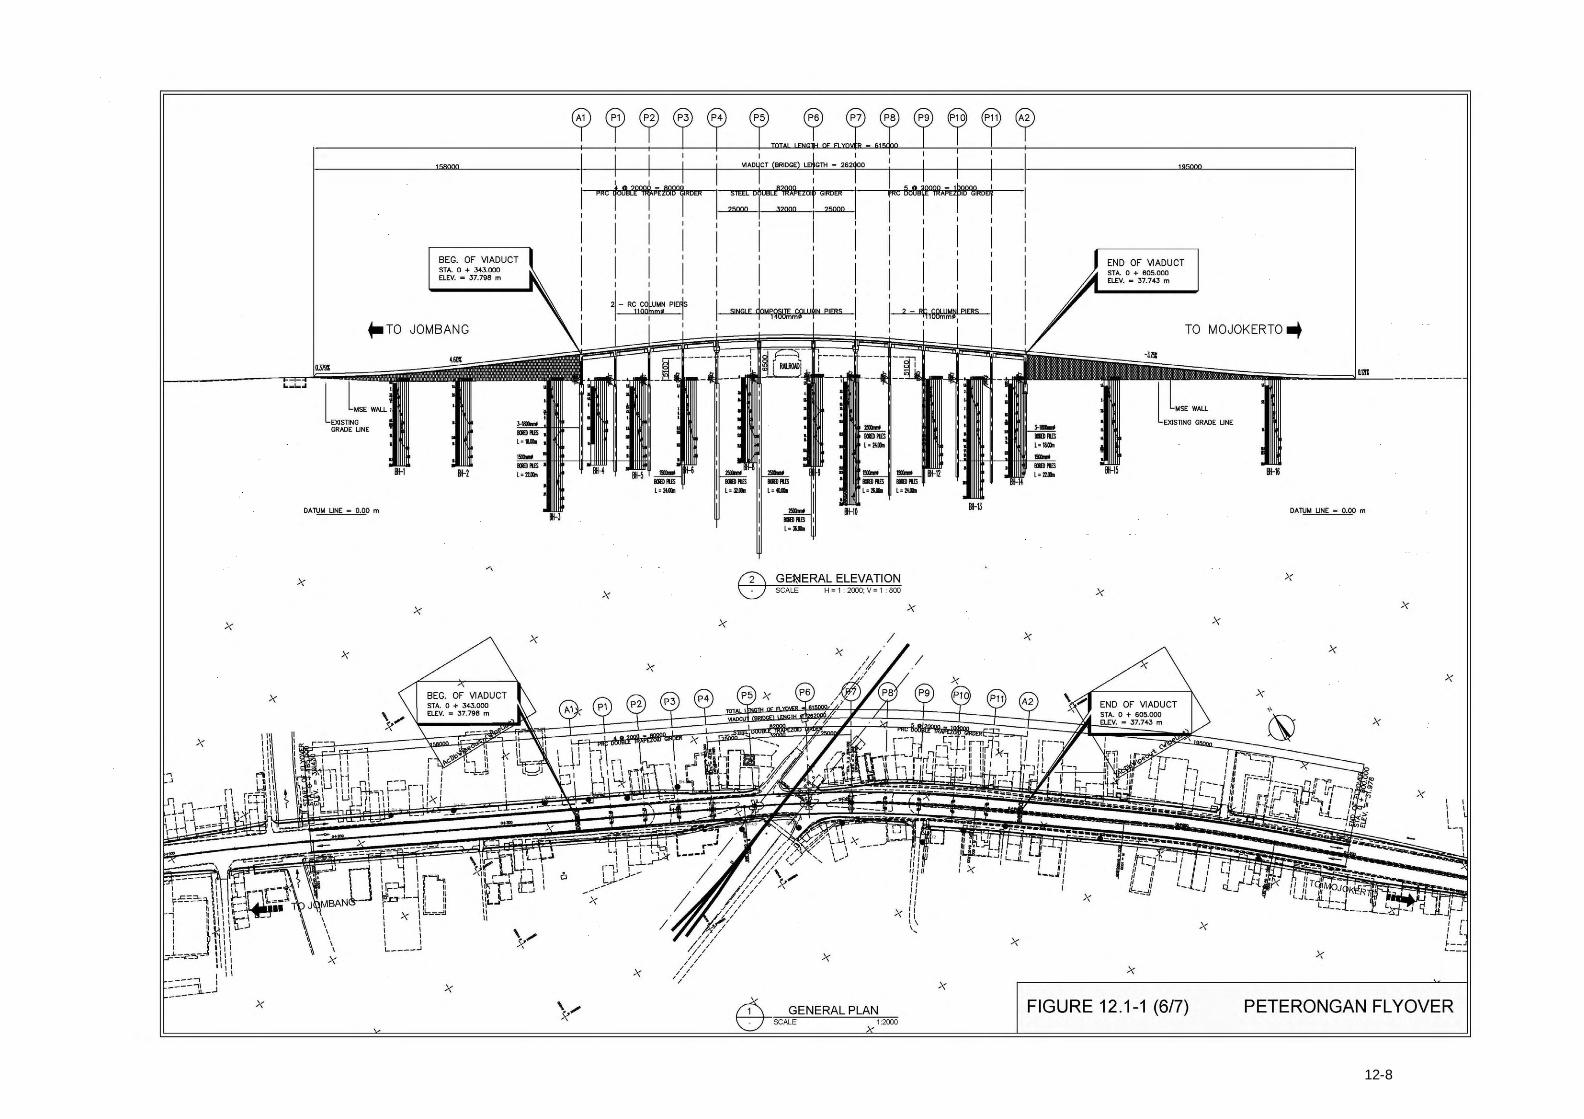
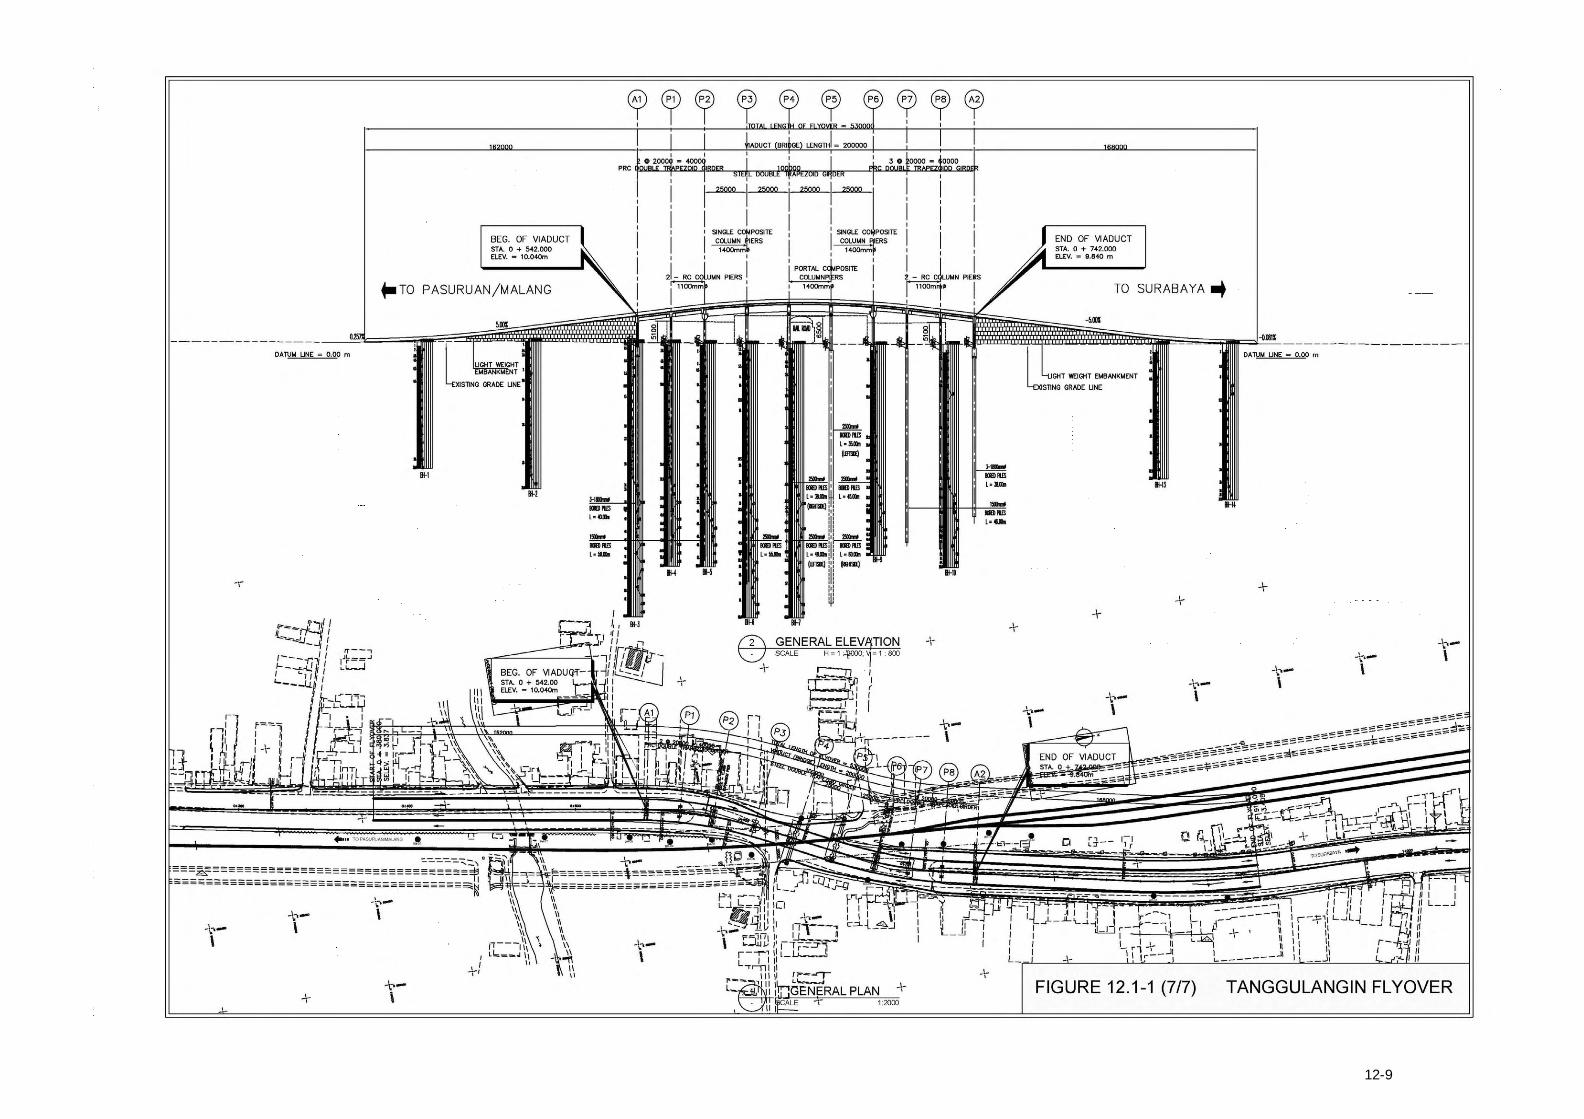
12.1 FLYOVER LAYOUT Flyover layout is summarized in Table 12.1-1. General elevation and plan of
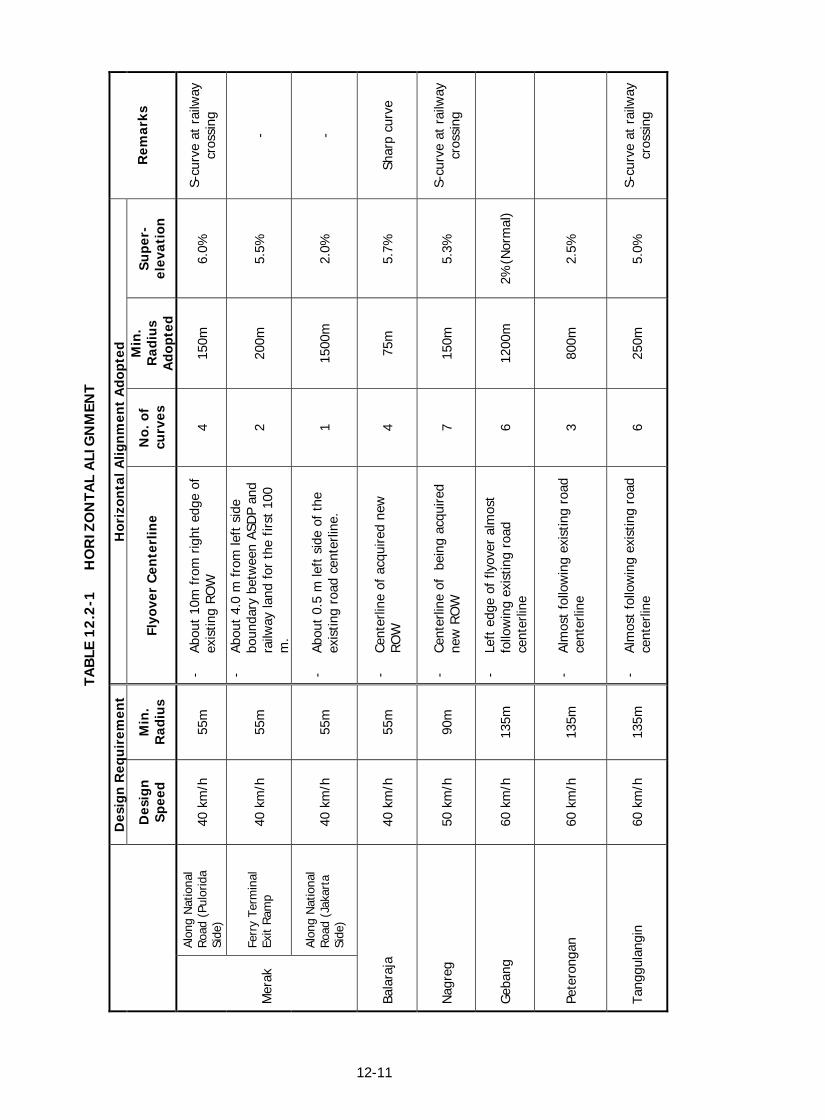
flyovers are presented in Figure 12.1-1 (1/7 ~ 7/7). 12.2 HORIZONTAL ALIGNMENT DESIGN Flyover centerline was so selected that the land acquisition can be minimized.
Flyover centerline was selected as follows:
Merak Flyover
» Along the 2-lane national road (Pulorida side): the boundary between the national road and the Ferry Terminal Waiting Area, which is right side of the national road was adopted as a control, since the Ferry Terminal Waiting Area can not be affected. The flyover centerline was selected at about 10m from the above mentioned boundary.
» Along the 4-lane national road (Jakarta side): The flyover centerline was selected at about 0.5m left side of the existing road centerline.
» Ferry Terminal Exit Ramp: for the first 100m, the flyover centerline was selected about 4.0m from left side boundary between ASDP and Railway, which is the control point.
Balaraja Flyover
» The flyover centerline was selected at the centerline of acquired new road right-
of-way.
Nagreg Flyover
» The flyover centerline was selected at the centerline of new road right-of-way being acquired.
Gebang Flyover
» The left edge of the flyover was selected to almost follow the existing road
centerline.
Peterongan Flyover
» The flyover centerline was selected to almost follow the existing road centerline.
Tanggulangin Flyover
» The flyover centerline was selected to almost follow the existing road centerline.
Table 12.2-1 shows the horizontal design requirements and adopted horizontal alignment which satisfies the design requirement.
12-2
TABLE 12.1-1 SUMMARY OF FLYOVER LAYOUT
Approach Section Bridges
Substructure / Foundation
Pier and Foundation Flyover
Total Length (Approach +
Bridge)
Width of Flyover
Length (m) Type of Embankment Bridge Length Span Composition and Type of Superstructure
Abutment and FoundationTwo Column with
Two Piles Single Column with
Single Piles Portal Type
Bored Pile Φ=2500 mm, N=4,ΣL=108m
Pulorida Side 445.5 m 6.75 m 160.5 m Mechanically Stabilized Embankment
with Soil Improvement
285.0 m PC Void Slab 4span@20m=80m, 4span@20m=80m Steel Box 5span@25m=125m
1-Abut (Integral Abutment)Bored Pile
Φ2-1500,L = 30m
Bored Pile Φ=2500 mm N=9 ΣL=201m
Φ=1800 mm, N=2,ΣL=36m
Jakarta Side 262.5 m 9.0 m 202.5 m Mechanically Stabilized Embankment
with Soil Improvement
60.0 m PC Void Slab 3span@20m=60m
1-Abut (Integral Abutment)Bored Pile
Φ2-1800,L = 30m
Bored Pile Φ=1800 mm N=6, ΣL=152 m
Merak
Ferry Terminal Exit Ramp
346.9 m 7.0 m 176.9 m Mechanically Stabilized Embankment
with Soil Improvement
170.0 m PC Void Slab 3span@20m=60m
Steel Box 25m+30m +30m +25m =110m
1-Abut(Integral Abutment)Bored Pile
Φ2-1500,L = 34m
Bored Pile Φ=2500 mm,
N=4,ΣL=100m
Bored Pile Φ=2500 mm, N=2 ΣL=52m
Balaraja 520.0 m 13.0 m 159.0 m 140.0 m 299.0 m
Mechanically Stabilized Embankment
221.0 m PRC Double 3span@20m=60m, 4span@20m=80m Steel Box 25m+31m +25m =81m
2-Abut (Integral Abutment)Bored Pile
Φ3-1800,L = 20m Φ3-1800,L = 20m
Bored Pile Φ=1500 mm N=12,ΣL=298 m
Bored Pile Φ=2500 mm N=3, ΣL=79m
Nagreg 734.0 m 13.0 m 355.5 m 154.5 m 510.0 m
Mechanically Stabilized Embankment
224.0 m PRC Double 4span@20m=80m, 2span@20m=40m Steel Box 25m+27m +27m +25m =104m
2-Abut (Integral Abutment)Bored Pile
Φ3-1800,L = 30m Φ3-1800,L = 30m
Bored Pile Φ=1500 mm N=8 ΣL=288 m
Bored Pile Φ=2500 mm N=4, ΣL=169m
Bored Pile Φ=2500 mm N=2 ΣL=52m
Gebang 760.0 m 9.0 m 168.0 m 207.0 m 375.0 m
Light Weight Embankment
385.0 m PRC Double 4span@20m=80m, 4span@20m=80m Steel Box
27m+36m +27m =90m, 5span@27m=135m
2-Abut (Integral Abutment)Bored Pile
Φ2-1800,L = 31m Φ2-1800,L = 31m
Bored Pile Φ=1500 mm N=12 ΣL=428 m
Bored Pile Φ=2500 mm N=7
ΣL=255m
Bored Pile Φ=2500 mm N=4 ΣL=140m
Peterongan 615.0 m 13.0 m 158.0 m 195.0 m 353.0 m
Mechanically Stabilized Embankment
262.0 m PRC Double 4span@20m=80m,5span@20m=100m Steel Box 25m+32m +25m =82m
2-Abut (Integral Abutment)Bored Pile
Φ3-1800,L = 18m Φ3-1800,L = 18m
Bored Pile Φ=1500 mm N=14 ΣL=324 m
Bored Pile Φ=2500 mm N=4 ΣL=132m
Tanggulangin 530.0 m 13.0 m 162.0 m 168.0 m 330.0 m
Light Weight Embankment
200.0 m PRC Double 2span@20m=40m, 3span@20m=60m
Steel Box 25m+25m +25m +25m =100m
2-Abut (Integral Abutment)Bored Pile
Φ3-1800,L = 40m Φ3-1800,L = 39m
Bored Pile Φ=1500 mm N=8 ΣL=384 m
Bored Pile Φ=2500 mm N=2 ΣL=100m
Bored Pile Φ=2500 mm N=4 ΣL=187m
12-3
12-4
12-5
12-6
12-7
12-8
12-9
12-10
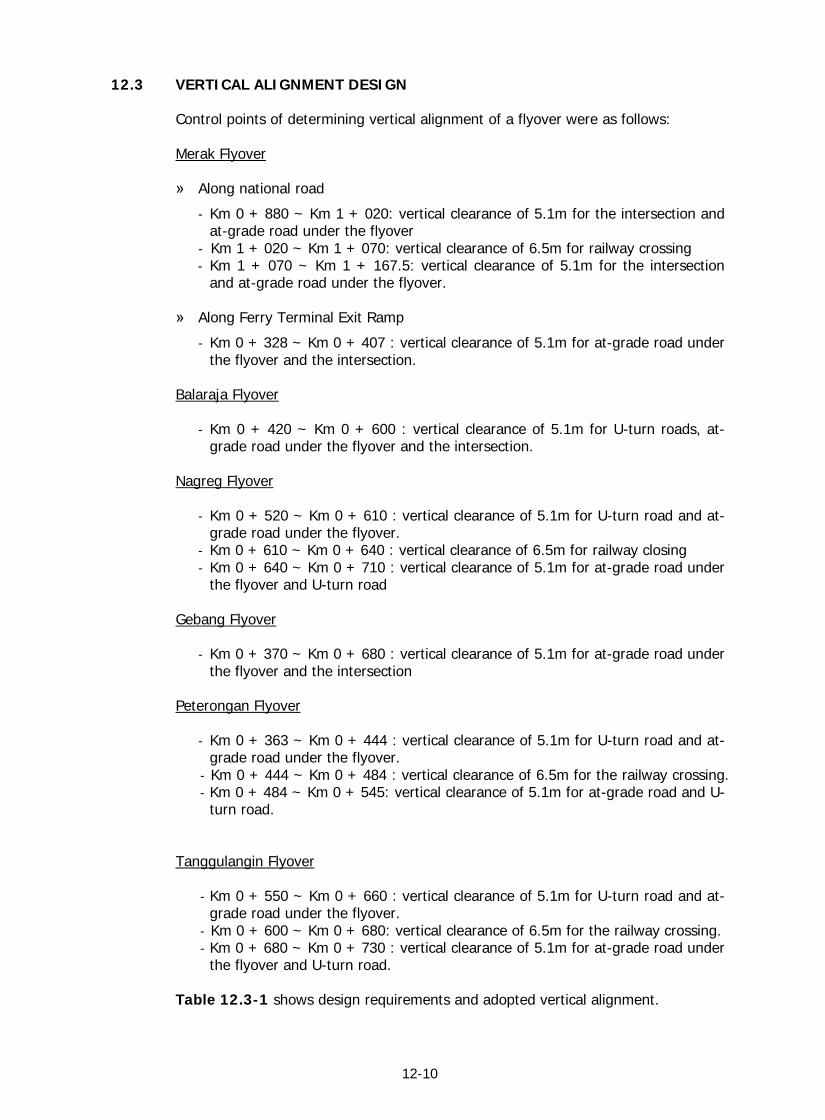
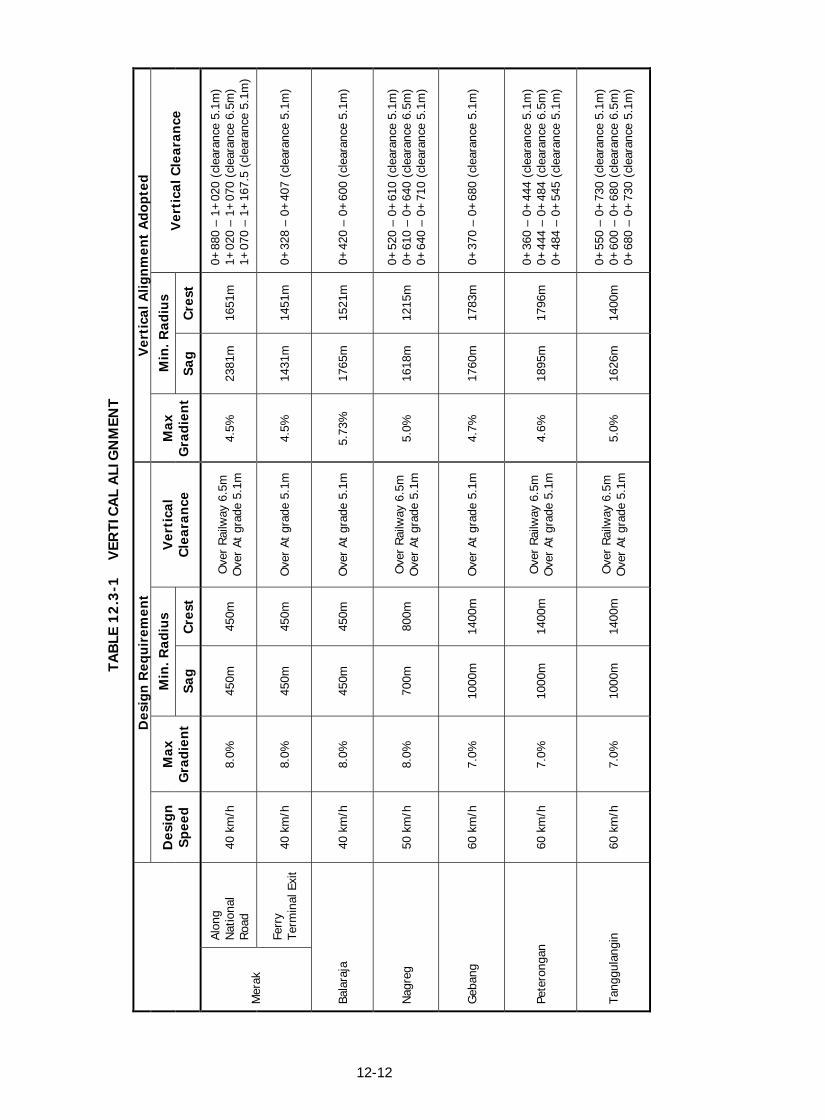
12.3 VERTICAL ALIGNMENT DESIGN
Control points of determining vertical alignment of a flyover were as follows:
Merak Flyover
» Along national road
- Km 0 + 880 ~ Km 1 + 020: vertical clearance of 5.1m for the intersection and at-grade road under the flyover
- Km 1 + 020 ~ Km 1 + 070: vertical clearance of 6.5m for railway crossing - Km 1 + 070 ~ Km 1 + 167.5: vertical clearance of 5.1m for the intersection
and at-grade road under the flyover.
» Along Ferry Terminal Exit Ramp
- Km 0 + 328 ~ Km 0 + 407 : vertical clearance of 5.1m for at-grade road under the flyover and the intersection.
Balaraja Flyover
- Km 0 + 420 ~ Km 0 + 600 : vertical clearance of 5.1m for U-turn roads, at-
grade road under the flyover and the intersection.
Nagreg Flyover
- Km 0 + 520 ~ Km 0 + 610 : vertical clearance of 5.1m for U-turn road and at-grade road under the flyover.
- Km 0 + 610 ~ Km 0 + 640 : vertical clearance of 6.5m for railway closing - Km 0 + 640 ~ Km 0 + 710 : vertical clearance of 5.1m for at-grade road under
the flyover and U-turn road
Gebang Flyover
- Km 0 + 370 ~ Km 0 + 680 : vertical clearance of 5.1m for at-grade road under the flyover and the intersection
Peterongan Flyover
- Km 0 + 363 ~ Km 0 + 444 : vertical clearance of 5.1m for U-turn road and at-
grade road under the flyover. - Km 0 + 444 ~ Km 0 + 484 : vertical clearance of 6.5m for the railway crossing. - Km 0 + 484 ~ Km 0 + 545: vertical clearance of 5.1m for at-grade road and U-
turn road.
Tanggulangin Flyover
- Km 0 + 550 ~ Km 0 + 660 : vertical clearance of 5.1m for U-turn road and at-grade road under the flyover.
- Km 0 + 600 ~ Km 0 + 680: vertical clearance of 6.5m for the railway crossing. - Km 0 + 680 ~ Km 0 + 730 : vertical clearance of 5.1m for at-grade road under
the flyover and U-turn road.
Table 12.3-1 shows design requirements and adopted vertical alignment.
12-11
TAB
LE 1
2.2
-1
HO
RIZ
ON
TAL
ALI
GN
MEN
T
Des
ign
Req
uir
emen
t H
oriz
onta
l Alig
nm
ent
Ado
pted
D
esig
n
Spe
ed
Min
. R
adiu
s Fl
yove
r C
ente
rlin
e N
o. o
f cu
rves
Min
. R
adiu
s A
dopt
ed
Su
per-
elev
atio
n
Rem
arks
Alon
g N
atio
nal
Roa
d (P
ulor
ida
Side
) 40
km
/h
55m
-
Abou
t 10
m f
rom
rig
ht e
dge
of
exis
ting
RO
W
4 15
0m
6.0%
S-
curv
e at
rai
lway
cr
ossi
ng
Ferr
y Te
rmin
al
Exit
Ram
p 40
km
/h
55m
- Ab
out
4.0
m f
rom
left
sid
e bo
unda
ry b
etw
een
ASD
P an
d ra
ilway
land
for
the
first
100
m
.
2 20
0m
5.5%
-
Mer
ak
Alon
g N
atio
nal
Roa
d (J
akar
ta
Side
) 40
km
/h
55m
-
Abou
t 0.
5 m
left
sid
e of
the
ex
istin
g ro
ad c
ente
rline
. 1
1500
m
2.0%
-
Bala
raja
40
km
/h
55m
-
Cent
erlin
e of
acq
uire
d ne
w
RO
W
4 75
m
5.7%
Sh
arp
curv
e
Nag
reg
50 k
m/h
90
m
- Ce
nter
line
of
bein
g ac
quire
d ne
w R
OW
7
150m
5.
3%
S-cu
rve
at r
ailw
ay
cros
sing
Geb
ang
60 k
m/h
13
5m
- Le
ft e
dge
of f
lyov
er a
lmos
t fo
llow
ing
exis
ting
road
ce
nter
line
6 12
00m
2%
(Nor
mal
)
Pete
rong
an
60 k
m/h
13
5m
- Al
mos
t fo
llow
ing
exis
ting
road
ce
nter
line
3 80
0m
2.5%
Tang
gula
ngin
60
km
/h
135m
-
Alm
ost
follo
win
g ex
istin
g ro
ad
cent
erlin
e 6
250m
5.
0%
S-cu
rve
at r
ailw
ay
cros
sing
12-12
TAB
LE 1
2.3
-1
VER
TIC
AL
ALI
GN
MEN
T
Des
ign
Req
uir
emen
t V
erti
cal A
lign
men
t A
dopt
ed
Min
. Rad
ius
Min
. Rad
ius
D
esig
n
Spe
ed
Max
G
radi
ent
Sag
C
rest
V
erti
cal
Cle
aran
ce
Max
G
radi
ent
Sag
C
rest
V
erti
cal C
lear
ance
Alon
g N
atio
nal
Roa
d 40
km
/h
8.0%
45
0m
450m
O
ver
Rai
lway
6.5
m
Ove
r At
gra
de 5
.1m
4.
5%
2381
m
1651
m
0+88
0 –
1+02
0 (c
lear
ance
5.1
m)
1+02
0 –
1+07
0 (c
lear
ance
6.5
m)
1+07
0 –
1+16
7.5
(cle
aran
ce 5
.1m
)M
erak
Ferr
y Te
rmin
al E
xit
40 k
m/h
8.
0%
450m
45
0m
Ove
r At
gra
de 5
.1m
4.
5%
1431
m
1451
m
0+32
8 –
0+40
7 (c
lear
ance
5.1
m)
Bala
raja
40
km
/h
8.0%
45
0m
450m
O
ver
At g
rade
5.1
m
5.73
%
1765
m
1521
m
0+42
0 –
0+60
0 (c
lear
ance
5.1
m)
Nag
reg
50 k
m/h
8.
0%
700m
80
0m
Ove
r R
ailw
ay 6
.5m
O
ver
At g
rade
5.1
m
5.0%
16
18m
12
15m
0+
520
– 0+
610
(cle
aran
ce 5
.1m
) 0+
610
– 0+
640
(cle
aran
ce 6
.5m
) 0+
640
– 0+
710
(cle
aran
ce 5
.1m
)
Geb
ang
60 k
m/h
7.
0%
1000
m
1400
m
Ove
r At
gra
de 5
.1m
4.
7%
1760
m
1783
m
0+37
0 –
0+68
0 (c
lear
ance
5.1
m)
Pete
rong
an
60 k
m/h
7.
0%
1000
m
1400
m
Ove
r R
ailw
ay 6
.5m
O
ver
At g
rade
5.1
m
4.6%
18
95m
17
96m
0+
360
– 0+
444
(cle
aran
ce 5
.1m
) 0+
444
– 0+
484
(cle
aran
ce 6
.5m
) 0+
484
– 0+
545
(cle
aran
ce 5
.1m
)
Tang
gula
ngin
60
km
/h
7.0%
10
00m
14
00m
O
ver
Rai
lway
6.5
m
Ove
r At
gra
de 5
.1m
5.
0%
1626
m
1400
m
0+55
0 –
0+73
0 (c
lear
ance
5.1
m)
0+60
0 –
0+68
0 (c
lear
ance
6.5
m)
0+68
0 –
0+73
0 (c
lear
ance
5.1
m)
12-13
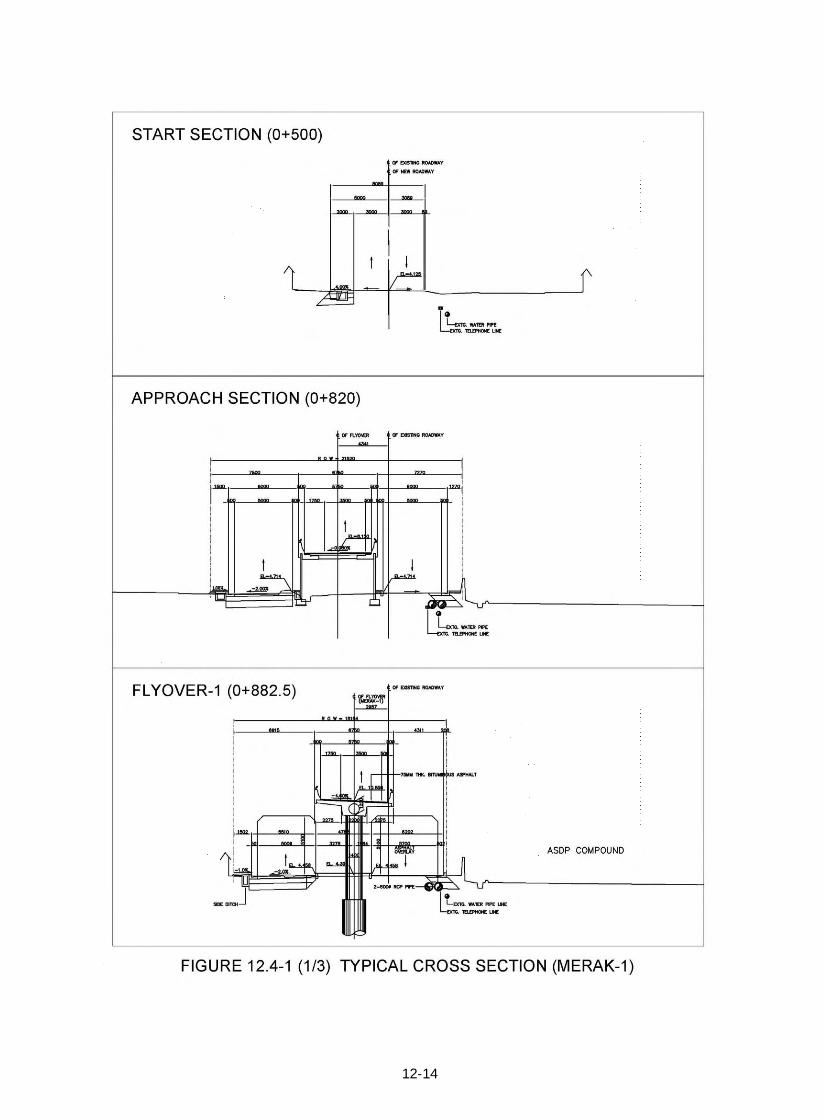
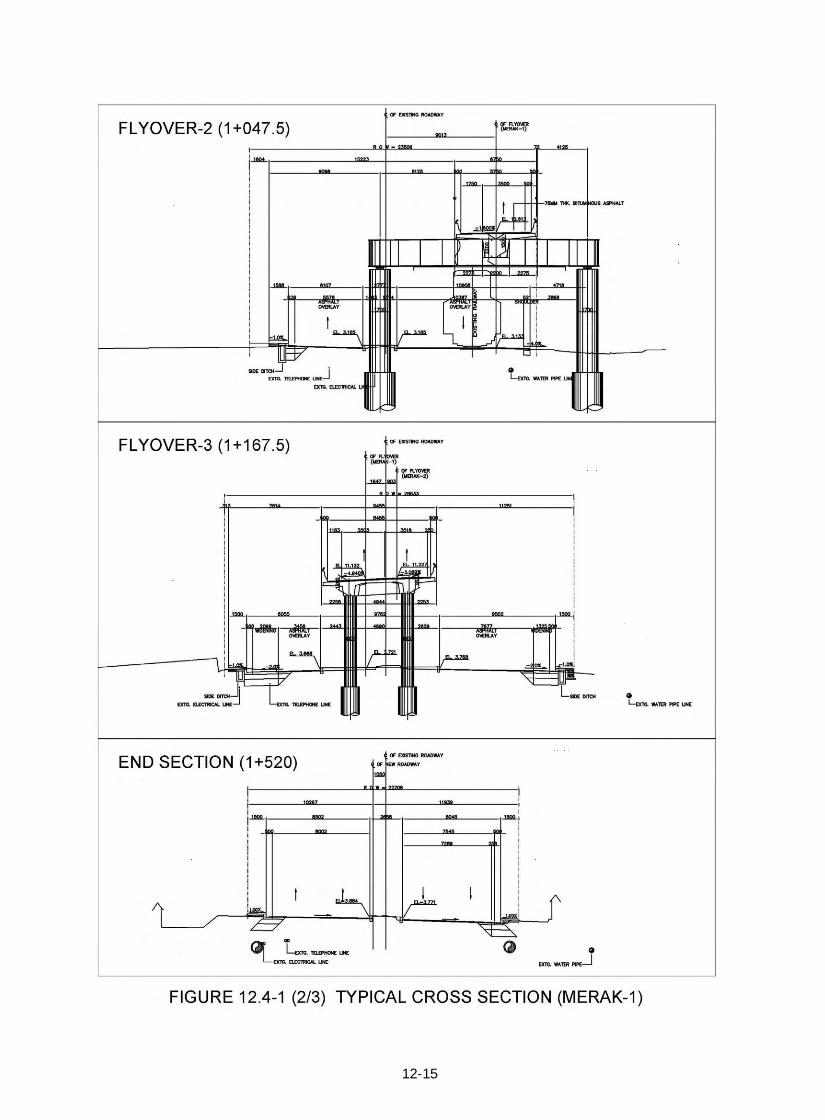
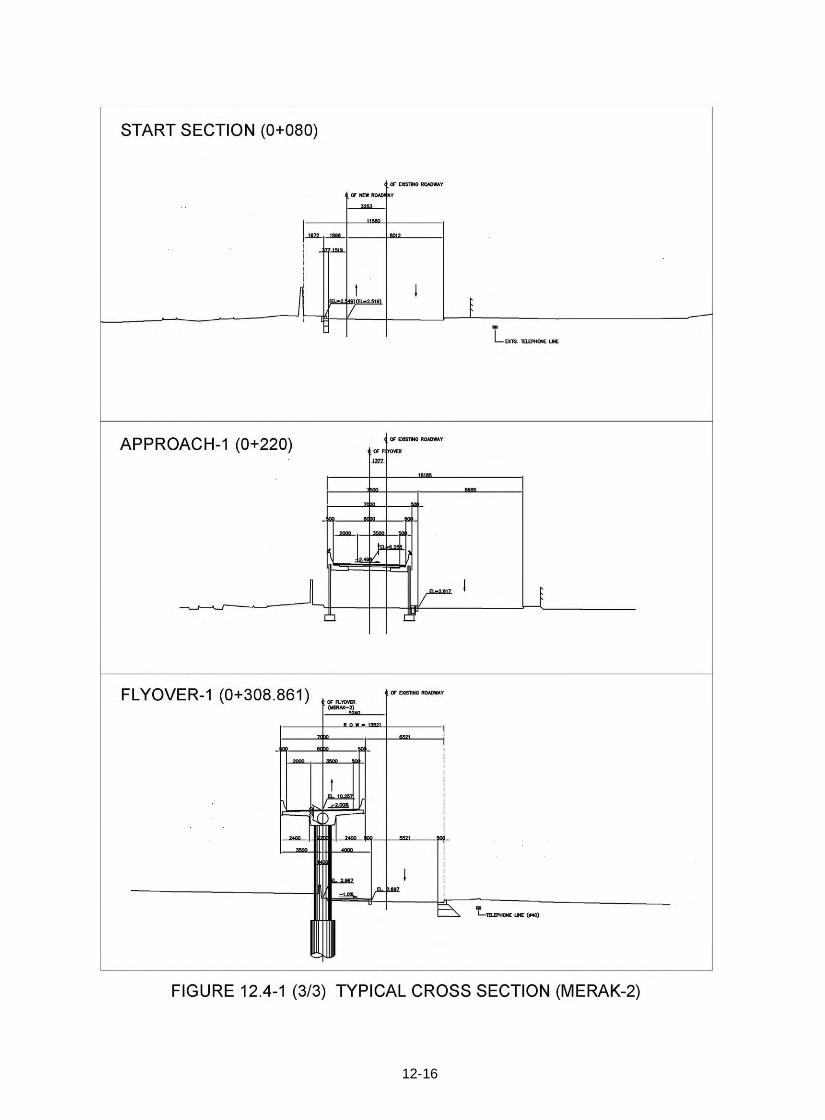
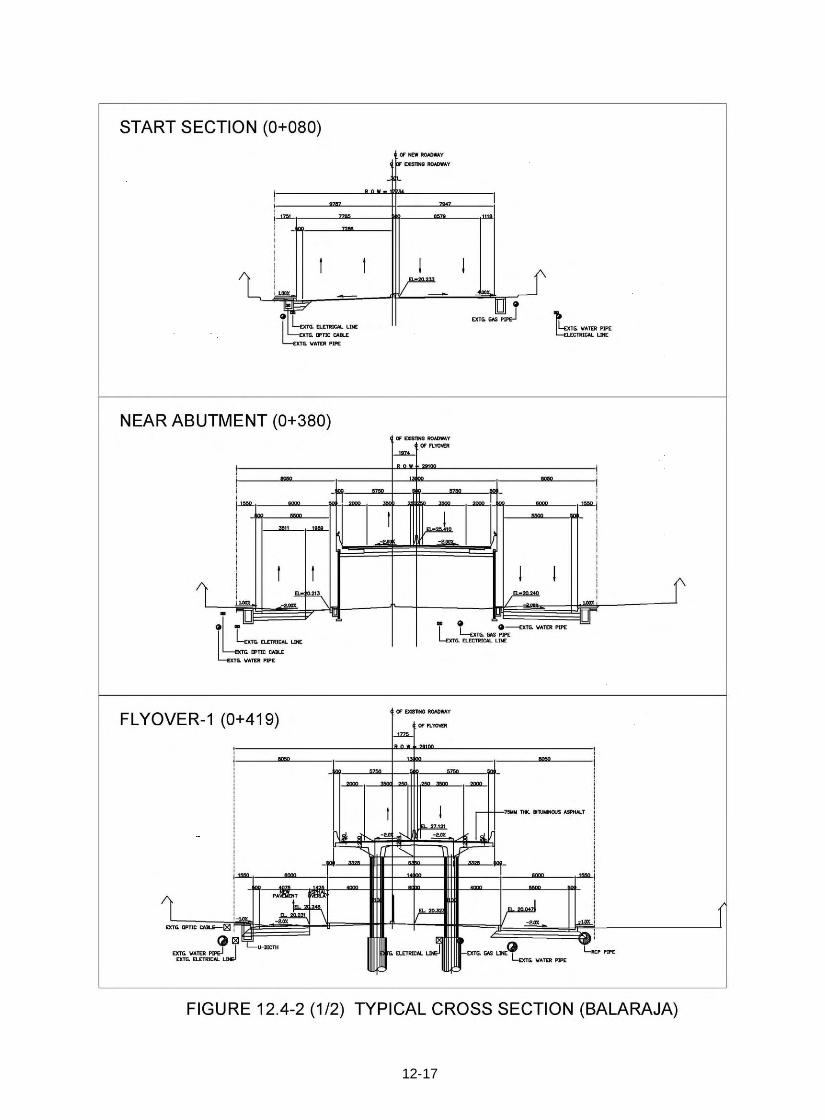
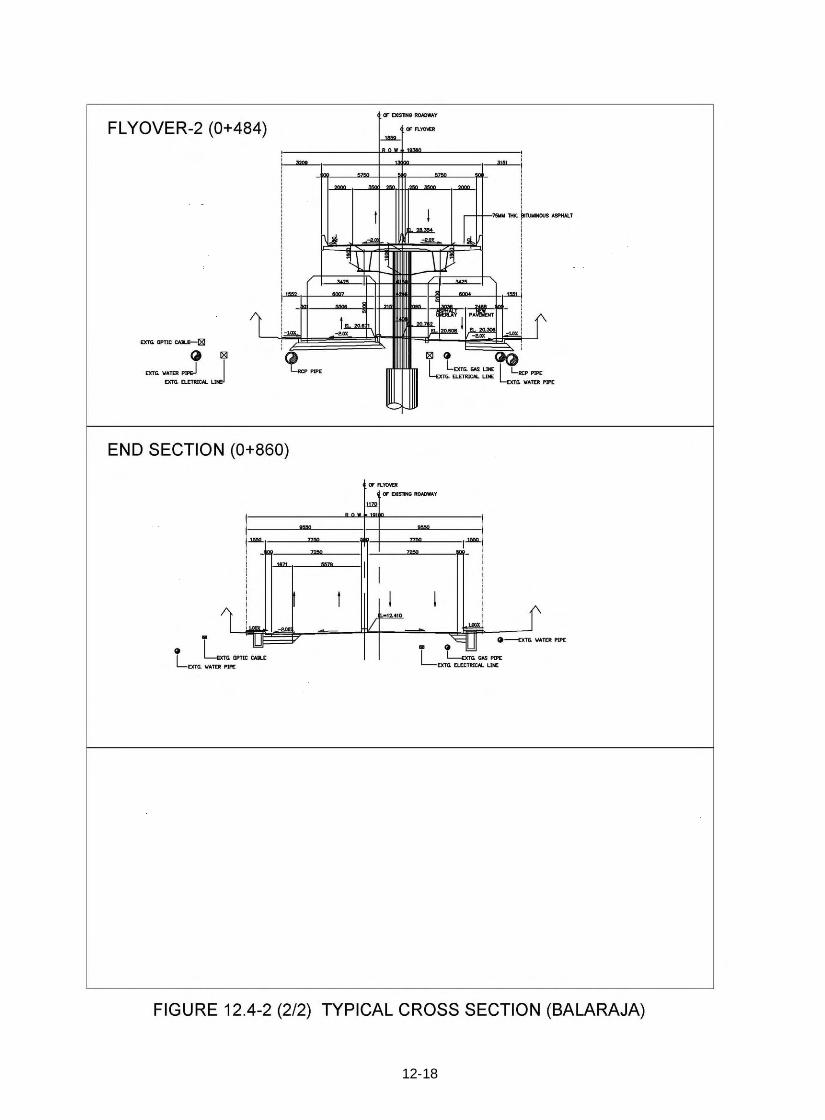
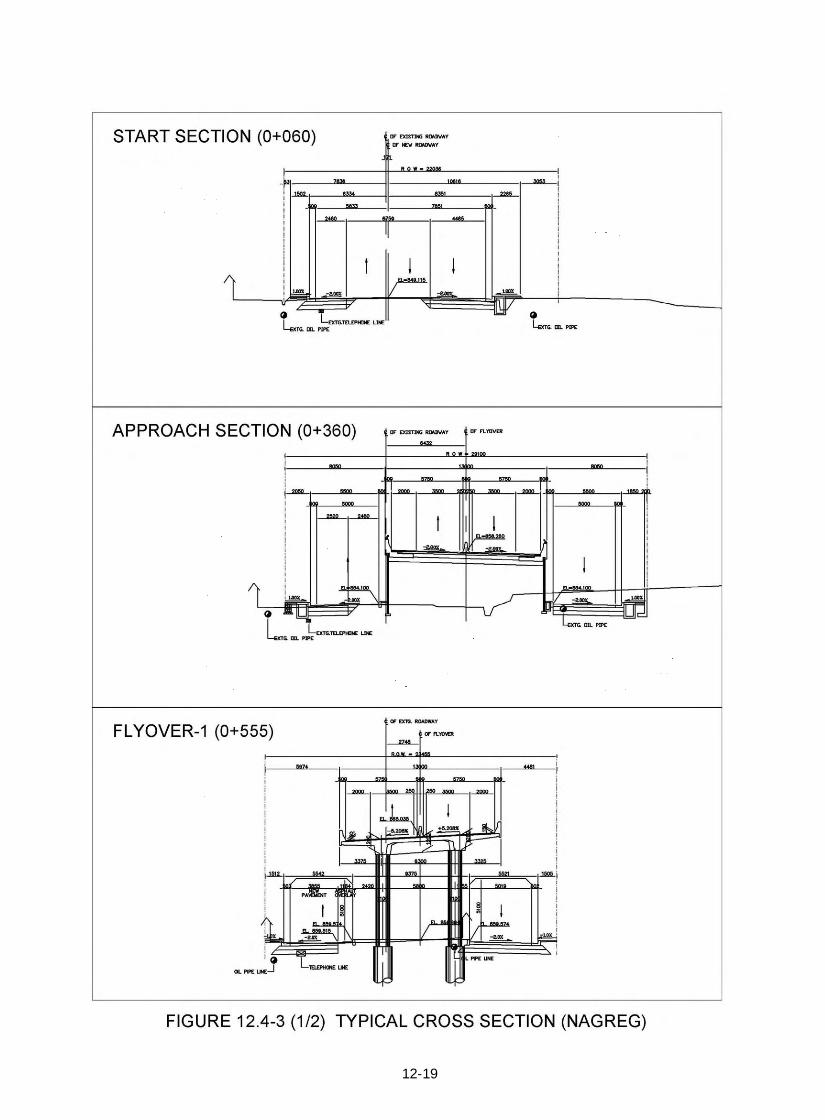
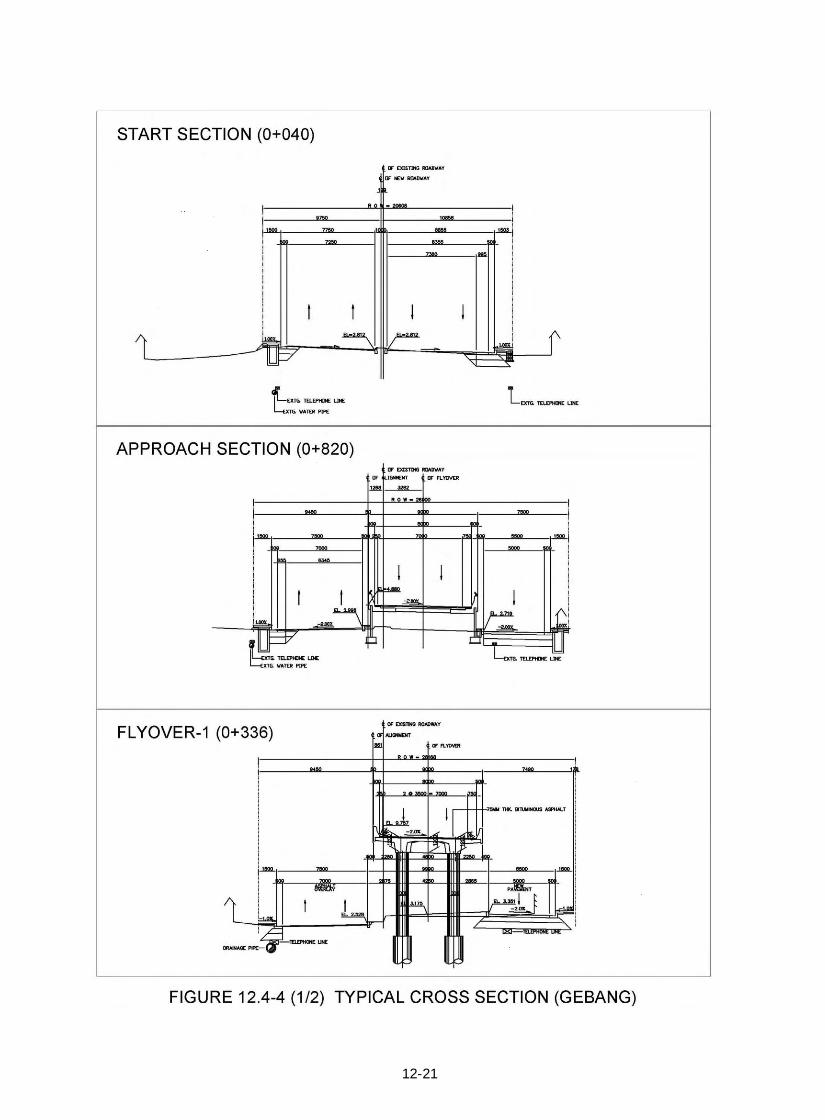
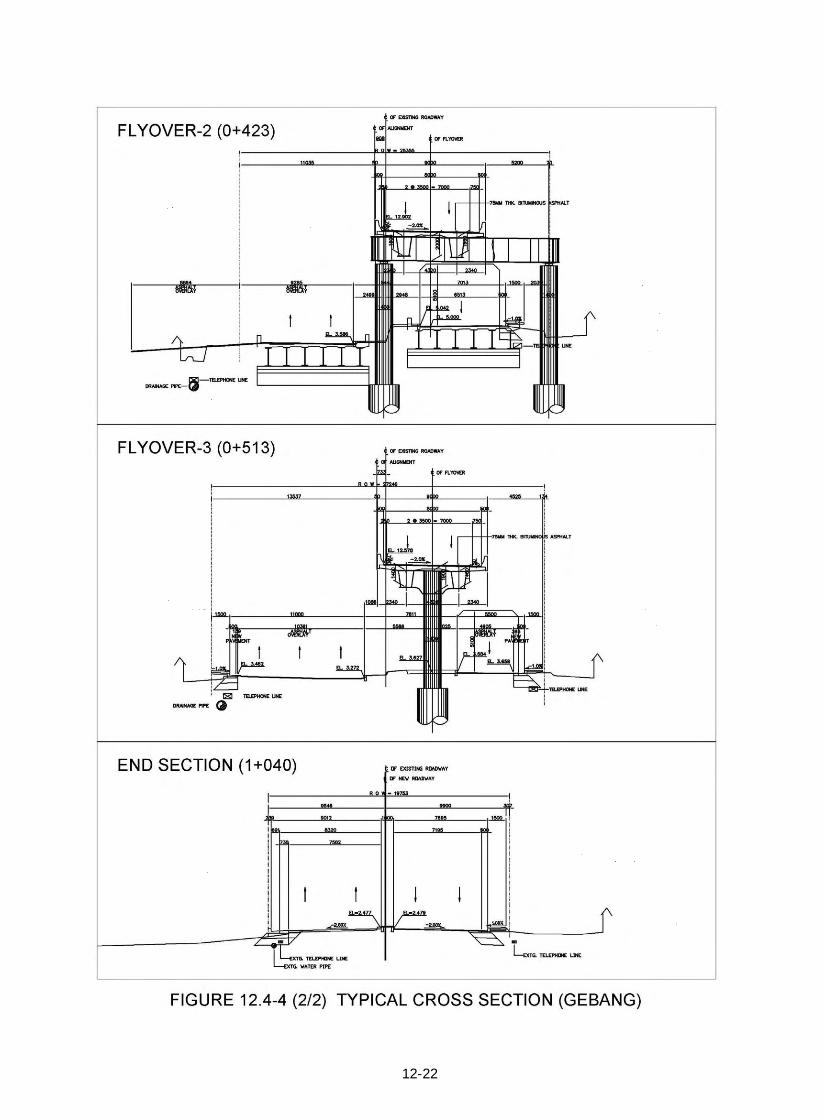
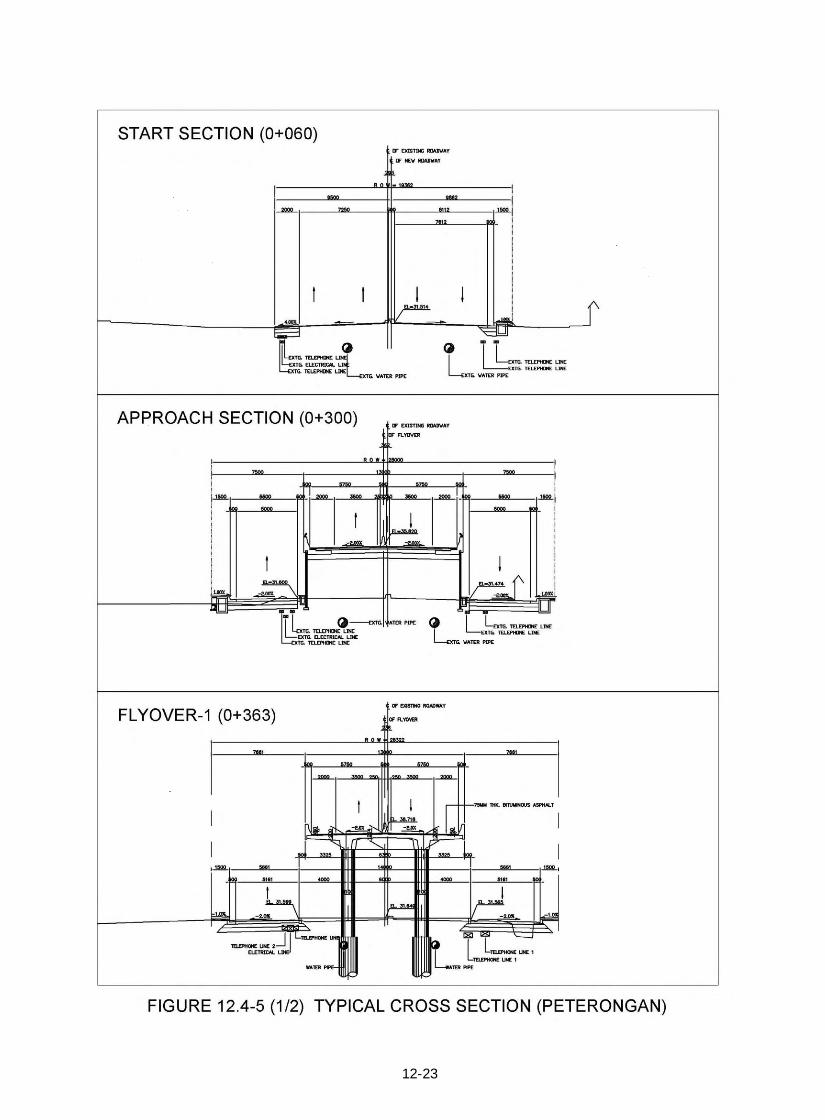
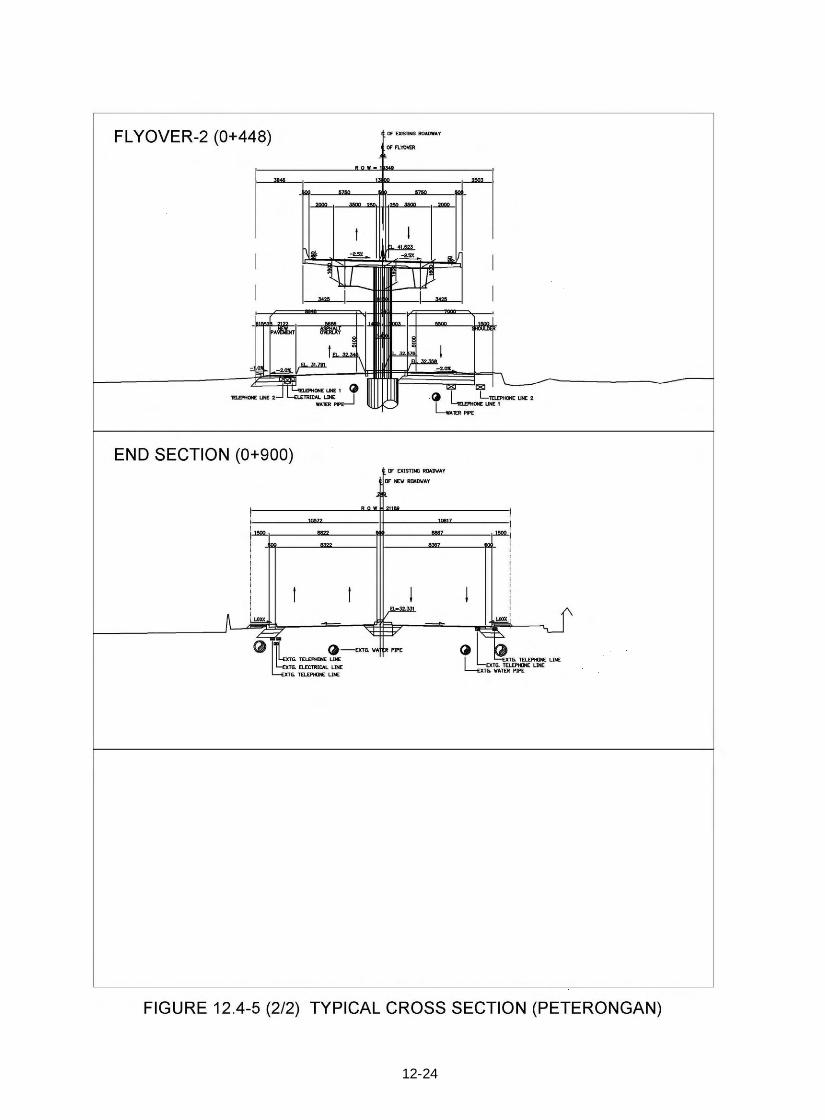
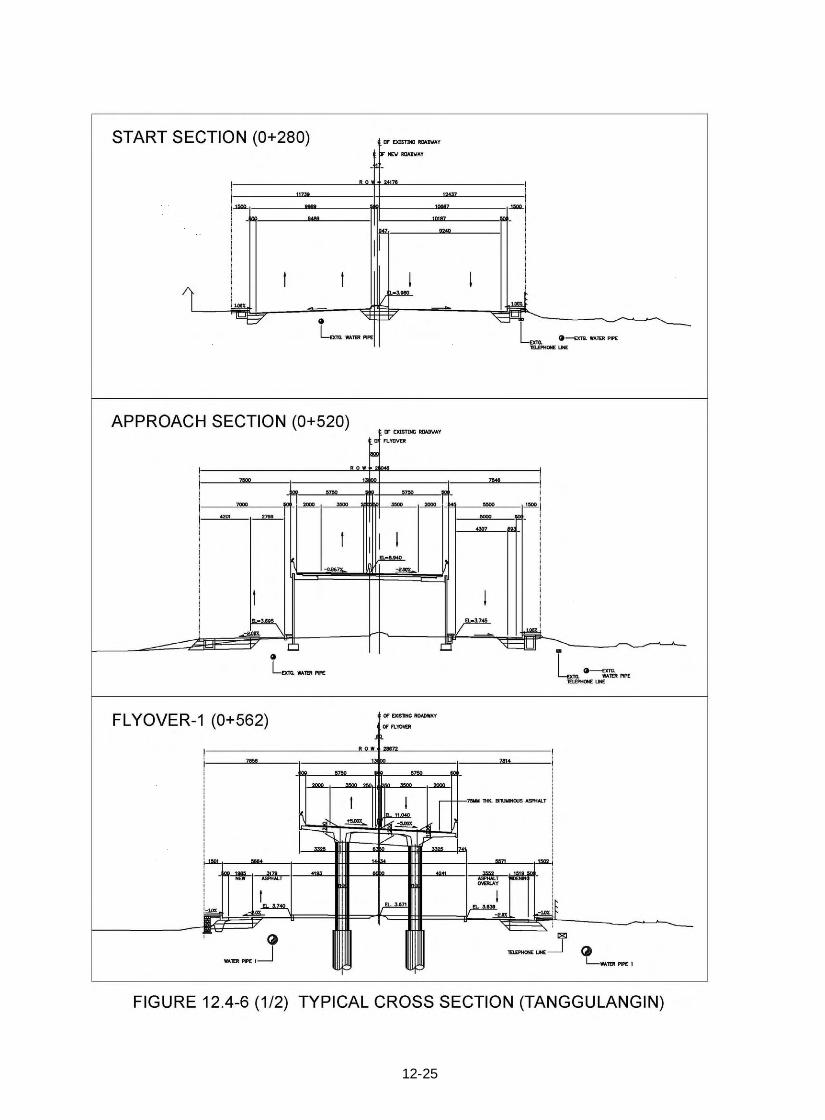
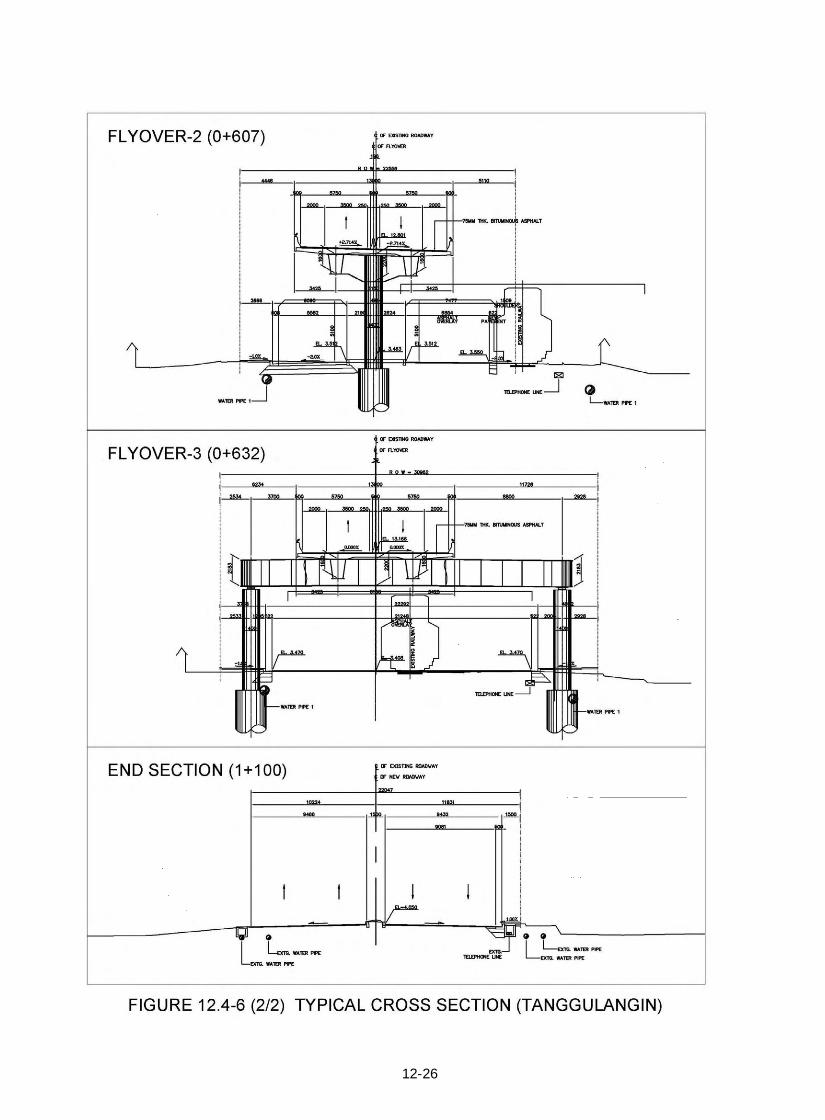
12.4 CROSS SECTION DESIGN Figure 12.4-1 to Figure 12.4-6 shows the typical cross sections (beginning section, approach section, viaduct section and end section) of each flyover.
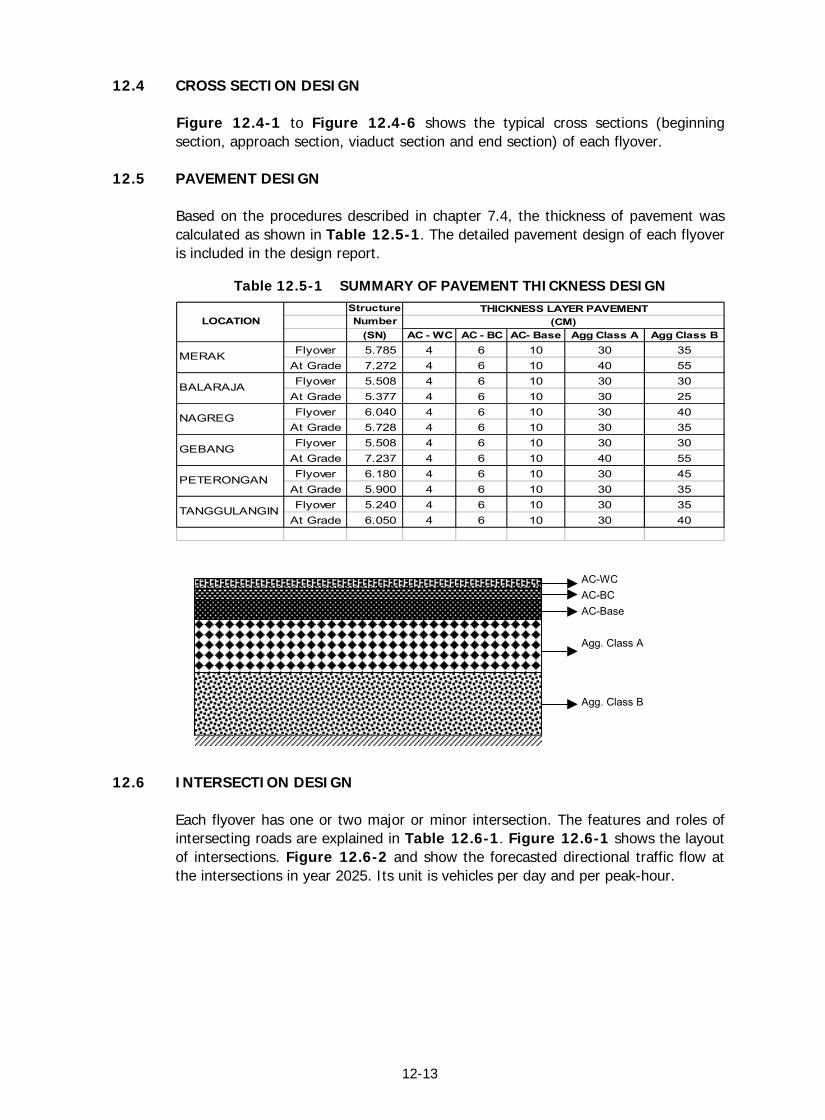
12.5 PAVEMENT DESIGN
Based on the procedures described in chapter 7.4, the thickness of pavement was calculated as shown in Table 12.5-1. The detailed pavement design of each flyover is included in the design report.
Table 12.5-1 SUMMARY OF PAVEMENT THICKNESS DESIGN
StructureNumber
(SN) AC - WC AC - BC AC- Base Agg Class A Agg Class BFlyover 5.785 4 6 10 30 35
At Grade 7.272 4 6 10 40 55Flyover 5.508 4 6 10 30 30
At Grade 5.377 4 6 10 30 25Flyover 6.040 4 6 10 30 40
At Grade 5.728 4 6 10 30 35Flyover 5.508 4 6 10 30 30
At Grade 7.237 4 6 10 40 55Flyover 6.180 4 6 10 30 45
At Grade 5.900 4 6 10 30 35Flyover 5.240 4 6 10 30 35
At Grade 6.050 4 6 10 30 40
THICKNESS LAYER PAVEMENT(CM)
MERAK
TANGGULANGIN
PETERONGAN
GEBANG
NAGREG
BALARAJA
LOCATION
12.6 INTERSECTION DESIGN
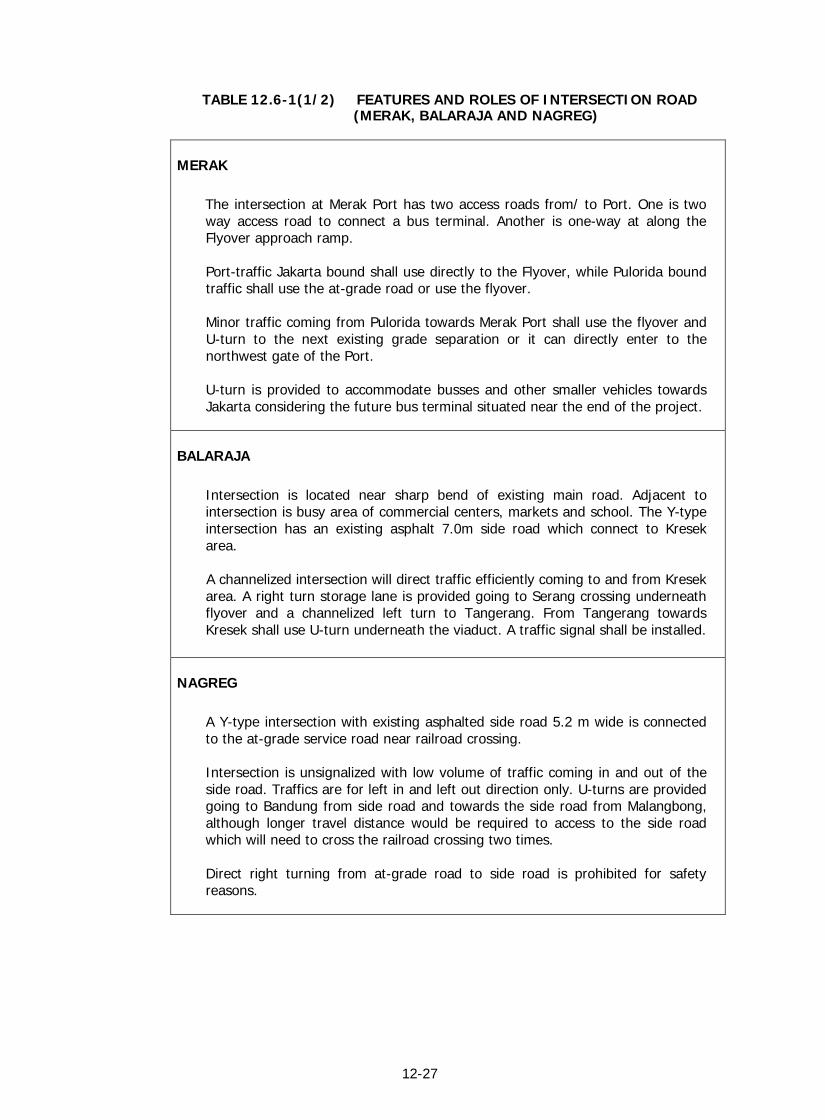
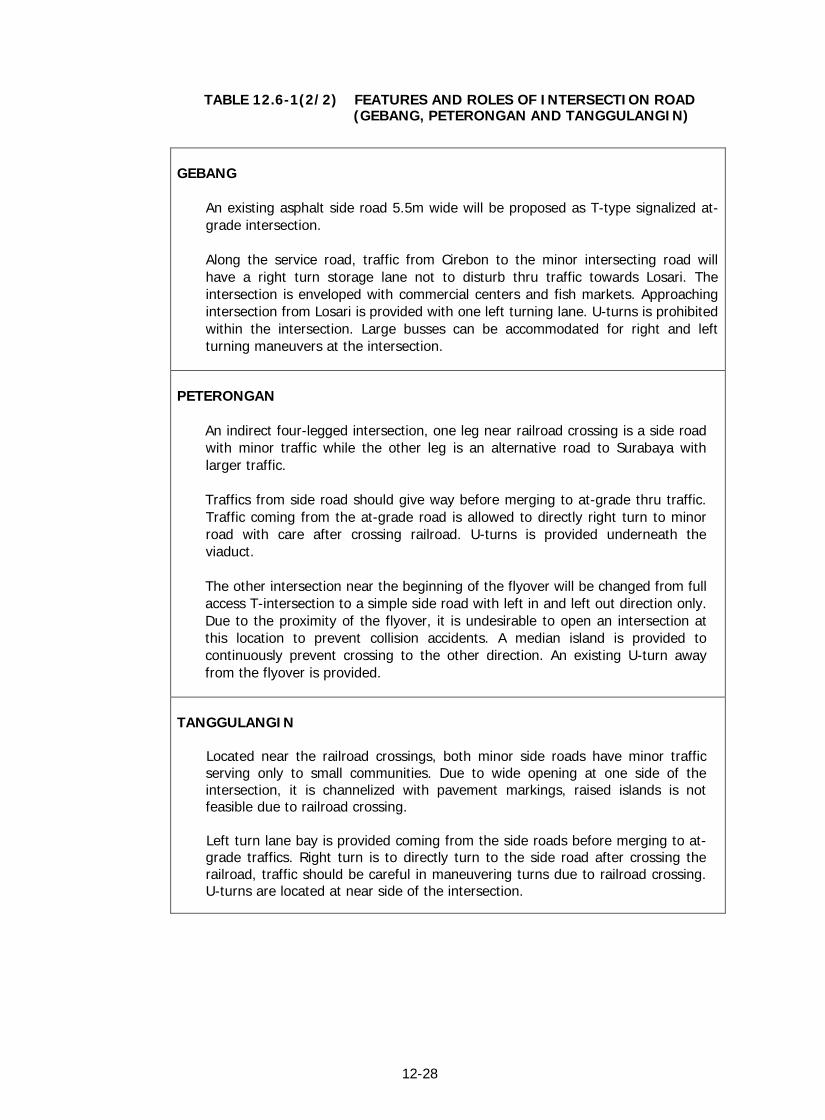
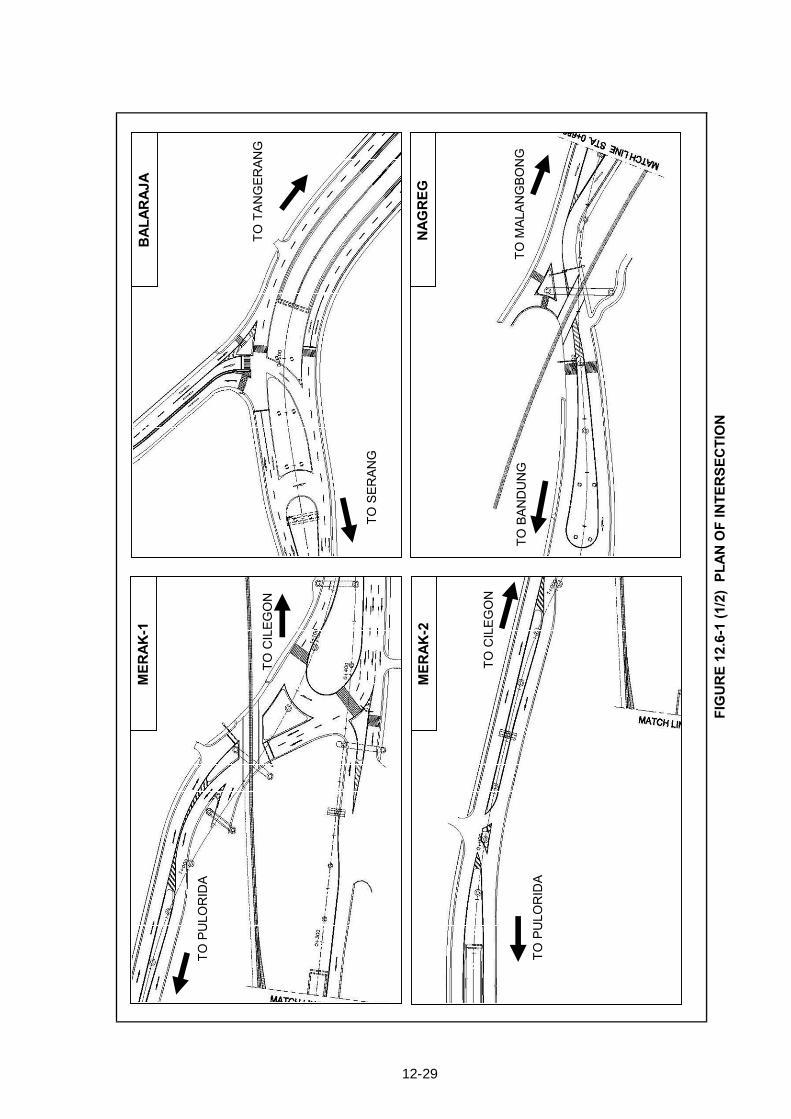
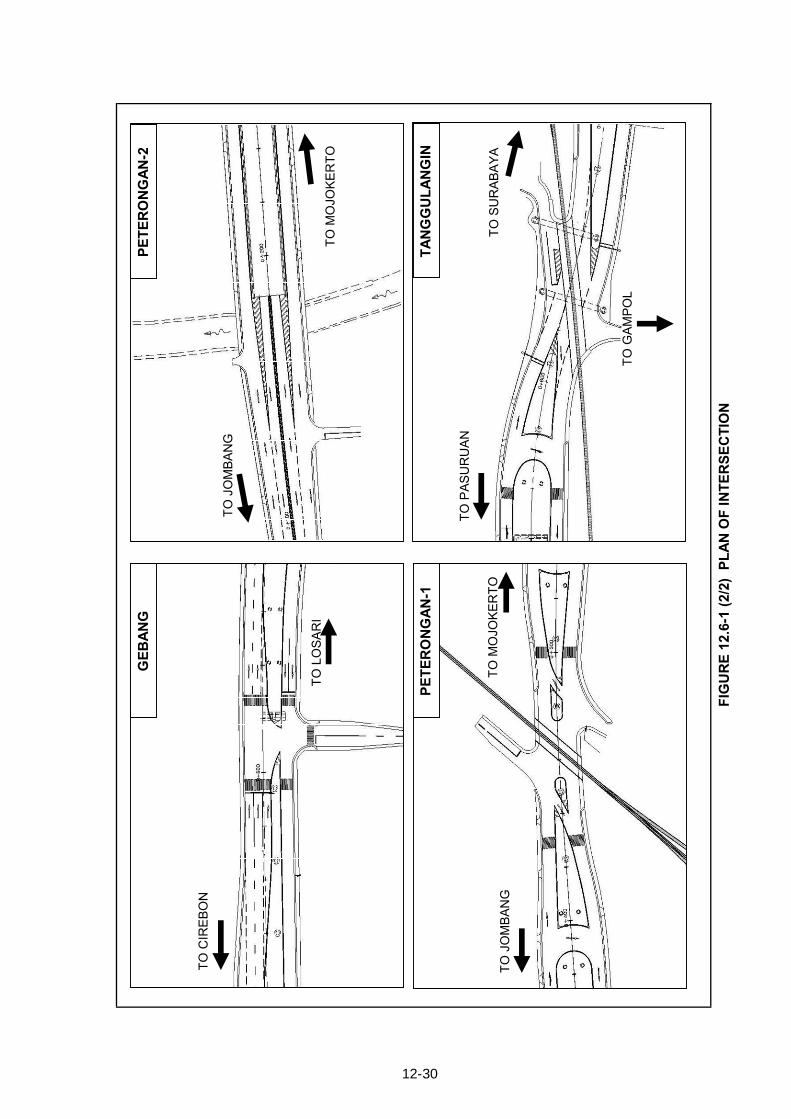
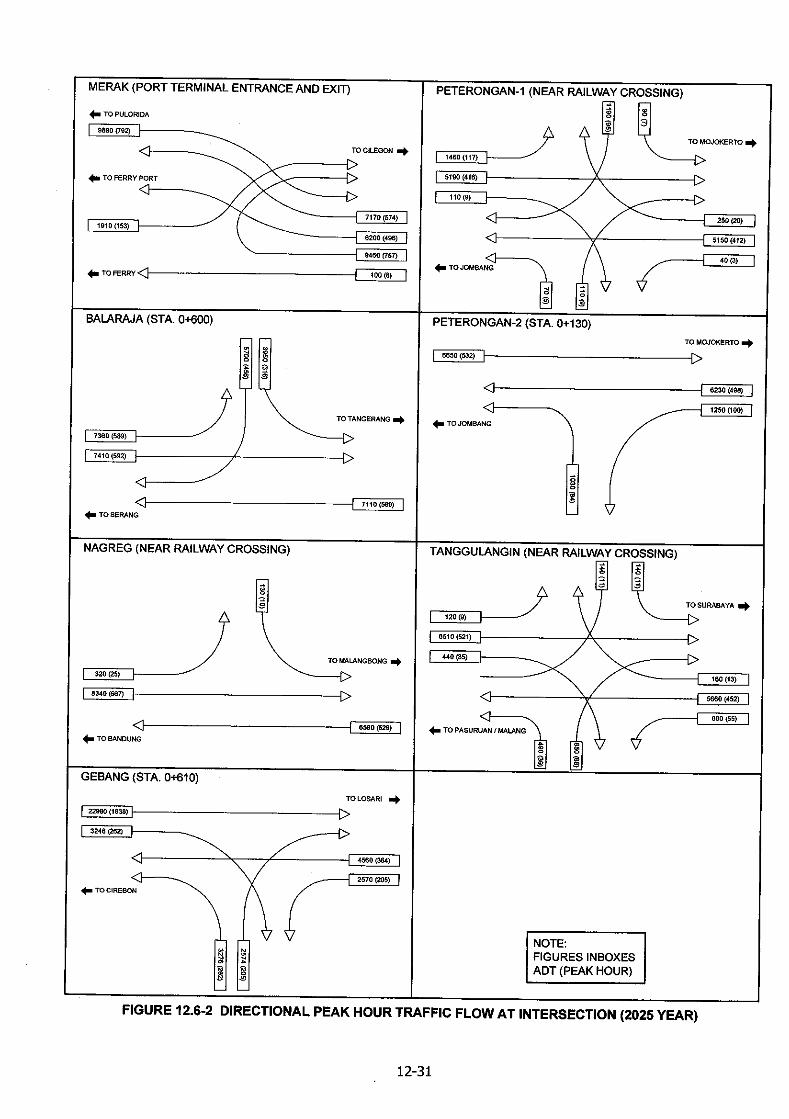
Each flyover has one or two major or minor intersection. The features and roles of intersecting roads are explained in Table 12.6-1. Figure 12.6-1 shows the layout of intersections. Figure 12.6-2 and show the forecasted directional traffic flow at the intersections in year 2025. Its unit is vehicles per day and per peak-hour.
AC-WC AC-BC AC-Base Agg. Class A
Agg. Class B
12-14
12-15
12-16
12-17
12-18
12-19

12-20
12-21
12-22
12-23
12-24
12-25
12-26
12-27
TABLE 12.6-1(1/2) FEATURES AND ROLES OF INTERSECTION ROAD
(MERAK, BALARAJA AND NAGREG)
MERAK The intersection at Merak Port has two access roads from/ to Port. One is two way access road to connect a bus terminal. Another is one-way at along the Flyover approach ramp. Port-traffic Jakarta bound shall use directly to the Flyover, while Pulorida bound traffic shall use the at-grade road or use the flyover. Minor traffic coming from Pulorida towards Merak Port shall use the flyover and U-turn to the next existing grade separation or it can directly enter to the northwest gate of the Port. U-turn is provided to accommodate busses and other smaller vehicles towards Jakarta considering the future bus terminal situated near the end of the project.
BALARAJA Intersection is located near sharp bend of existing main road. Adjacent to intersection is busy area of commercial centers, markets and school. The Y-type intersection has an existing asphalt 7.0m side road which connect to Kresek area. A channelized intersection will direct traffic efficiently coming to and from Kresek area. A right turn storage lane is provided going to Serang crossing underneath flyover and a channelized left turn to Tangerang. From Tangerang towards Kresek shall use U-turn underneath the viaduct. A traffic signal shall be installed.
NAGREG A Y-type intersection with existing asphalted side road 5.2 m wide is connected to the at-grade service road near railroad crossing. Intersection is unsignalized with low volume of traffic coming in and out of the side road. Traffics are for left in and left out direction only. U-turns are provided going to Bandung from side road and towards the side road from Malangbong, although longer travel distance would be required to access to the side road which will need to cross the railroad crossing two times. Direct right turning from at-grade road to side road is prohibited for safety reasons.
12-28
TABLE 12.6-1(2/2) FEATURES AND ROLES OF INTERSECTION ROAD
(GEBANG, PETERONGAN AND TANGGULANGIN)
GEBANG An existing asphalt side road 5.5m wide will be proposed as T-type signalized at-grade intersection. Along the service road, traffic from Cirebon to the minor intersecting road will have a right turn storage lane not to disturb thru traffic towards Losari. The intersection is enveloped with commercial centers and fish markets. Approaching intersection from Losari is provided with one left turning lane. U-turns is prohibited within the intersection. Large busses can be accommodated for right and left turning maneuvers at the intersection.
PETERONGAN An indirect four-legged intersection, one leg near railroad crossing is a side road with minor traffic while the other leg is an alternative road to Surabaya with larger traffic. Traffics from side road should give way before merging to at-grade thru traffic. Traffic coming from the at-grade road is allowed to directly right turn to minor road with care after crossing railroad. U-turns is provided underneath the viaduct. The other intersection near the beginning of the flyover will be changed from full access T-intersection to a simple side road with left in and left out direction only. Due to the proximity of the flyover, it is undesirable to open an intersection at this location to prevent collision accidents. A median island is provided to continuously prevent crossing to the other direction. An existing U-turn away from the flyover is provided.
TANGGULANGIN Located near the railroad crossings, both minor side roads have minor traffic serving only to small communities. Due to wide opening at one side of the intersection, it is channelized with pavement markings, raised islands is not feasible due to railroad crossing. Left turn lane bay is provided coming from the side roads before merging to at-grade traffics. Right turn is to directly turn to the side road after crossing the railroad, traffic should be careful in maneuvering turns due to railroad crossing. U-turns are located at near side of the intersection.
12-29
FIG
UR
E 12
.6-1
(1/2
) PL
AN O
F IN
TER
SEC
TIO
N
NAG
REG
BAL
ARAJ
AM
ERAK
-1
MER
AK-2
TO P
ULO
RID
A
TO C
ILEG
ON
TO P
ULO
RID
A
TO C
ILE
GO
N
TO S
ERAN
G
TO T
ANG
ERAN
G
TO B
AND
UN
GTO
MAL
ANG
BON
G
12-30
FIG
UR
E 12
.6-1
(2/2
) PL
AN O
F IN
TER
SEC
TIO
N
PETE
RO
NG
AN-1
PETE
RO
NG
AN-2
TAN
GG
ULA
NG
IN
GEB
ANG
TO C
IREB
ON
TO L
OSA
RI
TO J
OM
BAN
GTO
MO
JOKE
RTO
TO J
OM
BAN
G
TO M
OJO
KER
TO
TO P
ASU
RU
AN
TO S
UR
ABAY
A
TO G
AMPO
L
13-1
CHAPTER 13
DRAINAGE DESIGN
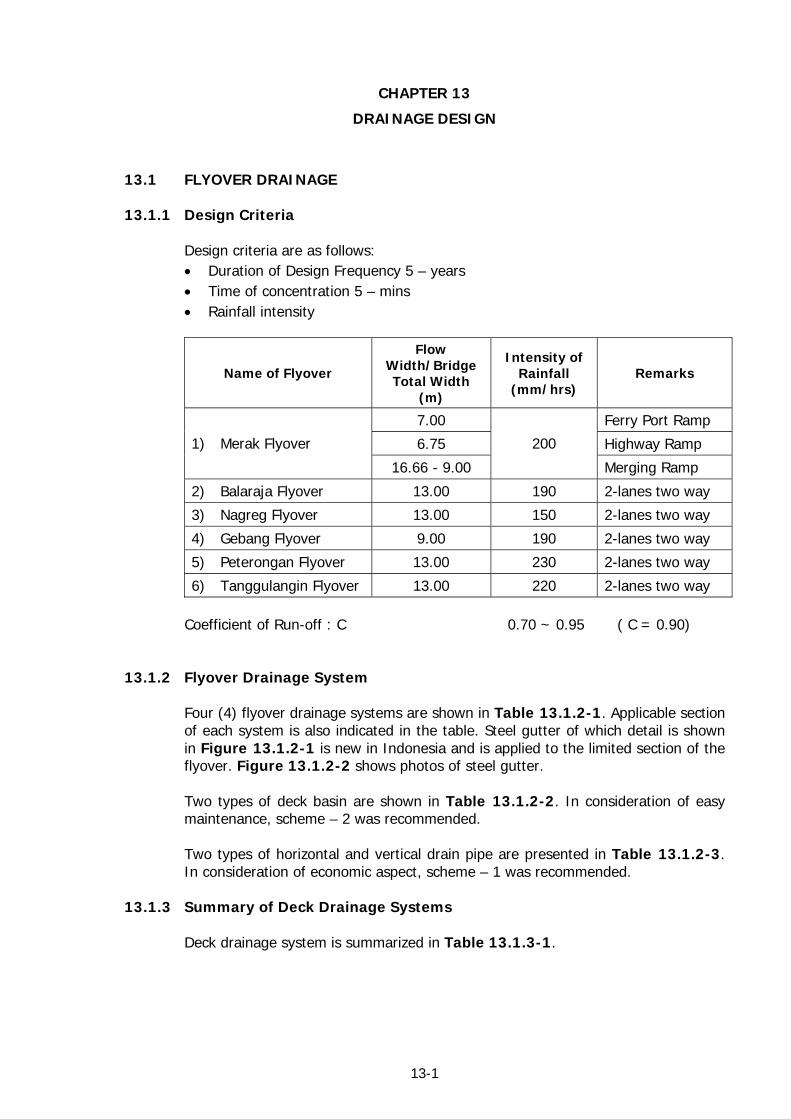
13.1 FLYOVER DRAINAGE 13.1.1 Design Criteria
Design criteria are as follows: • Duration of Design Frequency 5 – years • Time of concentration 5 – mins • Rainfall intensity
Name of Flyover
Flow Width/Bridge Total Width
(m)
Intensity of Rainfall
(mm/hrs) Remarks
7.00 Ferry Port Ramp
6.75 Highway Ramp 1) Merak Flyover
16.66 - 9.00
200
Merging Ramp
2) Balaraja Flyover 13.00 190 2-lanes two way
3) Nagreg Flyover 13.00 150 2-lanes two way
4) Gebang Flyover 9.00 190 2-lanes two way
5) Peterongan Flyover 13.00 230 2-lanes two way
6) Tanggulangin Flyover 13.00 220 2-lanes two way
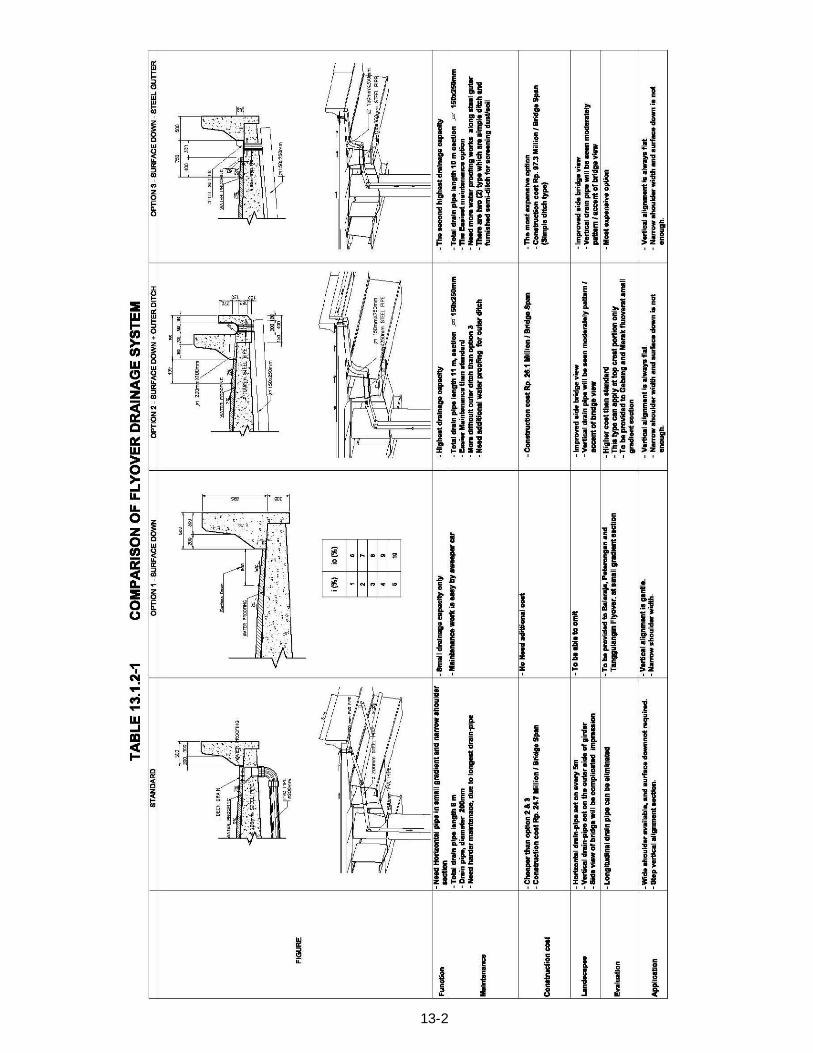
Coefficient of Run-off : C 0.70 ~ 0.95 ( C = 0.90) 13.1.2 Flyover Drainage System
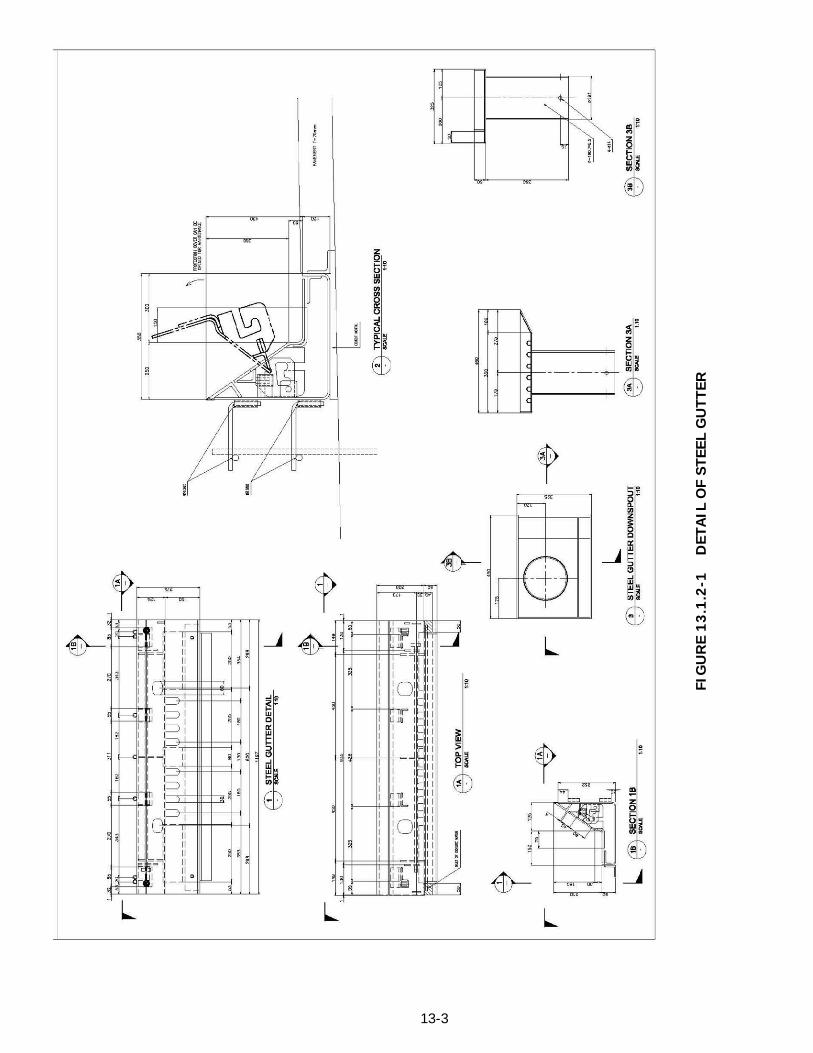
Four (4) flyover drainage systems are shown in Table 13.1.2-1. Applicable section of each system is also indicated in the table. Steel gutter of which detail is shown in Figure 13.1.2-1 is new in Indonesia and is applied to the limited section of the flyover. Figure 13.1.2-2 shows photos of steel gutter.
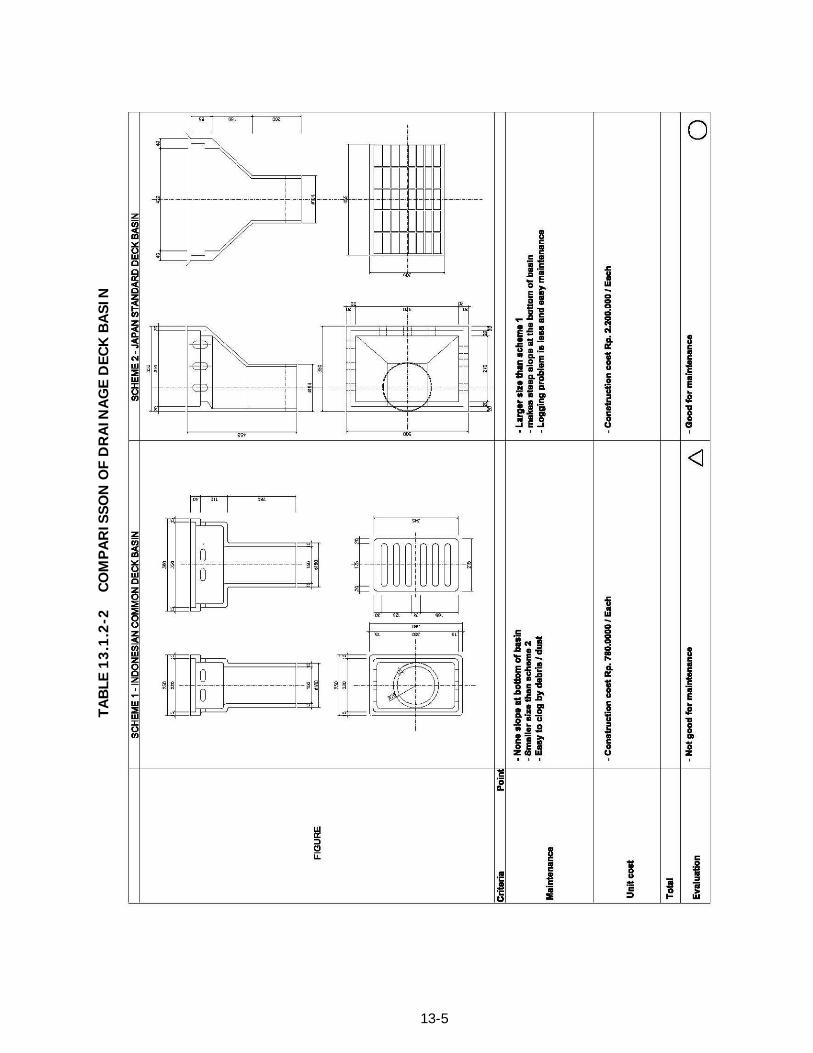
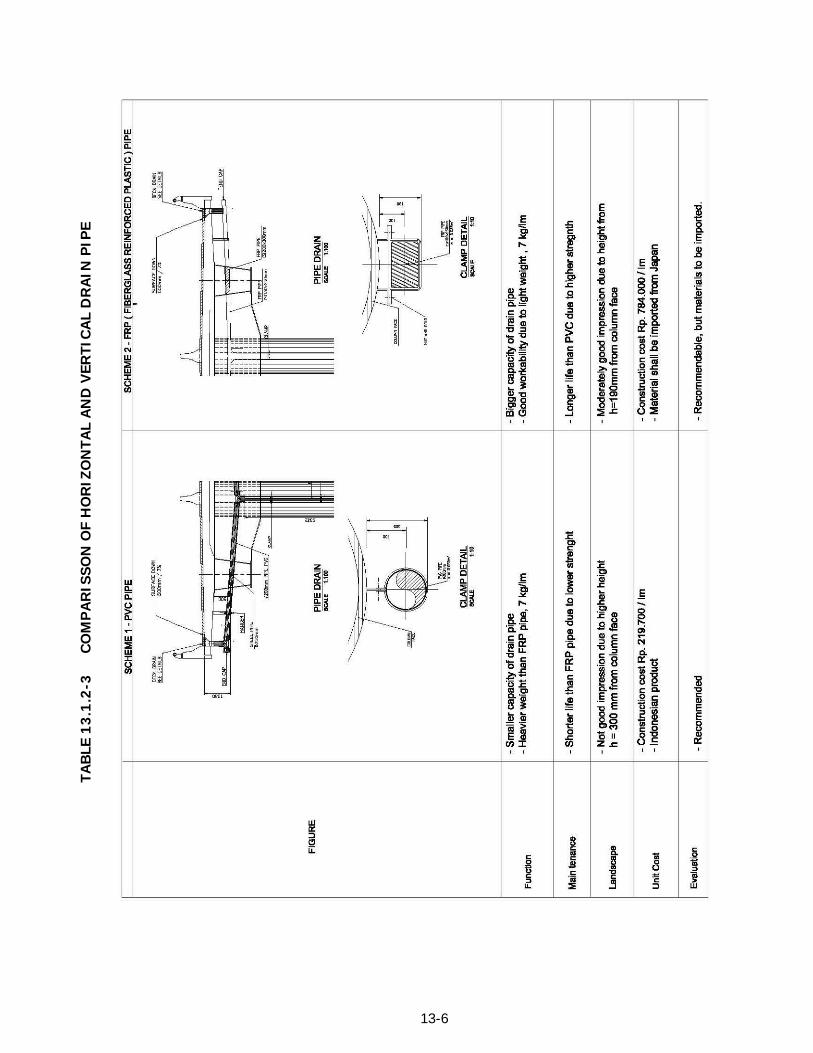
Two types of deck basin are shown in Table 13.1.2-2. In consideration of easy maintenance, scheme – 2 was recommended. Two types of horizontal and vertical drain pipe are presented in Table 13.1.2-3. In consideration of economic aspect, scheme – 1 was recommended.
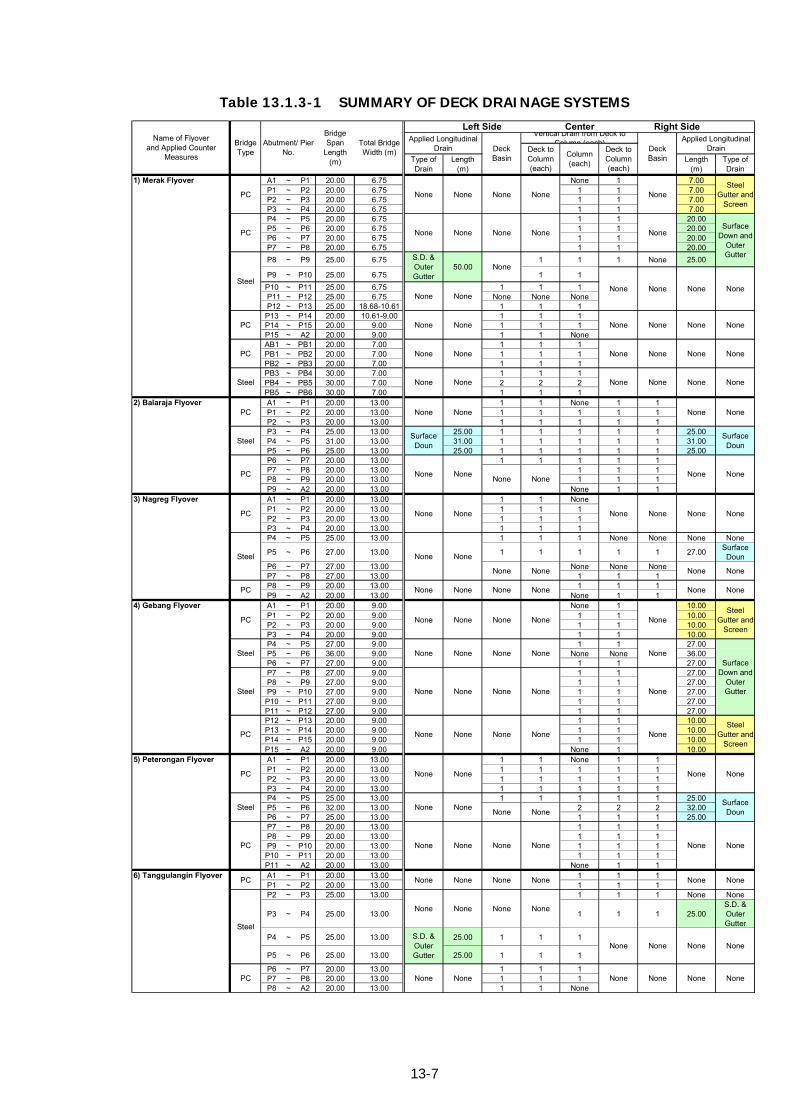
13.1.3 Summary of Deck Drainage Systems
Deck drainage system is summarized in Table 13.1.3-1.
13-2
13-3
FIG
UR
E 1
3.1
.2-1
D
ETA
IL O
F ST
EEL
GU
TTER

13-4
FIG
UR
E 1
3.1
.2-2
P
HO
TOS
OF
STEE
L G
UTT
ER
13-5
TA
BLE
13
.1.2
-2
CO
MP
AR
ISSO
N O
F D
RA
INA
GE
DEC
K B
ASI
N
13-6
TAB
LE 1
3.1
.2-3
C
OM
PA
RIS
SO
N O
F H
OR
IZO
NTA
L A
ND
VER
TIC
AL
DR
AIN
PIP
E
13-7
Table 13.1.3-1 SUMMARY OF DECK DRAINAGE SYSTEMS
Center
1) Merak Flyover A1 ~ P1 20.00 6.75 None 1 7.00P1 ~ P2 20.00 6.75 1 1 7.00P2 ~ P3 20.00 6.75 1 1 7.00P3 ~ P4 20.00 6.75 1 1 7.00P4 ~ P5 20.00 6.75 1 1 20.00P5 ~ P6 20.00 6.75 1 1 20.00P6 ~ P7 20.00 6.75 1 1 20.00P7 ~ P8 20.00 6.75 1 1 20.00P8 ~ P9 25.00 6.75 1 1 1 None 25.00
P9 ~ P10 25.00 6.75 1 1P10 ~ P11 25.00 6.75 1 1 1P11 ~ P12 25.00 6.75 None None NoneP12 ~ P13 25.00 18.68-10.61 1 1 1P13 ~ P14 20.00 10.61-9.00 1 1 1P14 ~ P15 20.00 9.00 1 1 1P15 ~ A2 20.00 9.00 1 1 NoneAB1 ~ PB1 20.00 7.00 1 1 1PB1 ~ PB2 20.00 7.00 1 1 1PB2 ~ PB3 20.00 7.00 1 1 1PB3 ~ PB4 30.00 7.00 1 1 1PB4 ~ PB5 30.00 7.00 2 2 2PB5 ~ PB6 30.00 7.00 1 1 1
2) Balaraja Flyover A1 ~ P1 20.00 13.00 1 1 None 1 1P1 ~ P2 20.00 13.00 1 1 1 1 1P2 ~ P3 20.00 13.00 1 1 1 1 1P3 ~ P4 25.00 13.00 25.00 1 1 1 1 1 25.00P4 ~ P5 31.00 13.00 31.00 1 1 1 1 1 31.00P5 ~ P6 25.00 13.00 25.00 1 1 1 1 1 25.00P6 ~ P7 20.00 13.00 1 1 1 1 1P7 ~ P8 20.00 13.00 1 1 1P8 ~ P9 20.00 13.00 1 1 1P9 ~ A2 20.00 13.00 None 1 1
3) Nagreg Flyover A1 ~ P1 20.00 13.00 1 1 NoneP1 ~ P2 20.00 13.00 1 1 1P2 ~ P3 20.00 13.00 1 1 1P3 ~ P4 20.00 13.00 1 1 1P4 ~ P5 25.00 13.00 1 1 1 None None None None
P5 ~ P6 27.00 13.00 1 1 1 1 1 27.00 Surface Doun
P6 ~ P7 27.00 13.00 None None NoneP7 ~ P8 27.00 13.00 1 1 1P8 ~ P9 20.00 13.00 1 1 1P9 ~ A2 20.00 13.00 None 1 1
4) Gebang Flyover A1 ~ P1 20.00 9.00 None 1 10.00P1 ~ P2 20.00 9.00 1 1 10.00P2 ~ P3 20.00 9.00 1 1 10.00P3 ~ P4 20.00 9.00 1 1 10.00P4 ~ P5 27.00 9.00 1 1 27.00P5 ~ P6 36.00 9.00 None None 36.00P6 ~ P7 27.00 9.00 1 1 27.00P7 ~ P8 27.00 9.00 1 1 27.00P8 ~ P9 27.00 9.00 1 1 27.00P9 ~ P10 27.00 9.00 1 1 27.00P10 ~ P11 27.00 9.00 1 1 27.00P11 ~ P12 27.00 9.00 1 1 27.00P12 ~ P13 20.00 9.00 1 1 10.00P13 ~ P14 20.00 9.00 1 1 10.00P14 ~ P15 20.00 9.00 1 1 10.00P15 ~ A2 20.00 9.00 None 1 10.00
5) Peterongan Flyover A1 ~ P1 20.00 13.00 1 1 None 1 1P1 ~ P2 20.00 13.00 1 1 1 1 1P2 ~ P3 20.00 13.00 1 1 1 1 1P3 ~ P4 20.00 13.00 1 1 1 1 1P4 ~ P5 25.00 13.00 1 1 1 1 1 25.00P5 ~ P6 32.00 13.00 2 2 2 32.00P6 ~ P7 25.00 13.00 1 1 1 25.00P7 ~ P8 20.00 13.00 1 1 1P8 ~ P9 20.00 13.00 1 1 1P9 ~ P10 20.00 13.00 1 1 1P10 ~ P11 20.00 13.00 1 1 1P11 ~ A2 20.00 13.00 None 1 1
6) Tanggulangin Flyover A1 ~ P1 20.00 13.00 1 1 1P1 ~ P2 20.00 13.00 1 1 1P2 ~ P3 25.00 13.00 1 1 1 None None
P3 ~ P4 25.00 13.00 1 1 1 25.00S.D. & Outer Gutter
P4 ~ P5 25.00 13.00 25.00 1 1 1
P5 ~ P6 25.00 13.00 25.00 1 1 1
P6 ~ P7 20.00 13.00 1 1 1P7 ~ P8 20.00 13.00 1 1 1P8 ~ A2 20.00 13.00 1 1 None
None
None
None None
None None None None
None None
None None
None None
None None
None
PC
Steel
PC
S.D. & Outer Gutter
None None None None
None
Surface Doun
None None None None
None None
None None None
PCSteel
Gutter and Screen
NoneNoneNoneNoneNone
None
None None
None None
None None
None None
None
NoneNone None
None
Steel
Steel
Surface Down and
Outer Gutter
None
None None
PC
NoneSteel
PC
NoneSteel
Gutter and Screen
None None None
None None None
None
None
NoneNone None None
None None None
None None
None None NoneNone None
NoneNone None
Surface Doun
Surface Doun
None
None None
None None None NoneNone
None None
None
None None
None None None None
None None
Name of Flyover and Applied Counter
Measures
None None None None
Right Side
Type of Drain
Steel Gutter and
ScreenNone
Deck Basin
None None
None None
None
None
50.00 None
None
None
None
Surface Down and
Outer Gutter
Vertical Drain from Deck to Column (each)
Deck to Column (each)
Deck to Column (each)
Column (each)
Applied Longitudinal Drain
Length (m)
None
None
PC
PC
PC
Steel
PC
Steel
Steel
PC
PC
PC
Applied Longitudinal Drain
Type of Drain
Length (m)
Abutment/ Pier No.
Bridge Span
Length (m)
Steel
S.D. & Outer Gutter
PC
None
Total Bridge Width (m)
Bridge Type
PC
Left Side
Deck Basin

13-8
13.2 AT-GRADE ROAD DRAINAGE
1) Drainage System
Figure 13.2-1 shows a typical normal crown cross-section of a flyover and at-grade road. Drainage of surface water will require the construction of curb inlets, gutters, pipes and manholes. To design the drainage system, site investigations were conducted to determine the present problems in Indonesia. Problems are summarized in Table 13.2-1.
TABLE 13.2-1 EXSITING DRAINAGE PROBLEMS
Existing Problems Possible Measure To Solve Problems Open U-ditches are widely used which are oftenly clogged with dumped materials, this water flow is affected.
• Closed U-ditch and/or pipe are suitable for urban road drainage.
U-ditch is sometimes too flat, this water is stagnant, causing bad smells to pedestrians and residents.
• Adequate slope should be provided (minimum slope should be 0.3 %, preferably 0.5 %).
Flooding around an inlet or a catch basin is observed during heavy rain, affecting traffic flow. Flooding is mostly caused by clogged inlet and small size inlet.
• Wide opening inlet should be provided.• Around an inlet or a catch basin, AC
pavement should be so constructed to provide steep or slope to drain surface water.
• L-type gutter with wide opening should be utilized.
Pavement overlay work is narrowing inlet opening.
• Curb and gutter type with wide opening is recommended.
FIGURE 13.2-1 TYPICAL CROSS SECTION
13-9
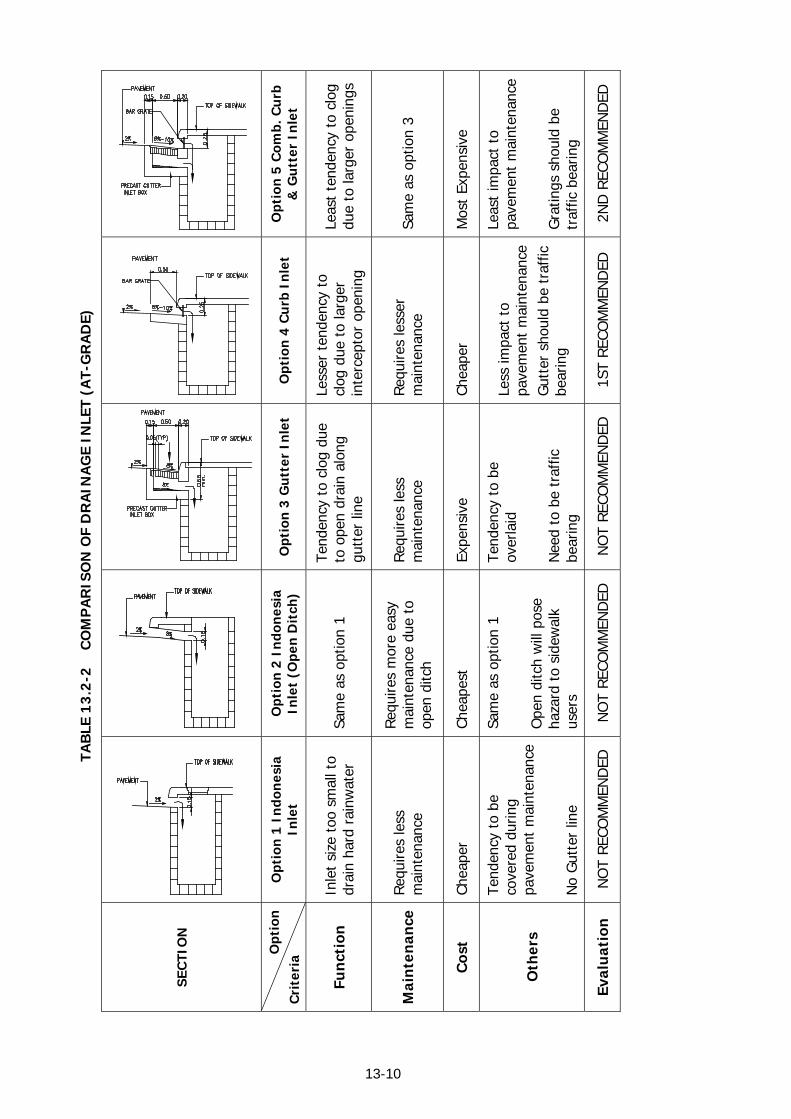
Based on these problems, the different curb inlets and gutters types that can be used for the drainage of the surface water were studied. There are five types that can be adopted as shown in Table 13.2-2. The following criteria were considered in selecting appropriate type and the option-4 (Curb Inlet Type) is selected for the surface drainage of the project.
• Function • Cost • Maintenance • Others
2) Curb Inlet Location and Spacing
Geometric Design Consideration
Geometric design almost governs the locations of drainage inlets rather than the spread of water on the pavement and the inlet interception capacity. Therefore, inlets are placed at:
• All low points in the grade (at sag portion) • At intersections, • Where pavement surface is warped, and • Beginning and end of bridges.
The other inlet locations are placed based on an inlet interception capacity.
13-10
TAB
LE 1
3.2
-2
CO
MP
AR
ISO
N O
F D
RA
INA
GE
INLE
T (A
T-G
RA
DE)
SEC
TIO
N
Opt
ion
Cri
teri
a O
ptio
n 1
In
don
esia
In
let
Opt
ion
2 I
ndo
nes
ia
Inle
t (O
pen
Dit
ch)
Opt
ion
3 G
utt
er I
nle
t O
ptio
n 4
Cu
rb I
nle
t O
ptio
n 5
Com
b. C
urb
&
Gu
tter
In
let
Fun
ctio
n
Inle
t si
ze t
oo s
mal
l to
drai
n ha
rd r
ainw
ater
Sa
me
as o
ptio
n 1
Tend
ency
to
clog
due
to
ope
n dr
ain
alon
g gu
tter
line
Less
er t
ende
ncy
to
clog
due
to
larg
er
inte
rcep
tor
open
ing
Leas
t te
nden
cy t
o cl
og
due
to la
rger
ope
ning
s
Mai
nte
nan
ceRe
quire
s le
ss
mai
nten
ance
Requ
ires
mor
e ea
sy
mai
nten
ance
due
to
open
ditc
h
Requ
ires
less
m
aint
enan
ce
Requ
ires
less
er
mai
nten
ance
Sa
me
as o
ptio
n 3
Cos
t Ch
eape
r Ch
eape
st
Expe
nsiv
e Ch
eape
r M
ost
Expe
nsiv
e
Oth
ers
Tend
ency
to
be
cove
red
durin
g pa
vem
ent
mai
nten
ance
No
Gut
ter
line
Sam
e as
opt
ion
1 O
pen
ditc
h w
ill p
ose
haza
rd t
o si
dew
alk
user
s
Tend
ency
to
be
over
laid
N
eed
to b
e tr
affic
be
arin
g
Less
impa
ct t
o pa
vem
ent
mai
nten
ance
Gut
ter
shou
ld b
e tr
affic
be
arin
g
Leas
t im
pact
to
pave
men
t m
aint
enan
ce
Gra
tings
sho
uld
be
traf
fic b
earin
g
Eval
uat
ion
N
OT
RECO
MM
END
ED
NO
T RE
COM
MEN
DED
N
OT
RECO
MM
END
ED
1ST
RECO
MM
END
ED
2ND
REC
OM
MEN
DED

14-1
CHAPTER 14
BRIDGE DESIGN
14.1 STRUCTURAL ANALYSIS MODELS Structural analysis, including multimode analysis for seismic response, is obtained
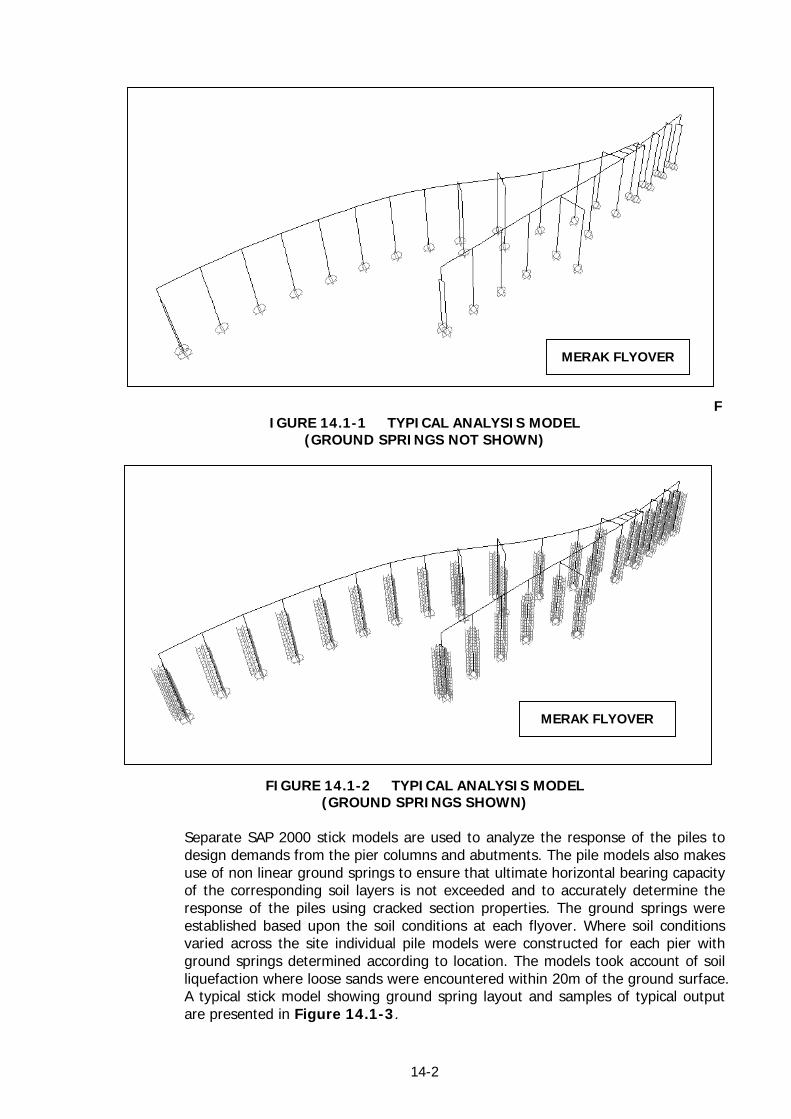
from SAP 2000 stick models constructed for each flyover. The stick model of each flyover is a full 3D model of the flyover structure; with
vertical and horizontal alignment assured from importing the final 3D CAD model of the structure into the software. The deck elements are located at the centroid of the permanent load (including superimposed load). A typical stick model is presented in Figure 14.1-1 and Figure 14.1-2.
The loads as defined in Section 7.3 were applied to each analysis model. Live loads were applied to maximize the response in the substructure. Moving loads were applied in corresponding lanes to model truck and KEL loading. Uniformly distributed loads were applied both span by span and on two adjacent spans at a time to model the lane loading. Traffic loads were applied eccentrically (one or two design traffic lanes loaded on one side of the deck) in order to generate transverse bending in the deck frames supported by single columns.
The model of each flyover takes account of soil structure support with non linear ground springs. The ground springs were determined separately for each flyover based upon the encountered soil conditions. Non-linear analysis was used to establish structure stiffness under earthquake load in each design direction for all the flyovers. Multimode analysis in each design direction is based on this non-linear soil-structure stiffness. The response spectrum used in the analysis was determined based on the seismic zone and soil conditions at each flyover in accordance with the design criteria given in Section 7.3.
The multimode analysis was undertaken for a minimum number of modes based on the number of spans such that al least 3 modes per span were analyzed. Given that expansion piers feature in all flyovers, two alternative models were analyzed to determine the worst case:
1. “Expansion Case” : Frames analyzed without longitudinal connection at the
expansion piers (frames restrained only for vertical and transverse displacements and deck torsion - frames free to rotate about y and z axes and translate along x axis)
2. “Compression Case” : Frames analyzed assuming longitudinal pinned
connection at the expansion piers (frames restrained for vertical, longitudinal and transverse displacements and deck torsion – frames fee to rotate about y and z axes)
Given the curved horizontal alignment of the most of the flyover structures at least three (3) coordinate systems were set up to analyze earthquake effects for both the expansion case and the compression case. Non linear soil springs for the pile determined based on JRA recommendations.
14-2
FIGURE 14.1-1 TYPICAL ANALYSIS MODEL
(GROUND SPRINGS NOT SHOWN)
FIGURE 14.1-2 TYPICAL ANALYSIS MODEL
(GROUND SPRINGS SHOWN)
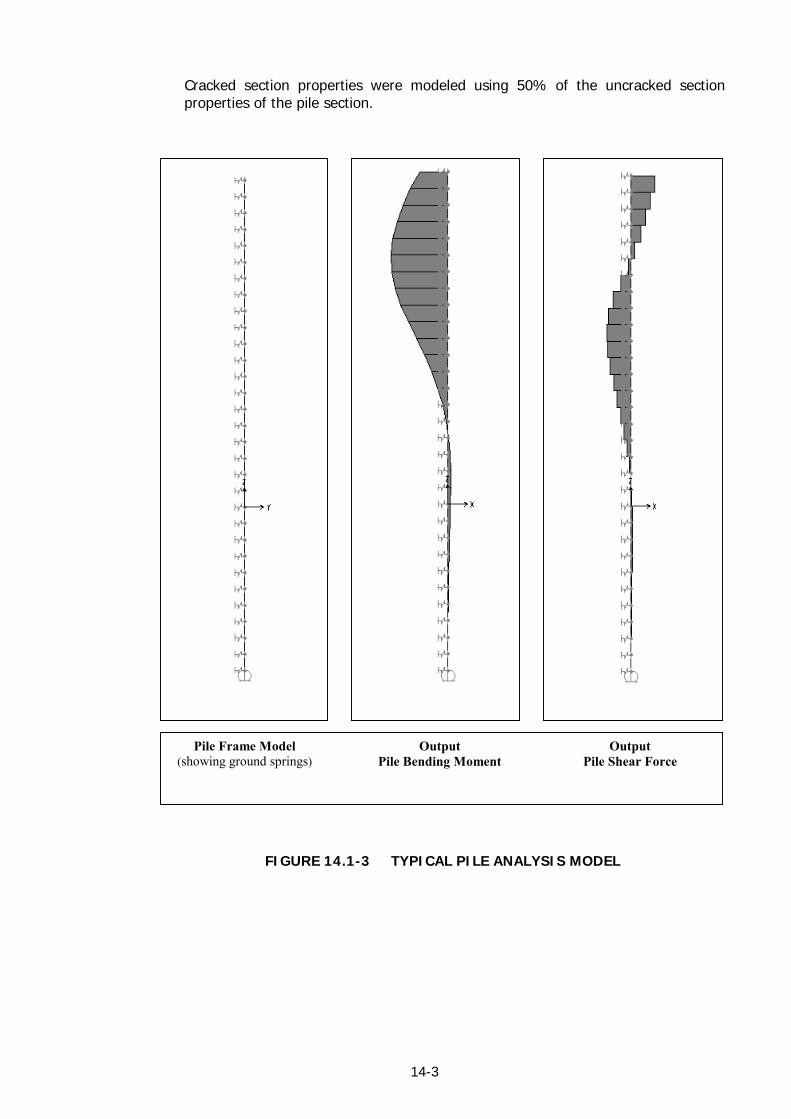
Separate SAP 2000 stick models are used to analyze the response of the piles to design demands from the pier columns and abutments. The pile models also makes use of non linear ground springs to ensure that ultimate horizontal bearing capacity of the corresponding soil layers is not exceeded and to accurately determine the response of the piles using cracked section properties. The ground springs were established based upon the soil conditions at each flyover. Where soil conditions varied across the site individual pile models were constructed for each pier with ground springs determined according to location. The models took account of soil liquefaction where loose sands were encountered within 20m of the ground surface. A typical stick model showing ground spring layout and samples of typical output are presented in Figure 14.1-3.
MERAK FLYOVER MERAK FLYOVER
MERAK FLYOVER
MERAK FLYOVER
14-3
Cracked section properties were modeled using 50% of the uncracked section properties of the pile section.
FIGURE 14.1-3 TYPICAL PILE ANALYSIS MODEL
Pile Frame Model (showing ground springs)
Output Pile Bending Moment
Output Pile Shear Force
14-4
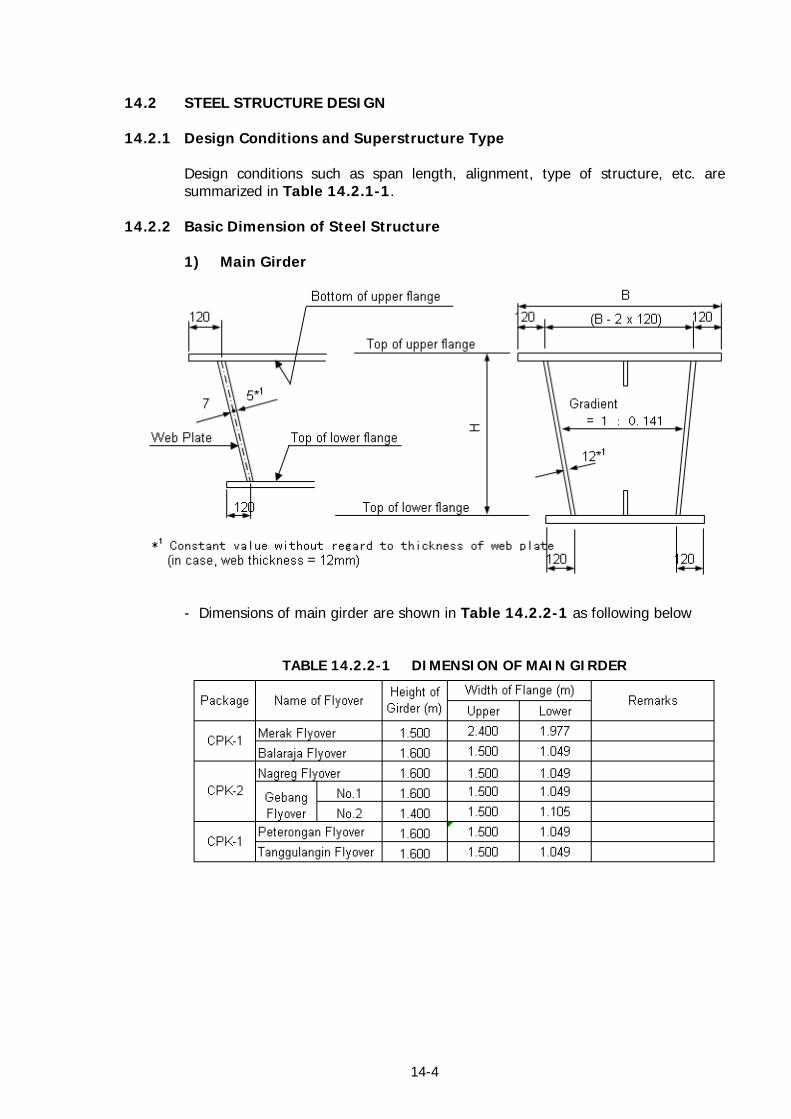
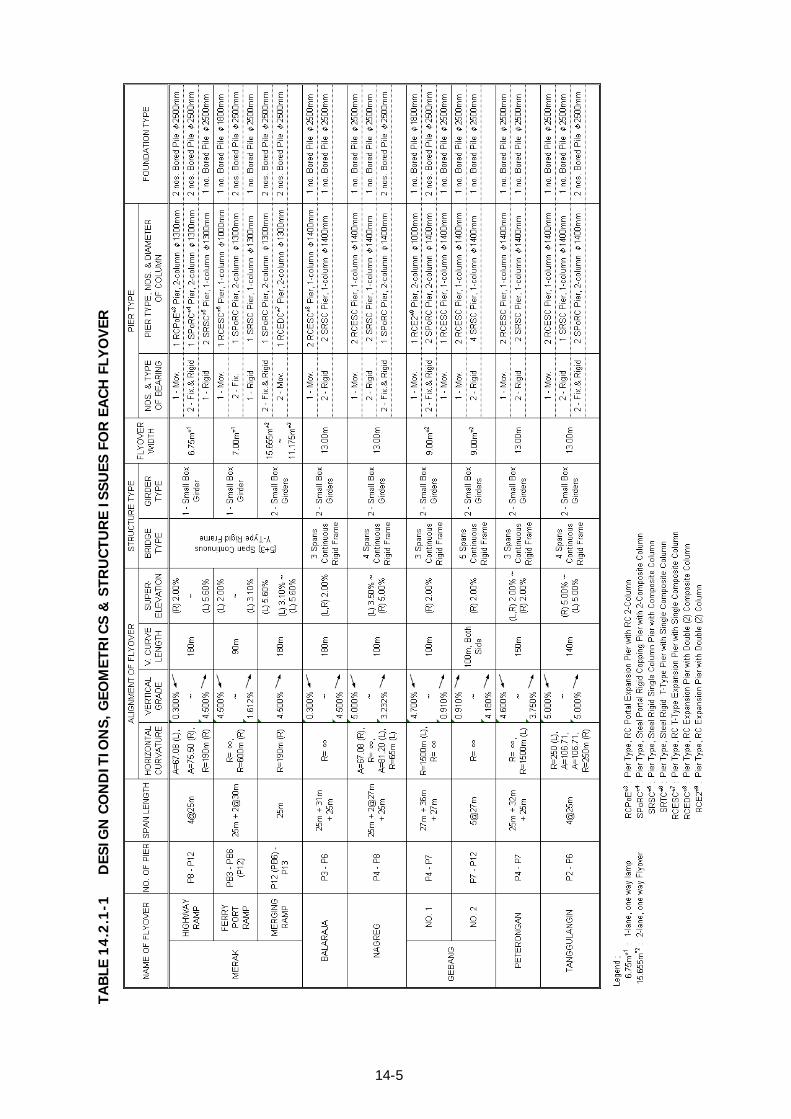
14.2 STEEL STRUCTURE DESIGN 14.2.1 Design Conditions and Superstructure Type
Design conditions such as span length, alignment, type of structure, etc. are summarized in Table 14.2.1-1.
14.2.2 Basic Dimension of Steel Structure 1) Main Girder
- Dimensions of main girder are shown in Table 14.2.2-1 as following below
TABLE 14.2.2-1 DIMENSION OF MAIN GIRDER
14-5
TA
BLE
14
.2.1
-1
DES
IGN
CO
ND
ITIO
NS,
GEO
MET
RIC
S &
STR
UC
TUR
E IS
SUES
FO
R E
AC
H F
LYO
VER
14-6
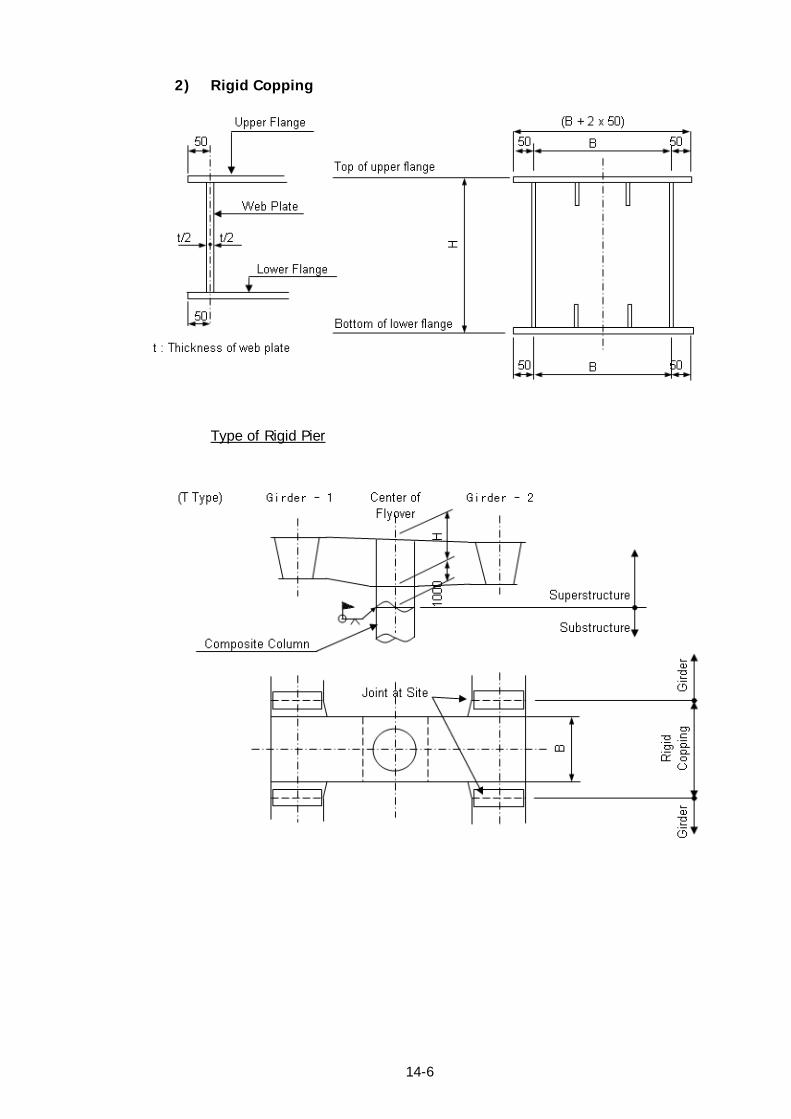
2) Rigid Copping
Type of Rigid Pier
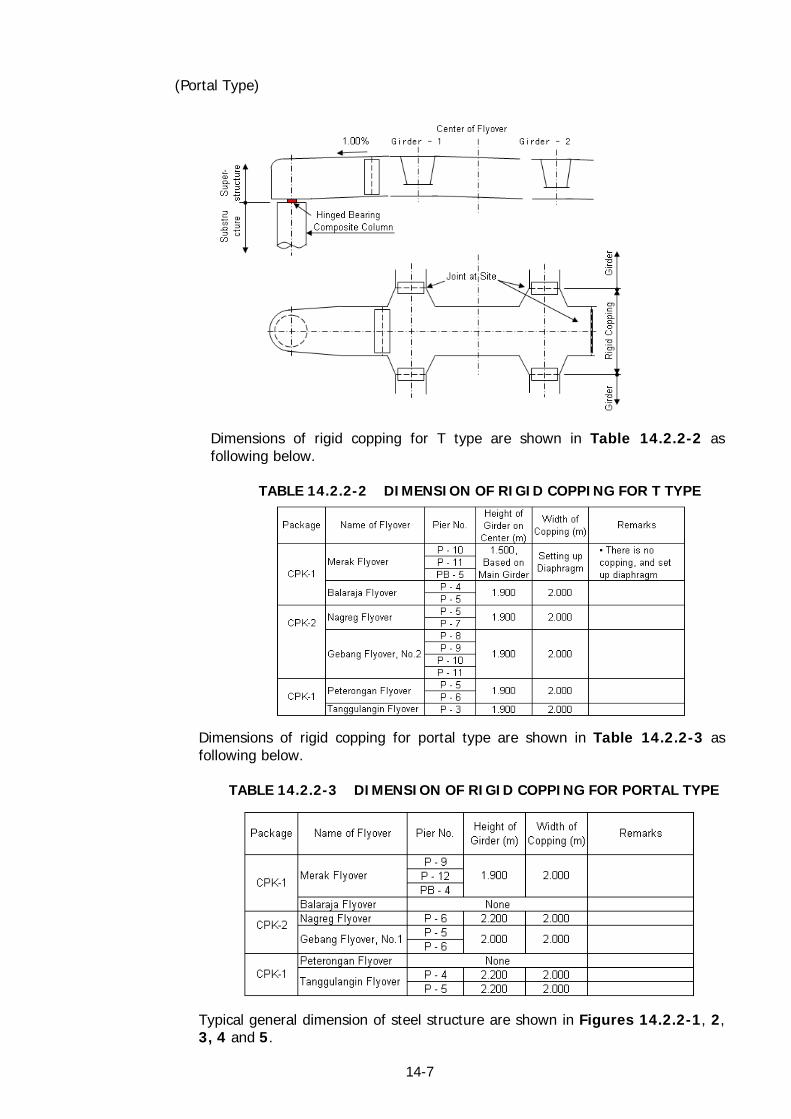
14-7
(Portal Type)
Dimensions of rigid copping for T type are shown in Table 14.2.2-2 as following below.
TABLE 14.2.2-2 DIMENSION OF RIGID COPPING FOR T TYPE
Dimensions of rigid copping for portal type are shown in Table 14.2.2-3 as following below.
TABLE 14.2.2-3 DIMENSION OF RIGID COPPING FOR PORTAL TYPE
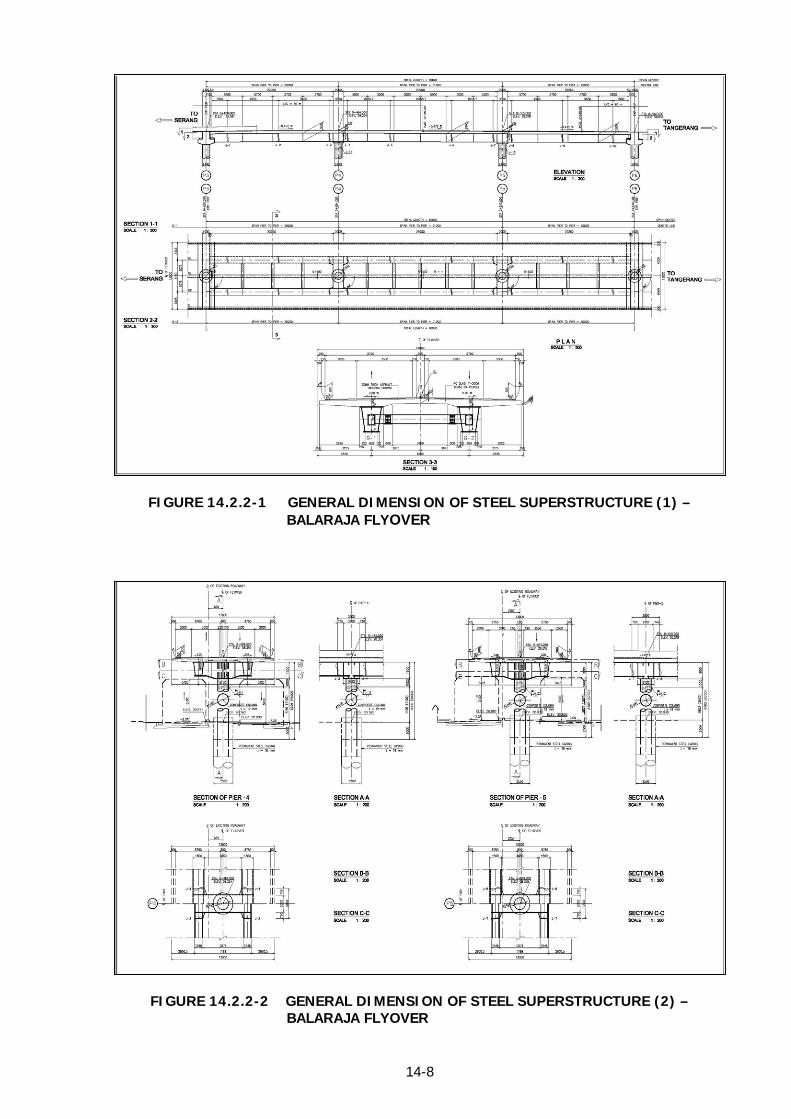
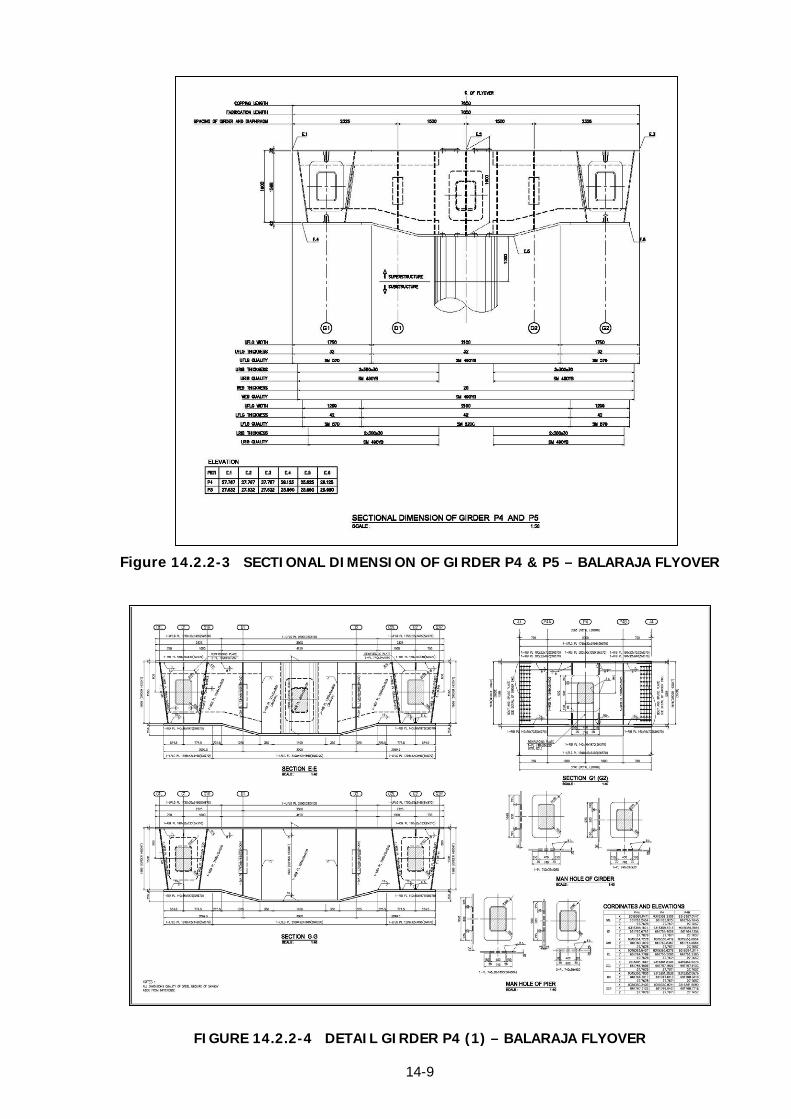
Typical general dimension of steel structure are shown in Figures 14.2.2-1, 2, 3, 4 and 5.
14-8
FIGURE 14.2.2-1 GENERAL DIMENSION OF STEEL SUPERSTRUCTURE (1) –
BALARAJA FLYOVER
FIGURE 14.2.2-2 GENERAL DIMENSION OF STEEL SUPERSTRUCTURE (2) –
BALARAJA FLYOVER
14-9
Figure 14.2.2-3 SECTIONAL DIMENSION OF GIRDER P4 & P5 – BALARAJA FLYOVER
FIGURE 14.2.2-4 DETAIL GIRDER P4 (1) – BALARAJA FLYOVER

14-10
FIGURE 14.2.2-5 PIER LAYOUT P6 (PORTAL) – NAGREG FLYOVER
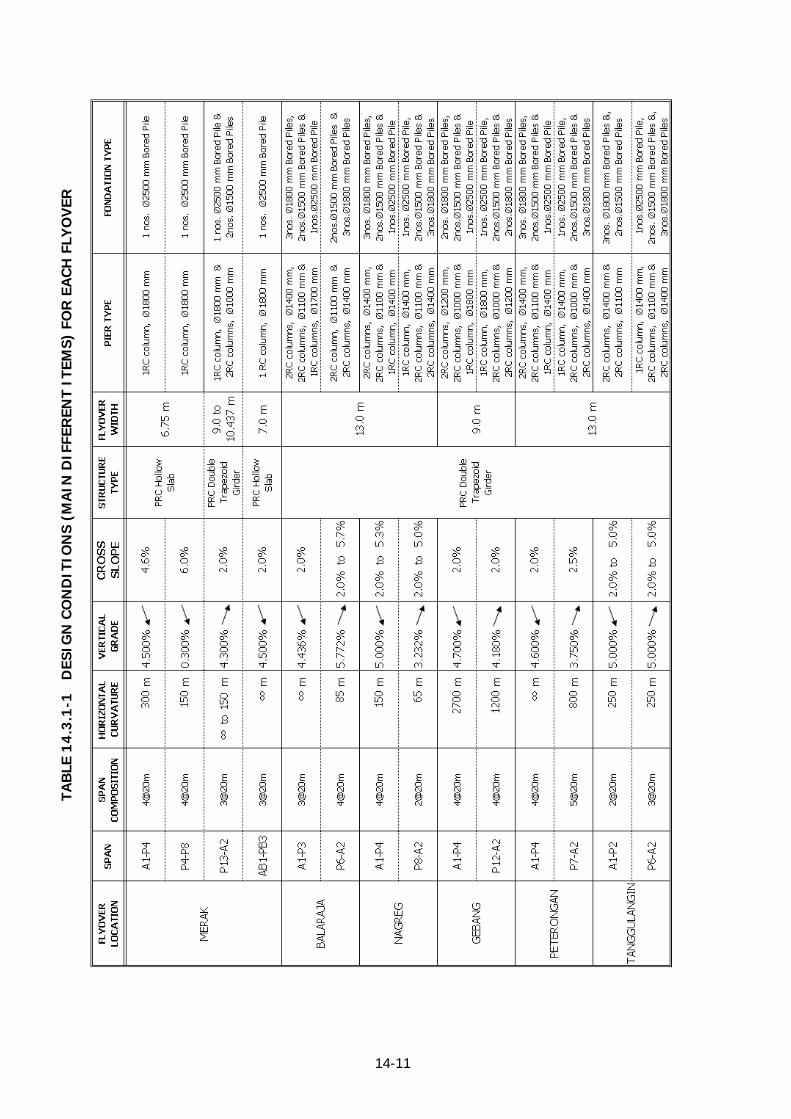
14.3 PC STRUCTURE DESIGN 14.3.1 Design Conditions and Superstructure Type
Design conditions such as span length, alignment, type of structure, etc. are summarized in Table 14.3.1-1.
14.3.2 PC Superstructure Design
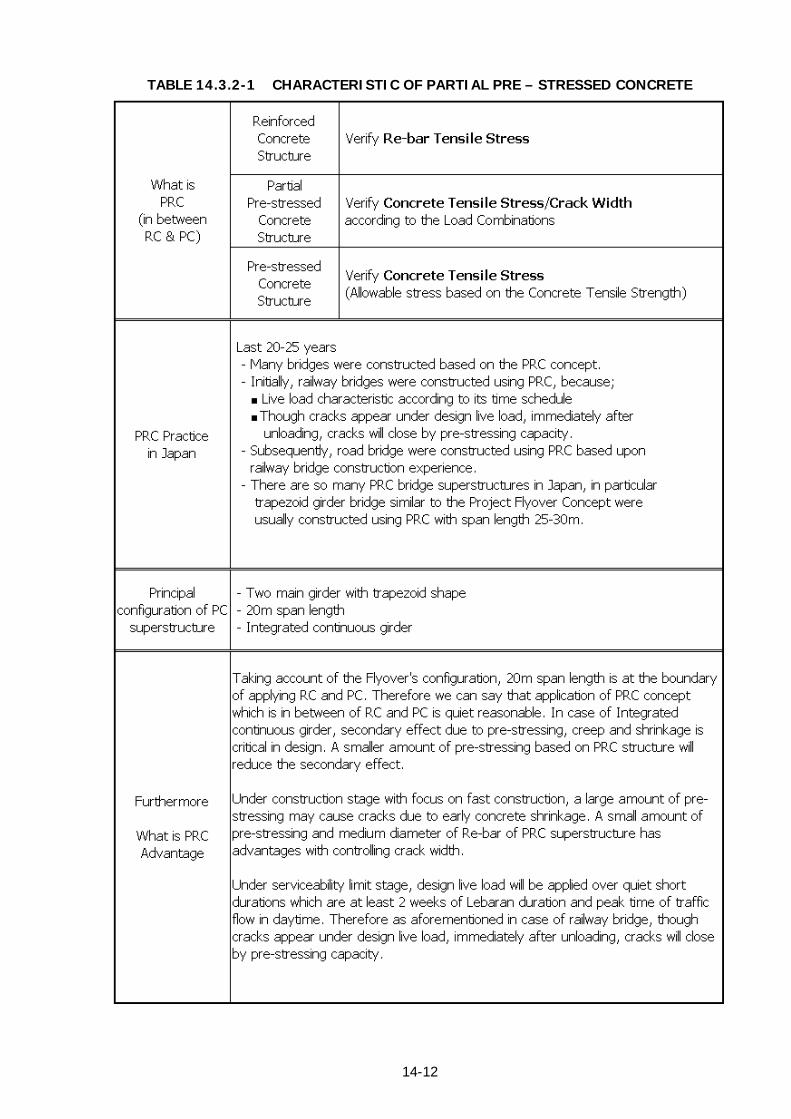
PC Superstructure was designed as a partial pre – stressed concrete (PRC) of which characteristics are presented in Table 14.3.2-1.
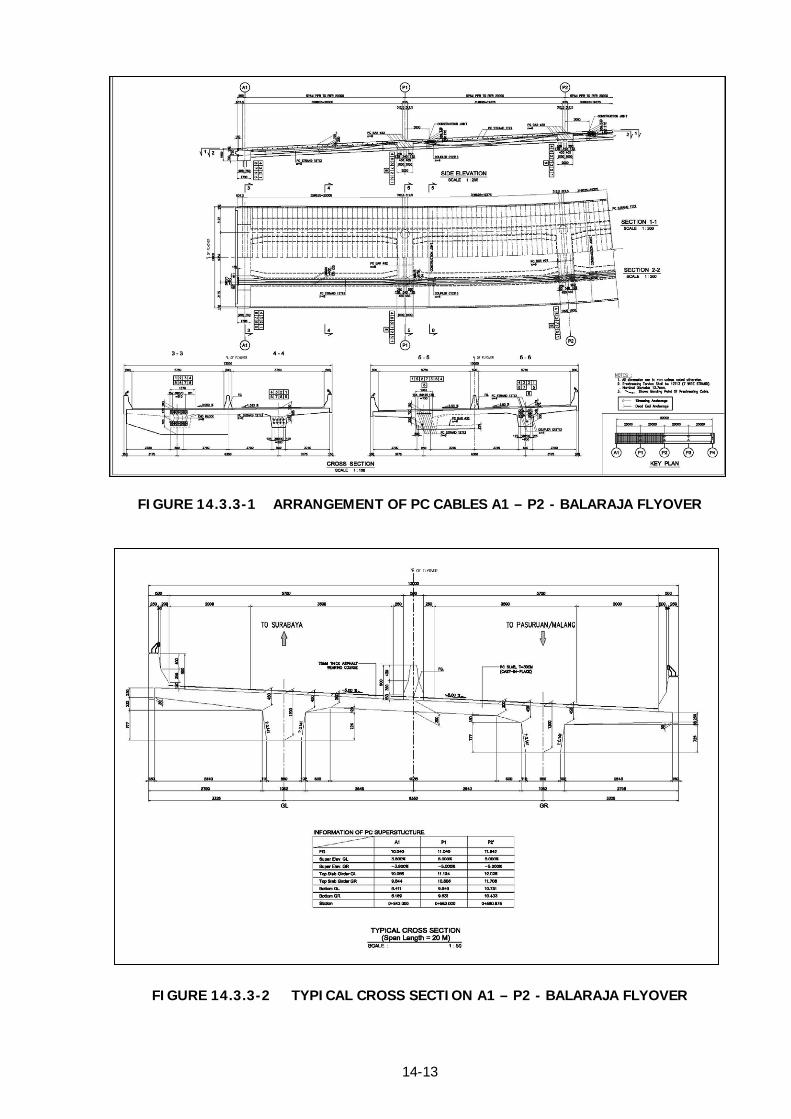
14.3.3 Detailed Design Results
Typical arrangement of PC cables, typical cross section and typical pier layout is shown in Figure 14.3.3-1, 2, 3 respectively.
14-11
TAB
LE 1
4.3
.1-1
D
ESIG
N C
ON
DIT
ION
S (M
AIN
DIF
FER
ENT
ITEM
S) F
OR
EA
CH
FLY
OV
ER
14-12
TABLE 14.3.2-1 CHARACTERISTIC OF PARTIAL PRE – STRESSED CONCRETE
14-13
FIGURE 14.3.3-1 ARRANGEMENT OF PC CABLES A1 – P2 - BALARAJA FLYOVER
FIGURE 14.3.3-2 TYPICAL CROSS SECTION A1 – P2 - BALARAJA FLYOVER

14-14
FIGURE 14.3.3-3 TYPICAL PIER LAYOUT P1, P2 (FIXED) – BALARAJA FLYOVER
14.4 SUBSTRUCTURE AND FOUNDATION DESIGN 14.4.1 Substructure Design
1) General
The detailed design of the substructure was made based on the basic design concept as follows: • Piers and abutments integral with the superstructure • Both single circular column and twin circular column piers adopted in the
design. • Both reinforced concrete and composite columns adopted. • Single large diameter bored pile foundations. • MSE retaining walls on approaches returned behind the integral abutments,
unless soft soil precludes use. • EPS (expanded polystyrene) used for embankments at soft soil sites.
The integral structure configuration is not a traditional method of construction in Indonesia. Traditional bridge design makes use of expansion joints and bearings to accommodate superstructure movements at each pier. However, leaking expansion joints and failures in bearings are major bridge maintenance issues. Integral bridge superstructures are constructed to work monolithically with the piers and abutments, negating the need for expansion joints and

14-15
bearings other than at expansion piers. Movements due to creep, shrinkage and temperature changes are accommodated by using flexible pile foundations.
In addition to reduced maintenance costs, other advantages of this type of bridge include improved structural integrity, reliability and redundancy, essential for bridges in high seismic zones, improved long term serviceability, improved rising surface, reduced initial cost, and improved aesthetics. Given that all the structural components of integral bridges contribute to the response of the structure under applied load, the design process involves a cyclical process of initial design and design optimization as shown in Figure 14.4.1-1.

14-16
FIGURE 14.4.1-1 DESIGN OF SUBSTRUCTURE INTEGRAL WITH SUPERSTRUCTURE
ESTABLISH DESIGN CRITERIA
BASIC
ESTABLISH SEISMIC ZONE, ACCELERATION COEFFICIENT & RESPONSE MODIFICATION FACTORS
ESTABLISH PERMANENT AND TRANSIENT LOADS
CONSTRUCT 3D ANALYSIS MODEL OF ENTIRE STRUCTURE AND PERFORM DETAILED BRIDGE ANALYSIS
(USE BOTH EXPANSION AND COMPRESSION MODELS TO ACCOUNT FOR EXPANSION PIERS)
YESIS BRIDGE ADEQUATE?
DESIGN COMPLETE
NO
DESIGN PIERS AND ABUTMENTS
Flexural Demand − EQ Forces/ R − Transient Load Effects − ULS Design − SLS Check
Shear Demand − EQ Forces/ R (=1) − Plastic Hinging Forces − ULS Design
RESIZE COMPONENTS
DESIGN PILES AND DECK CONNECTIONS
DETERMINE DESIGN FORCES AND DESIGN DISPLACEMENTS
14-17
2) Loads and Load Combinations
Both ultimate limit state and serviceability limit state combinations were included in the design in accordance with the project design criteria. The following load combinations were determined to be critical: a) Ultimate Limit State
Combination 1: Full Live Load
Dead Load x 1.3 + Superimposed Dead Load x 2.0 + Full Traffic Load x 1.8 + Full Braking or Centrifugal Load x 1.8 + Pedestrian Load x 1.8 + Temperature Effects x 1.0 Combination 1: Half Live Load (occupying traffic lanes on one side of deck only)
Dead Load x 1.3 + Superimposed Dead Load x 2.0 + Half Traffic Load x 1.8 + Half Braking or Centrifugal Load x 1.8 + Pedestrian Load x 1.8 + Temperature Effects x 1.0 Combination 5: Longitudinal Effects of Earthquake + 30% of Transverse Effects of Earthquake
Dead Load x 1.0 + Superimposed Dead Load x 1.0 + EQX x 1.0 + EQY x 0.3 Combination 5: 30% of Longitudinal Effects of Earthquake + Transverse Effects of Earthquake
Dead Load x 1.0 + Superimposed Dead Load x 1.0 + EQX x 0.3 + EQY x 1.0
b) Serviceability Limit State
Combination 1: Traffic Load Only
Dead Load x 1.0 + Superimposed Dead Load x 1.0 + Differential Settlement x 1.0 + Full Traffic Load x 1.0 + Pedestrian Load x 1.0 Combination 1: Full Live Load
Dead Load x 1.0 + Superimposed Dead Load x 1.0 + Differential Settlement x 1.0 + Full Traffic Load x 1.0 + Full Braking or Centrifugal Load x 1.0 + Pedestrian Load x 1.0 + Temperature Effects x 0.7 Combination 1: Half Traffic Load Only (occupying traffic lanes on one side of deck only)
Dead Load x 1.0 + Superimposed Dead Load x 1.0 + Differential Settlement x 1.0 + Half Traffic Load x 1.0 + Pedestrian Load x 1.0 Combination 1: Half Live Load (occupying 2 lanes on one side only)
Dead Load x 1.0 + Superimposed Dead Load x 1.0 + Differential Settlement x 1.0 + Half Traffic Load x 1.0 + Half Braking or Centrifugal Load x 1.0 + Pedestrian Load x 1.0 + Temperature Effects x 0.7
14-18
Collision Load Combination: (1000kN Vehicle Impact Load)
Dead Load x 1.0 + Superimposed Dead Load x 1.0 + Collision Load x 1.0
The separate combinations at serviceability limit state for (i) traffic load only and (ii) full live load are required to investigate allowable overstress as follows: a) Nil (i.e 100% allowable tensile stress) for traffic load only case b) 40% (i.e 140% allowable tensile stress) for full live load case Differential settlement is not required to be investigated at ultimate limit state. The approaches feature MSE walls that will be returned behind the abutment structure, thereby directly supporting the loads from earth pressure in the fill. The abutments will therefore be protected from the effects of earth pressure and earth pressure forces are not included in the load combinations.
3) Design of Reinforced Concrete Columns
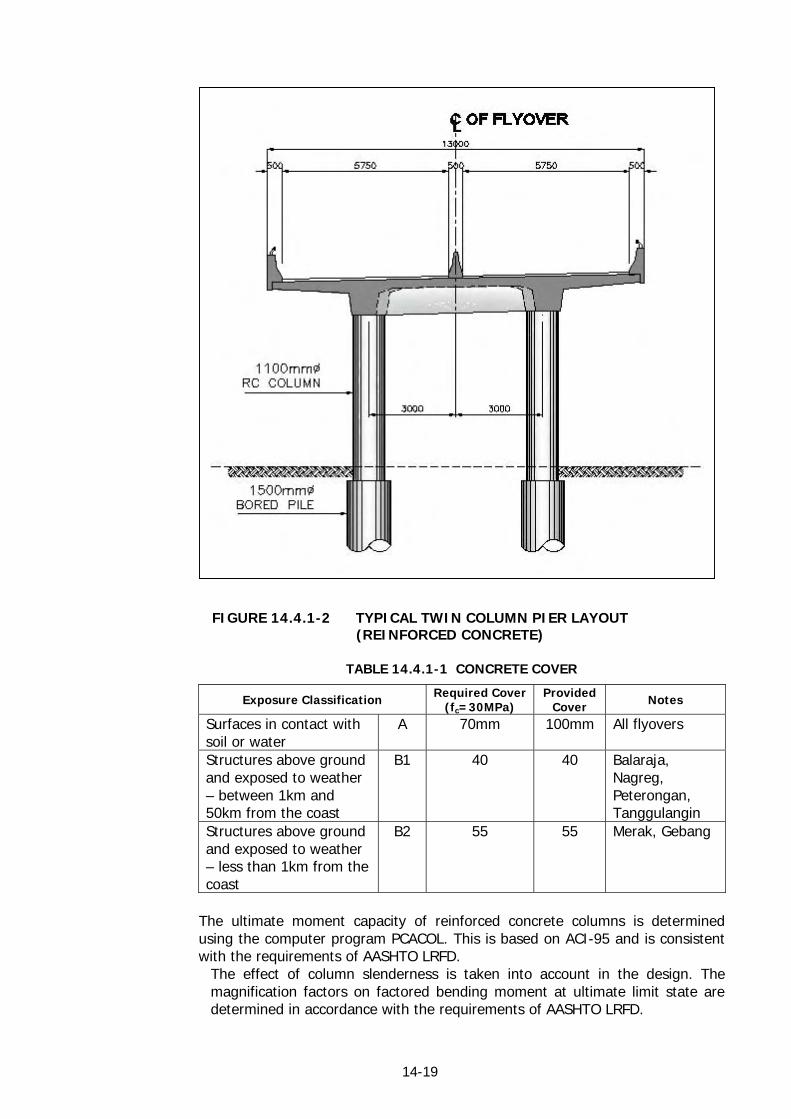
Reinforced concrete twin column piers support the PC deck frames of each flyover and are monolithic with the concrete superstructure. The columns of each pier are located beneath the spine girders of the deck providing a direct load path for demand carried across the integral connection. Reinforced concrete columns are also used at expansion piers where the design demand is too large for the use of composite columns. Typically each column of a twin column pier is supported on a single 1500mm diameter bored pile. A typical twin column reinforced concrete pier structure is shown in Figure 14.4.1-2. The pier columns are circular in cross-section with spiral transverse reinforcement detailed throughout. The characteristic concrete strength, fc, is 30Mpa based on standard cylinder tests at 28 days. The yield strength of the deformed bar reinforcement is 390MPa. Concrete cover is in accordance with Indonesian Standards as presented in Table 14.4.1-1. The transverse spiral reinforcement is detailed to facilitate the development of plastic hinges in accordance with the requirements of the design criteria. The advantages of twin column piers are that the structural arrangement is inherently stable under transverse loads and the integral configuration maximizes the ductile response of the structure under earthquake forces. The Indonesian Design Standard of Earthquake Resistance for Bridges allows the use of a Response Modification Factor R=5 in both directions of a multiple column pier. This substantially reduces design demand from the elastic forces determined from the multi-mode analysis.
14-19
FIGURE 14.4.1-2 TYPICAL TWIN COLUMN PIER LAYOUT
(REINFORCED CONCRETE)
TABLE 14.4.1-1 CONCRETE COVER
Exposure Classification Required Cover (fc=30MPa)
Provided Cover Notes
Surfaces in contact with soil or water
A 70mm 100mm All flyovers
Structures above ground and exposed to weather – between 1km and 50km from the coast
B1 40 40 Balaraja, Nagreg, Peterongan, Tanggulangin
Structures above ground and exposed to weather – less than 1km from the coast
B2 55 55 Merak, Gebang
The ultimate moment capacity of reinforced concrete columns is determined using the computer program PCACOL. This is based on ACI-95 and is consistent with the requirements of AASHTO LRFD.
The effect of column slenderness is taken into account in the design. The magnification factors on factored bending moment at ultimate limit state are determined in accordance with the requirements of AASHTO LRFD.
14-20
The design moment, MD, for a circular column under biaxial flexure is determined as follows:
22 MuyMuxMD +=
where:
Mux = factored applied moment about the X-axis Muy = factored applied moment about the Y-axis
Note that AASHTO LRFD requires a separate check on capacities in each principal direction for non-circular columns only For the serviceability checks on reinforced concrete columns the following two (2) cases have been considered:
a) Analysis of section under full load, including braking and centrifugal forces and temperature effects, with an allowable overstress of 40% i.e. 140% allowable stress limit
b) Analysis of section under vertical live load and pedestrian loads only, with an allowable overstress of nil i.e. 100% allowable stress limit.
4) Design of Composite Columns
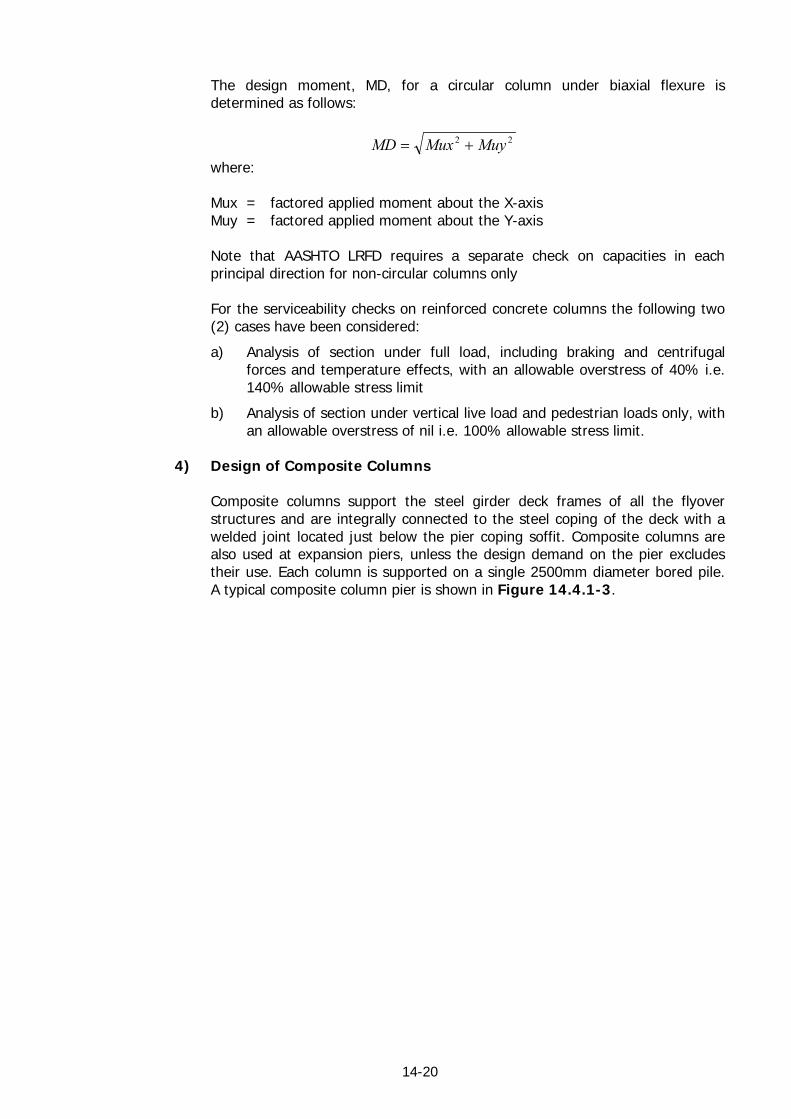
Composite columns support the steel girder deck frames of all the flyover structures and are integrally connected to the steel coping of the deck with a welded joint located just below the pier coping soffit. Composite columns are also used at expansion piers, unless the design demand on the pier excludes their use. Each column is supported on a single 2500mm diameter bored pile. A typical composite column pier is shown in Figure 14.4.1-3.
14-21
FIGURE 14.4.1-3 TYPICAL SINGLE COLUMN PIER LAYOUT (COMPOSITE COLUMN)
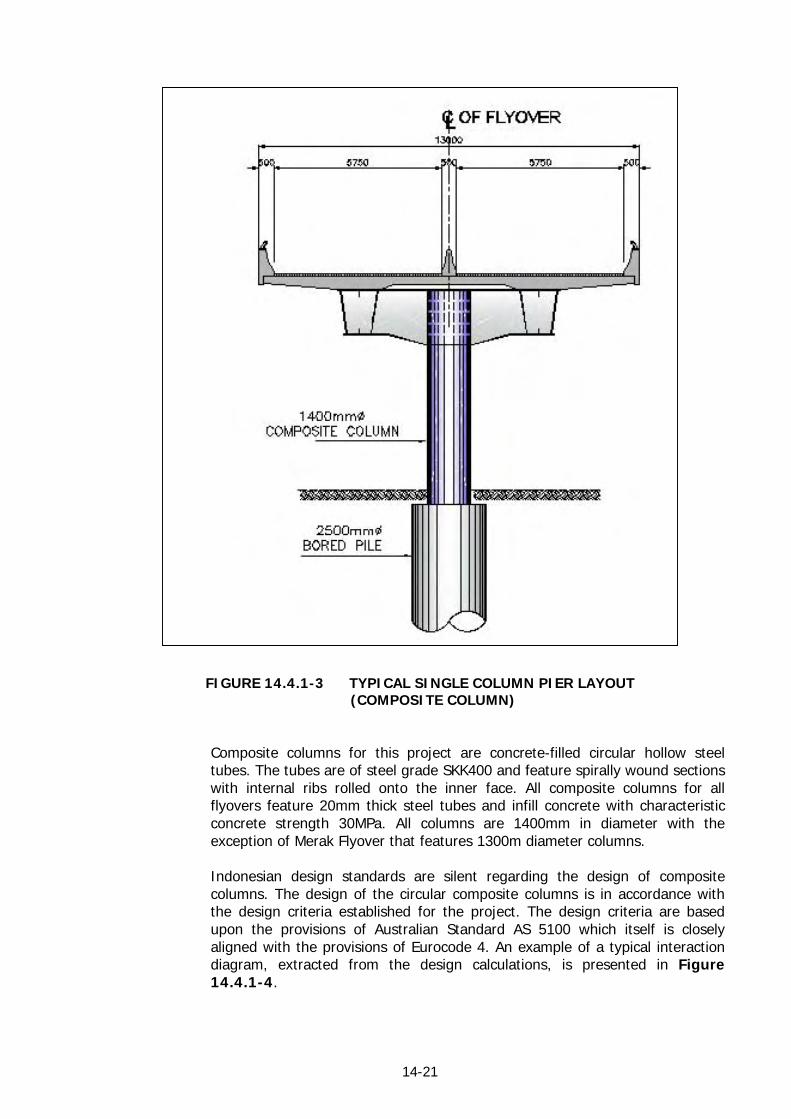
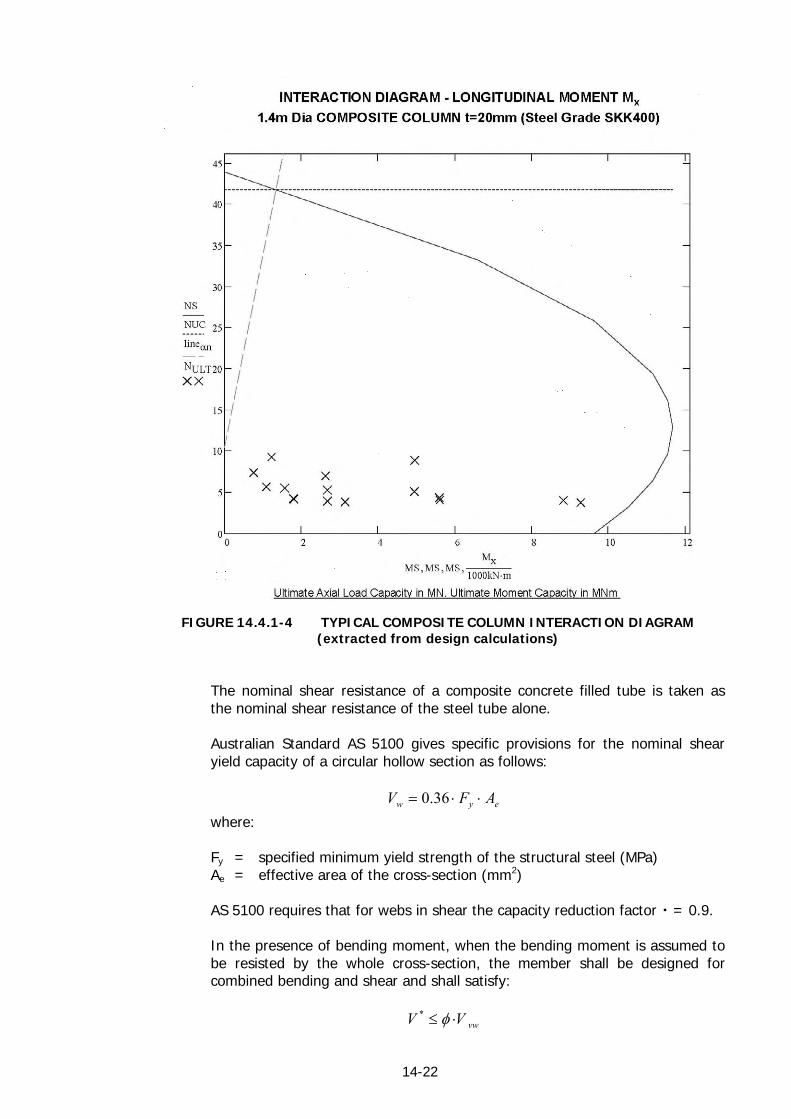
Composite columns for this project are concrete-filled circular hollow steel tubes. The tubes are of steel grade SKK400 and feature spirally wound sections with internal ribs rolled onto the inner face. All composite columns for all flyovers feature 20mm thick steel tubes and infill concrete with characteristic concrete strength 30MPa. All columns are 1400mm in diameter with the exception of Merak Flyover that features 1300m diameter columns. Indonesian design standards are silent regarding the design of composite columns. The design of the circular composite columns is in accordance with the design criteria established for the project. The design criteria are based upon the provisions of Australian Standard AS 5100 which itself is closely aligned with the provisions of Eurocode 4. An example of a typical interaction diagram, extracted from the design calculations, is presented in Figure 14.4.1-4.
14-22
FIGURE 14.4.1-4 TYPICAL COMPOSITE COLUMN INTERACTION DIAGRAM
(extracted from design calculations)
The nominal shear resistance of a composite concrete filled tube is taken as the nominal shear resistance of the steel tube alone. Australian Standard AS 5100 gives specific provisions for the nominal shear yield capacity of a circular hollow section as follows:
eyw AFV ⋅⋅= 36.0
where:
Fy = specified minimum yield strength of the structural steel (MPa) Ae = effective area of the cross-section (mm2)
AS 5100 requires that for webs in shear the capacity reduction factor = 0.9.・ In the presence of bending moment, when the bending moment is assumed to be resisted by the whole cross-section, the member shall be designed for combined bending and shear and shall satisfy:
vwVV ⋅≤ φ*
14-23
where:
⋅−⋅=
swvw M
MVV*6.12.2
V* = Design shear force at the section Vvw = Nominal shear capacity of a web in the presence of bending moment M* = Design bending moment Ms = Nominal section moment capacity
In the extreme the design bending moment M* = Ms. and taking = 0.9 (th・ ・ e maximum strength reduction factor for the steel component used in the moment capacity design of composite columns) gives the following:
[ ] wws
swvw VV
MMVV ⋅=×−⋅=
⋅−⋅= 76.09.06.12.26.12.2 φ
The member shall therefore be designed to satisfy the following:
eyw AFVV ⋅⋅=⋅⋅≤ 24.076.0* φ
For the serviceability checks on composite concrete columns the following two (2) cases have been considered:
a) Analysis of section under full load, including braking and centrifugal forces and temperature effects, with an allowable overstress of 40% i.e. 140% allowable stress limit
b) Analysis of section under vertical live load and pedestrian loads only, with an allowable overstress of nil i.e.
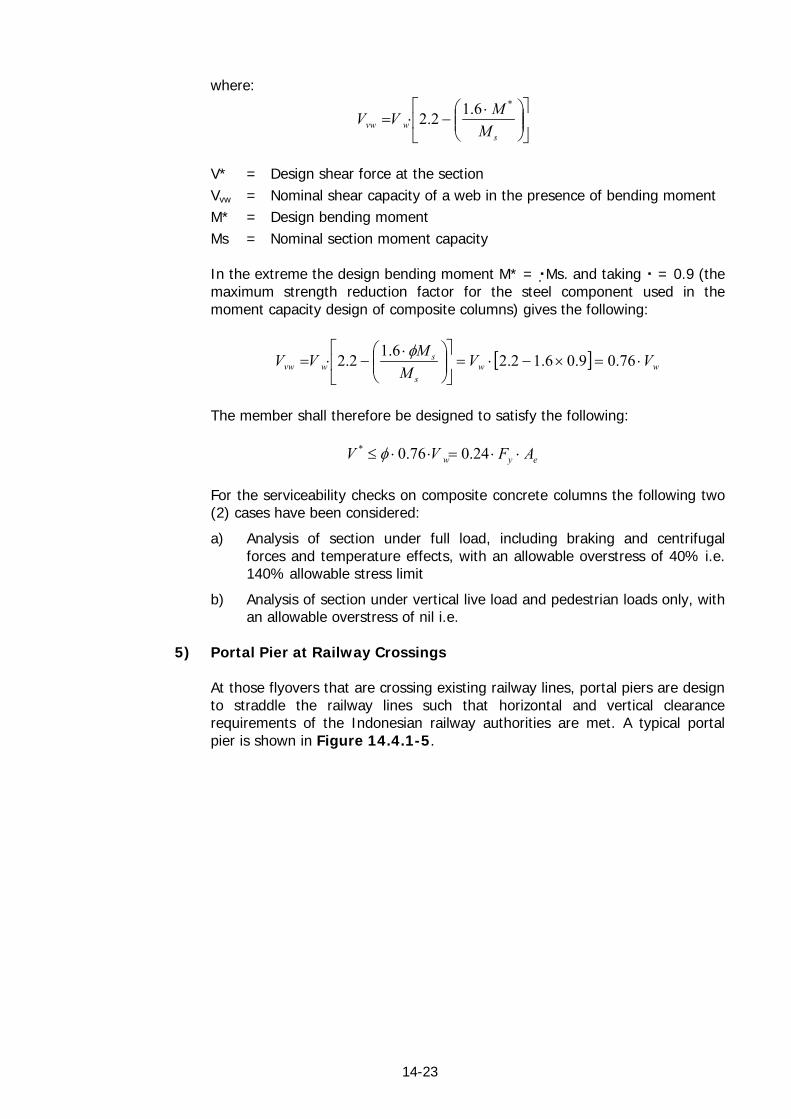
5) Portal Pier at Railway Crossings
At those flyovers that are crossing existing railway lines, portal piers are design to straddle the railway lines such that horizontal and vertical clearance requirements of the Indonesian railway authorities are met. A typical portal pier is shown in Figure 14.4.1-5.
14-24
The requirements of the railway authorities are:
a) The minimum clearance to be provided shall be 10m from the face of the pier to the nearest rail of the railway track
b) The top of the foundation shall be a distance not less than 2.0m to the top of the railway track or 1.5m from the existing ground, whichever is greater.
The portal piers comprise 1.4m diameter composite columns supported on 2.5m diameter bored piles. The columns support a steel coping beam on mechanical bearings. The steel coping beam is integral with the steel girder of the deck. A bearing support was selected for the portal piers in order to minimize demand on the portal from plastic hinging effects in the columns.
6) Abutment Design
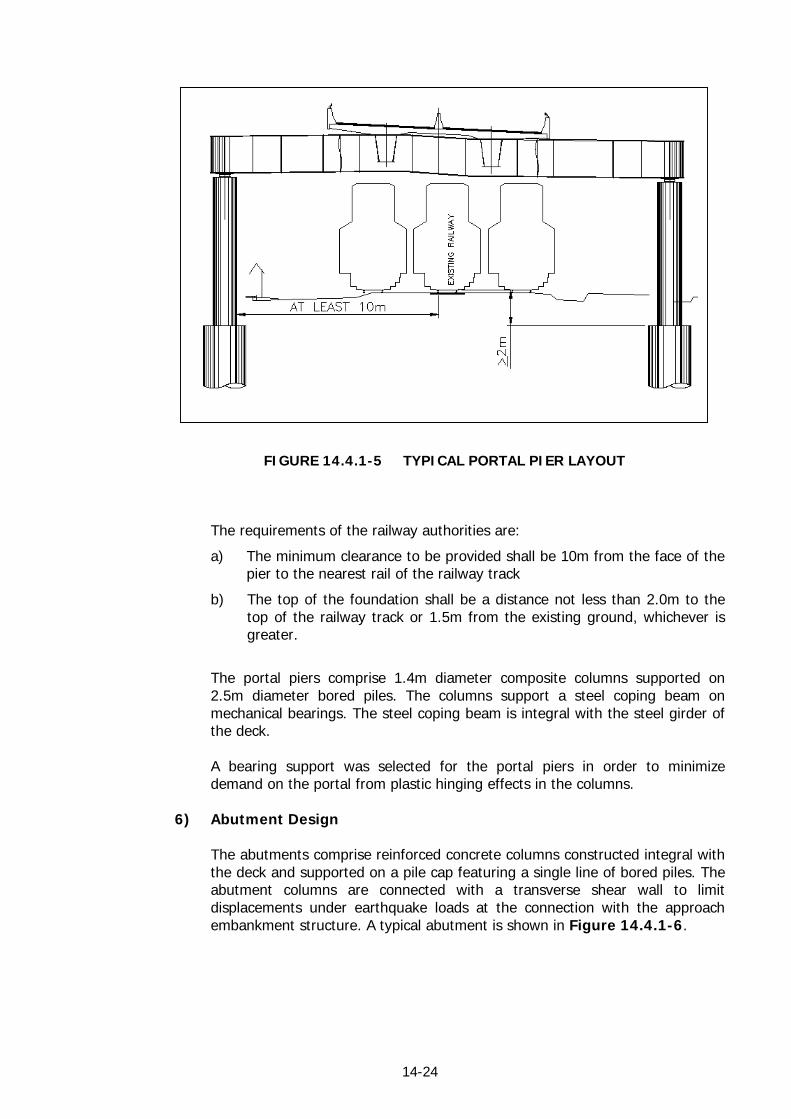
The abutments comprise reinforced concrete columns constructed integral with the deck and supported on a pile cap featuring a single line of bored piles. The abutment columns are connected with a transverse shear wall to limit displacements under earthquake loads at the connection with the approach embankment structure. A typical abutment is shown in Figure 14.4.1-6.
FIGURE 14.4.1-5 TYPICAL PORTAL PIER LAYOUT
14-25
FIGURE 14.4.1-6 TYPICAL ABUTMENT LAYOUT
Advantages of integral abutments are:
a) No expansion joints and bearings leading to savings in maintenance costs and improved ride quality.
b) Abutment framed into deck structure resulting in greater ductility in resisting earthquake forces
c) Improved load sharing resulting in smaller pier column sizes.
d) Smaller pile cap size
Design issues are:
a) Plastic hinging effects must be carried by both the deck connection and at the pile cap.
b) Secondary effects such as creep and shrinkage, temperature change and differential settlement should be considered in the design.
c) Limited capacity to support earth fill pressures. Taller structures must be protected from the effects of earth fill if the deck is not acting as a strut between the abutments.
d) Bending moments from traffic loads are not balanced by a continuing span. The stresses in the reinforcement at the serviceability limit state are therefore a critical design issue.
14-26
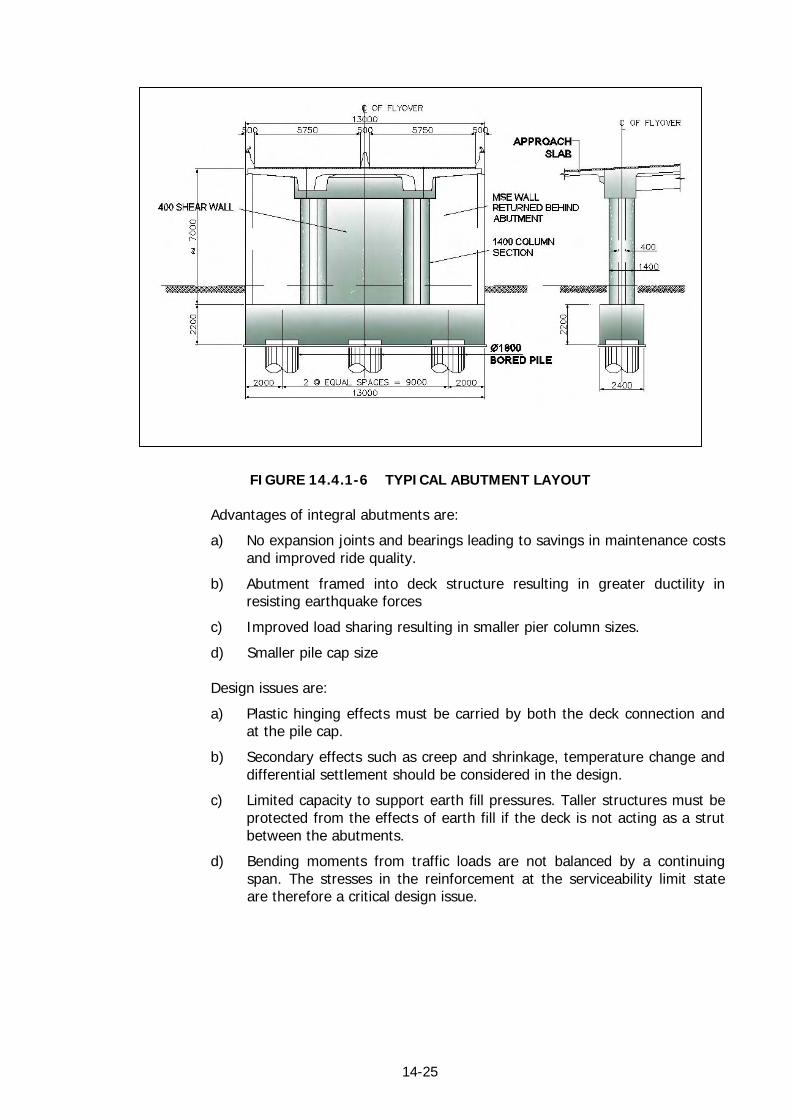
7) Expansion Pier Coping All of the flyovers feature at least two expansion piers, located at the transition from the PC deck frames to the steel deck frames. The expansion piers support the deck spans with both elastomeric type bearings, for the concrete decks, and mechanical type bearings, for the steel decks. A typical section at an expansion pier is shown in Figure 14.4.1-7. The design of the pier coping at the expansion pier took account of the design demands both at the erection stage and in the permanent condition. The pier coping must be constructed in stages, as shown in Figure 14.4.1-7, in order to accommodate the jacks for the prestressing of the concrete decks spans. This erection stage requires the provision of additional reinforcement at the level of the bearing shelf in order to support the deck following the prestressing operations.
FIGURE 14.4.1-7 EXPANSION PIER COPING SECTION
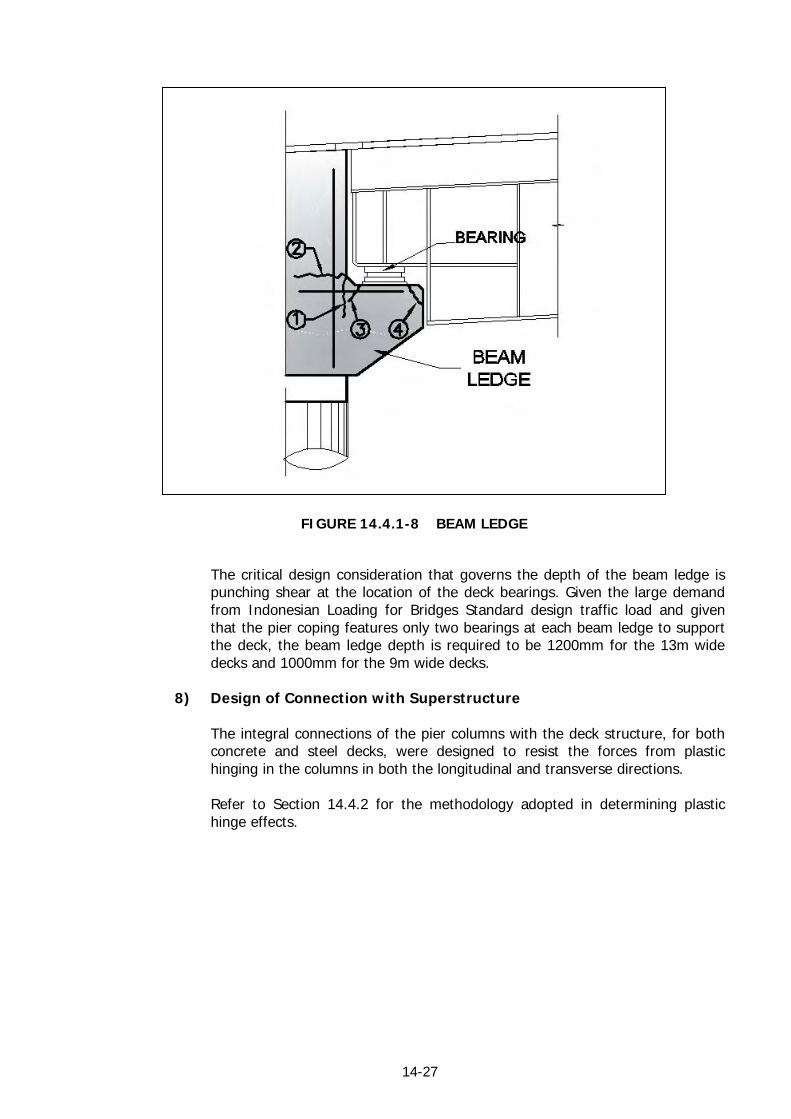
A critical aspect of the pier coping design is the beam ledge. As illustrated in Figure 14.4.1-8, beam ledges shall resist:
a) Flexure, shear and horizontal forces at the location of Crack 1;
b) Tension force in the supporting element at the location of Crack 2;
c) Punching shear at points of loading at the location of Crack 3; and
d) Bearing forces at the location of Crack 4
14-27
FIGURE 14.4.1-8 BEAM LEDGE
The critical design consideration that governs the depth of the beam ledge is punching shear at the location of the deck bearings. Given the large demand from Indonesian Loading for Bridges Standard design traffic load and given that the pier coping features only two bearings at each beam ledge to support the deck, the beam ledge depth is required to be 1200mm for the 13m wide decks and 1000mm for the 9m wide decks.
8) Design of Connection with Superstructure
The integral connections of the pier columns with the deck structure, for both concrete and steel decks, were designed to resist the forces from plastic hinging in the columns in both the longitudinal and transverse directions. Refer to Section 14.4.2 for the methodology adopted in determining plastic hinge effects.
14-28
14.4.2 Foundation Design
1) Plastic Hinging Effects
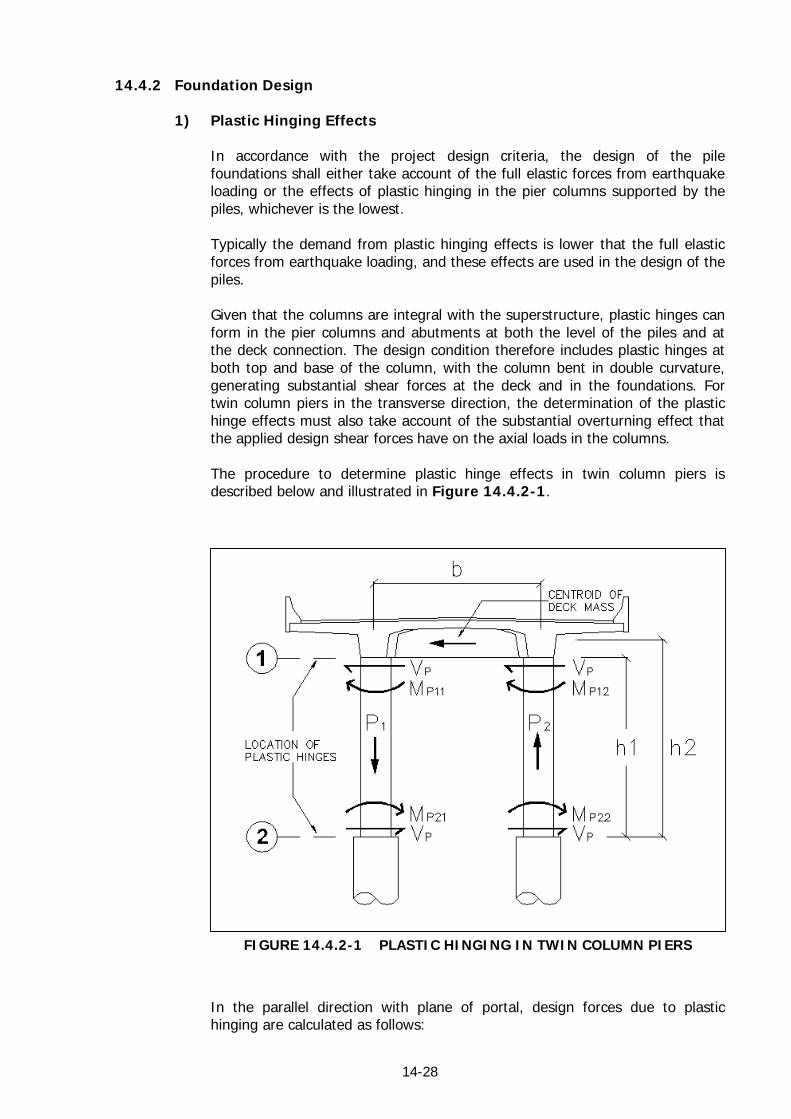
In accordance with the project design criteria, the design of the pile foundations shall either take account of the full elastic forces from earthquake loading or the effects of plastic hinging in the pier columns supported by the piles, whichever is the lowest. Typically the demand from plastic hinging effects is lower that the full elastic forces from earthquake loading, and these effects are used in the design of the piles. Given that the columns are integral with the superstructure, plastic hinges can form in the pier columns and abutments at both the level of the piles and at the deck connection. The design condition therefore includes plastic hinges at both top and base of the column, with the column bent in double curvature, generating substantial shear forces at the deck and in the foundations. For twin column piers in the transverse direction, the determination of the plastic hinge effects must also take account of the substantial overturning effect that the applied design shear forces have on the axial loads in the columns. The procedure to determine plastic hinge effects in twin column piers is described below and illustrated in Figure 14.4.2-1.
In the parallel direction with plane of portal, design forces due to plastic hinging are calculated as follows:
FIGURE 14.4.2-1 PLASTIC HINGING IN TWIN COLUMN PIERS
14-29
a) Design of longitudinal reinforcement based on the design moment obtained based on requirements in design force for structure component and joint.
b) Calculate plastic moments at locations 1 and 2, MP11 MP12 MP21 MP22, with a strength magnification factor of 1.3 for reinforced concrete and 1.25 for structural steel.
c) Calculate design shear force on column VP based on plastic moment capacity and height of columns h1.
d) Determined total shear force placed to act on center of mass of superstructure, then calculate design axial force in the portal due to overturning, based on total shear force acting at height h2.
e) Using the design axial forces in the portal P1 and P2 combined with dead load, determine the revised column over-strength plastic moments. With the revised plastic moments calculate the column shear forces and the maximum shear force on the portal. If the maximum shear force for the portal is not within 10% of the value previously determined, use the maximum portal shear force to recalculate axial force and plastic moments.
2) Design of Composite Column Connection at Bored Pile
The design of the composite column connection with the bored pile, using a steel casing “socket” is based on the project design criteria as set out in Section 7.3.4. The ribbed steel casing is 2.5m in diameter to match the bored pile size and 13mm in thickness (minimum thickness of pipe available at this diameter) with a steel grade SKK400. The design was based on the plastic hinging effects of the column and assumed conservatively ordinary pipe characteristics for the socket. The length of the embedment of the composite column into the socket connection was determined to be 4.0m and the length of the socket pipe was made 6.0m i.e. 1m longer than the plastic hinge zone of the pile top. Note that, although the design was based on ordinary pipe characteristics, the socket pipe is detailed with internal ribs. This provides a substantial margin of safety in the design.
14-30
3) Design of Bored Piles
a) Axial bearing Capacity
The ultimate factored axial bearing capacity design of the bored piles was based on the project design criteria. The project design criteria are based directly on the provisions of AASHTO LRFD. The bearing capacity of the pile includes contribution from both shaft and base, with corresponding strength reduction factors applied. The strength reduction factors depend on the type of soil and whether shaft or base resistance is being calculated. The methods adopted to determine shaft and tip resistance are taken from AASHTO LRFD. Using these methods, together with the assumptions made regarding correlation of un-drained shear strength with SPT, the maximum ultimate bearing capacity in clay at the base of the pile is 2250kN/m2 and the maximum factored capacity is 1237kN/m2. The maximum ultimate shaft resistance is taken as 100kN/m2 and the maximum factored capacity is 65kN/m2. Given the potential for substantial settlements in large diameter bored piles with axial resistance substantially derived from base bearing capacity, the design includes an additional reduction factor for base resistance in clay for the 2.5m diameter piles, in accordance with the provisions of AASHTO LRFD. The LRFD design of bored piles in sand is still not fully covered by available data and therefore the American Federal Highway Authority (FHWA) requires that a conservative approach is adopted in the design, recommending using the Reese and O’Neill method (β method) to calculate both shaft and base resistance with appropriate strength reduction factors prescribed. The Reese and O’Neill method is based only on effective overburden pressure and ignores SPT values. This method was used in the design of the bored piles in sand. The design ignores contributions to axial bearing capacity in the piles from soils with SPT values less than N=2. Furthermore, where piles are located at sites where surface depths of soil include loose sands prone to liquefaction, the design ignores any contribution to axial bearing capacity from these layers.
b) Structural Design
The structural design of the bored piles, in response to the design demand from axial load, bending moment and shear force, is closely linked to the soil structure interaction. The soil structure interaction is defined by the lateral support provided by the soil, particularly at the pile top, in terms of stiffness and limiting lateral bearing capacity, and stiffness and length of the pile. The analysis of the soil structure interaction was based on a beam with non linear ground spring supports, as described in Section 14.1. The stiffness and lateral bearing capacity of the soils layers down the pile were determined using the methods given in Section 7.3.5, based on JRA recommendations.
14-31
The design demand on the pier piles was that due to plastic hinging of the pier columns. Given the requirements to limit service stresses, the reinforcement in the abutments was based on serviceability requirements, giving reinforcement areas in excess of that required to satisfy strength requirements from earthquake forces. The design demand on the abutment piles was therefore that due to the full elastic forces from earthquake load, given that these forces were smaller than the plastic hinging effects in the abutment stem. The critical loads on the piles, in driving the magnitude of the bending moments down the pile section and in generating pile displacements at the pile top, are the design shear forces. These shear forces, generated typically from plastic hinging, are substantial. Careful attention to pier column height and other factors that control the magnitude of shear force in the columns, such as optimum provision of reinforcement that determines the plastic hinging moments, is required in order to avoid overloading the piles beyond the lateral bearing capacity of the soil support. The design bending moments in the piles require significant areas of reinforcement to provide adequate bending resistance. In Indonesia the maximum readily available size of reinforcing bar is 32mm. Larger diameters are available but only for special orders. Given the large areas of reinforcement required for the large diameter bored piles it was found that using 32mm diameter bars was not practical. The bored piles are therefore reinforced with D51mm bars to be imported from Japan. A further critical consideration in the design of the bored piles was the displacements generated by the design demands placed on the pile tops. JRA Specifications for Highway Bridges, Part IV Substructures, includes the following guidelines for limiting values of displacement of foundations designed using the ductility design method (plastic hinge method): • “For the limit value of foundation displacement, a horizontal
displacement of about 40cm and an angular displacement of about 0.025 rad may be taken as a guideline.” (JRA, Part IV, Clause 10.10.5)
In undertaking the detailed design it was found that the limit on angular displacement was the most critical in placing a limit on the maximum demand a particular pile could support.
4) Effects of Soil Liquefaction
Loose sands in saturated surface layers (less than 20m deep) are encountered at Merak, Gebang and Tanggulangin Flyovers. These soils are susceptible to the effects of soil liquefaction. Merak Flyover is located in Seismic Zone 2 (peak ground acceleration, PGA, in bed rock A=0.50g), Gebang Flyover is located in Seismic Zone 3 (A=0.40g) and Tanggulangin Flyover is located in Seismic Zone 2 (A=0.30g). The liquefaction potential of soils was determined in accordance with the project design criteria. These criteria are taken directly from the Indonesian Design Standard of Earthquake Resistance for Bridges and are based closely on the provisions of JRA, Part V, Seismic Design.
14-32
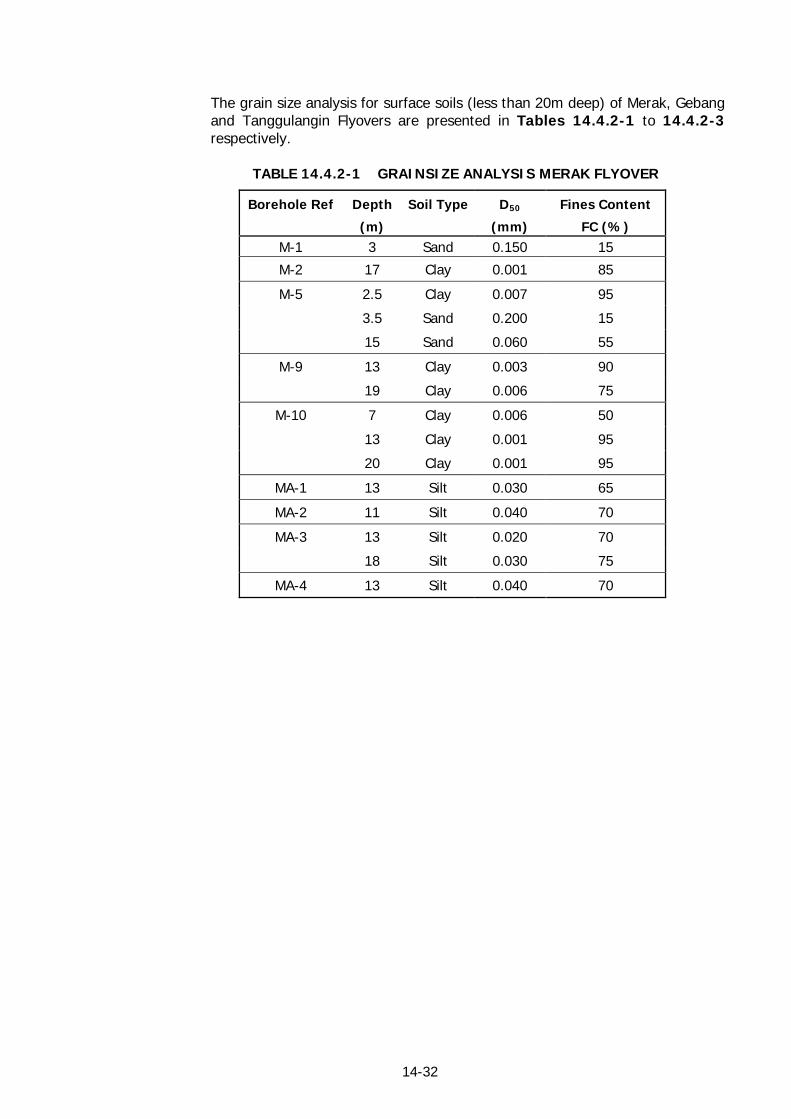
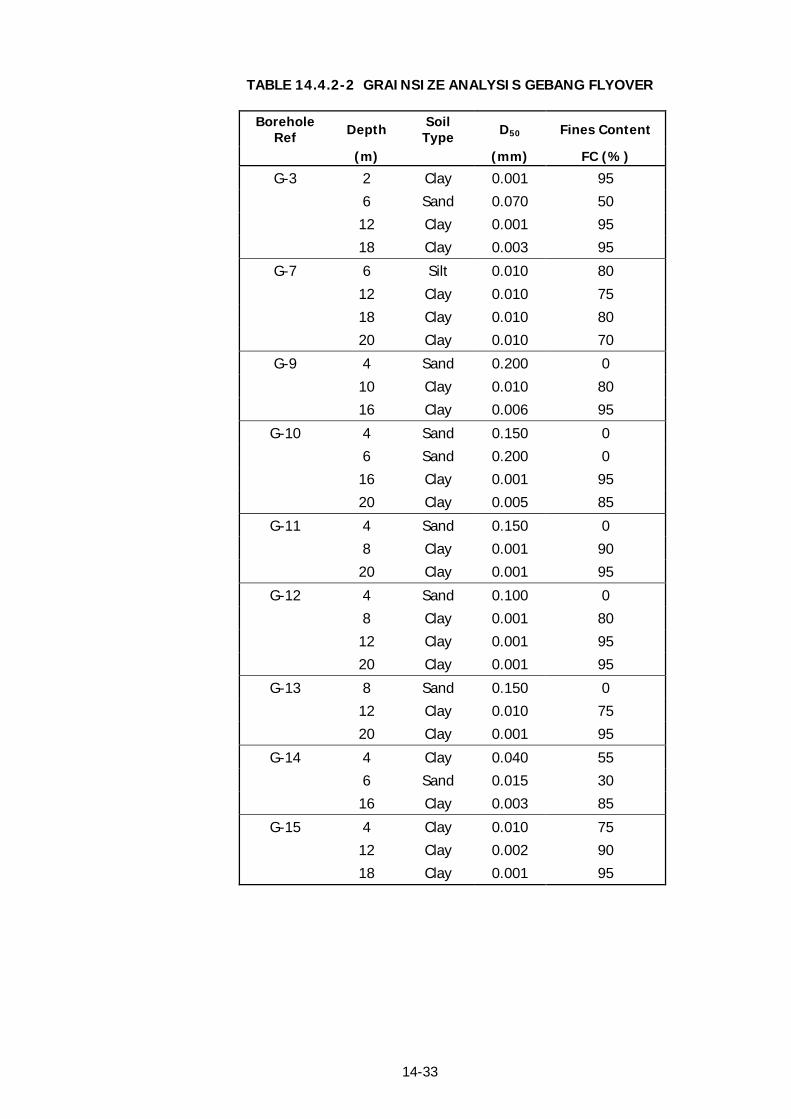
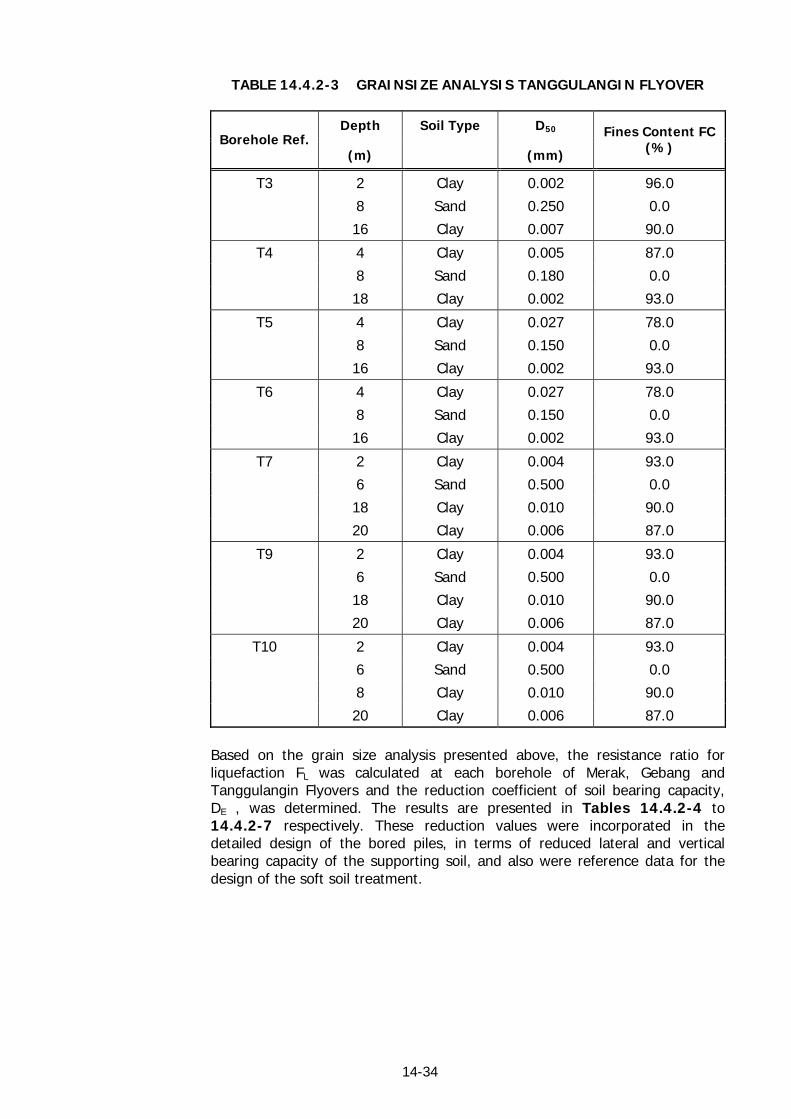
The grain size analysis for surface soils (less than 20m deep) of Merak, Gebang and Tanggulangin Flyovers are presented in Tables 14.4.2-1 to 14.4.2-3 respectively.
TABLE 14.4.2-1 GRAINSIZE ANALYSIS MERAK FLYOVER
Borehole Ref Depth Soil Type D50 Fines Content
(m) (mm) FC (%) M-1 3 Sand 0.150 15
M-2 17 Clay 0.001 85
M-5 2.5 Clay 0.007 95
3.5 Sand 0.200 15
15 Sand 0.060 55
M-9 13 Clay 0.003 90
19 Clay 0.006 75
M-10 7 Clay 0.006 50
13 Clay 0.001 95
20 Clay 0.001 95
MA-1 13 Silt 0.030 65
MA-2 11 Silt 0.040 70
MA-3 13 Silt 0.020 70
18 Silt 0.030 75
MA-4 13 Silt 0.040 70
14-33
TABLE 14.4.2-2 GRAINSIZE ANALYSIS GEBANG FLYOVER
Borehole Ref Depth Soil
Type D50 Fines Content
(m) (mm) FC (%)
G-3 2 Clay 0.001 95
6 Sand 0.070 50
12 Clay 0.001 95
18 Clay 0.003 95
G-7 6 Silt 0.010 80
12 Clay 0.010 75
18 Clay 0.010 80
20 Clay 0.010 70
G-9 4 Sand 0.200 0
10 Clay 0.010 80
16 Clay 0.006 95
G-10 4 Sand 0.150 0
6 Sand 0.200 0
16 Clay 0.001 95
20 Clay 0.005 85
G-11 4 Sand 0.150 0
8 Clay 0.001 90
20 Clay 0.001 95
G-12 4 Sand 0.100 0
8 Clay 0.001 80
12 Clay 0.001 95
20 Clay 0.001 95
G-13 8 Sand 0.150 0
12 Clay 0.010 75
20 Clay 0.001 95
G-14 4 Clay 0.040 55
6 Sand 0.015 30
16 Clay 0.003 85
G-15 4 Clay 0.010 75
12 Clay 0.002 90
18 Clay 0.001 95
14-34
TABLE 14.4.2-3 GRAINSIZE ANALYSIS TANGGULANGIN FLYOVER
Depth Soil Type D50 Borehole Ref.
(m) (mm)
Fines Content FC (%)
T3 2 Clay 0.002 96.0
8 Sand 0.250 0.0
16 Clay 0.007 90.0
T4 4 Clay 0.005 87.0
8 Sand 0.180 0.0
18 Clay 0.002 93.0
T5 4 Clay 0.027 78.0
8 Sand 0.150 0.0
16 Clay 0.002 93.0
T6 4 Clay 0.027 78.0
8 Sand 0.150 0.0
16 Clay 0.002 93.0
T7 2 Clay 0.004 93.0
6 Sand 0.500 0.0
18 Clay 0.010 90.0
20 Clay 0.006 87.0
T9 2 Clay 0.004 93.0
6 Sand 0.500 0.0
18 Clay 0.010 90.0
20 Clay 0.006 87.0
T10 2 Clay 0.004 93.0
6 Sand 0.500 0.0
8 Clay 0.010 90.0
20 Clay 0.006 87.0
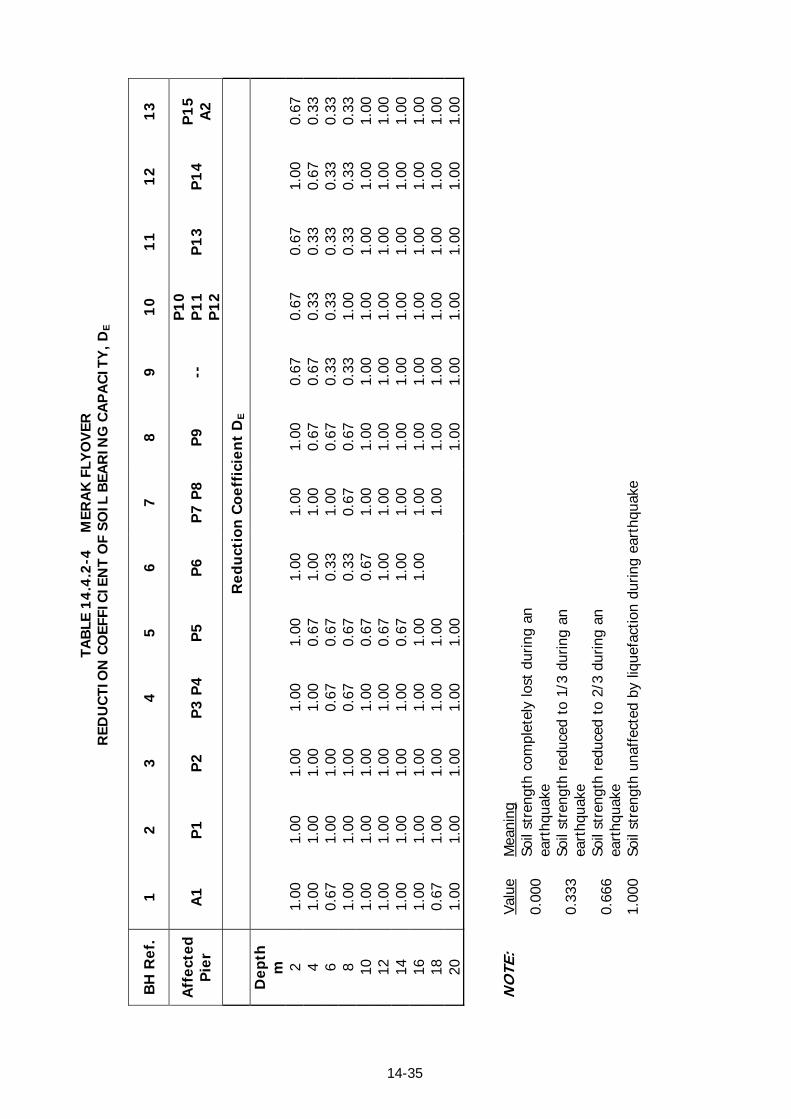
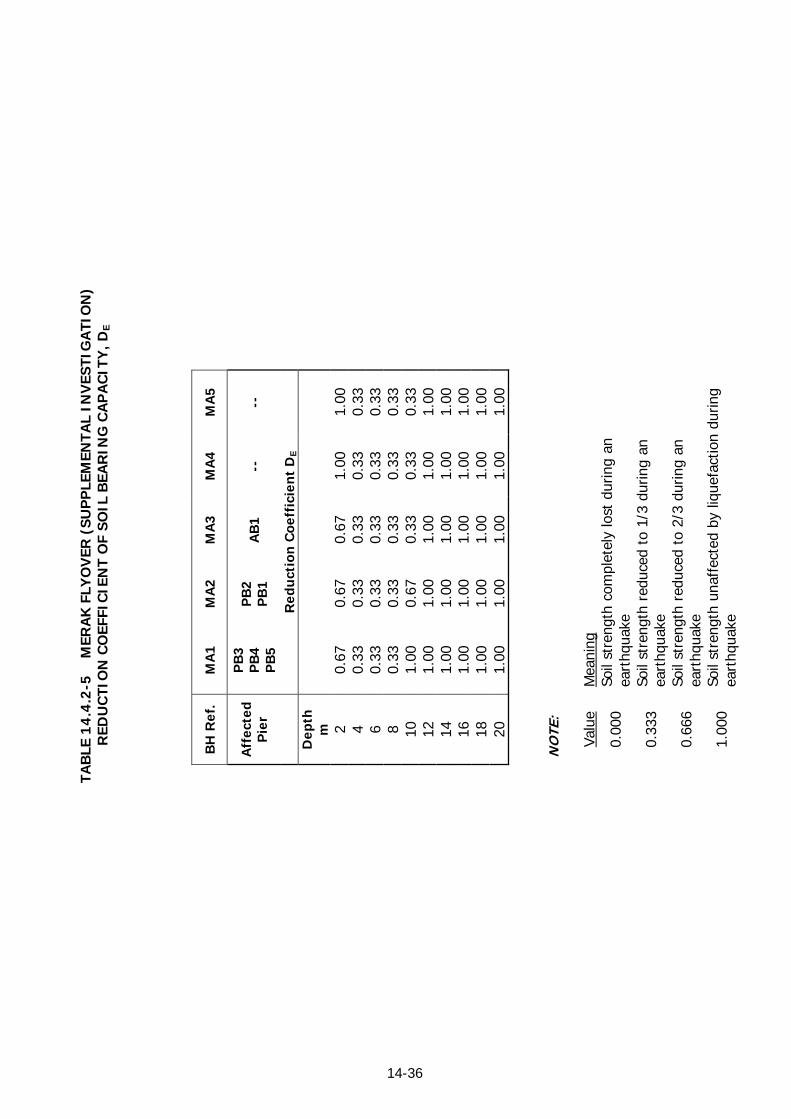
Based on the grain size analysis presented above, the resistance ratio for liquefaction FL was calculated at each borehole of Merak, Gebang and Tanggulangin Flyovers and the reduction coefficient of soil bearing capacity, DE , was determined. The results are presented in Tables 14.4.2-4 to 14.4.2-7 respectively. These reduction values were incorporated in the detailed design of the bored piles, in terms of reduced lateral and vertical bearing capacity of the supporting soil, and also were reference data for the design of the soft soil treatment.
14-35
TAB
LE 1
4.4
.2-4
M
ERA
K F
LYO
VER
R
EDU
CTI
ON
CO
EFFI
CIE
NT
OF
SOIL
BEA
RIN
G C
AP
AC
ITY
, DE
BH
Ref
.1
2
3
4
5
6
7
8
9
1
0
11
1
2
13
Aff
ecte
d P
ier
A
1
P1
P
2
P3
P4
P5
P
6
P7
P8
P
9
--
P1
0
P1
1
P1
2
P1
3
P1
4
P1
5
A2
R
edu
ctio
n C
oeff
icie
nt
DE
Dep
th
m
2 1.
00
1.00
1.
00
1.00
1.
00
1.00
1.
00
1.00
0.
67
0.67
0.
67
1.00
0.
67
4 1.
00
1.00
1.
00
1.00
0.
67
1.00
1.
00
0.67
0.
67
0.33
0.
33
0.67
0.
33
6 0.
67
1.00
1.
00
0.67
0.
67
0.33
1.
00
0.67
0.
33
0.33
0.
33
0.33
0.
33
8 1.
00
1.00
1.
00
0.67
0.
67
0.33
0.
67
0.67
0.
33
1.00
0.
33
0.33
0.
33
10
1.00
1.
00
1.00
1.
00
0.67
0.
67
1.00
1.
00
1.00
1.
00
1.00
1.
00
1.00
12
1.
00
1.00
1.
00
1.00
0.
67
1.00
1.
00
1.00
1.
00
1.00
1.
00
1.00
1.
00
14
1.00
1.
00
1.00
1.
00
0.67
1.
00
1.00
1.
00
1.00
1.
00
1.00
1.
00
1.00
16
1.
00
1.00
1.
00
1.00
1.
00
1.00
1.
00
1.00
1.
00
1.00
1.
00
1.00
1.
00
18
0.67
1.
00
1.00
1.
00
1.00
1.00
1.
00
1.00
1.
00
1.00
1.
00
1.00
20
1.
00
1.00
1.
00
1.00
1.
00
1.00
1.
00
1.00
1.
00
1.00
1.
00
NO
TE:
Valu
e
Mea
ning
0.
000
Soil
stre
ngth
com
plet
ely
lost
dur
ing
an
eart
hqua
ke
0.
333
Soil
stre
ngth
red
uced
to
1/3
durin
g an
ea
rthq
uake
0.
666
Soil
stre
ngth
red
uced
to
2/3
durin
g an
ea
rthq
uake
1.
000
Soil
stre
ngth
una
ffec
ted
by li
quef
actio
n du
ring
eart
hqua
ke
14-36
TAB
LE 1
4.4
.2-5
M
ERA
K F
LYO
VER
(SU
PP
LEM
ENTA
L IN
VES
TIG
ATI
ON
) R
EDU
CTI
ON
CO
EFFI
CIE
NT
OF
SOIL
BEA
RIN
G C
AP
AC
ITY
, DE
BH
Ref
.M
A1
M
A2
M
A3
M
A4
M
A5
Aff
ecte
d P
ier
PB
3
PB
4
PB
5
PB
2
PB
1
AB
1
--
--
Red
uct
ion
Coe
ffic
ien
t D
E
Dep
th
m
2 0.
67
0.67
0.
67
1.00
1.
00
4
0.33
0.
33
0.33
0.
33
0.33
6 0.
33
0.33
0.
33
0.33
0.
33
8
0.33
0.
33
0.33
0.
33
0.33
10
1.00
0.
67
0.33
0.
33
0.33
12
1.00
1.
00
1.00
1.
00
1.00
14
1.00
1.
00
1.00
1.
00
1.00
16
1.00
1.
00
1.00
1.
00
1.00
18
1.00
1.
00
1.00
1.
00
1.00
20
1.00
1.
00
1.00
1.
00
1.00
NO
TE:
Va
lue
M
eani
ng
0.00
0 So
il st
reng
th c
ompl
etel
y lo
st d
urin
g an
ea
rthq
uake
0.33
3 So
il st
reng
th r
educ
ed t
o 1/
3 du
ring
an
eart
hqua
ke
0.66
6 So
il st
reng
th r
educ
ed t
o 2/
3 du
ring
an
eart
hqua
ke
1.00
0 So
il st
reng
th u
naff
ecte
d by
liqu
efac
tion
durin
g ea
rthq
uake

14-37
TAB
LE 1
4.4
.2-6
G
EBA
NG
FLY
OV
ER
RED
UC
TIO
N C
OEF
FIC
IEN
T O
F SO
IL B
EAR
ING
CA
PA
CIT
Y, D
E
BH
Ref
.3
4
6
7
9
1
0
11
1
2
13
1
4
15
1
6
17
Aff
ecte
d P
ier
A
1
P1
P2
P
3
P4
P
5
P6
P7
P
8
P9
P
10
P
11
P
12
P
14
P
15
A
2
R
edu
ctio
n C
oeff
icie
nt
DE
Dep
th
m
2 1.
00
1.00
1.
00
1.00
1.
00
1.00
1.
00
1.00
1.
00
1.00
1.
00
1.00
1.
00
4 0.
67
1.00
1.
00
1.00
1.
00
1.00
1.
00
1.00
1.
00
1.00
1.
00
1.00
0.
67
6 0.
33
0.67
0.
67
0.67
1.
00
1.00
0.
33
1.00
1.
00
1.00
1.
00
1.00
0.
33
8 1.
00
1.00
0.
33
1.00
0.
33
1.00
1.
00
1.00
0.
33
1.00
1.
00
0.33
1.
00
10
1.00
1.
00
1.00
1.
00
1.00
1.
00
1.00
1.
00
1.00
1.
00
1.00
1.
00
1.00
12
1.
00
1.00
1.
00
1.00
1.
00
1.00
1.
00
1.00
1.
00
1.00
1.
00
1.00
1.
00
14
1.00
1.
00
1.00
1.
00
1.00
1.
00
1.00
1.
00
1.00
1.
00
1.00
1.
00
1.00
16
1.
00
1.00
1.
00
1.00
1.
00
1.00
1.
00
1.00
1.
00
1.00
1.
00
1.00
1.
00
18
1.00
1.
00
1.00
1.
00
1.00
1.
00
1.00
1.
00
1.00
1.
00
1.00
1.
00
1.00
20
1.
00
1.00
1.
00
1.00
1.
00
1.00
1.
00
1.00
1.
00
1.00
1.
00
1.00
1.
00
NO
TE:
Valu
e
Mea
ning
0.
00
Soil
stre
ngth
com
plet
ely
lost
dur
ing
an
eart
hqua
ke
0.
33
Soil
stre
ngth
red
uced
to
1/3
durin
g an
ea
rthq
uake
0.
67
Soil
stre
ngth
red
uced
to
2/3
durin
g an
ea
rthq
uake
1.
00
Soil
stre
ngth
una
ffec
ted
by li
quef
actio
n du
ring
eart
hqua
ke

14-38
TAB
LE 1
4.4
.2-7
T
AN
GG
ULA
NG
IN F
LYO
VER
R
EDU
CTI
ON
CO
EFFI
CIE
NT
OF
SOIL
BEA
RIN
G C
AP
AC
ITY
, DE
BH
Ref
.3
4
5
6
7
9
1
0
Aff
ecte
d P
ier
A
1
P1
P
2
P3
P
4 P
5
P6
P7
P
8 A
2
R
edu
ctio
n C
oeff
icie
nt
DE
Dep
th
(m
)
2 1.
000
1.00
0 1.
000
1.00
0 1.
000
1.00
01.
000
4 0.
333
1.00
0 1.
000
1.00
0 1.
000
0.33
30.
333
6 0.
667
0.00
0 0.
000
1.00
0 1.
000
0.33
30.
000
8 1.
000
0.66
7 0.
667
0.33
3 0.
667
1.00
01.
000
10
1.00
01.
000
1.00
01.
000
1.00
01.
000
1.00
012
1.
000
1.00
0 1.
000
0.00
0 1.
000
1.00
01.
000
14
1.00
01.
000
1.00
01.
000
1.00
01.
000
1.00
016
1.
000
1.00
0 1.
000
1.00
0 1.
000
1.00
01.
000
18
1.00
01.
000
1.00
01.
000
1.00
01.
000
1.00
020
1.
000
1.00
0 1.
000
1.00
0 1.
000
1.00
01.
000
NO
TE:
Valu
e M
eani
ng
0.
000
Soil
stre
ngth
com
plet
ely
lost
dur
ing
an
eart
hqua
ke
0.
333
Soil
stre
ngth
red
uced
to
1/3
durin
g an
ea
rthq
uake
0.
667
Soil
stre
ngth
red
uced
to
2/3
durin
g an
ea
rthq
uake
1.
000
Soil
stre
ngth
una
ffec
ted
by li
quef
actio
n du
ring
eart
hqua
ke
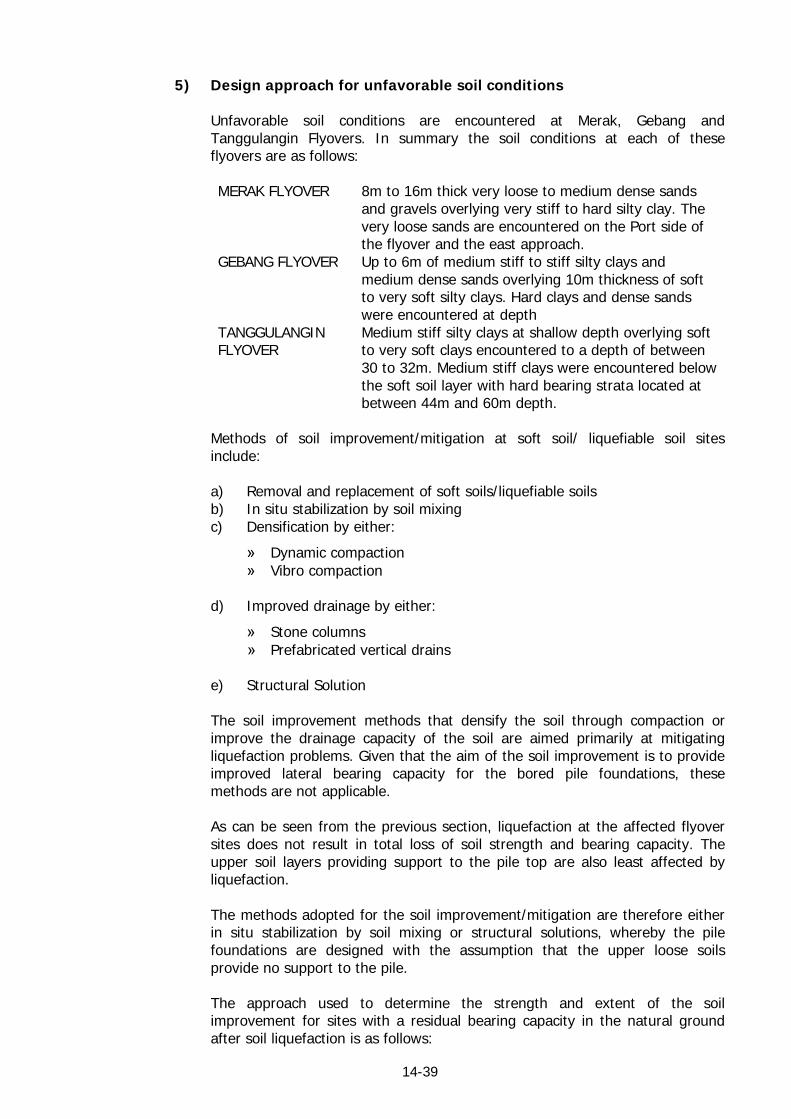
14-39
5) Design approach for unfavorable soil conditions
Unfavorable soil conditions are encountered at Merak, Gebang and Tanggulangin Flyovers. In summary the soil conditions at each of these flyovers are as follows:
MERAK FLYOVER 8m to 16m thick very loose to medium dense sands
and gravels overlying very stiff to hard silty clay. The very loose sands are encountered on the Port side of the flyover and the east approach.
GEBANG FLYOVER Up to 6m of medium stiff to stiff silty clays and medium dense sands overlying 10m thickness of soft to very soft silty clays. Hard clays and dense sands were encountered at depth
TANGGULANGIN FLYOVER
Medium stiff silty clays at shallow depth overlying soft to very soft clays encountered to a depth of between 30 to 32m. Medium stiff clays were encountered below the soft soil layer with hard bearing strata located at between 44m and 60m depth.
Methods of soil improvement/mitigation at soft soil/ liquefiable soil sites include:
a) Removal and replacement of soft soils/liquefiable soils b) In situ stabilization by soil mixing c) Densification by either:
» Dynamic compaction » Vibro compaction
d) Improved drainage by either:
» Stone columns » Prefabricated vertical drains
e) Structural Solution
The soil improvement methods that densify the soil through compaction or improve the drainage capacity of the soil are aimed primarily at mitigating liquefaction problems. Given that the aim of the soil improvement is to provide improved lateral bearing capacity for the bored pile foundations, these methods are not applicable. As can be seen from the previous section, liquefaction at the affected flyover sites does not result in total loss of soil strength and bearing capacity. The upper soil layers providing support to the pile top are also least affected by liquefaction. The methods adopted for the soil improvement/mitigation are therefore either in situ stabilization by soil mixing or structural solutions, whereby the pile foundations are designed with the assumption that the upper loose soils provide no support to the pile. The approach used to determine the strength and extent of the soil improvement for sites with a residual bearing capacity in the natural ground after soil liquefaction is as follows:
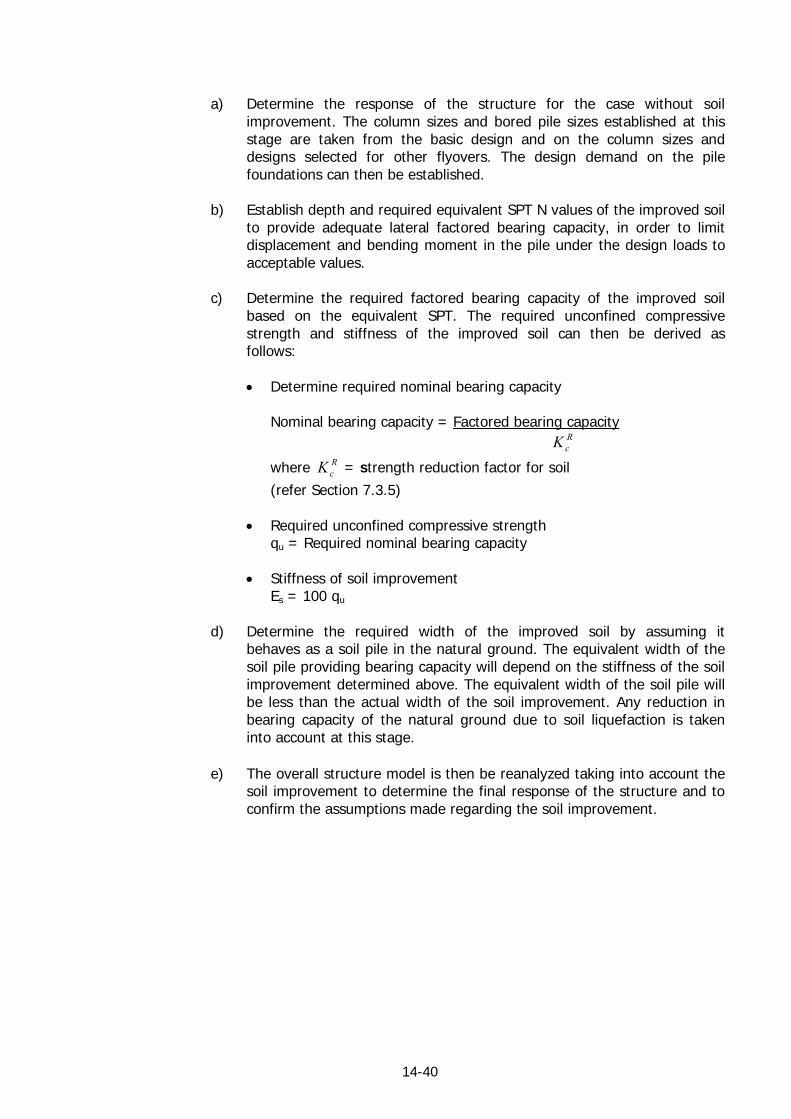
14-40
a) Determine the response of the structure for the case without soil
improvement. The column sizes and bored pile sizes established at this stage are taken from the basic design and on the column sizes and designs selected for other flyovers. The design demand on the pile foundations can then be established.
b) Establish depth and required equivalent SPT N values of the improved soil
to provide adequate lateral factored bearing capacity, in order to limit displacement and bending moment in the pile under the design loads to acceptable values.
c) Determine the required factored bearing capacity of the improved soil
based on the equivalent SPT. The required unconfined compressive strength and stiffness of the improved soil can then be derived as follows:
• Determine required nominal bearing capacity
Nominal bearing capacity = Factored bearing capacity
RcK
where RcK = strength reduction factor for soil
(refer Section 7.3.5)
• Required unconfined compressive strength qu = Required nominal bearing capacity
• Stiffness of soil improvement
Es = 100 qu
d) Determine the required width of the improved soil by assuming it
behaves as a soil pile in the natural ground. The equivalent width of the soil pile providing bearing capacity will depend on the stiffness of the soil improvement determined above. The equivalent width of the soil pile will be less than the actual width of the soil improvement. Any reduction in bearing capacity of the natural ground due to soil liquefaction is taken into account at this stage.
e) The overall structure model is then be reanalyzed taking into account the
soil improvement to determine the final response of the structure and to confirm the assumptions made regarding the soil improvement.

15-1
CHAPTER 15
APPROPRIATE EMBANKMENT DESIGN
15.1 APPROACH EMBANKMENT FOR FLYOVER
Type of Approach Embankment is classified into 3 group; Group 1: Common soil embankment with Mechanically Stabilized Wall
(MSE-Wall) Group 2: Underground Improvement in Partial and MSE-Wall Group 3: EPS-Block Geoform Embankment Group 1 is used for the ground condition where non-soft ground area, since any long-term settlement due to consolidation caused by embankment soil is not expected. Therefore, no ground improvement will be required and conventional MSE wall system can be adopted. Group 2 is applied where loose sand with high water level in surface exist. During moderate to strong earthquake, liquefaction of loose and saturated sand may be happen as per analysis of liquefaction potentially. Group 3 is applied where highly soft subsurface soil with deep layers are existing. Due to deep and thick soft soil identified and verified through geotechnical investigation, consolidation settlement with large amount is anticipated. Specifically at the flyover site of Gebang and Tanggulangin consolidation due to common soil becomes 30 to 40% of embankment height, hence 2~2.5m settlement will be occurred at the completion of common soil embankment. No major settlement shall be allowed at Gebang and Tanggulangin site, where densely developed houses along road are existing.
15.2 MECHANICALLY STABILIZED EARTH (MSE) WALL 15.2.1 General
MSE walls shall be designed for external stability of the wall system as well as internal stability of the reinforced soil mass behind the facing. Internal design of MSE wall systems requires knowledge of short and long term properties of the materials used as soil reinforcements as well as the soil mechanics which govern MSE wall behavior. Structural design of the wall facing may also be required.
15.2.2 Structure Dimensions
MSE walls shall be dimensioned to ensure that the minimum factors of safety for sliding and overturning stability are satisfied. In addition, the minimum factors of safety for foundation bearing capacity and pullout resistance shall also be satisfied, as well as overall stability requirements. The soil reinforcement length shall be calculated based on external and internal stability considerations. Soil reinforcement length shall be as minimum approximately 70% of the wall height (as measured from the leveling pad) and not less than 2.4 meters (8 feet). The wall height is defined as the difference in

15-2
elevation between the top of the wall at the wall face (i.e., where the finished grade intersects the back of the wall face) and the top of the leveling pad. The reinforcement length shall be uniform throughout the entire height of the wall. External loads such as surcharges will increase the minimum reinforcement length. Greater reinforcement lengths may also be required for very soft soil sites and so satisfy global stability requirements. The minimum embedment depth of the bottom of the reinforced soil mass, which is the same as the top of the leveling pad, shall be based on bearing capacity, settlement, and stability requirements, including the effects of frost heave, scour, proximity to slopes, erosion, and the potential future excavation in front of the wall. The lowest backfill reinforcement layer shall not be located above the long-term ground surface in front of the wall. In addition to general bearing capacity, settlement, and stability considerations, the minimum embedment required shall consider the potential for local bearing capacity failure under the leveling pad or footing due to higher vertical stresses transmitted by the facing. A minimum horizontal bench 1.2 meters (4feet) wide shall be provided in front of walls founded on slopes. For walls constructed along rivers and streams, embedment depths shall be established at a minimum of 0.6 meters (2 feet) below potential scout depth.
15.2.3 External Stability
Stability computations shall be made by assuming the reinforced soil mass and facing to be a rigid body. The coefficient of active pressure, Kaf used to compute the horizontal force resulting from the retained backfill behind the reinforced zone and other loads shall be computed on the basis of the friction angle of the retained backfill. In the absence of specific data, a maximum friction angle of 30° should be used. The limitations also applies when determining the coefficient of sliding friction at the wall base. Passive pressures shall be neglected in stability computations. The active earth pressure coefficients for retained backfill (i.e. fill behind the reinforced soil mass) for external stability calculations only with δ = β.Dead load surcharges, if present, shall be taken into account. If a break in the slope behind the wall facing is located horizontally within two times the height of the wall (2H), a broken backslope design (A.R.E.A. method) shall be used. Alternatively, a broken back slope design can be performed for the actual slope geometry by using a graphical Coulomb procedure such as the Culmann method. For sliding stability, the coefficient of sliding used to calculate frictional resistance at the base of the wall shall be the minimum of the following determinations:
• Tan Ф at the base of the wall, where Ф is the friction angle of the backfill or
the foundation soil, whichever is lowest. • Tan ρ if continuous or near continuous reinforcement layers are used, where ρ
is the soil/reinforcement interface angle for the bottom of the lowest reinforcement layer.
15-3
If site specific date for Tan ρ is not available, use 0.67Tan Ф for the coefficient of sliding for continuous or near continuous reinforcement layers. For calculations of external stability, the continuous traffic surcharge loads shall be considered to act beyond the end of the reinforced zone.
15.2.4 Bearing Capacity and Foundation Stability
Allowable bearing capacities for MSE walls shall be computed using a minimum factor of safety of 2.5 for Group 1 loading applied to be calculated ultimate bearing capacity. A lesser FS, of 2.0 could be used if justified by a geotechnical analysis. The width of the footing for ultimate bearing capacity calculations shall be considered to be the length of the reinforcement calculated at the foundation level. Bearing pressures shall be computed using the Meyerhof distribution over an effective base width of B′ = L – 2e. It is acceptable to use “B” in lieu of “L” especially for walls with the relatively thick facing units. Where soft soils are present or of on sloping ground, the difference in bearing stress calculated for the wall reinforced soil zone relative to the local bearing stress beneath the facing elements shall be considered when evaluating bearing capacity. This is especially important where concrete wall facings are used due to their weight. Furthermore, differential settlements between the facing elements and the reinforced soil zone of the wall due to concreted bearing stresses at the connection between the facing elements and the wall backfill reinforcement. In both cases, the leveling pad shall be embedded adequately to meet the bearing capacity and settlement requirements or dimensioned and designed to keep bearing stresses beneath the leveling pad and he remainder of the wall as uniform as possible.
15.2.5 Calculation of Loads for Internal Stability Design
Reinforcement loads calculated for internal stability design are dependent on the soil reinforcement extensibility and material type. In general, inextensible reinforcements consists of metallic strips, bar mats, or welded wire mats, whereas extensible reinforcements consists of geotextiles or geogrids. Inextensible reinforcements reach their peak strength at strains required for the soil to reach their peak strength. Extensible reinforcements reach its peak strength at strains greater than the strain required for soil to reach peak strength. Internal stability failure modes include soil reinforcement rupture (ultimate limit state), sand excessive reinforcement elongation under the design load (serviceability limit state). Internal stability is determined by equating the tensile load applied to the reinforcement, the allowable tension being governed by reinforcement rupture and pullout. The load in the reinforcement is determined at two critical locations, i.e. at the zone of maximum stress and at the connection with the wall face, to assess the internal stability of the wall system. Potential for reinforcement rupture and pullout are evaluated at the zone of maximum stress. The zone of maximum stress is assumed to be located at the boundary between the active zone and the resistant zone. Potential for reinforcement rupture and pullout are also evaluated at the connection of the reinforcement to the wall facing. The maximum friction angle used for the computation of horizontal force within the reinforced soil mass shall be assumed to be 34°.
15-4
1) Calculations of Maximum Reinforcement Loads
Maximum reinforcement loads shall be calculated using a Simplified Coherent Gravity approach. For this approach, the load in the reinforcements is obtained by multiplying a lateral earth pressure coefficient by the vertical pressure at the reinforcement, and applying the resulting lateral pressure to the tributary area for the reinforcement. The vertical stress, σv, is the result of gravity forces from soil self weight within and immediately above the reinforced wall backfill, and any surcharge loads present. The lateral earth pressure coefficient “Kr”, is determined by applying a multiplier to the active earth pressure coefficient. The active earth pressure coefficient shall be determined using the Coulomb method, but assuming no wall friction (i.e. set δ=β). Note that since it is assumed that δ= β, and β is assumed to always be zero for internal stability, for a vertical wall, the Coulomb equation simplifies mathematically to the simplest form of the Rankine equations as shown below:
Ka = Tan2 (45-Ф′/2)
The multiplier to Ka is a function of the reinforcement type and the depth of the reinforcement below the wall top. The applied load to the reinforcements, Tmax shall be calculated on a load per unit of wall width basis. Therefore, the reinforcement load, accounting for the tributary area of the lateral stress, is determined as follows:
σh = σv Kr + ∆ σh
Tmax = σh Sv
Where σh is the horizontal soil stress at the reinforcement, Sv is the vertical spacing of the reinforcement, Kr is the lateral earth pressure coefficient for a given reinforcement type and location, σv is the vertical earth pressure at the reinforcement, and ∆σh is the horizontal stress at the reinforcement location resulting from a concentrated horizontal surcharge load. The design specifications provided herein assume that the wall facing combined with the reinforced backfill acts as a coherent unit to form a gravity retaining structure. The effect of relatively large vertical spacing of reinforcement on this assumption is not well known, and a vertical spacing greater than 0.8 meters (31 inches) shall not be used without full scale wall data (e.g. reinforcements loads and strains, and overall deflections) which supports the acceptability of larger vertical spacings.
2) Determination of Reinforcement Tensile Load at the Connection to
the Wall Face The tensile load applied to the soil reinforcement connection at the wall face, To shall be equal to Tmax for all wall systems regardless of facing and reinforcement type.

15-5
15.2.6 Determination of Reinforcement Length Required for Internal Stability
1) Location of Zone of Maximum Stress The location of the zone of maximum stress for inextensible and extensible wall systems, which forms the boundary between the active and resistant zones, shall be assumed to begin at the back of the facing elements at the toe of the wall. For extensible wall systems with a face batter of less than 10° from the vertical, the zone of maximum stress should be determined using the Rankine method. The Coulomb method shall be used for walls with extensible reinforcement in cases of significant batter (defined as 10° from vertical or more) and concentrated surcharge loads to determine the location of the zone of maximum stress.
2) Soil Reinforcement Pullout Design
The reinforcement pullout resistance shall be checked at each level against pullout failure of internal stability. Only the effective pullout length which extends beyond the theoretical failure surfaces shall be used in this computation. The effective pullout length required shall be determined using the following equations as shown below;
Le ≥ FS ρo Tmax
F* ασvCRc
where Le is the length of reinforcement in the resisting zone, FSρo is the safety factor against pullout (minimum of 1.5), F* is the pullout resistance factor, α is a scale effect correction factor, σv is the vertical stress at the reinforcement in the resistant zone, C is an overall reinforcement surface area geometry factor based in the gross perimeter of the reinforcement and is equal to 2 for strip, grid, and sheet type reinforcements (i.e. two sides), Rc is the reinforcement coverage ratio (see Article 5.8.6), and other variables are as defined previously. F* ασvCLc is the pullout resistance Pr per unit of reinforcement width. For standard backfill materials (see Article 7.3.6.3) in Division II), with the exception of uniform sands (i.e. coefficient of uniformity Cu< 4), it is acceptable to use conservative default values for F* and α. For ribbed steel strips, if the specific Cu of 4.0 should be assumed for design determined F*. A minimum length Le in the resistant zone of 0.9 meters (3 feet) shall be used. The total length of reinforcement required for pullout to La + Le. For grids, the spacing between transverse grid elements, St shall be uniform throughout the length of the reinforcement rather than having transverse grid members concentrated only in the resistant zone. These pullout calculations assume that the long-term strength of the reinforcement in the resistant zone is greater than Tmax.

15-6
15.2.7 Reinforcement Strength Design
The strength of the reinforcement needed, for internal stability, to resist the load applied throughout the design life of the wall shall be determined where the reinforcement load maximum and at the connection of the reinforcement to the wall face. The reinforcement strength required shall be checked at every level within the wall for ultimate limit state. A first order estimate of lateral deformation of the entire wall structure. Therefore, where the load is maximum,
Tmax ≤ TaRc Tac shall be determined at the wall face connection for steel reinforcement and geosynthetic reinforcement. Ta shall be determined on a long-term strength per unit of reinforcement width basis and multiplied by the reinforcement coverage ratio Rc so that it can be directly compared Tmax which is determined on a load per unit of wall width basis (this also applies to Tac and To). For discrete (i.e. not continuous) reinforcements, such as steel strips or bar mats, the strength of the reinforcement is converted to a strength per unit wall width basis by taking the long-term strength per reinforcement, dividing it by the discrete reinforcement width, b and multiplying it by the reinforcement coverage ratio Rc For continuous reinforcement layers, b5 1 and Rψ = 1.
1) Design Life Requirements
Reinforcement elements in MSB walls shall be designed to have a corrosion resistance/durability to ensure a minimum design life of 75 years for permanent structures. For retaining structure applications designated as having severe consequences should poor performance or failure occur, a 100-year service life shall be considered. The allowable reinforcement tension shall be based on maintaining allowable material stresses to the end of the 75 or 100 year service life. a) Steel Reinforcement
For steel reinforcements, the required sacrificial thickness shall be provided in addition to the required structural reinforcement thickness to compensate for the effects of corrosion. The structural design of galvanized steel soil reinforcements and connections shall be made on the basis of Fy, the yield strength of the steel, and the cross-sectional area of the steel determined using the steel thickness after corrosion losses, Ec, denned as show below;
Ec = En - ER
where ER is the total loss in thickness due to corrosion to produce the expected loss in tensile strength during the required design life. The sacrificial thickness (i.e., corrosion loss) is computed for each exposed surface as follows, assuming that the soil backfill used is non-aggressive: Galvanization loss 15 µm/year (0.60 mils/year) for first 2 years 4 µm/year (0.16 mils/year) for subsequent years Carbon steel loss 12 µm/year (0.47 mils/year) after zinc depletion

15-7
These sacrificial thicknesses account for potential pitting mechanisms and much of the uncertainty due to data scatter, and are considered to be maximum anticipated losses for soils which are defined as nonaggressive. Soils shall be considered nonaggressive if they meet the following criteria:
pH of 5 to 10 Resistivity of not less than 3,000 ohm-cm Chlorides not greater than 100 ppm Sulfates not greater than 200 ppm
If the resistivity is greater than or equal to 5,000 ohm-cm, the chlorides and sulfates requirements may be waived. These sacrificial thickness requirements are not applicable for, soils which do not meet one or more of the nonaggressive soil criteria. Additionally, these sacrificial thickness requirements are not applicable in applications where:
• the MSE wall will be exposed to a marine or other chloride rich
environment; • the MSE wall will be exposed to stray currents such as from nearby
underground power lines or adjacent electric railways; • the backfill material is aggressive; or • the galvanizing thickness is less than specified in these guidelines.
b) Geosynthetic Reinforcement
The durability of geosynthetic reinforcements is influenced by environmental factors such as time, temperature, mechanical damage, stress levels, and chemical exposure (e.g., oxygen, water, and pH, which are the most common chemical factors). Microbiological attack may also affect certain polymers, though in general most of polymers used for carrying load in soil reinforcement applications are not affected by this. Wall application limits, soil aggressiveness, polymer requirements, and the calculation of long-term reinforcement strength are specifically described as follows:
(1) Structure Application Issues: Identification of applications for
which the consequences of poor performance or failure are severe In such applications, a single default reduction factor shall not be used for final design.
(2) Determination of Soil Aggressiveness: Soil aggressiveness for geosynthetics is assessed based on the soil pH, gradation, plasticity, organic content, and in-ground temperature. Soil shall be defined as nonaggressive if the following criteria are met:
a. The pH, is 4.5 to 9 for permanent applications and 3 to 10 for
temporary applications, b. The maximum soil particle size is less than 20 mm (0.75 inches) c. The soil organic content, for material finer than the 2 mm (No.
10) sieve, is 1% or less, and d. The design temperature at the wall site, less than 30° C (85° F)
for permanent applications and 35° C (95° F) for temporary applications.
15-8
(3) Polymer Requirements: Polymers which are likely to have good resistance to long-term chemical degradation shall be used if a single default reduction factor is to be used, to minimize the risk of the occurrence of significant long-term degradation
(4) Calculation of Long-Term Reinforcement Strength: For ultimate limit state conditions,
where,
RF = RFID x RFCR x RFD
Tal is the long-term tensile strength required to prevent rupture calculated on a load per unit of reinforcement width basis, Tult, is the ultimate tensile strength of the reinforcement determined from wide width tensile tests for geotextiles and geogrids, or rib tensile test for geogrids (GRI:GG1, but at a strain rate of 10%/minute), RF is a combined reduction factor to account for potential long-term degradation due to installation damage, creep, and chemical aging, RFID is a strength reduction factor to account for installation damage to the reinforcement, RFCR is a strength reduction factor to prevent long-term creep rupture of the reinforcement, and RFD is a strength reduction factor to prevent rupture of the reinforcement due to chemical and biological degradation.
2) Allowable Stresses
a) Steel Reinforcement The allowable tensile stress for steel strip reinforcement, in the wall backfill away from the wall face connections, of 0.55Fy. For grid reinforcing members connected to a rigid facing element (e.g., a concrete panel or block), the allowable tensile stress shall be reduced to 0.48Fy
The allowable reinforcement tension is determined by multiplying the allowable stress by the cross-sectional area of the steel reinforcement after corrosion losses
b) Geosynthetic Reinforcements
The allowable tensile load per unit of reinforcement width for geosynthetic reinforcements for permanent structures (i.e., design lives of 75 to 100 years) is determined as
where, FS is a global safety factor which accounts for uncertainties in structure geometry, fill properties, externally applied loads, the potential for local overstress due to load nonuniformities, and uncertainties in long-term reinforcement strength. For ultimate limit state conditions for permanent walls, a FS of 1.5 shall be used.
Tal = Tult
RF
Tal = Tult
FS x RF
15-9
15.2.8 Design of Facing Elements
The facing elements shall be designed to resist potential compaction stresses occurring near the wall face during erection of the wall. The facing elements shall be stabilized such that they do not deflect laterally or bulge beyond the established tolerance.
1) Design of Stiff or Rigid Concrete, Steel and Timber Facings
Facing elements shall be structurally designed for conrete, steel, and timber facings.
2) Design of Flexible Wall Facings If welded wire, expanded metal, or similar facing panels are used, they shall be designed in a manner which prevents the occurrence of excessive bulging as backfill behind the facing elements compresses due to compaction stresses or self weight of the backfill.
For segmental concrete facing blocks, facing stability calculations shall include an evaluation of the maximum vertical spacing between reinforcement layers, the maximum allowable facing height above the uppermost reinforcement layer, inter-unit shear capacity, and resistance of the facing to bulging. The maximum vertical spacing between reinforcement layers shall be limited to twice the width, Wu of the proposed segmental concrete facing unit or 0.8 meter (31 inches), whichever is less, and the maximum facing height above the uppermost reinforcement layer and the maximum depth of facing below the bottom reinforcement layer should be limited to the width, Wu of the proposed segmental concrete facing unit.
3) Corrosion Issues for MSE Facing Design
Steel to steel contact between the soil reinforcement connections and the concrete facing steel reinforcement shall be prevented so that contact between dissimilar metals (e.g., bare facing reinforcement steel and galvanized soil reinforcement steel) does not occur. Steel to steel contact in this case can be prevented through the placement of a nonconductive material between the soil reinforcement face connection and the facing concrete reinforcing steel.
15.2.9 Seismic Design for Lateral Deformation
1) External Stability Stability computations (i.e., sliding, overturning, and bearing capacity) shall be made by including, in addition to static forces, the horizontal inertial force (PIR) acting simultaneously with 50% of the dynamic horizontal thrust (PAE) to determine the total force applied to the wall. The dynamic horizontal thrust PAE is evaluated using the pseudo-static Mononobe-Okabe method and is applied to the back surface of the reinforced fill at a height of 0.6H from the base for level backfill conditions. The horizontal inertial force PIR is determined by multiplying the weight of the reinforced wall mass, with dimensions of H (wall height) and 0.5H, assuming horizontal backfill conditions, by the acceleration Am. PIR is located at the centroid of the
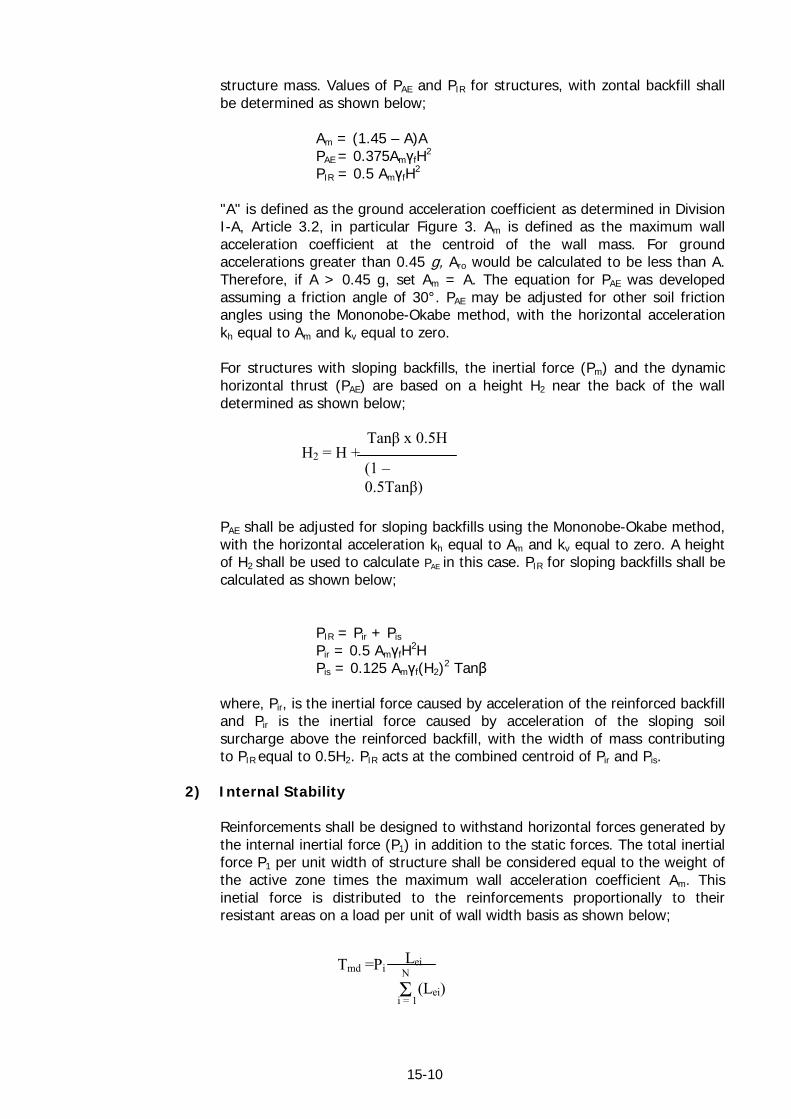
15-10
structure mass. Values of PAE and PIR for structures, with zontal backfill shall be determined as shown below;
Am = (1.45 – A)A PAE = 0.375AmγfH2 PIR = 0.5 AmγfH2
"A" is defined as the ground acceleration coefficient as determined in Division I-A, Article 3.2, in particular Figure 3. Am is defined as the maximum wall acceleration coefficient at the centroid of the wall mass. For ground accelerations greater than 0.45 g, Aro would be calculated to be less than A. Therefore, if A > 0.45 g, set Am = A. The equation for PAE was developed assuming a friction angle of 30°. PAE may be adjusted for other soil friction angles using the Mononobe-Okabe method, with the horizontal acceleration kh equal to Am and kv equal to zero.
For structures with sloping backfills, the inertial force (Pm) and the dynamic horizontal thrust (PAE) are based on a height H2 near the back of the wall determined as shown below;
PAE shall be adjusted for sloping backfills using the Mononobe-Okabe method, with the horizontal acceleration kh equal to Am and kv equal to zero. A height of H2 shall be used to calculate PAE in this case. PIR for sloping backfills shall be calculated as shown below;
PIR = Pir + Pis Pir = 0.5 AmγfH2H Pis = 0.125 Amγf(H2)2 Tanβ
where, Pir, is the inertial force caused by acceleration of the reinforced backfill and Pir is the inertial force caused by acceleration of the sloping soil surcharge above the reinforced backfill, with the width of mass contributing to PIR equal to 0.5H2. PIR acts at the combined centroid of Pir and Pis.
2) Internal Stability
Reinforcements shall be designed to withstand horizontal forces generated by the internal inertial force (P1) in addition to the static forces. The total inertial force P1 per unit width of structure shall be considered equal to the weight of the active zone times the maximum wall acceleration coefficient Am. This inetial force is distributed to the reinforcements proportionally to their resistant areas on a load per unit of wall width basis as shown below;
H2 = H +Tanβ x 0.5H
(1 – 0.5Tanβ)
Tmd = Pi Lei
Σ N
i = 1(Lei)
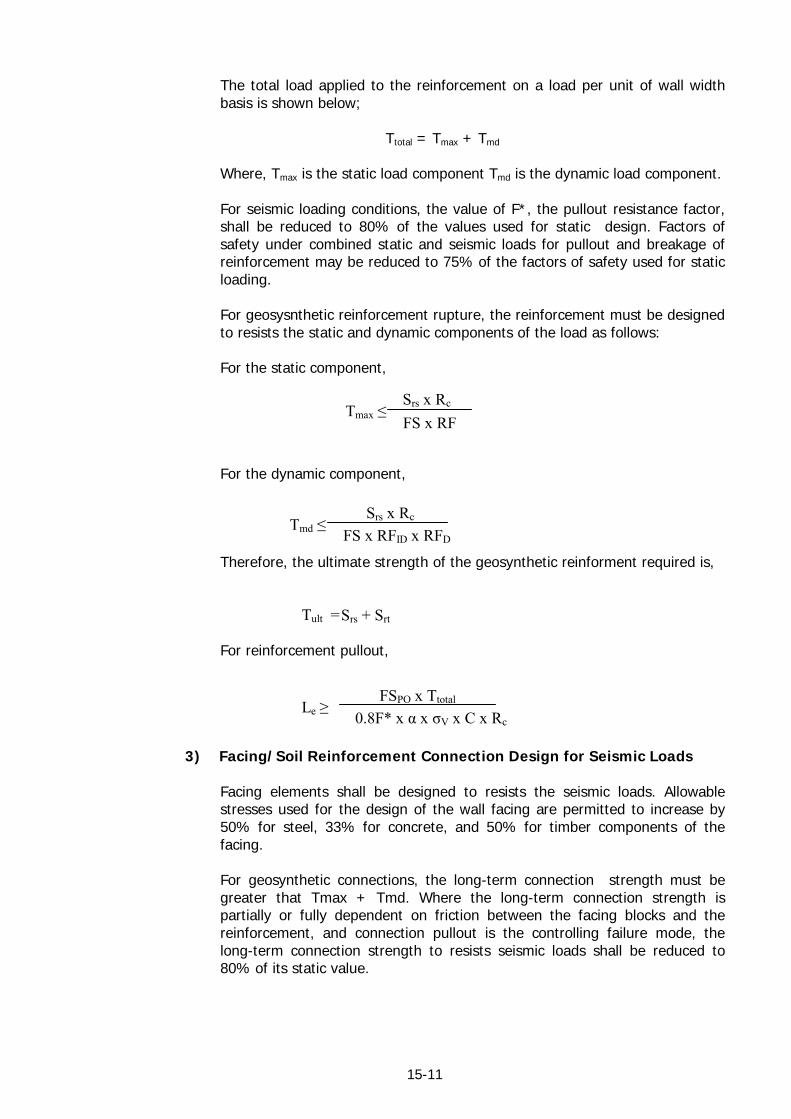
15-11
The total load applied to the reinforcement on a load per unit of wall width basis is shown below;
Ttotal = Tmax + Tmd
Where, Tmax is the static load component Tmd is the dynamic load component.
For seismic loading conditions, the value of F*, the pullout resistance factor, shall be reduced to 80% of the values used for static design. Factors of safety under combined static and seismic loads for pullout and breakage of reinforcement may be reduced to 75% of the factors of safety used for static loading.
For geosysnthetic reinforcement rupture, the reinforcement must be designed to resists the static and dynamic components of the load as follows: For the static component,
For the dynamic component,
Therefore, the ultimate strength of the geosynthetic reinforment required is,
For reinforcement pullout,
3) Facing/Soil Reinforcement Connection Design for Seismic Loads Facing elements shall be designed to resists the seismic loads. Allowable stresses used for the design of the wall facing are permitted to increase by 50% for steel, 33% for concrete, and 50% for timber components of the facing.
For geosynthetic connections, the long-term connection strength must be greater that Tmax + Tmd. Where the long-term connection strength is partially or fully dependent on friction between the facing blocks and the reinforcement, and connection pullout is the controlling failure mode, the long-term connection strength to resists seismic loads shall be reduced to 80% of its static value.
FS x RF Tmax ≤
Srs x Rc
Tmd ≤ Srs x Rc
FS x RFID x RFD
Tult = Srs + Srt
Le ≥ FSPO x Ttotal
0.8F* x α x σV x C x Rc

15-12
15.2.10 Determination of Lateral Wall Displacement
Lateral wall displacements are a function of overall structure stiffness, compaction intensity, soil type, reinforcement-to-facing connections, and deformability of the facing system. If significant vertical settlement is anticipated or heavy surcharges are present, lateral displacements could be considerably greater.
15.2.11 Drainage
MSE walls in cut areas and side-hills fills with established ground water levels should be constructed with drainage blankets in back of and beneath the reinforced zone. Internal drainage measures should be considered for all structures to prevent saturation of the reinforced back-fill. Concentrated horizontal loads to the top of the wall shall also be distributed within the reinforced soil mass.
15.2.12 Special Loading Conditions
1) Concentrated Dead Loads Concentrated dead loads shall be incorporated into the internal and external stability design by using a simplified uniform vertical distribution of 2 vertical to 1 horizontal to determine the vertical component of stress with depth within the reinforced soil mass. Concentrated horizontal loads at the top of the wall shall also be distributed within the reinforced soil mass. Depending on the size and location of the concentrated dead load, the location of the boundary between the active and resistant zones may need to be adjusted. When dead load surcharges above or within the reinforced soil zone are present, the reinforcement connections to the wall face shall be designed for 100% of Tmax (or Ttotal for seismic loads) throughout the height of the wall.
If concentrated dead loads are located behind the reinforced soil mass, they shall be distributed in the same way as would be done within the reinforced soil mass. The vertical stress distributed behind the reinforced zone in this way shall be multiplied by Kaf to determine the effect this surcharge load has on external stability. The concentrated horizontal stree distributed behind the wall can be taken into account directly.
2) Traffic Loads and Barriers
Traffic loads shall be treated as uniform surcharges loads. The live load surcharges pressure shall be equal to not less than 0.6 meter (2 feet) of earth. Parapets and traffic barriers, constructed over or in live with the front face of the wall shall be designed to resists overturning moments by their own mass. Base slabs shall not have any transverse joints except construction joints, and adjacent slabs shall be joined by shears dowels. The upper row(s) of soil reinforcement shall have sufficient tensile capacity to resists a concentrated horizontal load of 45 kN (10 kips) distributed over a barrier length of 1.5 meters (5 feet). This force distribution accommodates the local peaking of force in the soil reinforcements in the vicinity of the concentrated load. For checking pullout safety of the reinforcements, the lateral traffic impact loads shall be distributed to the upper soil reinforcement and facing units, assuming bf equal to the width of the base slab. The full length of reinforcements shall be considered effective in resisting pullout due to impact
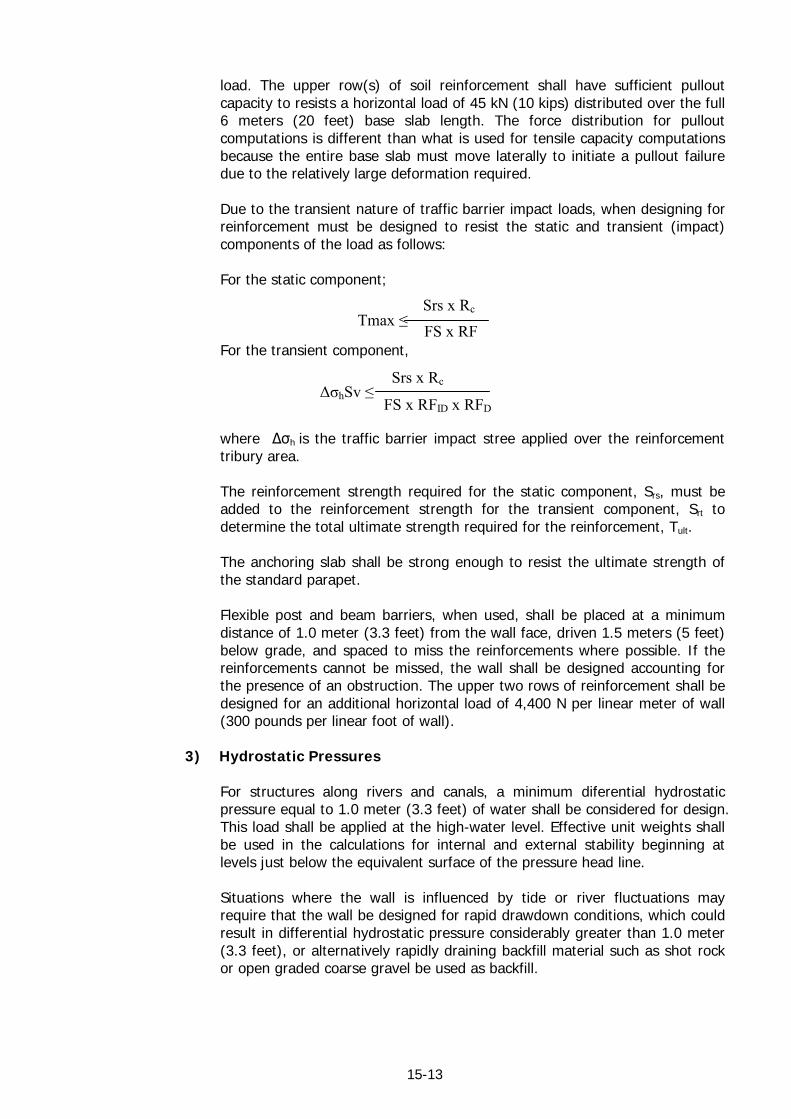
15-13
load. The upper row(s) of soil reinforcement shall have sufficient pullout capacity to resists a horizontal load of 45 kN (10 kips) distributed over the full 6 meters (20 feet) base slab length. The force distribution for pullout computations is different than what is used for tensile capacity computations because the entire base slab must move laterally to initiate a pullout failure due to the relatively large deformation required.
Due to the transient nature of traffic barrier impact loads, when designing for reinforcement must be designed to resist the static and transient (impact) components of the load as follows:
For the static component; For the transient component,
where ∆σh is the traffic barrier impact stree applied over the reinforcement tribury area.
The reinforcement strength required for the static component, Srs, must be added to the reinforcement strength for the transient component, Srt to determine the total ultimate strength required for the reinforcement, Tult. The anchoring slab shall be strong enough to resist the ultimate strength of the standard parapet. Flexible post and beam barriers, when used, shall be placed at a minimum distance of 1.0 meter (3.3 feet) from the wall face, driven 1.5 meters (5 feet) below grade, and spaced to miss the reinforcements where possible. If the reinforcements cannot be missed, the wall shall be designed accounting for the presence of an obstruction. The upper two rows of reinforcement shall be designed for an additional horizontal load of 4,400 N per linear meter of wall (300 pounds per linear foot of wall).
3) Hydrostatic Pressures
For structures along rivers and canals, a minimum diferential hydrostatic pressure equal to 1.0 meter (3.3 feet) of water shall be considered for design. This load shall be applied at the high-water level. Effective unit weights shall be used in the calculations for internal and external stability beginning at levels just below the equivalent surface of the pressure head line. Situations where the wall is influenced by tide or river fluctuations may require that the wall be designed for rapid drawdown conditions, which could result in differential hydrostatic pressure considerably greater than 1.0 meter (3.3 feet), or alternatively rapidly draining backfill material such as shot rock or open graded coarse gravel be used as backfill.
Tmax ≤ Srs x Rc FS x RF
∆σhSv ≤Srs x Rc
FS x RFID x RFD
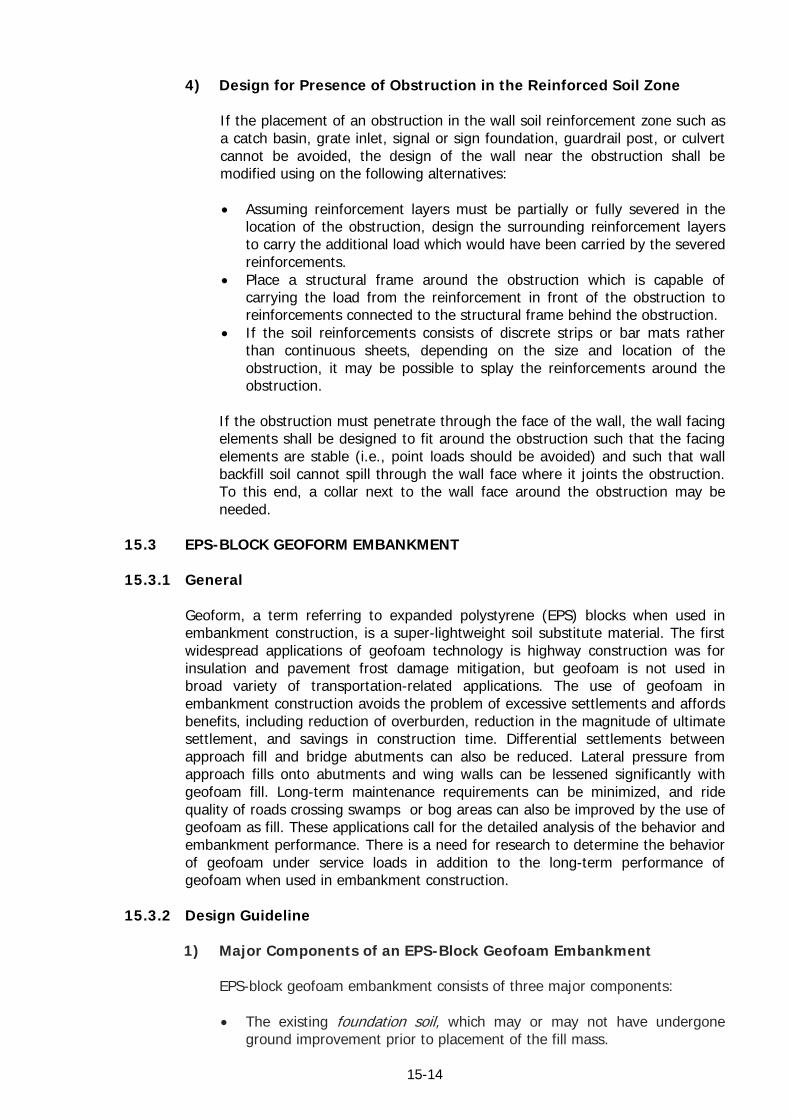
15-14
4) Design for Presence of Obstruction in the Reinforced Soil Zone If the placement of an obstruction in the wall soil reinforcement zone such as a catch basin, grate inlet, signal or sign foundation, guardrail post, or culvert cannot be avoided, the design of the wall near the obstruction shall be modified using on the following alternatives:
• Assuming reinforcement layers must be partially or fully severed in the
location of the obstruction, design the surrounding reinforcement layers to carry the additional load which would have been carried by the severed reinforcements.
• Place a structural frame around the obstruction which is capable of carrying the load from the reinforcement in front of the obstruction to reinforcements connected to the structural frame behind the obstruction.
• If the soil reinforcements consists of discrete strips or bar mats rather than continuous sheets, depending on the size and location of the obstruction, it may be possible to splay the reinforcements around the obstruction.
If the obstruction must penetrate through the face of the wall, the wall facing elements shall be designed to fit around the obstruction such that the facing elements are stable (i.e., point loads should be avoided) and such that wall backfill soil cannot spill through the wall face where it joints the obstruction. To this end, a collar next to the wall face around the obstruction may be needed.
15.3 EPS-BLOCK GEOFORM EMBANKMENT 15.3.1 General
Geoform, a term referring to expanded polystyrene (EPS) blocks when used in embankment construction, is a super-lightweight soil substitute material. The first widespread applications of geofoam technology is highway construction was for insulation and pavement frost damage mitigation, but geofoam is not used in broad variety of transportation-related applications. The use of geofoam in embankment construction avoids the problem of excessive settlements and affords benefits, including reduction of overburden, reduction in the magnitude of ultimate settlement, and savings in construction time. Differential settlements between approach fill and bridge abutments can also be reduced. Lateral pressure from approach fills onto abutments and wing walls can be lessened significantly with geofoam fill. Long-term maintenance requirements can be minimized, and ride quality of roads crossing swamps or bog areas can also be improved by the use of geofoam as fill. These applications call for the detailed analysis of the behavior and embankment performance. There is a need for research to determine the behavior of geofoam under service loads in addition to the long-term performance of geofoam when used in embankment construction.
15.3.2 Design Guideline
1) Major Components of an EPS-Block Geofoam Embankment EPS-block geofoam embankment consists of three major components:
• The existing foundation soil, which may or may not have undergone
ground improvement prior to placement of the fill mass.
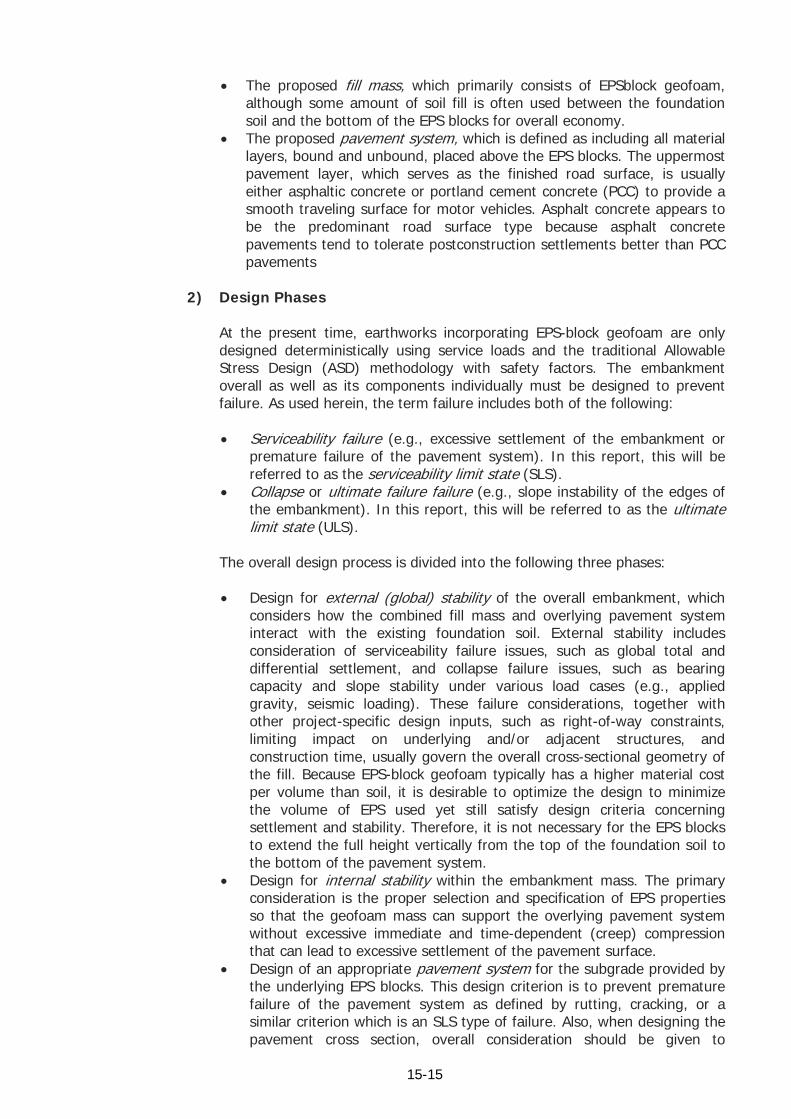
15-15
• The proposed fill mass, which primarily consists of EPSblock geofoam, although some amount of soil fill is often used between the foundation soil and the bottom of the EPS blocks for overall economy.
• The proposed pavement system, which is defined as including all material layers, bound and unbound, placed above the EPS blocks. The uppermost pavement layer, which serves as the finished road surface, is usually either asphaltic concrete or portland cement concrete (PCC) to provide a smooth traveling surface for motor vehicles. Asphalt concrete appears to be the predominant road surface type because asphalt concrete pavements tend to tolerate postconstruction settlements better than PCC pavements
2) Design Phases
At the present time, earthworks incorporating EPS-block geofoam are only designed deterministically using service loads and the traditional Allowable Stress Design (ASD) methodology with safety factors. The embankment overall as well as its components individually must be designed to prevent failure. As used herein, the term failure includes both of the following:
• Serviceability failure (e.g., excessive settlement of the embankment or
premature failure of the pavement system). In this report, this will be referred to as the serviceability limit state (SLS).
• Collapse or ultimate failure failure (e.g., slope instability of the edges of the embankment). In this report, this will be referred to as the ultimate limit state (ULS).
The overall design process is divided into the following three phases:
• Design for external (global) stability of the overall embankment, which
considers how the combined fill mass and overlying pavement system interact with the existing foundation soil. External stability includes consideration of serviceability failure issues, such as global total and differential settlement, and collapse failure issues, such as bearing capacity and slope stability under various load cases (e.g., applied gravity, seismic loading). These failure considerations, together with other project-specific design inputs, such as right-of-way constraints, limiting impact on underlying and/or adjacent structures, and construction time, usually govern the overall cross-sectional geometry of the fill. Because EPS-block geofoam typically has a higher material cost per volume than soil, it is desirable to optimize the design to minimize the volume of EPS used yet still satisfy design criteria concerning settlement and stability. Therefore, it is not necessary for the EPS blocks to extend the full height vertically from the top of the foundation soil to the bottom of the pavement system.
• Design for internal stability within the embankment mass. The primary consideration is the proper selection and specification of EPS properties so that the geofoam mass can support the overlying pavement system without excessive immediate and time-dependent (creep) compression that can lead to excessive settlement of the pavement surface.
• Design of an appropriate pavement system for the subgrade provided by the underlying EPS blocks. This design criterion is to prevent premature failure of the pavement system as defined by rutting, cracking, or a similar criterion which is an SLS type of failure. Also, when designing the pavement cross section, overall consideration should be given to
15-16
providing sufficient support, either by direct embedment or by structural anchorage, for any road hardware (e.g., guardrails, barriers, median dividers, lighting, signage, and utilities).
3) Design Procedure
The design procedure for an EPS-block geofoam roadway embankment over soft soil considers the interaction between the three major components of the embankment: foundation soil, fill mass, and pavement system. Because of this interaction, the three-phased design procedure involves interconnected analyses among these three components. For example, some issues of pavement system design act oppositely to some of the design issues involving internal and external stability of a geofoam embankment. Additionally, the dead load imposed by the pavement system and fill mass may decrease the factor of safety of some failure mechanisms. Because of the interaction among these components, overall design optimization of a roadway embankment incorporating EPSblock geofoam requires an iterative analysis to achieve a technically acceptable design at the lowest overall cost. The design procedure considers a pavement system with the minimum required thickness, a fill mass with the minimum thickness of EPS-block geofoam, and the use of an EPS block with the lowest possible density. Therefore, the design procedure will produce a cost-efficient design.
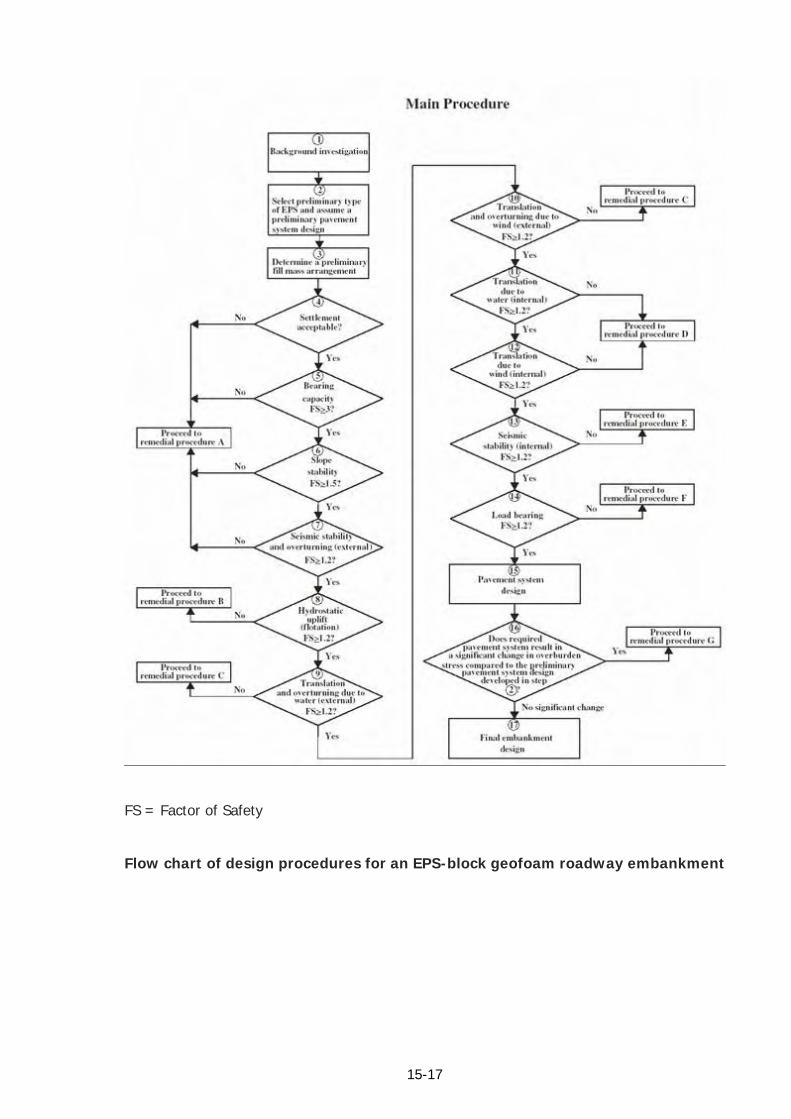
15-17
FS = Factor of Safety
Flow chart of design procedures for an EPS-block geofoam roadway embankment
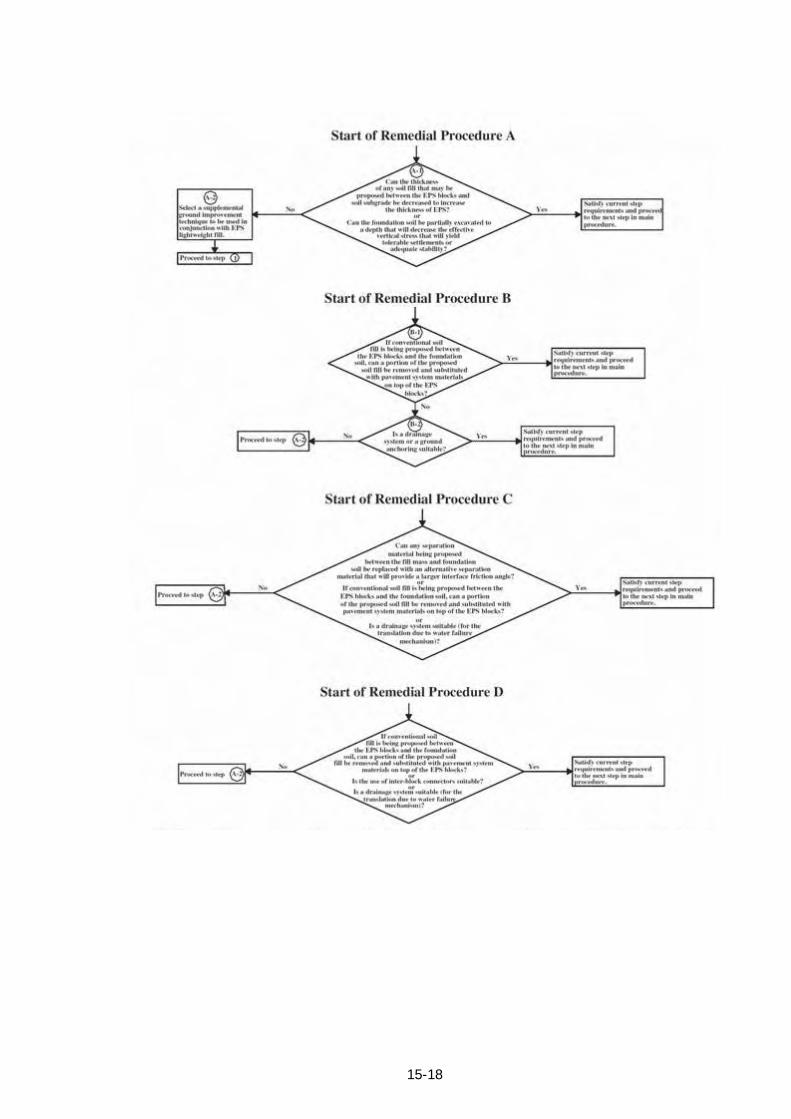
15-18
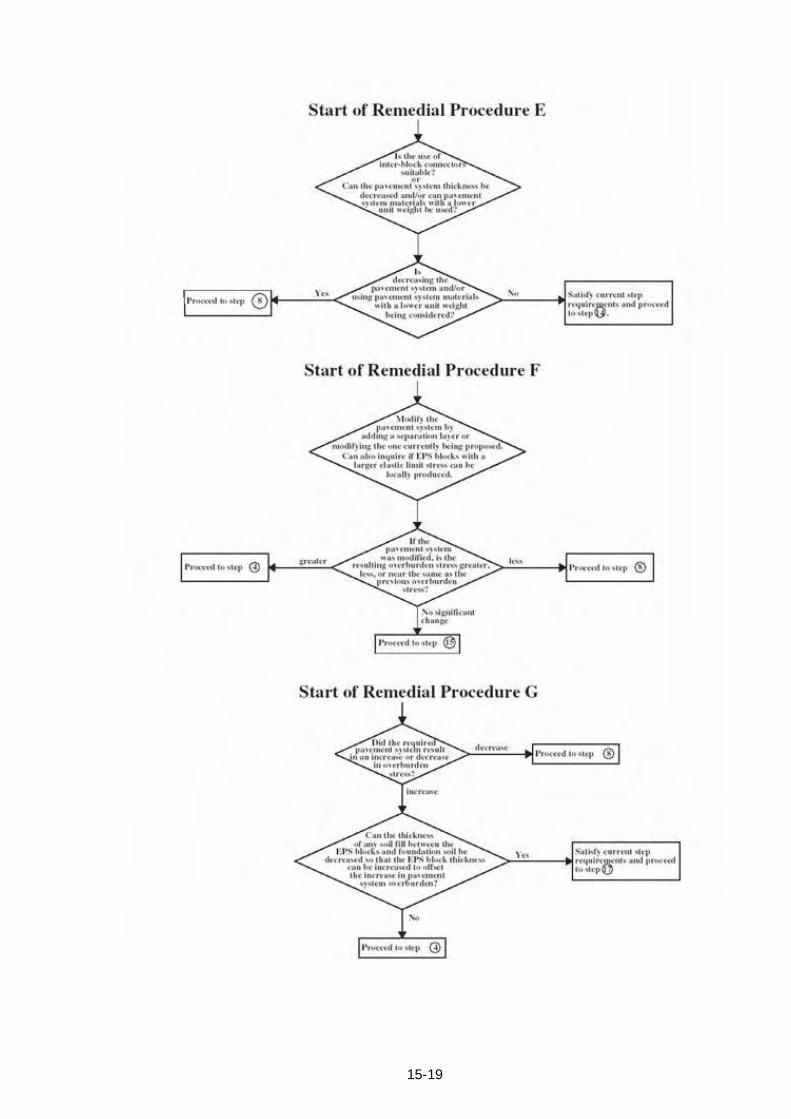
15-19
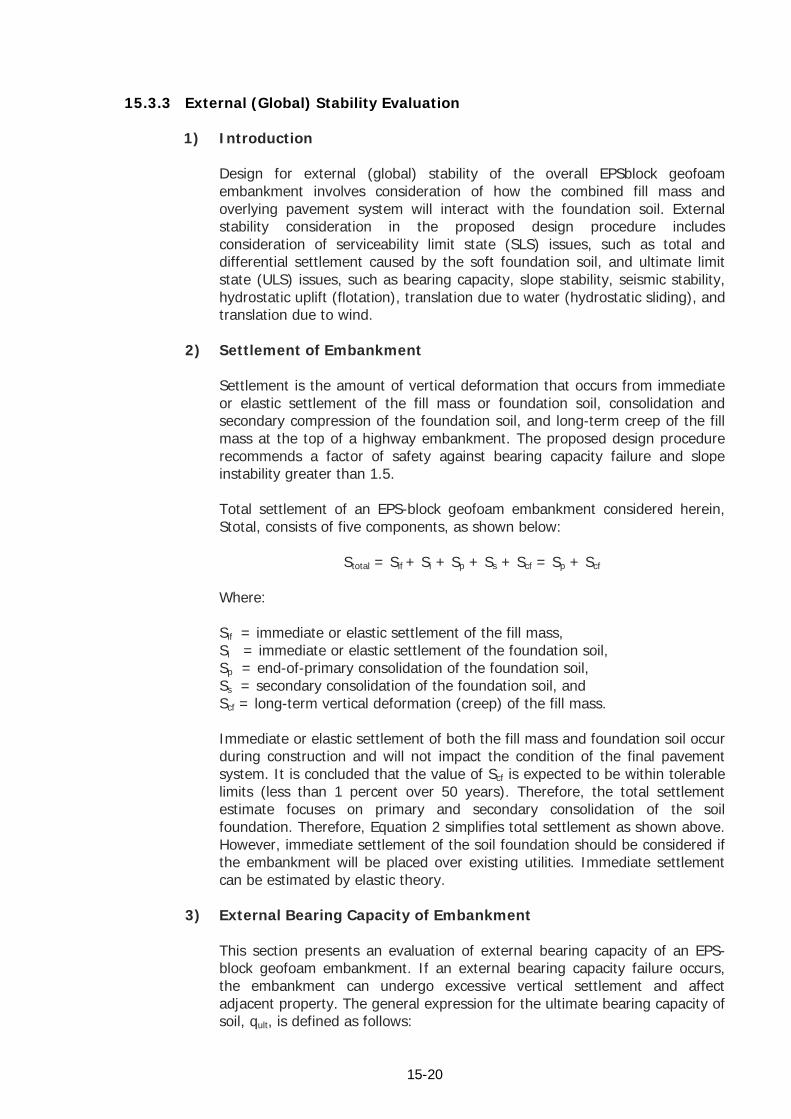
15-20
15.3.3 External (Global) Stability Evaluation
1) Introduction Design for external (global) stability of the overall EPSblock geofoam embankment involves consideration of how the combined fill mass and overlying pavement system will interact with the foundation soil. External stability consideration in the proposed design procedure includes consideration of serviceability limit state (SLS) issues, such as total and differential settlement caused by the soft foundation soil, and ultimate limit state (ULS) issues, such as bearing capacity, slope stability, seismic stability, hydrostatic uplift (flotation), translation due to water (hydrostatic sliding), and translation due to wind.
2) Settlement of Embankment
Settlement is the amount of vertical deformation that occurs from immediate or elastic settlement of the fill mass or foundation soil, consolidation and secondary compression of the foundation soil, and long-term creep of the fill mass at the top of a highway embankment. The proposed design procedure recommends a factor of safety against bearing capacity failure and slope instability greater than 1.5. Total settlement of an EPS-block geofoam embankment considered herein, Stotal, consists of five components, as shown below:
Stotal = Sif + Si + Sp + Ss + Scf = Sp + Scf Where: Sif = immediate or elastic settlement of the fill mass, Si = immediate or elastic settlement of the foundation soil, Sp = end-of-primary consolidation of the foundation soil, Ss = secondary consolidation of the foundation soil, and Scf = long-term vertical deformation (creep) of the fill mass. Immediate or elastic settlement of both the fill mass and foundation soil occur during construction and will not impact the condition of the final pavement system. It is concluded that the value of Scf is expected to be within tolerable limits (less than 1 percent over 50 years). Therefore, the total settlement estimate focuses on primary and secondary consolidation of the soil foundation. Therefore, Equation 2 simplifies total settlement as shown above. However, immediate settlement of the soil foundation should be considered if the embankment will be placed over existing utilities. Immediate settlement can be estimated by elastic theory.
3) External Bearing Capacity of Embankment This section presents an evaluation of external bearing capacity of an EPS-block geofoam embankment. If an external bearing capacity failure occurs, the embankment can undergo excessive vertical settlement and affect adjacent property. The general expression for the ultimate bearing capacity of soil, qult, is defined as follows:

15-21
qult = cNc + γDfNq + γBwNγ Where:
c = Mohr-Coulomb shear strength parameter (i.e., cohesion), kPa; Nc, Nγ, Nq = Terzaghi shearing resistance bearing capacity factors; γ = unit weight of soil, kN/m3; Bw = bottom width of embankment, m; and Df = depth of embedment, m.
It is anticipated that most, if not all, EPS-block geofoam embankments will be founded on soft, saturated cohesive soils because traditional fill material cannot be used in this situation without pretreatment. Narrowing the type of foundation soil to soft, saturated cohesive soils that allow c to equal the undrained strength, su, of the foundation soil, as well as assuming the embankment is placed on the ground surface, simplifies Equation to the following:
Where
Dw = depth from ground surface to the water table, L = length of the embankment, and Df = zero because the embankment is founded on the ground surface. For design purposes, an EPS-block geofoam embankment is assumed to be modeled as a continuous footing; thus, the length of the embankment can be assumed to be significantly larger than the width such that the term Bw/L approaches zero.
4) External Seismic Stability of Embankment
Overturning. For tall and narrow vertical embankments, the overturning of the entire embankment at the interface between the bottom of the assemblage of EPS blocks and the underlying foundation soil as a result of pseudo-static horizontal forces should be considered. These horizontal forces create an overturning moment about the toe at Point O, as shown in the following Figure. Vertical loads such as the weight of the EPS blocks and the pavement system and traffic surcharges will provide a stabilizing moment. A factor of safety against overturning of 1.2 is recommended for design purposes because overturning due to
Dr qult = SuNc = 1 + 0.2
Bw L 1 + 0.2 Dw
= 5su
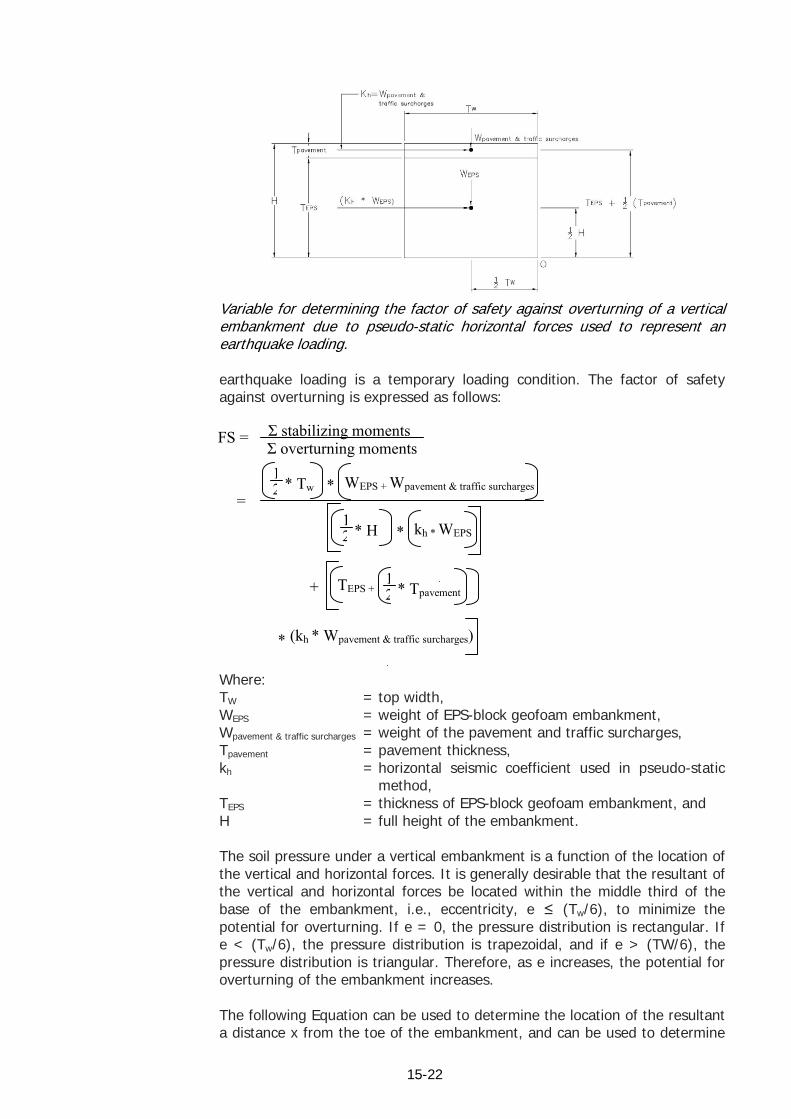
15-22
Variable for determining the factor of safety against overturning of a vertical embankment due to pseudo-static horizontal forces used to represent an earthquake loading. earthquake loading is a temporary loading condition. The factor of safety against overturning is expressed as follows: Where: TW = top width, WEPS = weight of EPS-block geofoam embankment, Wpavement & traffic surcharges = weight of the pavement and traffic surcharges, Tpavement = pavement thickness, kh = horizontal seismic coefficient used in pseudo-static
method, TEPS = thickness of EPS-block geofoam embankment, and H = full height of the embankment. The soil pressure under a vertical embankment is a function of the location of the vertical and horizontal forces. It is generally desirable that the resultant of the vertical and horizontal forces be located within the middle third of the base of the embankment, i.e., eccentricity, e ≤ (Tw/6), to minimize the potential for overturning. If e = 0, the pressure distribution is rectangular. If e < (Tw/6), the pressure distribution is trapezoidal, and if e > (TW/6), the pressure distribution is triangular. Therefore, as e increases, the potential for overturning of the embankment increases. The following Equation can be used to determine the location of the resultant a distance x from the toe of the embankment, and can be used to determine
FS = Σ stabilizing moments Σ overturning moments
=
12 * Tw * WEPS + Wpavement & traffic surcharges
12 * H * kh * WEPS
12 * Tpavement TEPS + +
* (kh * Wpavement & traffic surcharges)
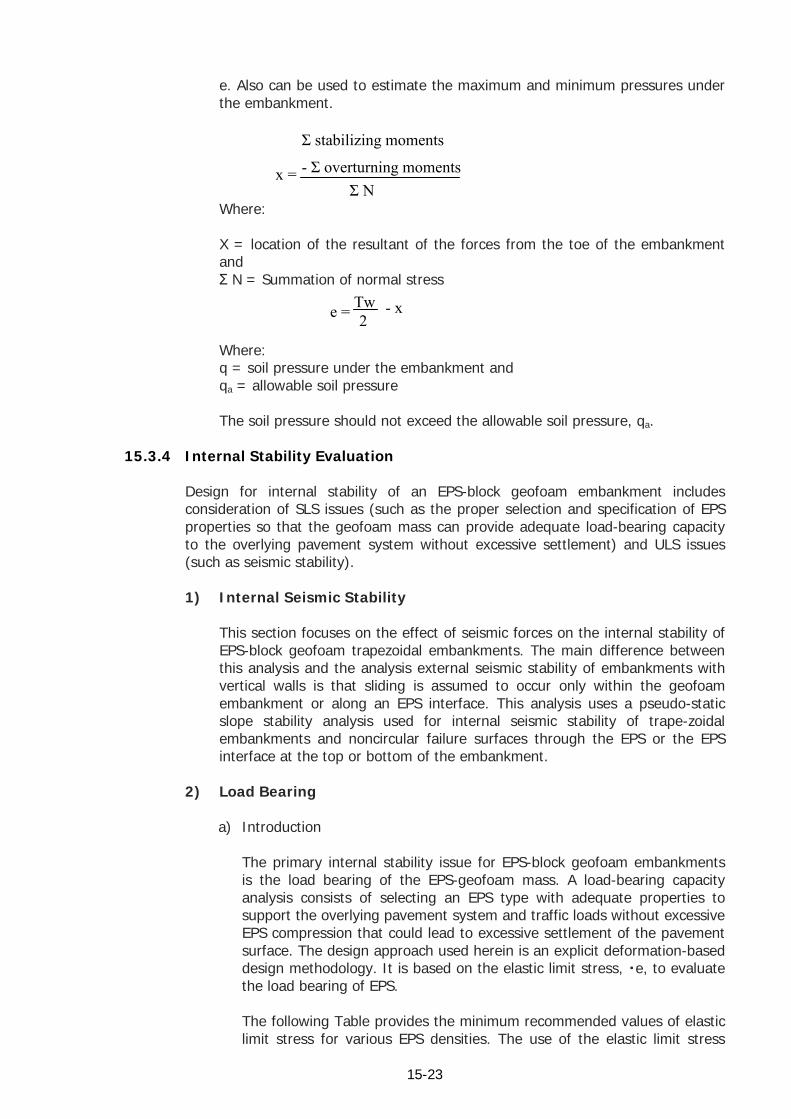
15-23
e. Also can be used to estimate the maximum and minimum pressures under the embankment. Where: X = location of the resultant of the forces from the toe of the embankment and Σ N = Summation of normal stress Where: q = soil pressure under the embankment and qa = allowable soil pressure The soil pressure should not exceed the allowable soil pressure, qa.
15.3.4 Internal Stability Evaluation
Design for internal stability of an EPS-block geofoam embankment includes consideration of SLS issues (such as the proper selection and specification of EPS properties so that the geofoam mass can provide adequate load-bearing capacity to the overlying pavement system without excessive settlement) and ULS issues (such as seismic stability).
1) Internal Seismic Stability
This section focuses on the effect of seismic forces on the internal stability of EPS-block geofoam trapezoidal embankments. The main difference between this analysis and the analysis external seismic stability of embankments with vertical walls is that sliding is assumed to occur only within the geofoam embankment or along an EPS interface. This analysis uses a pseudo-static slope stability analysis used for internal seismic stability of trape-zoidal embankments and noncircular failure surfaces through the EPS or the EPS interface at the top or bottom of the embankment.
2) Load Bearing
a) Introduction The primary internal stability issue for EPS-block geofoam embankments is the load bearing of the EPS-geofoam mass. A load-bearing capacity analysis consists of selecting an EPS type with adequate properties to support the overlying pavement system and traffic loads without excessive EPS compression that could lead to excessive settlement of the pavement surface. The design approach used herein is an explicit deformation-based design methodology. It is based on the elastic limit stress, e, to evaluate ・the load bearing of EPS. The following Table provides the minimum recommended values of elastic limit stress for various EPS densities. The use of the elastic limit stress
Σ stabilizing moments
- Σ overturning momentsx = Σ N
e = Tw2
- x
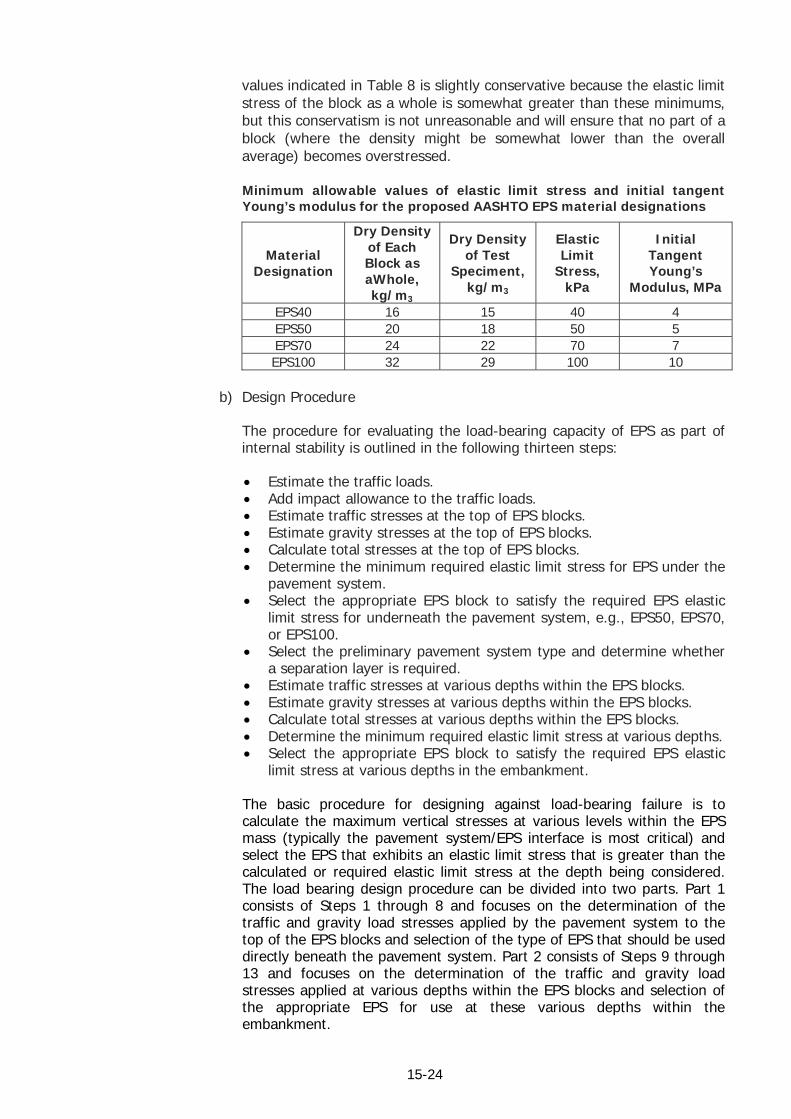
15-24
values indicated in Table 8 is slightly conservative because the elastic limit stress of the block as a whole is somewhat greater than these minimums, but this conservatism is not unreasonable and will ensure that no part of a block (where the density might be somewhat lower than the overall average) becomes overstressed.
Minimum allowable values of elastic limit stress and initial tangent Young’s modulus for the proposed AASHTO EPS material designations
Material Designation
Dry Density of Each Block as aWhole, kg/m3
Dry Density of Test
Speciment, kg/m3
Elastic Limit
Stress, kPa
Initial Tangent Young’s
Modulus, MPa
EPS40 16 15 40 4 EPS50 20 18 50 5 EPS70 24 22 70 7 EPS100 32 29 100 10
b) Design Procedure
The procedure for evaluating the load-bearing capacity of EPS as part of internal stability is outlined in the following thirteen steps:
• Estimate the traffic loads. • Add impact allowance to the traffic loads. • Estimate traffic stresses at the top of EPS blocks. • Estimate gravity stresses at the top of EPS blocks. • Calculate total stresses at the top of EPS blocks. • Determine the minimum required elastic limit stress for EPS under the
pavement system. • Select the appropriate EPS block to satisfy the required EPS elastic
limit stress for underneath the pavement system, e.g., EPS50, EPS70, or EPS100.
• Select the preliminary pavement system type and determine whether a separation layer is required.
• Estimate traffic stresses at various depths within the EPS blocks. • Estimate gravity stresses at various depths within the EPS blocks. • Calculate total stresses at various depths within the EPS blocks. • Determine the minimum required elastic limit stress at various depths. • Select the appropriate EPS block to satisfy the required EPS elastic
limit stress at various depths in the embankment.
The basic procedure for designing against load-bearing failure is to calculate the maximum vertical stresses at various levels within the EPS mass (typically the pavement system/EPS interface is most critical) and select the EPS that exhibits an elastic limit stress that is greater than the calculated or required elastic limit stress at the depth being considered. The load bearing design procedure can be divided into two parts. Part 1 consists of Steps 1 through 8 and focuses on the determination of the traffic and gravity load stresses applied by the pavement system to the top of the EPS blocks and selection of the type of EPS that should be used directly beneath the pavement system. Part 2 consists of Steps 9 through 13 and focuses on the determination of the traffic and gravity load stresses applied at various depths within the EPS blocks and selection of the appropriate EPS for use at these various depths within the embankment.

16-1
Chapter 16
UTILITY RELOCATION
16.1 GENERAL
Construction of flyover at urban area will be affected, in general, by the existing over head and underground utilities. Flyover structure, especially foundation, will conflict with those utilities without proper adjustment for both sides, structure and utilities. Based on the surveyed utility plan, location of flyover foundation has been decided and spanning of the bridge and positioning of pier/abutment foundation were decided. Since flyover centerline is established under the right-of-way constraint as well as alignment of the existing road, positioning of pier/abutment was more or less defined. Due to the above situation, relocation of utility will not be completely avoidable, however exact location of utilities cannot be identified during design stage, even by the concerned utility company. Actual relocation plan will be established based on the proofing excavation or test pit and layout of foundation on site. During the design stage, all possible informations have been gathered and coordination meeting with the following utility company has been held.
FLYOVER UTILITY COMPANY Merak
Balaraja
Nagreg
Gebang
Peterongan
1. PT. PLN – APJ, Banten 2. PT. TELKOM, Merak 3. PT. PLTU SURALAYA (Power Indonesia) 4. Dinas Tata Kota Kab. Cilegon 1. PT. PLN – APJ, Tangerang 2. PT. TELKOM, Tangerang 3. PDAM – TKR, Tangerang 4. PN. GAS NEGARA, District Banten 1. PT. Pertamina UPms IV Cilacap 2. PT. PLN – APJ, Majalaya 3. PT. TELKOM, Bandung 4. PT. KERETA API Daop2, Bandung 5. INDOSAT 1. PT. PLN – APJ, Cirebon 2. PT. TELKOM, Cirebon & Bandung 3. PU – CIPTA KARYA, Kab. Cirebon
1. PT. PLN – APJ, Mojokerto 2. PT. TELKOM, Jombang & Surabaya 3. PDAM, Jombang 4. PT. KERETA API Daop7, Madiun 5. INDOSAT & XL

16-2
Tanggulangin
1. PT. PLN – APJ, Surabaya 2. PT.TELKOM, Sidoarjo 3. PDAM, Surabaya & Sidoarjo 4. PT. KERETA API Daop8, Surabaya 5. INDOSAT 6. Dinas Pertamanan & Kebersihan Kab. Sidoarjo
16.2 UTILITIES AT MERAK FLYOVER
There are 5 categories of aboveground utility and 2 categories of underground utility for relocation and protection as shown below;
ABOVEGROUND
1 2 3 4 5
Relocation of Existing Electricity (PLN) Poles (Medium Voltage) Relocation of Existing Electricity (PLN) Poles (Low Voltage) Electric Cables Relocation of Existing Telephone Utility Poles Telephone Cables
UNDERGROUND
6 7
Electric and Optical Cable Relocation Underground Cable Duct with PVC dia. 4” (include telephone and electric cable)
The coordination meeting was held on September 08, 2006 and the followings are main issues and concerns; 1) PLN-APJ (Service and Network Area) of Banten:
a. Based on field investigation, existence of several posts at southern side of the flyover are verified, i.e.: • 11 meter concrete post and its accessories • SUTR cable A3C, 3 x 150 • SUTR cable XLPE, 200 • Twisted cable ø 70 mm x 4 • Twisted cable ø 35 mm
b. PLN has no objection to relocate the post for the flyover construction. c. ROW and flyover cross section data are used for the purpose of adjusting
the relocation of the transformer height. d. Crossing cable for replacing the JTR post through underground box duct.
2) PT. TELKOM
a. There are several telephone networks of Telkom affected by flyover construction, i.e: • Optic fiber 8 core = 1 unit – an air cable • Optic fiber 12 core = 1 unit – an air cable • Optic fiber 48 core = 1 unit – an air cable • KAP 100 = 3 unit – an air cable
b. Relocation of telephone networks in general can be done for the Merak flyover.
c. ROW and flyover cross section data are used for the purpose of positioning Telkom cable to check conflict with the flyover.
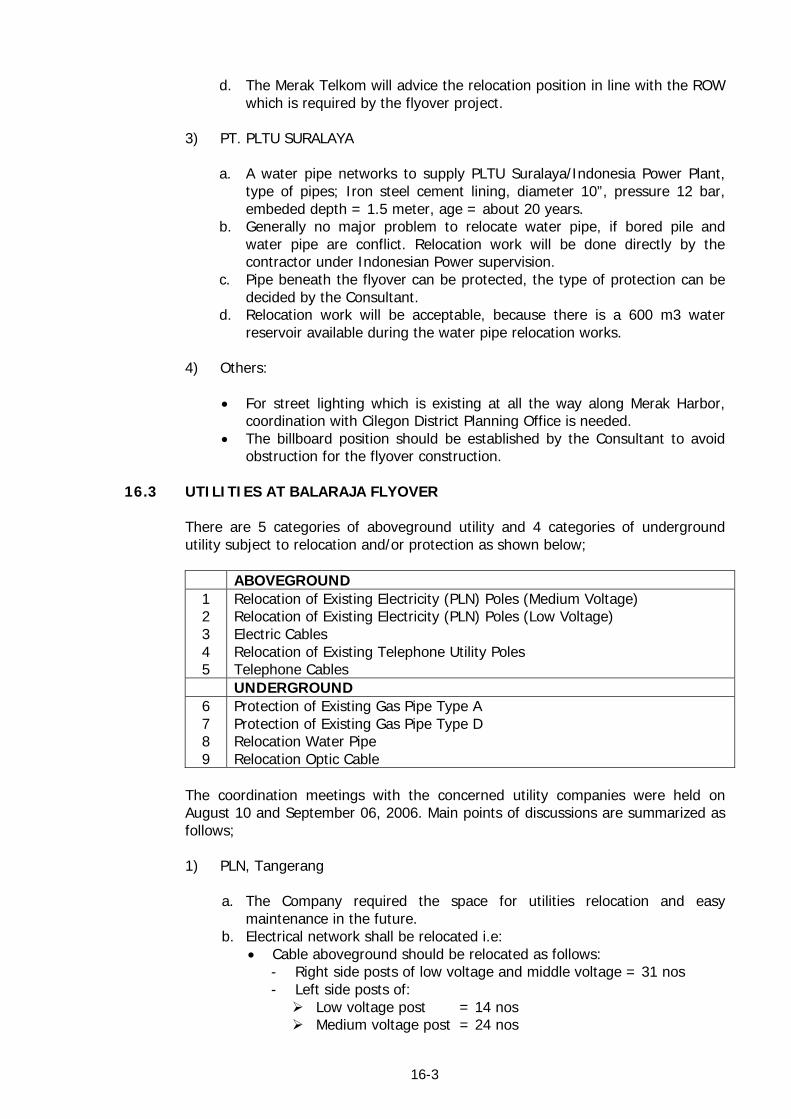
16-3
d. The Merak Telkom will advice the relocation position in line with the ROW which is required by the flyover project.
3) PT. PLTU SURALAYA
a. A water pipe networks to supply PLTU Suralaya/Indonesia Power Plant, type of pipes; Iron steel cement lining, diameter 10”, pressure 12 bar, embeded depth = 1.5 meter, age = about 20 years.
b. Generally no major problem to relocate water pipe, if bored pile and water pipe are conflict. Relocation work will be done directly by the contractor under Indonesian Power supervision.
c. Pipe beneath the flyover can be protected, the type of protection can be decided by the Consultant.
d. Relocation work will be acceptable, because there is a 600 m3 water reservoir available during the water pipe relocation works.
4) Others:
• For street lighting which is existing at all the way along Merak Harbor,
coordination with Cilegon District Planning Office is needed. • The billboard position should be established by the Consultant to avoid
obstruction for the flyover construction. 16.3 UTILITIES AT BALARAJA FLYOVER
There are 5 categories of aboveground utility and 4 categories of underground utility subject to relocation and/or protection as shown below;
ABOVEGROUND 1 2 3 4 5
Relocation of Existing Electricity (PLN) Poles (Medium Voltage) Relocation of Existing Electricity (PLN) Poles (Low Voltage) Electric Cables Relocation of Existing Telephone Utility Poles Telephone Cables
UNDERGROUND 6 7 8 9
Protection of Existing Gas Pipe Type A Protection of Existing Gas Pipe Type D Relocation Water Pipe Relocation Optic Cable
The coordination meetings with the concerned utility companies were held on August 10 and September 06, 2006. Main points of discussions are summarized as follows; 1) PLN, Tangerang
a. The Company required the space for utilities relocation and easy maintenance in the future.
b. Electrical network shall be relocated i.e: • Cable aboveground should be relocated as follows:
- Right side posts of low voltage and middle voltage = 31 nos - Left side posts of:
Low voltage post = 14 nos Medium voltage post = 24 nos
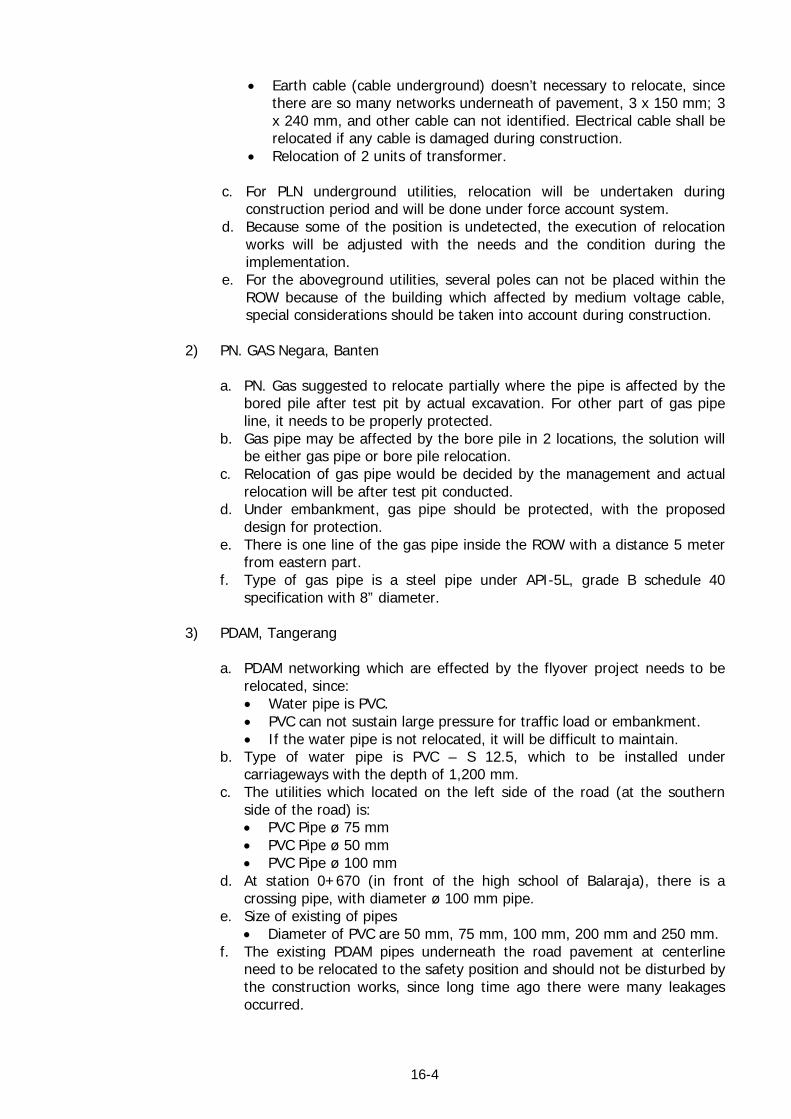
16-4
• Earth cable (cable underground) doesn’t necessary to relocate, since there are so many networks underneath of pavement, 3 x 150 mm; 3 x 240 mm, and other cable can not identified. Electrical cable shall be relocated if any cable is damaged during construction.
• Relocation of 2 units of transformer.
c. For PLN underground utilities, relocation will be undertaken during construction period and will be done under force account system.
d. Because some of the position is undetected, the execution of relocation works will be adjusted with the needs and the condition during the implementation.
e. For the aboveground utilities, several poles can not be placed within the ROW because of the building which affected by medium voltage cable, special considerations should be taken into account during construction.
2) PN. GAS Negara, Banten
a. PN. Gas suggested to relocate partially where the pipe is affected by the bored pile after test pit by actual excavation. For other part of gas pipe line, it needs to be properly protected.
b. Gas pipe may be affected by the bore pile in 2 locations, the solution will be either gas pipe or bore pile relocation.
c. Relocation of gas pipe would be decided by the management and actual relocation will be after test pit conducted.
d. Under embankment, gas pipe should be protected, with the proposed design for protection.
e. There is one line of the gas pipe inside the ROW with a distance 5 meter from eastern part.
f. Type of gas pipe is a steel pipe under API-5L, grade B schedule 40 specification with 8” diameter.
3) PDAM, Tangerang
a. PDAM networking which are effected by the flyover project needs to be relocated, since: • Water pipe is PVC. • PVC can not sustain large pressure for traffic load or embankment. • If the water pipe is not relocated, it will be difficult to maintain.
b. Type of water pipe is PVC – S 12.5, which to be installed under carriageways with the depth of 1,200 mm.
c. The utilities which located on the left side of the road (at the southern side of the road) is: • PVC Pipe ø 75 mm • PVC Pipe ø 50 mm • PVC Pipe ø 100 mm
d. At station 0+670 (in front of the high school of Balaraja), there is a crossing pipe, with diameter ø 100 mm pipe.
e. Size of existing of pipes • Diameter of PVC are 50 mm, 75 mm, 100 mm, 200 mm and 250 mm.
f. The existing PDAM pipes underneath the road pavement at centerline need to be relocated to the safety position and should not be disturbed by the construction works, since long time ago there were many leakages occurred.
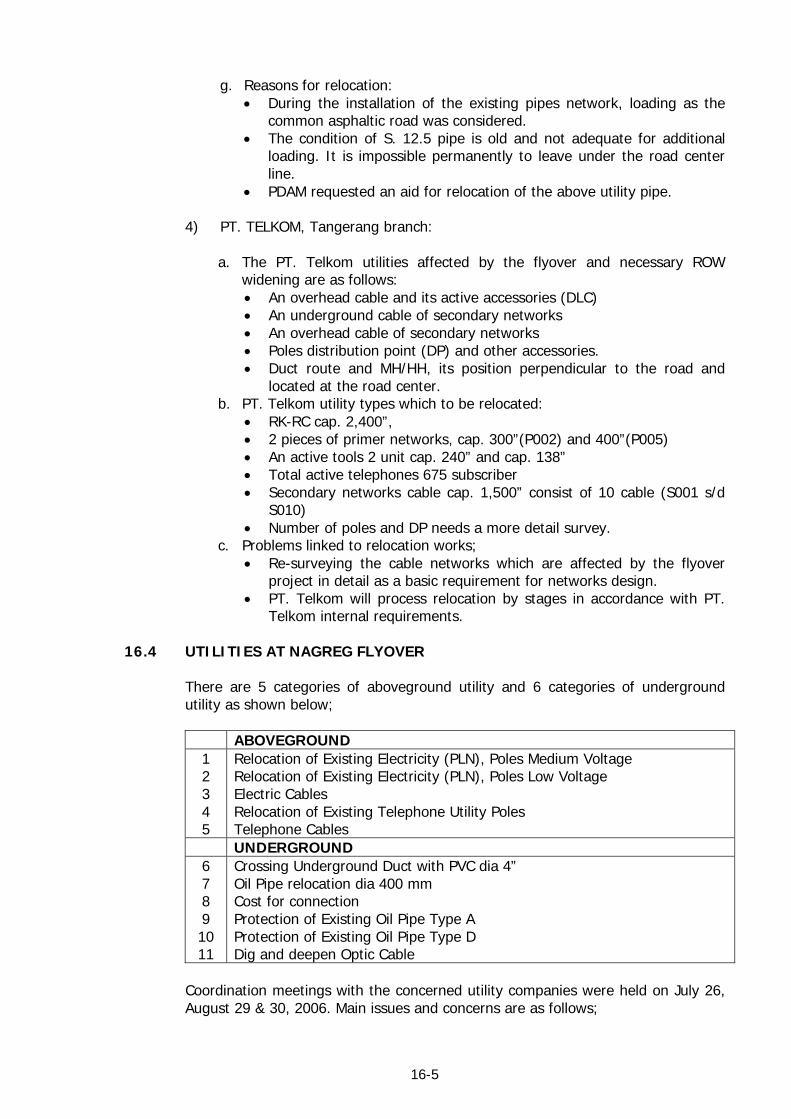
16-5
g. Reasons for relocation: • During the installation of the existing pipes network, loading as the
common asphaltic road was considered. • The condition of S. 12.5 pipe is old and not adequate for additional
loading. It is impossible permanently to leave under the road center line.
• PDAM requested an aid for relocation of the above utility pipe.
4) PT. TELKOM, Tangerang branch:
a. The PT. Telkom utilities affected by the flyover and necessary ROW widening are as follows: • An overhead cable and its active accessories (DLC) • An underground cable of secondary networks • An overhead cable of secondary networks • Poles distribution point (DP) and other accessories. • Duct route and MH/HH, its position perpendicular to the road and
located at the road center. b. PT. Telkom utility types which to be relocated:
• RK-RC cap. 2,400”, • 2 pieces of primer networks, cap. 300”(P002) and 400”(P005) • An active tools 2 unit cap. 240” and cap. 138” • Total active telephones 675 subscriber • Secondary networks cable cap. 1,500” consist of 10 cable (S001 s/d
S010) • Number of poles and DP needs a more detail survey.
c. Problems linked to relocation works; • Re-surveying the cable networks which are affected by the flyover
project in detail as a basic requirement for networks design. • PT. Telkom will process relocation by stages in accordance with PT.
Telkom internal requirements. 16.4 UTILITIES AT NAGREG FLYOVER
There are 5 categories of aboveground utility and 6 categories of underground utility as shown below;
ABOVEGROUND 1 2 3 4 5
Relocation of Existing Electricity (PLN), Poles Medium Voltage Relocation of Existing Electricity (PLN), Poles Low Voltage Electric Cables Relocation of Existing Telephone Utility Poles Telephone Cables
UNDERGROUND 6 7 8 9 10 11
Crossing Underground Duct with PVC dia 4” Oil Pipe relocation dia 400 mm Cost for connection Protection of Existing Oil Pipe Type A Protection of Existing Oil Pipe Type D Dig and deepen Optic Cable
Coordination meetings with the concerned utility companies were held on July 26, August 29 & 30, 2006. Main issues and concerns are as follows;
16-6
1) Pertamina UMPS, Bandung Branch:
a. There are 2 oil pipes owned by Pertamina UMPS IV Bandung located at the each side of the road and having the followings dimensions: - CB I pipe – diameter 10” for distributing oil from Cilacap to Bandung,
channeled to Padalarang industrial estate. - CB II pipe – diameter 16” for distributing oil from Cilacap to Bandung,
channeled to Bandung industrial estate. b. From the site investigation using a metal detector, it was found that there
are 3 (three) piers conflicting the oil pipe, i.e at Abutment A1 (station 0+495); Pier 3 (station 0+719.50) and Abutment A2 (station 0+620)
c. It is suggested by Pertamina to make a test pit for verification. d. The right-of-way where the oil pipe placed is owned by Pertamina, not
owned by PU and the adjacent to the railway track area are owned by PT. KAI.
e. The pipes which conflict with the pier/pile foundation must be protected or relocated: - During the relocation period, the reserved oil can only retained in one
week. - The duration for re-connecting of the relocated pipe will take 4-5
working days. f. For relocation process permission procedure is needed from the Badan
Pengelola Migas Pusat (Control of Oil and Gas Management Board), Jakarta and it will take at least 3 (three) months.
g. Pertamina’s pipe at west area (to Bandung) CB II have embedded depth of 300 mm ~ 500 mm, and with maximum depth 1200 mm near railway crossing. Position of pipe underneath pavement at east area (to Malangbong), CB I have depth 1700 ~ 2000 mm in average.
Protection type should be selected based on the pipe position which is affected by the flyover construction: Protection type A:
The Protection Design Model for a pipe located underneath the pavement with a longitudinal semi box construction without permanent cover slab chamber, so it can be lifted up during maintenance works. Protection type B:
The Protection Design Model for a pipe underneath the embankment shall be a longitudinal box culvert with a requirement that the minimum dimension shall be provided for maintenance people, so that entering into the box during periodical maintenance works is assured. Protection type C:
The Protection Design Model for a pipe which exist underneath the MSE wall foundation, is an open side box construction. Its depth shall be adjusted with the pipes position, those open side box has an opening man-hole at same definite places for inspection. Those open box is located on the road side, besides the retaining wall. Inside the box is filled with sand which has an indicator control if there is any leakages, and it serves as a pipe support.
16-7
Protection type D:
Protection type D is the option to change the bored pile type from twin pile to single pile. In case there are no possibilities to use type C protection, then relocation is the only way to be applied.
2) PLN (Persero) of West Java and Banten Distribution Office:
a. There are several power network posts existed in the right and the left side and there is no objection to relocate those in accordance with the flyover requirements.
b. The power network of the southern lane which crossing the railway track (underneath the flyover) will be put beneath the railway track and PU will process the permit letter.
c. A crossing underneath the railway track will be made for installation of utilities with PVC pipe material for the relocation of networks. Those design should be submitted to PT. KAI.
d. PLN informed that the permission must be obtained for the network crossing in the field from PT. KAI, considering there are several particular requirements of the PT. KAI be fulfilled.
e. New guard house of DTC and TMJ shall be built which is affected by the flyover.
3) PT. TELKOM Tbk. Bandung Branch:
a. There are several Telkom telephone networks at the right and left sides of the road which crossing the railway tracks.
b. It is propose to relocate all the existing networks to northern side of the road in one lane, starting from the end station up to 60 meter at the western side of station 0+000, further more crossing the road and then re-connected with the distribution panel which exists in the southern part of the road.
16.5 UTILITIES AT GEBANG FLYOVER
There are 5 categories of aboveground utility and 2 categories of underground utility as shown below;
ABOVEGROUND
1 2 3 4 5
Relocation of Existing Electricity (PLN) Poles (Medium Voltage) Relocation of Existing Electricity (PLN) Poles (Low Voltage) Electric Cables Relocation of Existing Telephone Utility Poles Telephone Cables
UNDERGROUND
6 7
Underground Cable Duct with PVC dia. 4” (include telephone and electric cable) Underground Pipe Relocation dia. 75 mm
Based on the findings and study, coordination meetings with concerned utility companies were held on August 3 and 30, 2006. Main point of discussion and concerns are summarized as follows;

16-8
1) PT. TELKOM of Kandatel Cirebon:
a. Telkom Bandung Branch: • As per coordination between PU and Telkom, the six month old optic
cable networks shall be relocated. • It is requested to provide enough space for laying TELKOM utilities
complying with the available standard, in case any disruption occurs at one of the utilities and it should be corrected and the other utility should not be disrupted.
• To avoid additional higher cost, it is requested that there are no additional expanded cables required.
• Requested availability of utility space/room for future provision. Telkom will relocate the optic cable immediately and put in permanently after space has been provided.
b. Telkom Kandatel of Cirebon District: • Detail field data representing as a reference of the cable location,
since conflicts with land owners are frequently occurred. • A diverted networks route should be provided for adjustment with the
flyover position. • In relation to the commencement of the flyover construction, dated
7th of May 2007 (tentative), a fixed and clear location plan of the new utility networks shall be prepared.
2) PT. TELKOM bk. Bandung Branch:
a. There are several Telkom telephone networks exist at the southern part which could be affected by the flyover; • An air Cable KAP 20 = 535 meter • An air Cable KAP 30 = 259 meter • An air Cable KAP 50 = 288 meter • An air Cable KAP 100 = 288 meter • Fiber Optic Cable KAP 24 lane = 1200 meter • Subduc, length 1200 meter
b. Generally the telephone optic cable networks can be relocated in accordance with the requirement of Gebang Flyover ROW plan. A permission of relocation is needed to remove the network accessories from the central office, since relocation has been undertaken twice in the last month.
c. Cirebon Telkom Branch Office will prepare the relocation position works that comply with the flyover ROW plan.
3) PLN (FIRMS) APJ, Cirebon District:
a. During the removal of PLN network utility, a new network shall be first built at the planned position, then new network is ready to operate and the old networks will be turn-off, so as to minimize the power-off time.
4) PU-Cipta Karya, Cirebon Disrict:
a. the clean water pipe installed and built in fiscal years 2004 by PU Cipta Karya Cirebon District, are now in full operation but not yet handed over to PDAM (Local Government Firms for Drinking Water Affairs) of Cirebon District.
16-9
b. For the construction of the pipe installation which financed under Compensation Program on Subsidized of Fuel Seducement, the constructed project has to be agreed by PU Bina Marga of Cirebon District.
c. The crossing position is not complying with the As-Build Drawing, and the pipe was embedded along the right side of T Junction just besides Telkom utilities.
d. A fund is needed for relocation, since it is still under PU management.
5) Joint Agreement:
a. An enough room/space should be provided for laying the utilities in accordance with the available standard, in a form of hole box culvert. Each of utility has its own dimension: • PT. Telkom ø = 4 cm • PT. PLN ø = 5 cm • Water Enterprise ø = 7.5 cm
16.6 UTILITIES AT PETERONGAN FLYOVER
There are 6 categories of aboveground utility and 3 categories of underground utility as shown below;
ABOVEGROUND 1 2 3 4 5 6
Relocation of Existing Electricity (PLN) Poles (Medium Voltage) Relocation of Existing Electricity (PLN) Poles (Low Voltage) Electric Cables Relocation of Existing Telephone Utility Poles Telephone Cables Relocation of Optic Cable
UNDERGROUND 7 8 9
Dig and Deepen Telephone Cable Dig and Deepen Optic Cable Dig and Deepen Electric Cable
To clarify and discuss detail of relocation and protection work, coordination meetings with the concerned utility company were held on September 11 and 12, 2006; 1) PLN Company, Jombang Service Unit:
a. All the PLN cables are installed above the ground level (on air cable). b. Relocation of cable posts shall be out-side the ROW, also cables would be
relocated with support from the local government and community. The posts are consist of; concrete post 14 M (SUTM) = 17 and SUTR = 2, transformator = 3 pcs, raising of SUTM = 7 and SUTR = 5 post.
2) PT. TELKOM Tbk. Cabang Surabaya:
a. The Telkom network is a copper and optic fiber materials, cable position is above the ground level and underneath the flyover. The underground cables exist only at northern site consisting of 7 cables, southern site 2 copper cable and optics, diameters 15 mm, 20 mm and 40 mm with depth around 800 mm from the road surfaces.
b. The other underground optic cables located at the right side (southern) is owned by private company – Indosat and XL company.
16-10
c. The relocation of post would be set up at the ROW border. For the optic cable suggested to be protected only.
d. Number of post to be relocated are 18 pcs at left side, 31 pcs at the right side. RC post 14 pcs at the right side.
3) Jombang City-Local government clean water company:
a. There are two networks at right side of the flyover, i.e.: Distribution network type GI pipes (diameter 150 mm become 200 mm) and a Distribution network PVC type diameter 75 mm. At the left side of the flyover, distribution network with diameter 75 mm are existing with average depth of 600 – 800 mm and 50 mm diameter starting from Sta. 0+500 up to Mojokerto.
b. The networks was installed in year 1931. c. Protection is needed.
16.7 UTILITIES AT TANGGULANGIN FLYOVER
There are 3 categories of aboveground utility and 2 categories of underground utility as shown below;
ABOVEGROUND 1 2 3
Relocation of Existing Electricity (PLN) Poles (Medium Voltage) Relocation of Existing Electricity (PLN) Poles (Low Voltage) Electric Cable Aboveground
UNDERGROUND 4 5
Dig and Deepen Optic Cable Relocation Existing Water Pipe dia. 450 mm
To clarify and discuss the issues of utility relocation and protection, coordination meetings with concerned utility company were held on September 13-14, 2006. The main points of discussion are as follows; 1) PLN (Persero) East Java Distribution (APJ):
a. Electrical cable in Tanggulangin are all aboveground and no cable underneath carriageway.
b. PLN utilities aboveground will require relocation of only 5 posts (right side). Utilities underground have protector with brick construction – sand – earth fill, having depth 1600 mm. If its depth enough, electrical cable will not be relocated.
c. 2 cable networks are crossing above road. At the beginning of flyover one cable will be relocated crossing under bridge with SKMT 20 KV system with box duct. At the end of flyover, crossing height shall be higher than 8000 mm.
2) PT. TELKOM Tbk. Cabang Surabaya:
a. Type of telephone cables are made from copper and fiber. There are utilities above (air cable) and under (earth cable) carriageway.
b. Earth cable copper dia 40”, 60”, 100”, and 200” with depth 800 mm are protected, if pavement thick more than 1000mm.
c. Optic cable underneath pavement with 48 cores will be discussed with Regional Division V Surabaya.
16-11
d. For air cable with dia 10”, 30”, 40” and optic cable 18 ; 36 core, the supporting post will be relocated accordingly.
e. Above crossing cables at the beginning of flyover to be relocated under bridge.
f. Cable attached beside the bridge cannot be relocated inside of the bridge. g. Cable optic underground is not own Telkom but Indosat ownership.
3) PDAM, Surabaya:
a. PDAM has 2 networking, main line and Distribution line with ducktail type with dia 450 mm and PVC for distribution line with dia 75 mm.
b. Pipe network on the north has dia 450 mm at Sta. 0+000 – 0+660 having distance 250 mm from center of median with depth 1200 mm, and at Sta. 0+660 – 1+200 having distance from center of median 10000 mm with depth 1400 mm. The pipe network on the south has dia 450 mm from Sta. 0+000 – Sta. 1+200 with distance 8500 mm.
c. Water distribution PVC pipe with dia 75 mm on the South side will not required any protection, since position is at the edge of ROW.
d. The pipe affected by the bored pile will be at 3 locations. e. The pipe network under embankment will be required protection because
of old pipe, if the old pipe are affected by the bored pile, it should be relocated or adjusted the bored pile.
f. Relocation of the pipe and connection will require 2 working days.