Chapter 11 Section 3 Where Does Industry cause Pollution? (11 th Edition Book)
35
Chapter 11 Section 3 Where Does Industry cause Pollution? (11 th Edition Book)
-
Upload
amelia-watson -
Category
Documents
-
view
232 -
download
5
Transcript of Chapter 11 Section 3 Where Does Industry cause Pollution? (11 th Edition Book)

Chapter 11
Section 3Where Does Industry cause Pollution?
(11th Edition Book)

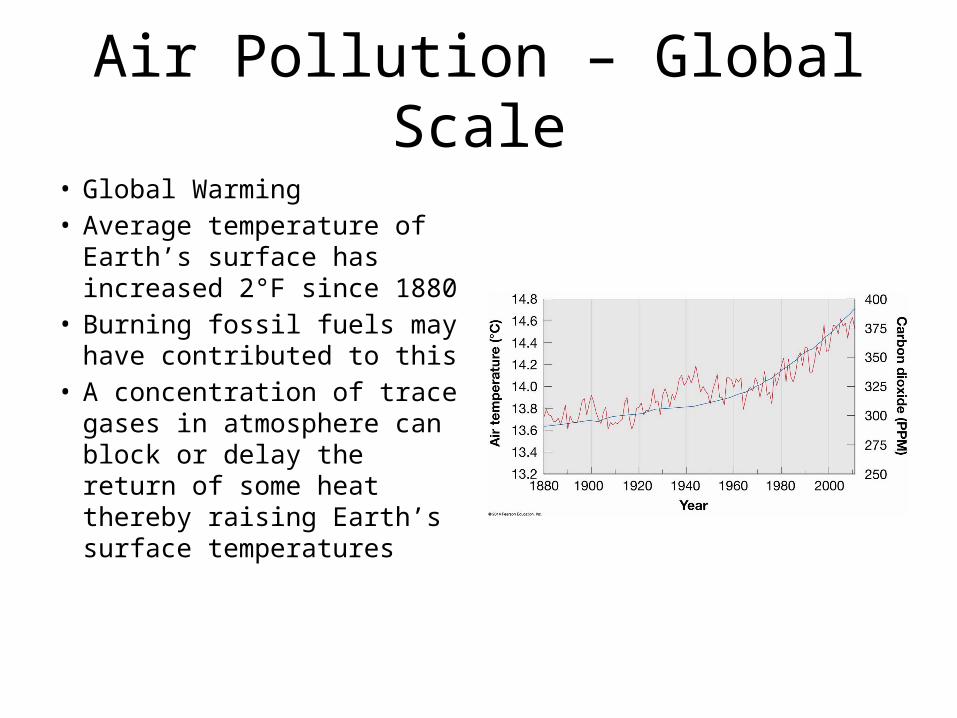
Air Pollution – Global Scale
• Global Warming• Average temperature of
Earth’s surface has increased 2°F since 1880
• Burning fossil fuels may have contributed to this
• A concentration of trace gases in atmosphere can block or delay the return of some heat thereby raising Earth’s surface temperatures

Greenhouse effect• The burning of fossil fuels release carbon dioxide
that plants & oceans absorb• Past 200 years of burning fossil fuels has caused an
increase of the C02 to rise by more than ¼• The anticipated increase in the Earth’s
temperature caused by C02 & other greenhouse gases trapping some of the radiation emitted by the surface is the greenhouse effect
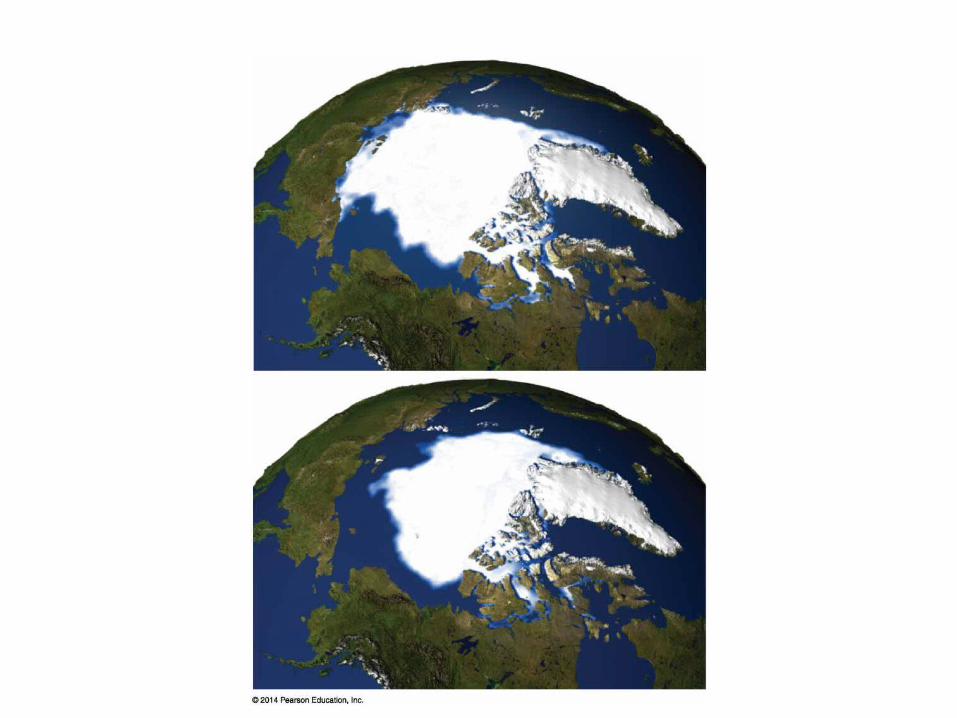
• Misleading term• Global warming of only a few degrees could melt
the polar ice caps
What gas is now most commonly used as a coolant instead of CFC? Google “what replaced CFCs?”
• Global-Scale Ozone Damage– Stratosphere (9-30 miles above surface)– Contains ozone gases that absorb UV rays from
sun– This layers is threatened by chlorofluorcarbons
(CFCs) such as Freon– In 2007 all countries in the world agreed to stop
using CFCs by 2020 in developed word & 2030 in developing world
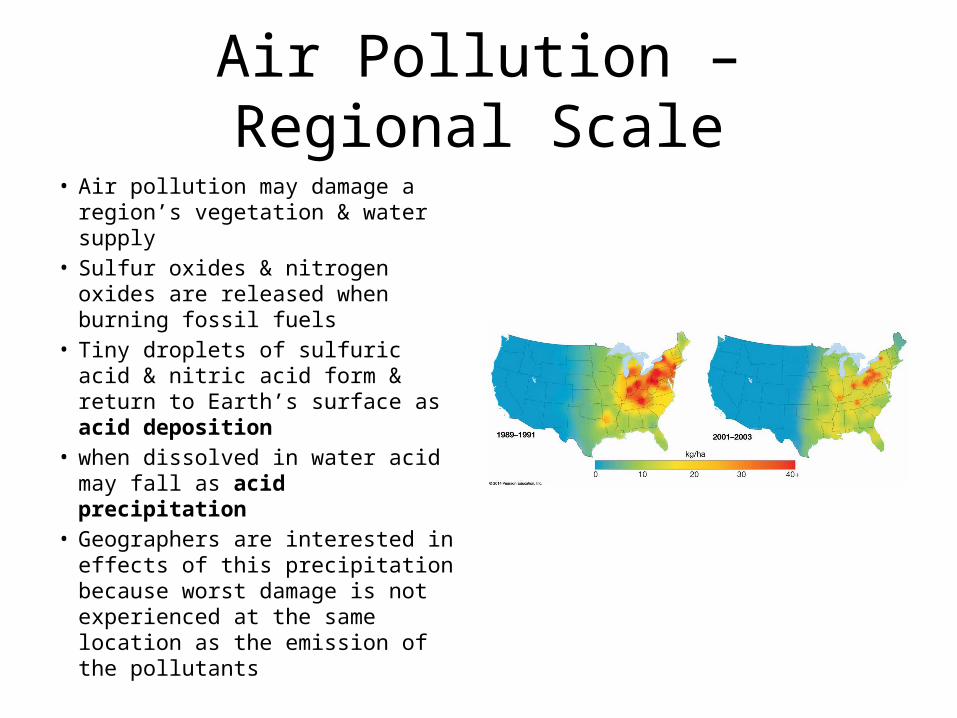
Air Pollution – Regional Scale• Air pollution may damage a
region’s vegetation & water supply• Sulfur oxides & nitrogen oxides
are released when burning fossil fuels
• Tiny droplets of sulfuric acid & nitric acid form & return to Earth’s surface as acid deposition
• when dissolved in water acid may fall as acid precipitation
• Geographers are interested in effects of this precipitation because worst damage is not experienced at the same location as the emission of the pollutants

Local-Scale Air Pollution
• Carbon Monoxide• Hydrocarbons• Particulates• Worst Urban air pollution
occurs when winds are slight, skies are clear & temperature inversion (air is warmer at higher elevations) exists – pollutants are trapped
• Sunlight provides energy for formation of smog
• Worst concentration of particulates is Southern California – LA
• WHO worldwide the 10 most pollutant cities are in developing countries– 4 each in Iran & South
Asia
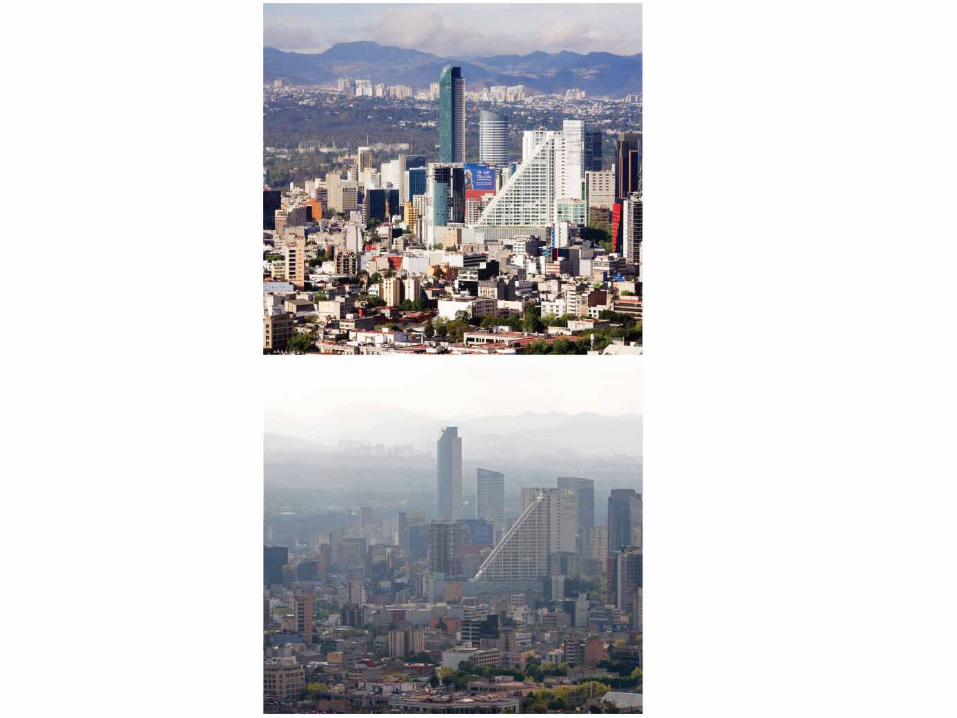
• Mexico City has actually improved its air quality since 1990s

Solid Waste Pollution
• Sanitary Landfill– Most common strategy
for solid waster disposal iN US
– More than ½ of the country’s waste is buried under the soil
– Number of landfills has declined in US by ¾ since 1990
• Shortage of space• Incineration is seen as an
alternate• Burning trash reduces
bulk by ¾• Incinerator can provide
energy: heat can boil water to produce steam heat or operate a turbine that generates electricity
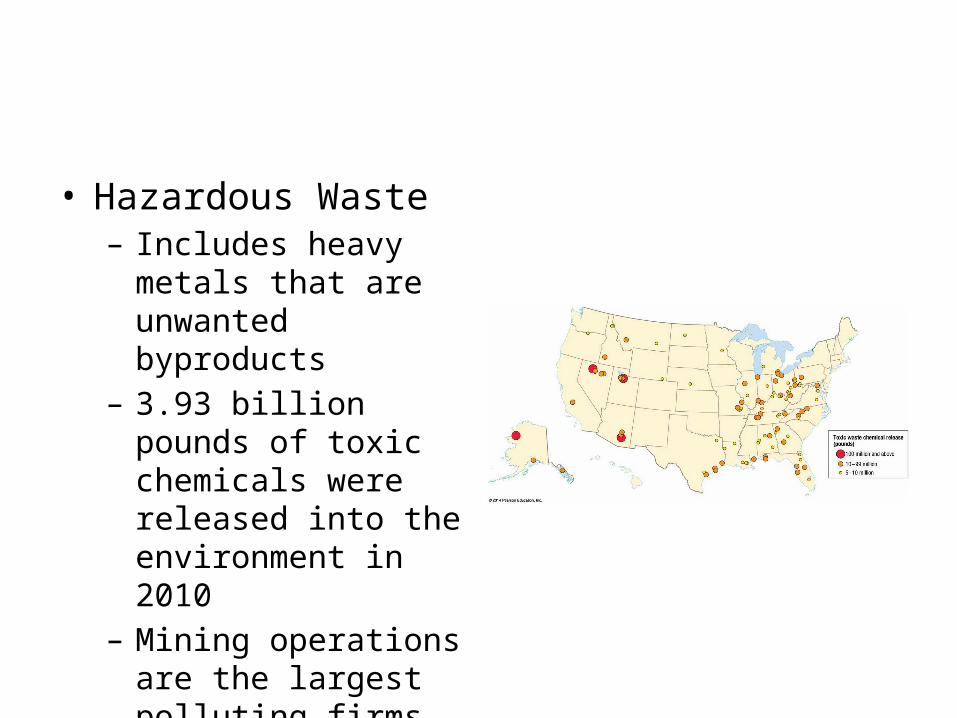
• Hazardous Waste– Includes heavy metals
that are unwanted byproducts
– 3.93 billion pounds of toxic chemicals were released into the environment in 2010
– Mining operations are the largest polluting firms

Water Pollution
• Water Pollution Sources• Point Source – pollution
that enters a body of water at a specific location– Water-using
manufacturers – steel, chemicals, paper products, food processing.
– Need large amounts of water & generates a lot of waste
– Municipal sewage – sewers carry wastewater from sinks, tubs & toilets to treatment plants where it is treated
– Treated water is released back into river or lake
– US Clean Water Act
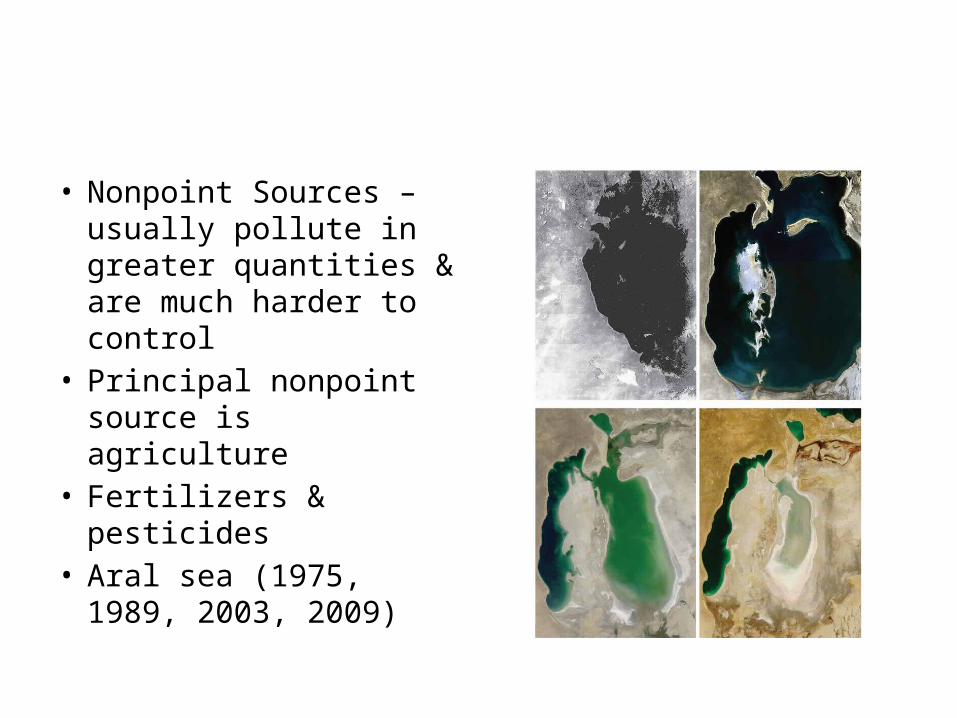
• Nonpoint Sources – usually pollute in greater quantities & are much harder to control
• Principal nonpoint source is agriculture
• Fertilizers & pesticides• Aral sea (1975, 1989,
2003, 2009)
Impact of Water Pollution on Aquatic Life
• Decomposing organic waste dumped in water competes for the oxygen
• Oxygen consumed by decomposing organic waste is called biochemical oxygen demand
• Too much waste water becomes oxygen starved
• “Pond scum”• Some water may
become unlivable for normal plants & animals creating a “dead” stream or lake

Chapter 11
Section 3Where is Industry Expanding?
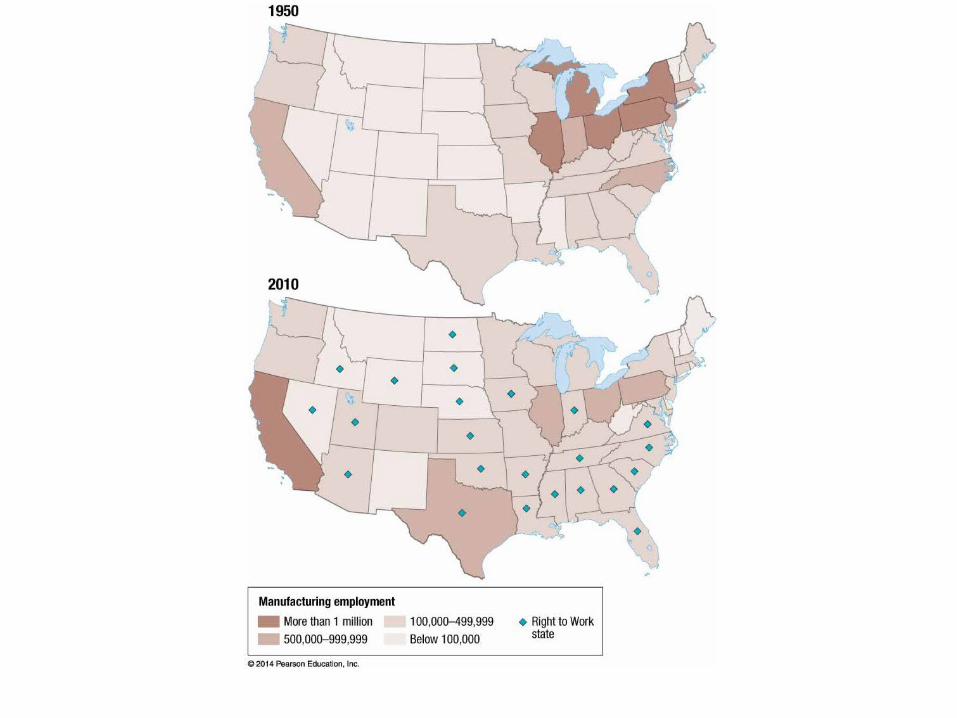
Changes Within Developed Regions
• Shifts within the US– Lost 6 million jobs in
manufacturing between 1950-2010
– 2 million jobs were added in South & West between 1950-2009 – California & Texas saw the most
– TVA– Steel, Tobacco & furniture
have been dispersed in small communities
• Right-to-work laws– Requires a factory to
maintain a “open-shop” and prohibits a “closed shop” which a company & a union agree that everyone must join a union to work in the factory
– Open shop – a union & a company may not negotiate a contract that requires workers to join a union as a condition of employment
– 23 states have right to work laws
• Textile Production– Opened lower-wage
locations & shut down higher-wage locations
– Heavily concentrated in Northeast in early 20th century
– Later shifted to South & West
– Move took place during the mid-20th century
• Favored sites with small towns in Appalachian, Piedmont & Ozark Mountains
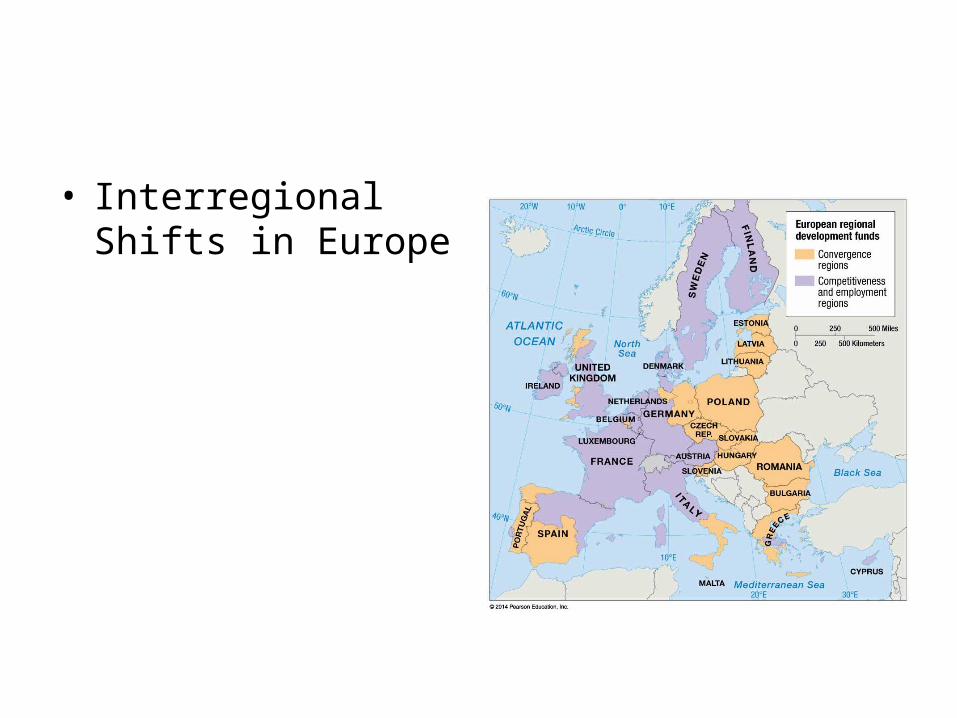
• Interregional Shifts in Europe
New Industrial Regions
• Asia • Latin America

• “Central” Europe

Emerging Industrial Regions
• 1970 – ½ of the world’s industry was in Europe• 1/3 was in North America• Now these two regions account for only ¼
each• Share of world industry in other regions has
increased from 1/6 in 1970 to ½ in 2010
• Labor is the site factor that is changing • To minimize labor costs, manufacturers are
looking for places where wage rates are low• Labor-intensive industries are attracted to
emerging industrial regions
• Outsourcing– Transnational
corporations are looking to identify where steps can be performed by low-paid, low-skilled workers in developing countries
– Despite greater transportation costs corp’s can profitably transfer some work to developing countries
• The selective transfer of some jobs to developing countries is new international division of labor
• Outsourcing – turning over much of the responsibility for production to independent suppliers
• Contrasts with the traditional approach - vertical integration where a company controls all phases of production process
Impact of Outsourcing
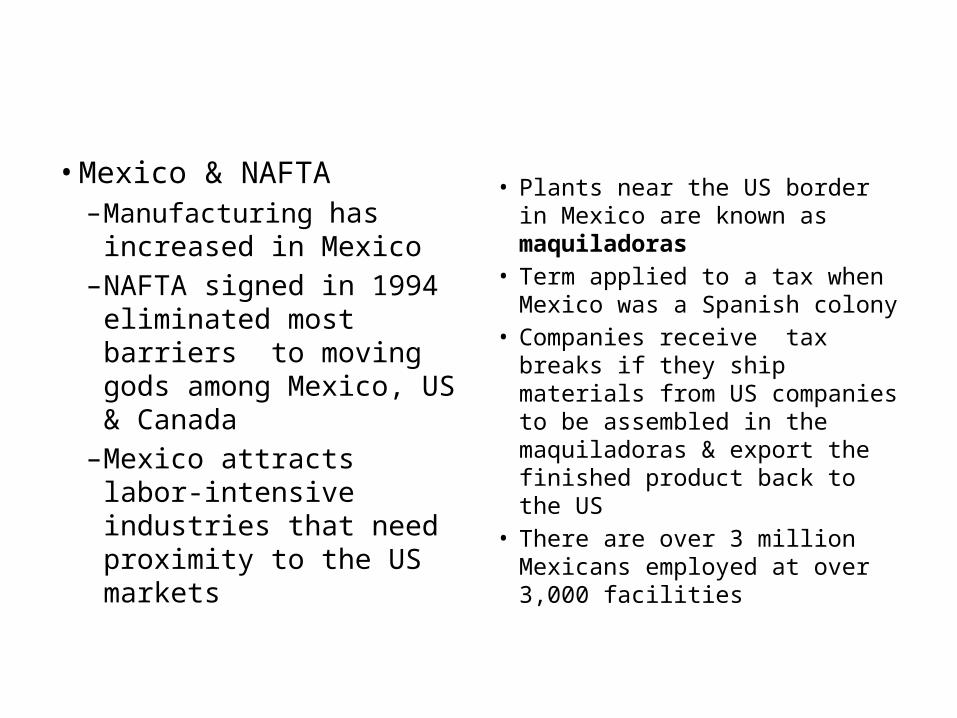
• Mexico & NAFTA– Manufacturing has
increased in Mexico– NAFTA signed in 1994
eliminated most barriers to moving gods among Mexico, US & Canada
– Mexico attracts labor-intensive industries that need proximity to the US markets
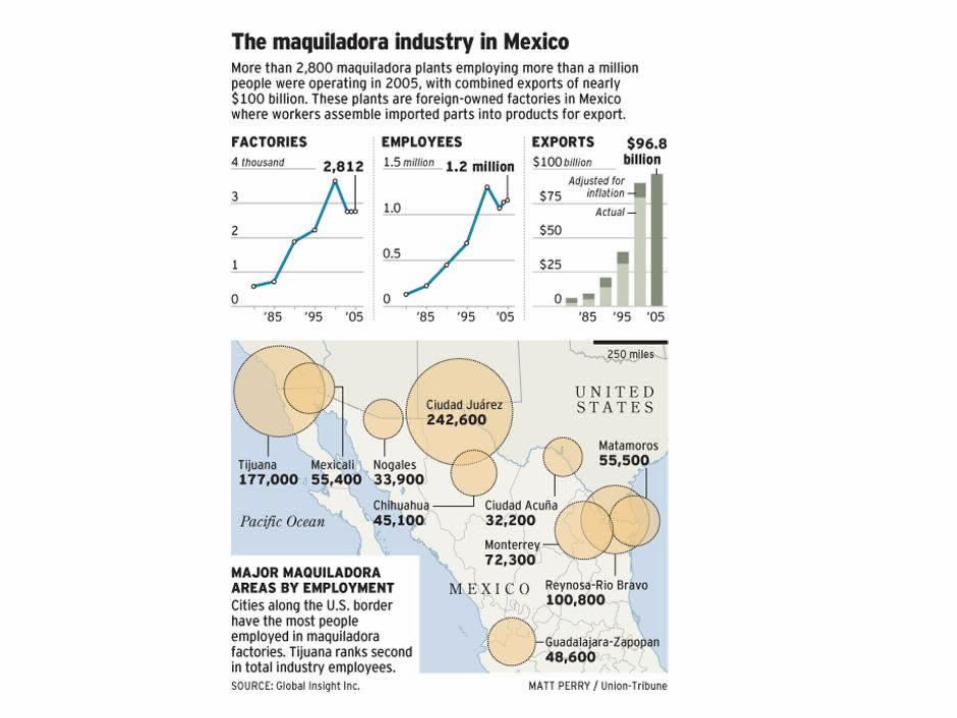
• Plants near the US border in Mexico are known as maquiladoras
• Term applied to a tax when Mexico was a Spanish colony
• Companies receive tax breaks if they ship materials from US companies to be assembled in the maquiladoras & export the finished product back to the US
• There are over 3 million Mexicans employed at over 3,000 facilities
Concerns with Maquiladoras
• Labor leaders fear more manufacturers will relocate to Mexico to take advantage of lower wage rates– Food processing– Textile manufacturing
• Environmentalists fear NAFTA encourages firms to move production to Mexico because laws governing air and water-quality standards are less stringent
Mexico’s Challenges
• It lost a quarter-million maquiladora jobs during the first decade of the 21st century
• Electronic firms pulled out: Mexican wages are $6/hour are $1 higher than wages in China and India
• Despite higher site costs, Mexico is still competitive because of situation factors
• Proximity allows lower shipping costs to the US from Mexico than China
BRIC and BRICS
• Much of the future growth in manufacturing will take place outside principal industrial
• Goldman Sachs coined the term BRIC as the countries that will dominate global manufacturing in the 21st century
• Brazil, Russia, India and China• They currently control ¼ of the world’s land
area & contain 3 billion of the 7 billion people on the planet
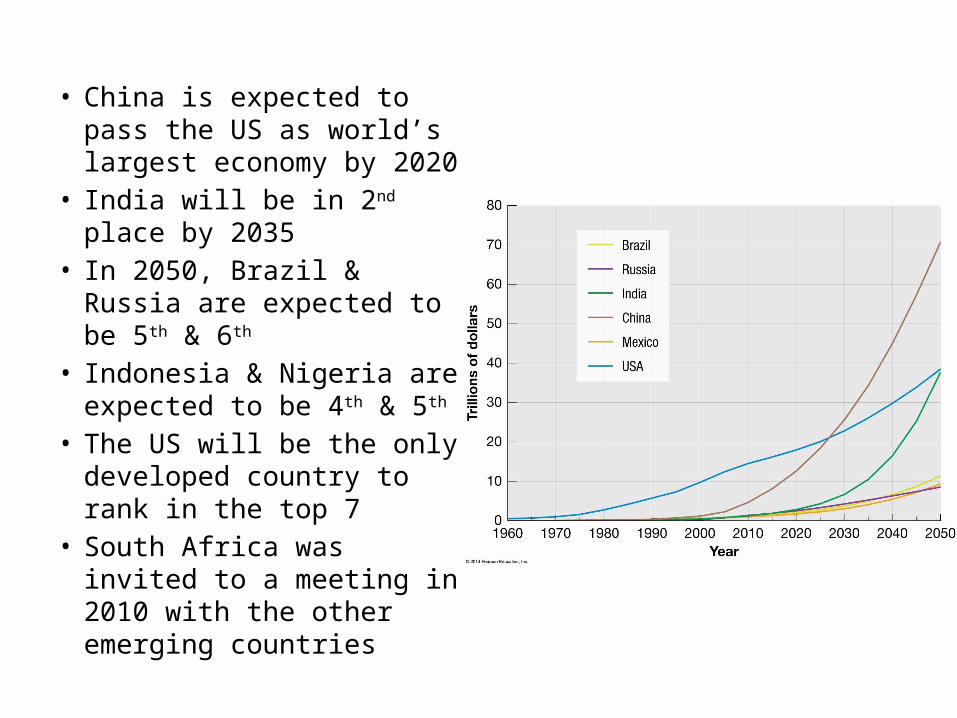
• China is expected to pass the US as world’s largest economy by 2020
• India will be in 2nd place by 2035
• In 2050, Brazil & Russia are expected to be 5th & 6th
• Indonesia & Nigeria are expected to be 4th & 5th
• The US will be the only developed country to rank in the top 7
• South Africa was invited to a meeting in 2010 with the other emerging countries
Renewed Attraction of Traditional Industrial Regions
• Proximity to skilled labor
Just in Time Delivery
• Shipment of parts & materials to arrive at a factory moments before they are needed– Parts & raw materials to
manufactures of fabricated products such as cars & computers
• Reduces the amount of money manufacturers must tie up in wasteful inventory
• Reduces the size of factories
• Disruptions for just in time– Labor unrest– Traffic– Natural hazards