Chapter 11 Managing Systems Implementationmit.wu.ac.th/mit/images/editor/files/Ch 11(1).pdf•...
68
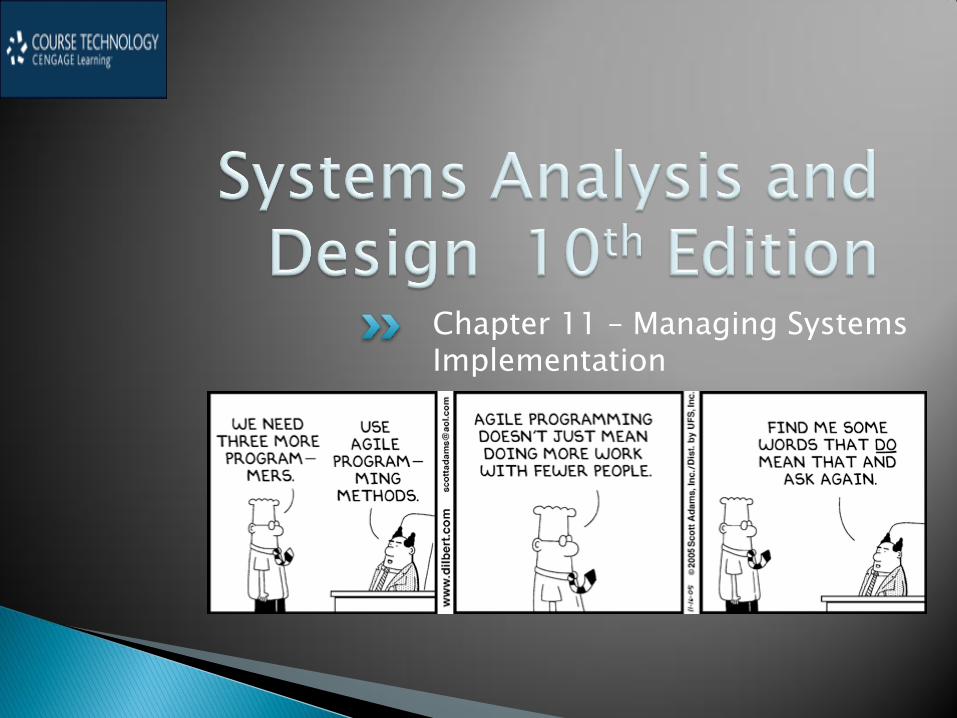
Chapter 11 – Managing Systems Implementation
Transcript of Chapter 11 Managing Systems Implementationmit.wu.ac.th/mit/images/editor/files/Ch 11(1).pdf•...
Chapter 11 – Managing Systems Implementation

Explain the importance of software quality assurance and software engineering
Describe application development using structured, object-oriented, and agile methods
Draw a structure chart showing top-down design, modular design, cohesion, and coupling
Explain the coding process Explain unit, integration, and system testing
Differentiate between program, system, operations, and user documentation
2

List the main steps in system installation and evaluation
Develop training plans for various user groups, compare in-house and vendor training options, and describe effective training techniques
Describe data conversion and changeover methods
Explain post-implementation evaluation and the final report to management
3

4
Companies are intensely concerned with the quality of their products and services
Main objective of quality assurance is to avoid problems or to identify them as soon as possible
Poor quality can result from inaccurate requirements, design problems, coding errors, faulty documentation, and ineffective testing
FIGURE 11-1 Typical systems implementation task list
5
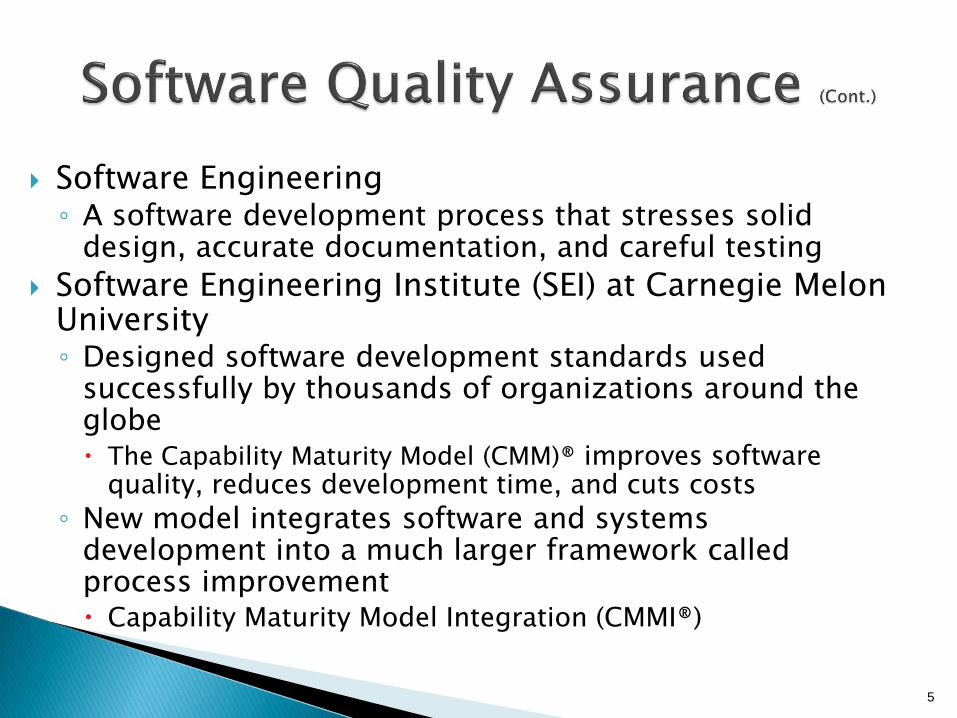
Software Engineering ◦ A software development process that stresses solid
design, accurate documentation, and careful testing
Software Engineering Institute (SEI) at Carnegie Melon University ◦ Designed software development standards used
successfully by thousands of organizations around the globe The Capability Maturity Model (CMM)® improves software
quality, reduces development time, and cuts costs
◦ New model integrates software and systems development into a much larger framework called process improvement Capability Maturity Model Integration (CMMI®)

6
CMMI ◦ The CMMI® tracks
an organization’s processes, using five maturity levels, from Level 1, which is referred to as unpredictable, poorly controlled, and reactive, to Level 5, in which the optimal result is process improvement FIGURE 11-3 The CMMI® includes five maturity levels, from
Level 1, which is referred to as unpredictable, poorly controlled,
and reactive, to Level 5, in which the optimal result is process
improvement

7
International Organization for Standardization (ISO) ◦ A worldwide body that establishes
quality standards for products and services
◦ ISO standards include everything from internationally recognized symbols to the ISBN numbering system that identifies this textbook
FIGURE 11-5 ISO standards include
internationally recognized symbols

8
Application development is the process of constructing the programs and code modules that serve as the building blocks of the information system
Structured analysis, object-oriented (O-O) analysis, and agile methods are three popular development options
The objective is to translate the design into program and code modules that will function properly

9
• Review the System Design • Requirements modeling • Functional decomposition diagrams (FDDs) • Structured data and process modeling • Data flow diagrams (DFDs) • Case diagrams • Class diagrams • Sequence diagrams • State transition diagrams • Activity diagrams • Development strategy • User interface • Entity-relationship diagrams (ERDs) • Overall system architecture

10
• Application Development Tasks • Traditional Method
is to develop an overall strategy design, code and test and document individual modules • A module consists of
related program code organized into small units that are easy to understand and maintain
FIGURE 11-6 The main steps in application
development

11
• Application Development Tasks (Cont.) • Agile Method creates a system through an iterative process
of planning, designing, coding, and testing • Examples include the Spiral model and the Extreme
Programming(XP) model
FIGURE 11-7
Simplified model of
an Extreme
Programming (XP)
project. Note the
emphasis on
iteration and testing
12
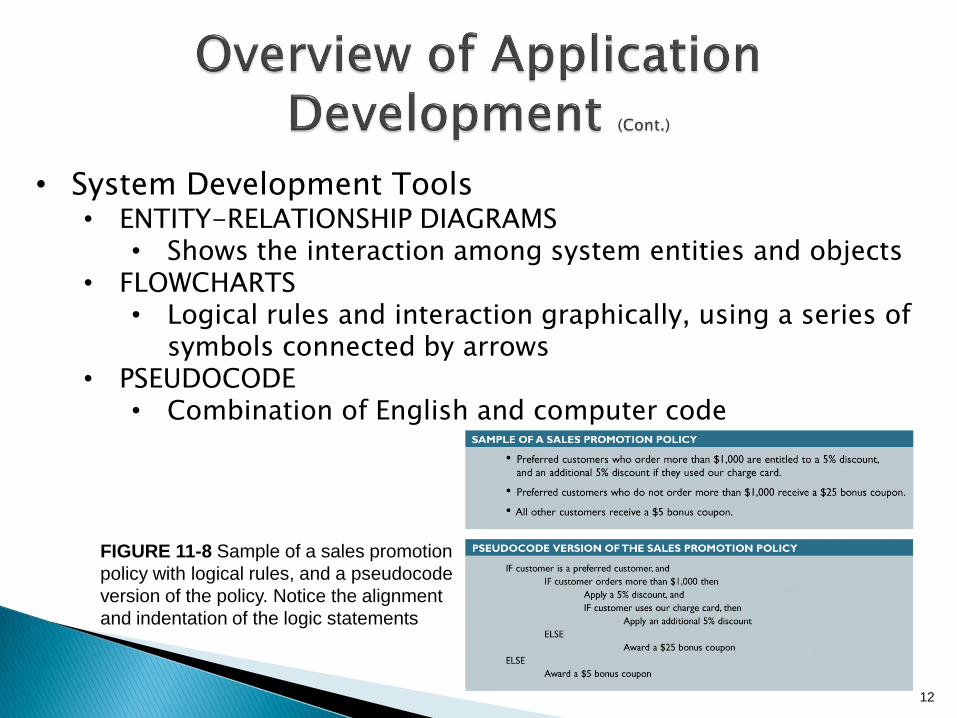
• System Development Tools • ENTITY-RELATIONSHIP DIAGRAMS
• Shows the interaction among system entities and objects • FLOWCHARTS
• Logical rules and interaction graphically, using a series of symbols connected by arrows
• PSEUDOCODE • Combination of English and computer code
FIGURE 11-8 Sample of a sales promotion
policy with logical rules, and a pseudocode
version of the policy. Notice the alignment
and indentation of the logic statements

13
• System Development Tools (Cont.) • DECISION TABLES AND DECISION TREES
• Used to model business logic for an information system • Project Management
• Structured development techniques and tools are used along with object-oriented and agile development methods
FIGURE 11-9 Sample decision tree that reflects the sales promotion
policy in Figure 11-8. Like a decision table, a decision tree shows the
action to be taken based on certain conditions

14
• Structure Charts • Structure charts show the program modules and the
relationships among them
FIGURE 11-10 An example of
structure chart modules FIGURE 11-11 An example of
a structure chart data

15
• MODULE • A rectangle represents a module • Vertical lines at the edges of a rectangle indicate that a
module is a library module - reusable code and can be invoked from more than one point in the chart
• DATA COUPLE • An arrow with an empty circle represents a data couple which
shows data that one module passes to another
• CONTROL COUPLE • An arrow with a filled circle represents a control couple
which shows a message, also called a status flag, which one module sends to another

16
• CONDITION • A line with a diamond
on one end represents a condition which indicates that a control module determines which subordinate modules will be invoked, depending on a specific condition
FIGURE 11-12 An example of a structure
chart control couple
FIGURE 11-13 The diagram shows a
control module that triggers three
subordinate modules

17
• LOOP • A curved arrow represents a loop which indicates
that one or more modules are repeated
FIGURE 11-13 The diagram shows a control module that
triggers three subordinate modules

18
• Cohesion and Coupling • Cohesion measures a module’s scope and
processing characteristics • A module that performs a single function or
task has a high degree of cohesion, which is desirable because it focuses on a single task and is much easier to code and reuse
FIGURE 11-15 Two examples of cohesion. Notice that the single
module on the left is less cohesive than the two modules on the right
19
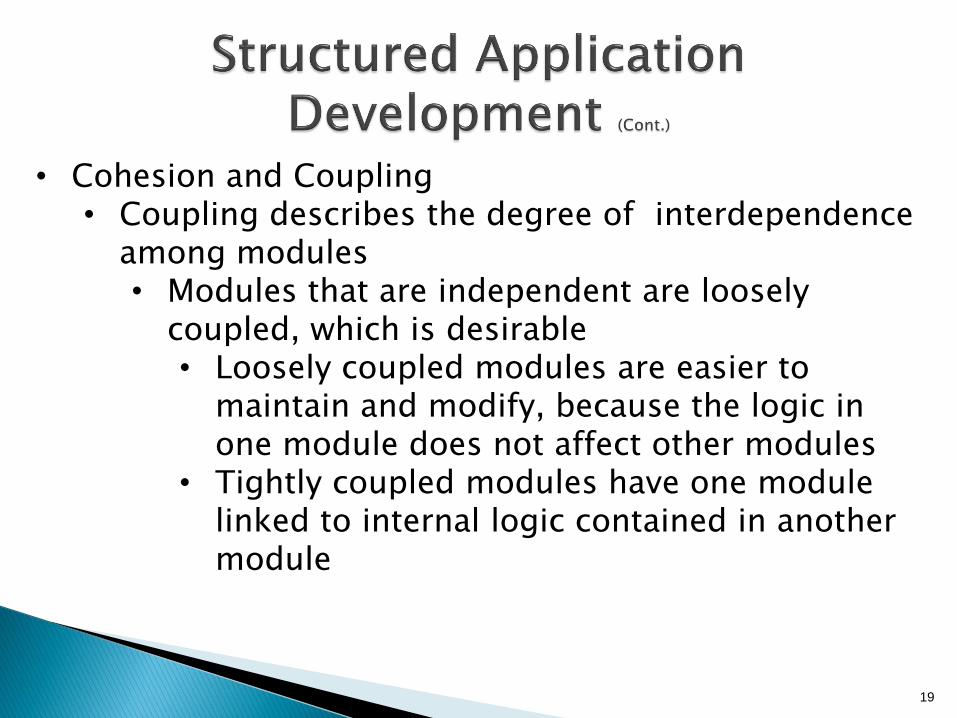
• Cohesion and Coupling • Coupling describes the degree of interdependence
among modules • Modules that are independent are loosely
coupled, which is desirable • Loosely coupled modules are easier to
maintain and modify, because the logic in one module does not affect other modules
• Tightly coupled modules have one module linked to internal logic contained in another module

20
FIGURE 11-16 An example of tightly coupled and
loosely coupled structure charts
21
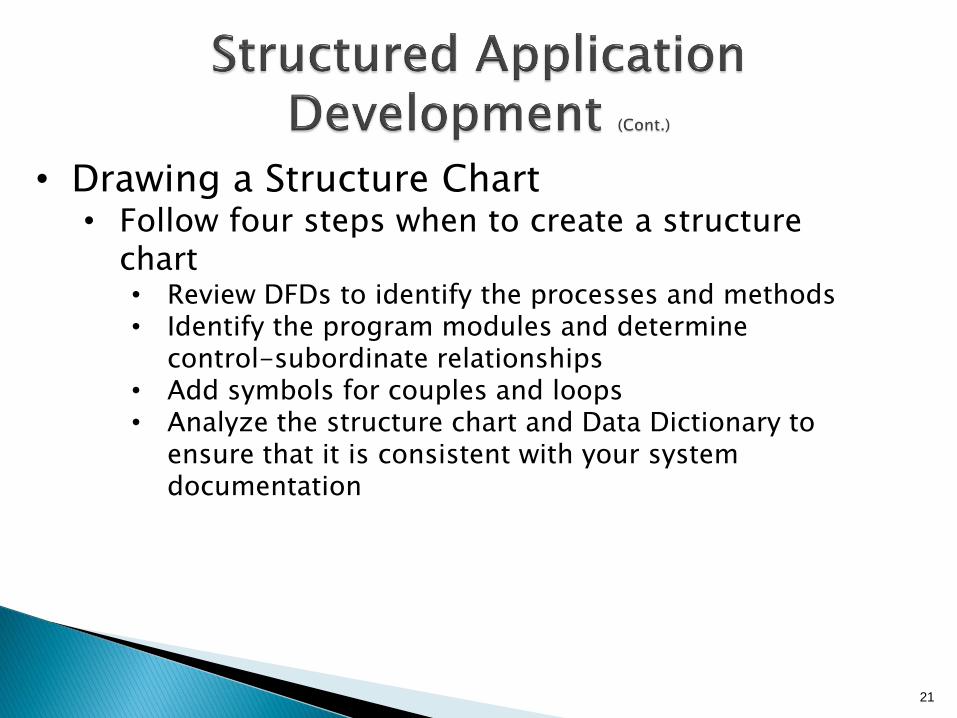
• Drawing a Structure Chart • Follow four steps when to create a structure
chart • Review DFDs to identify the processes and methods • Identify the program modules and determine
control-subordinate relationships • Add symbols for couples and loops • Analyze the structure chart and Data Dictionary to
ensure that it is consistent with your system documentation

22
FIGURE 11-17 A structure chart
based on the order system DFDs
on pages 196–198. The three-
level structure chart relates to
the three DFD levels
23
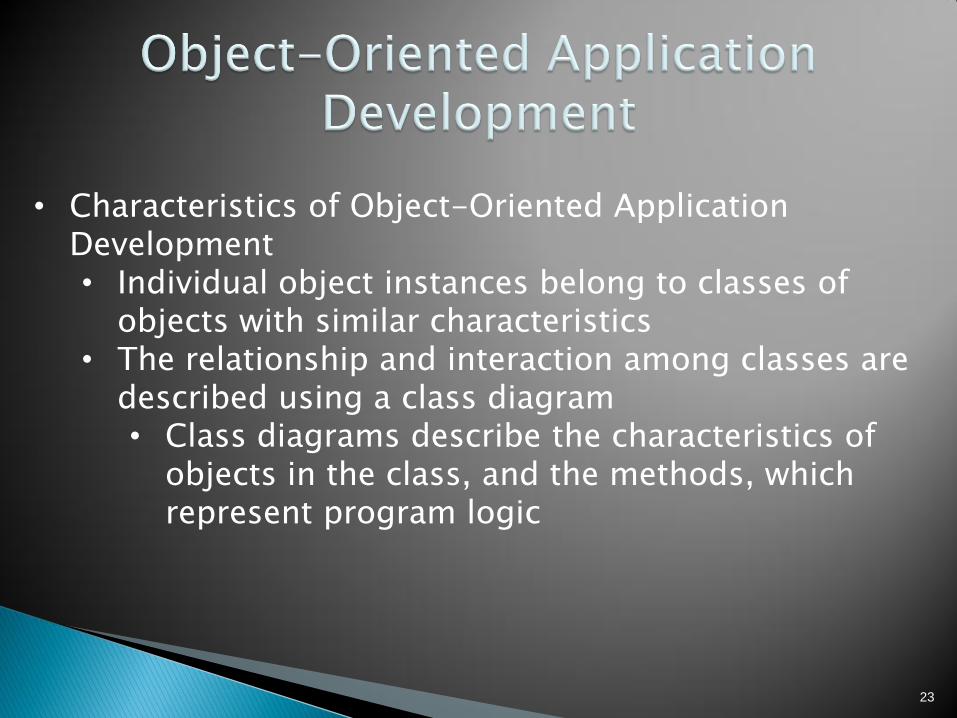
• Characteristics of Object-Oriented Application Development • Individual object instances belong to classes of
objects with similar characteristics • The relationship and interaction among classes are
described using a class diagram • Class diagrams describe the characteristics of
objects in the class, and the methods, which represent program logic

24
FIGURE 11-18 A simplified class diagram for a
customer order processing system
FIGURE 11-19 An object-relationship diagram for a
fitness center
25
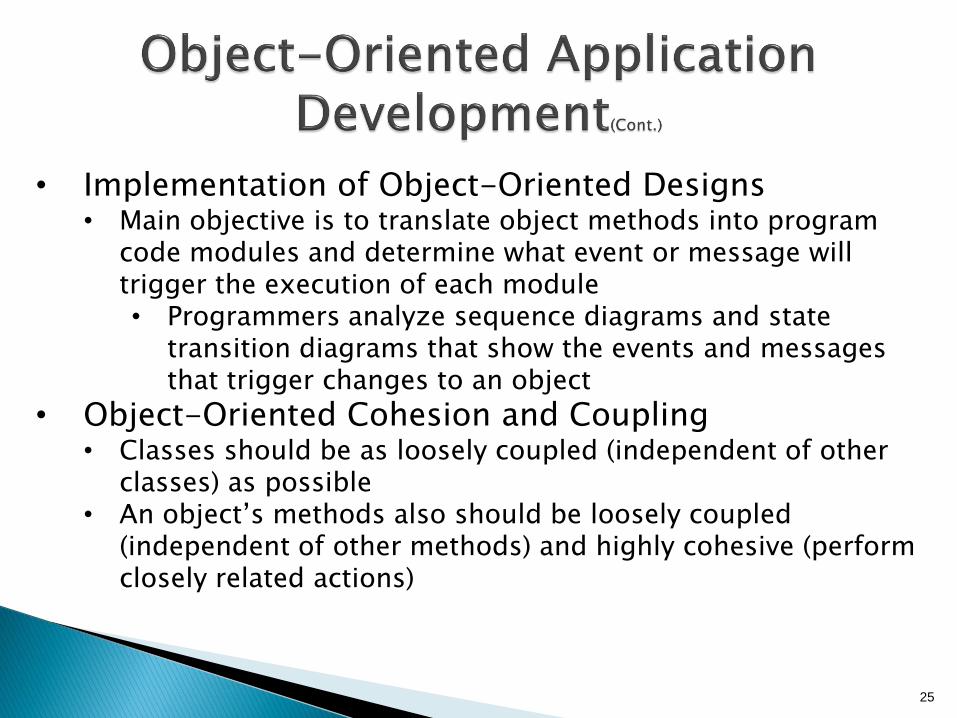
• Implementation of Object-Oriented Designs • Main objective is to translate object methods into program
code modules and determine what event or message will trigger the execution of each module • Programmers analyze sequence diagrams and state
transition diagrams that show the events and messages that trigger changes to an object
• Object-Oriented Cohesion and Coupling • Classes should be as loosely coupled (independent of other
classes) as possible • An object’s methods also should be loosely coupled
(independent of other methods) and highly cohesive (perform closely related actions)
26
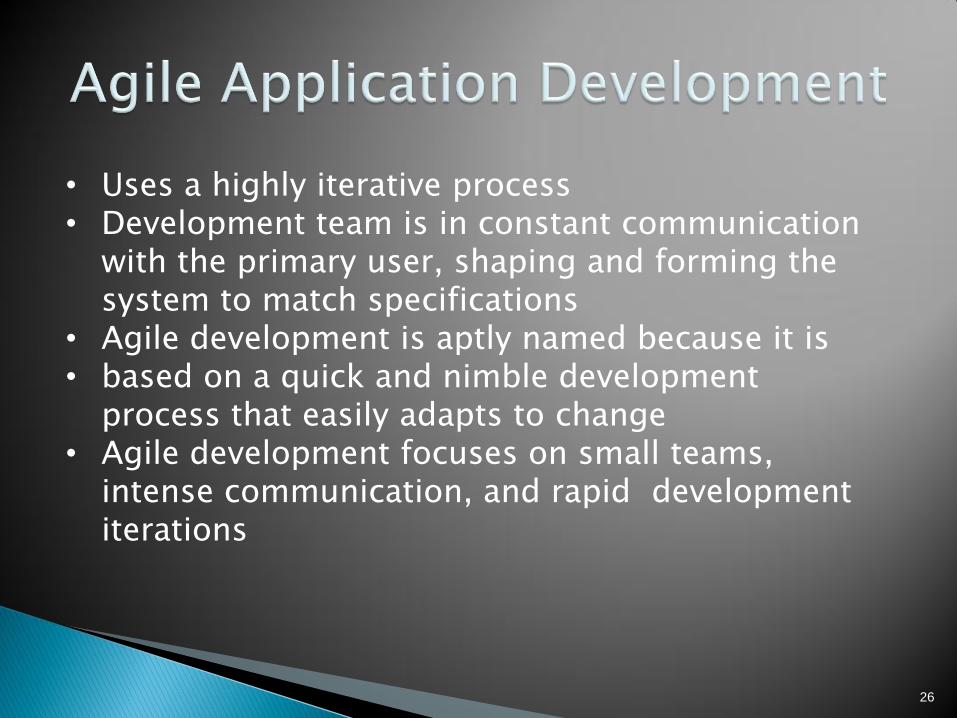
• Uses a highly iterative process • Development team is in constant communication
with the primary user, shaping and forming the system to match specifications
• Agile development is aptly named because it is • based on a quick and nimble development
process that easily adapts to change • Agile development focuses on small teams,
intense communication, and rapid development iterations

27
FIGURE 11-21 Extreme
programming relies on
the core values shown
here. Notice that users
are invited to start with
these values, and add
their own
28
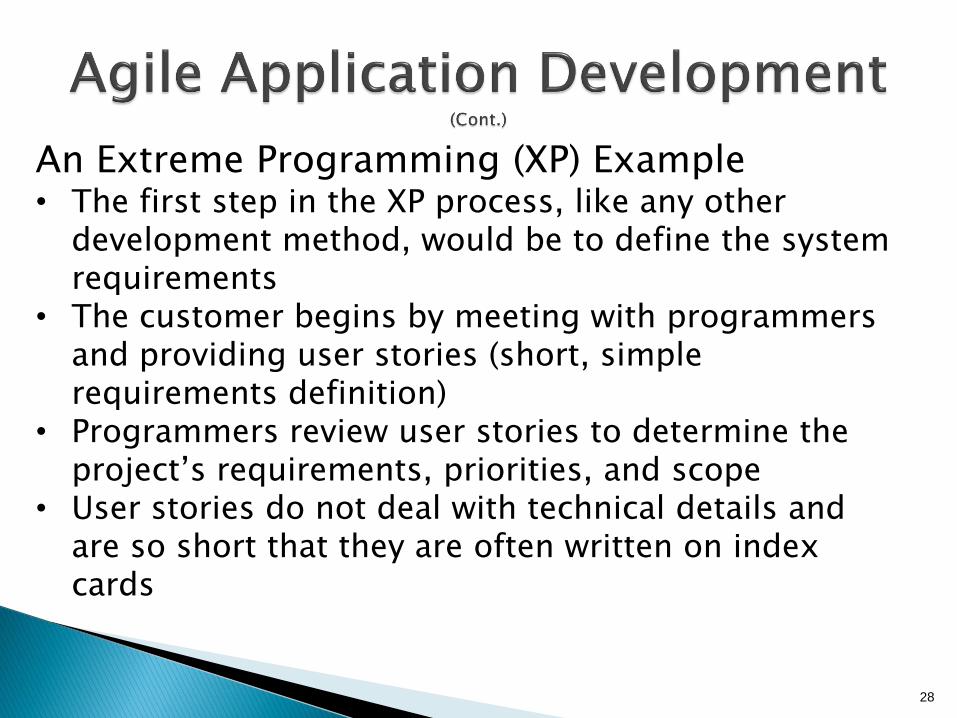
An Extreme Programming (XP) Example • The first step in the XP process, like any other
development method, would be to define the system requirements
• The customer begins by meeting with programmers and providing user stories (short, simple requirements definition)
• Programmers review user stories to determine the project’s requirements, priorities, and scope
• User stories do not deal with technical details and are so short that they are often written on index cards

29
An Extreme Programming (XP) Example (Cont.)
• Programming team regularly meets with the customer, who tests prototype releases as they become available
• Extreme Programming uses parallel programming where two programmers work on the same task on the same computer • One drives (programs) while the other
navigates (watches) • The onlooker examines the code strategically
to see the forest while the driver is concerned with the individual trees immediately in front of him or her

30
The Future of Agile Development • Agile methodology is becoming very popular for
software projects • Supporters boast that it speeds up software
development and delivers precisely what the customer wants, when the customer wants it, while fostering teamwork and empowering employees
• Critics claim it lacks discipline and produces systems of questionable quality and may not work as well for larger projects because of their complexity and the lack of focus on a well-defined end product
31
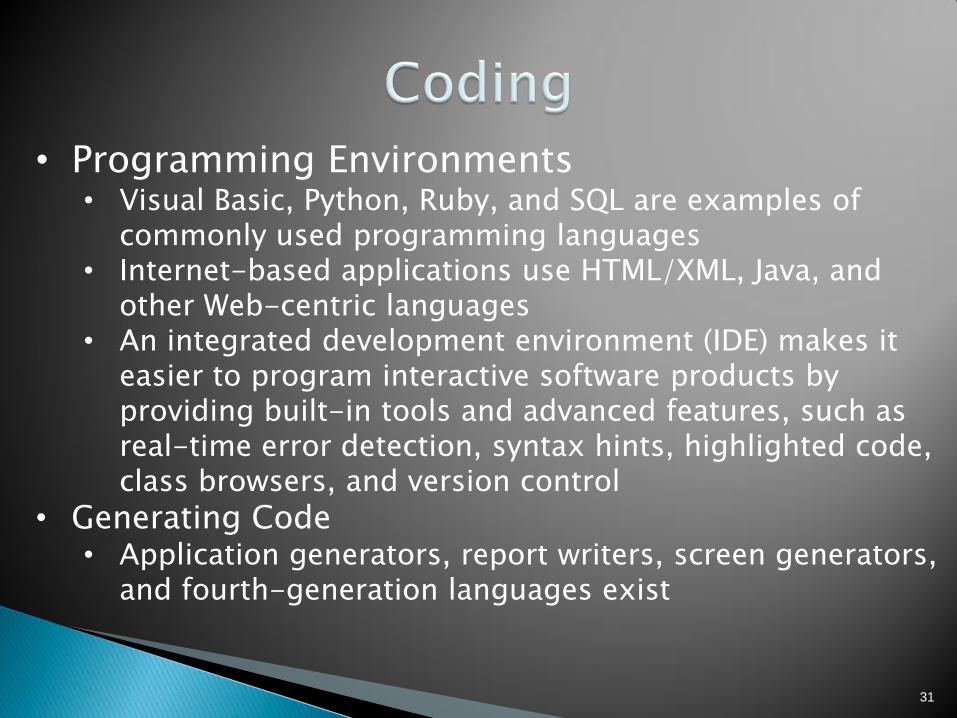
• Programming Environments • Visual Basic, Python, Ruby, and SQL are examples of
commonly used programming languages • Internet-based applications use HTML/XML, Java, and
other Web-centric languages • An integrated development environment (IDE) makes it
easier to program interactive software products by providing built-in tools and advanced features, such as real-time error detection, syntax hints, highlighted code, class browsers, and version control
• Generating Code • Application generators, report writers, screen generators,
and fourth-generation languages exist
32
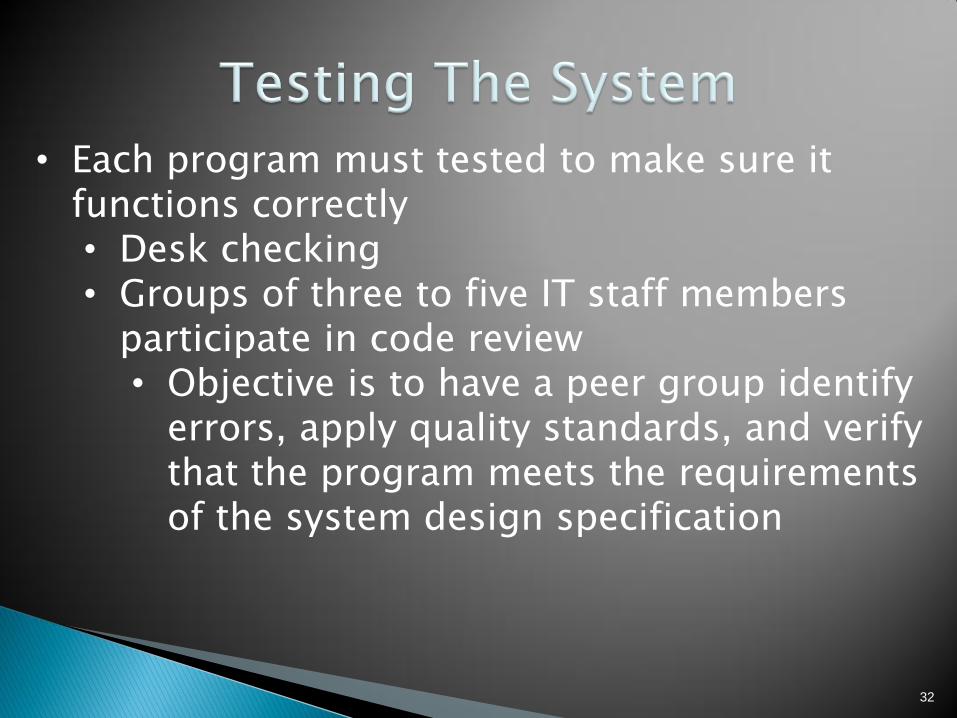
• Each program must tested to make sure it functions correctly • Desk checking • Groups of three to five IT staff members
participate in code review • Objective is to have a peer group identify
errors, apply quality standards, and verify that the program meets the requirements of the system design specification
33
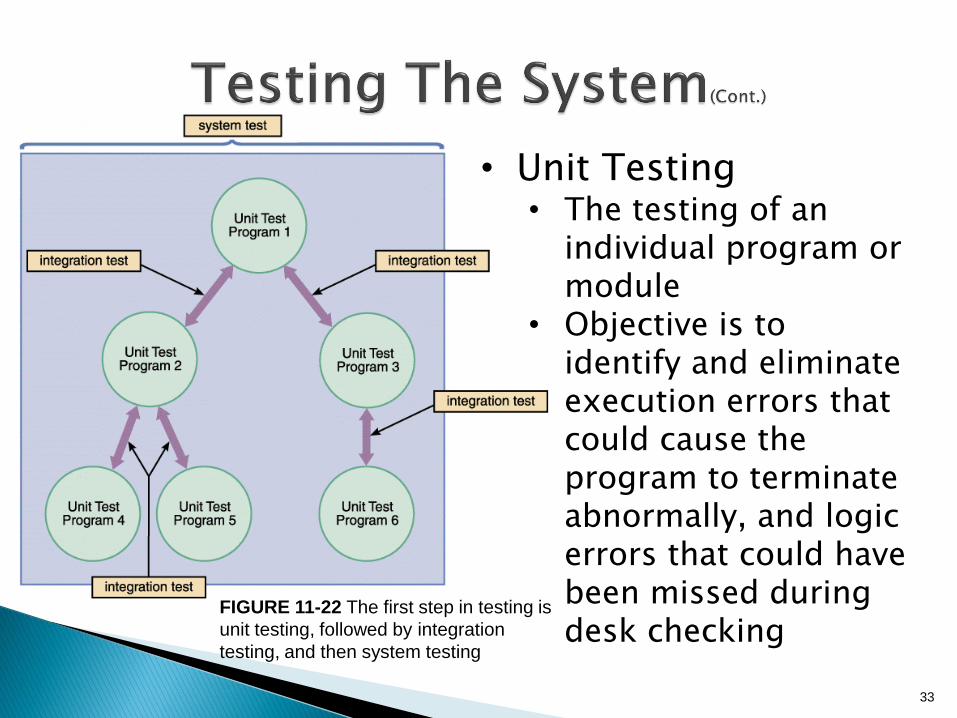
FIGURE 11-22 The first step in testing is
unit testing, followed by integration
testing, and then system testing
• Unit Testing • The testing of an
individual program or module
• Objective is to identify and eliminate execution errors that could cause the program to terminate abnormally, and logic errors that could have been missed during desk checking

34
• Unit Testing (Cont.)
• Test data should contain both correct data and erroneous data and should test all possible situations that could occur
• Programs that interact with other programs and files are tested individually, before they are integrated into the system
• Someone other than the programmer who wrote the program usually creates the test data and reviews the results
• Integration Testing • Testing two or more programs that depend on each other to
make sure that the programs work together properly

35
• System Testing • Perform a final test of all programs • Verify that the system will handle valid and invalid data
properly • Ensure that the IT staff has the documentation and
instructions needed to operate the system properly and that backup and restart capabilities of the system are adequate Demonstrate that users can interact with the system successfully
• Verify that all system components are integrated properly and that actual processing situations will be handled correctly
• Confirm that the information system can handle predicted volumes of data in a timely and efficient manner
36
• Program Documentation • Program documentation describes the inputs,
outputs, and processing logic for all program modules
• Process starts in the systems analysis phase and continues during systems implementation
• Systems analysts prepare overall documentation, such as process descriptions and report layouts, early in the SDLC
• This documentation guides programmers, who construct modules that are well supported by internal and external comments and descriptions that can be understood and maintained easily
37
• System Documentation • Describes the system’s functions and how they are
implemented • Includes data dictionary entries, data flow diagrams, object
models, screen layouts, source documents, and the systems request that initiated the project
• Operations Documentation • Operations documentation contains all the information
needed for processing and distributing online and printed output
• User Documentation • Consists of instructions and information to users who will
interact with the system and includes user manuals, Help screens, and tutorials

38
• User Documentation (Cont.)
• A system overview that clearly describes all major system features, capabilities, and limitations
• Description of source document content, preparation, processing, and samples
• Overview of menu and data entry screen options, contents, and processing instructions
• Examples of reports that are produced regularly or available at the user’s request, including samples
• Security and audit trail information • Explanation of responsibility for specific input, output, or
processing requirements • Procedures for requesting changes and reporting problems • Examples of exceptions and error situations • Frequently asked questions (FAQs) • Explanation of how to get help and procedures for updating the
user manual
39
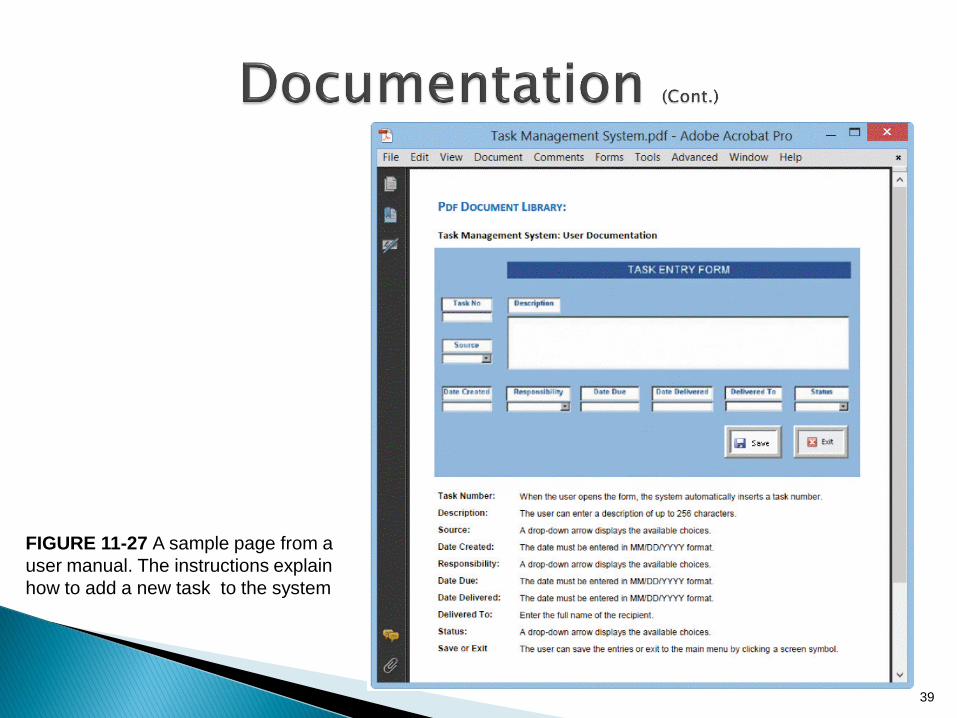
FIGURE 11-27 A sample page from a
user manual. The instructions explain
how to add a new task to the system

40
• After system testing is complete, you present the results to management
• You should describe the test results, update the status of all required documentation, and summarize input from users who participated in system testing
• You also must provide detailed time schedules, cost estimates, and staffing requirements for making the system fully operational

41
• Prepare a separate operational and test environment
• Provide training for users, managers, and IT staff
• Perform data conversion and system changeover
• Carry out a post-implementation evaluation of the system
• Present a final report to management

42
• The environment for the actual system operation is called the operational environment or production environment
• The environment that analysts and programmers use to develop and maintain programs is called the test environment • A separate test environment is necessary to
maintain system security and integrity and protect the operational environment

43
FIGURE 11-28 The test environment versus the operational
environment. Notice that access to the test environment is
limited to IT staff, while the operational environment is
restricted to users
Access to the operational environment is limited to users and must strictly be controlled
44
• Training Plan • Essential to provide the right training for
the right people at the right time • The first step is to identify who should
receive training and what training is needed
• Look carefully at the organization, how the system will support business operations, and who will be involved or affected

45
FIGURE 11-30 Examples of training
topics for three different groups.
Users, managers, and IT staff
members have different training
needs

46
• Vendor Training • If the system includes the purchase of software or
hardware, then vendor-supplied training is one of the features you should include in the RFPs (requests for proposal) and RFQs (requests for quotation) that you send to potential vendors
• Webinars, Podcasts, and Tutorials • Many vendors offer Web-based training options, including
Webinars, podcasts, and tutorials • A Webinar (web and seminar) is an Internet-based training
session that provides an interactive experience • A pre-recorded Webinar can be delivered as a Webcast – a
one-way transmission, whenever a user wants support
• Outside Training • Many training consultants, institutes, and firms are available that
provide either standardized or customized training packages

47
• Training Tips • The IT staff and user departments often share
responsibility for developing and conducting training programs • Train people in groups, with separate training programs
for distinct groups • Select the most effective place to conduct the training. • Provide for learning by hearing, seeing, and doing • Rely on previous trainees
• Interactive Training • Most people prefer hands-on training • Less-expensive methods can be used, including training
manuals, printed handouts, and online materials

48
FIGURE 11-33 A sample
lesson in an online tutorial
• ONLINE TRAINING • Regardless of the
instructional method, training lessons should include step-by-step instructions for using the features of the information system
• Training materials should resemble actual screens, and tasks should be typical of a user’s daily work — the more realistic, the better

49
FIGURE 11-34 You can use free software
such as Windows Snipping Tool for image
capture, Wisdom-Soft Auto Screen Recorder
for live-motion video, and Windows Sound
Recorder for audio narration. After you create
the media, you can import the material into
Windows Live Movie Maker
• VIDEO TUTORIALS • The Video Learning
Sessions for this textbook were initially created as classroom teaching tools
• Later, they were polished, edited, and transformed into streaming videos
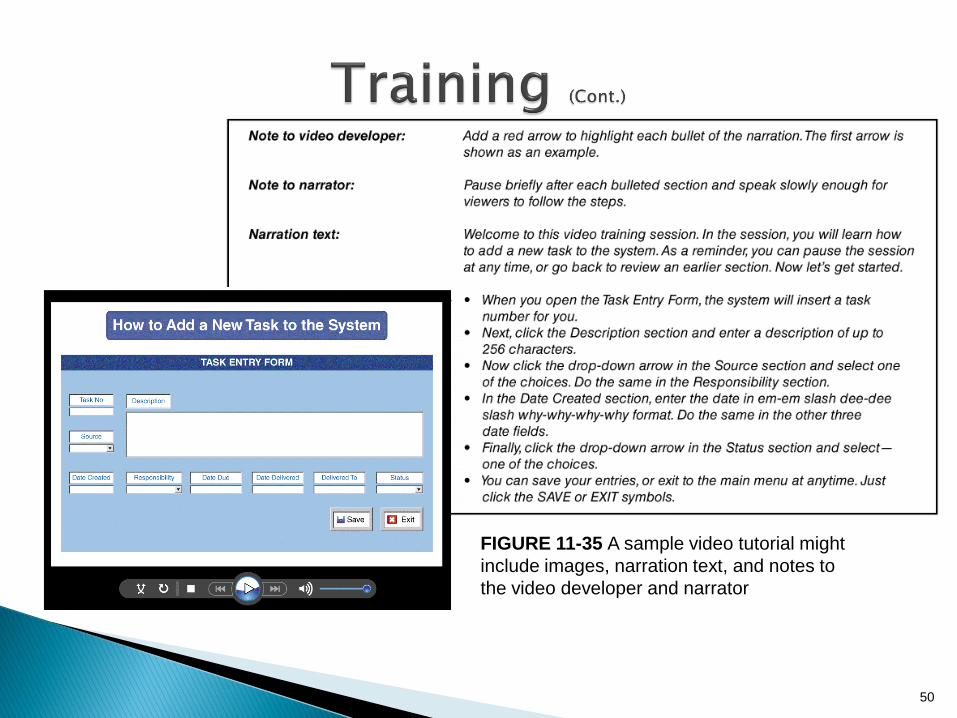
50
FIGURE 11-35 A sample video tutorial might
include images, narration text, and notes to
the video developer and narrator

51
FIGURE 11-36 Camtasia is a
moderately-priced video editing
tool that can produce
professional-quality
training videos. In this example, a
live video clip explains how to
create a structure chart using the
Visible Analyst® CASE tool.
Notice the narration track at the
bottom, which shows the sound
waves that were recorded
52
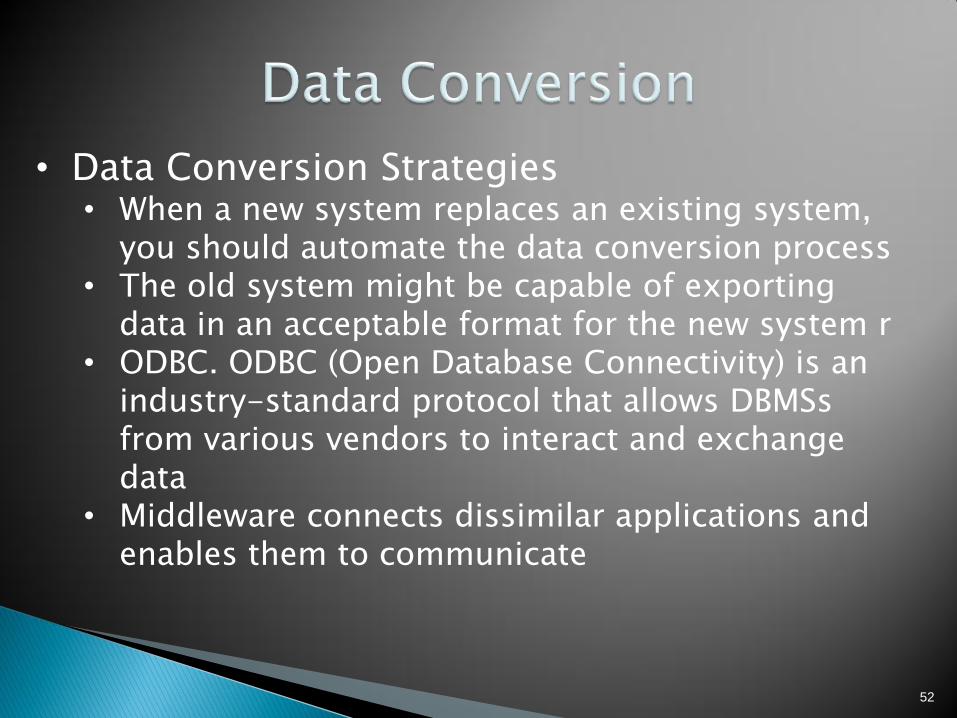
• Data Conversion Strategies • When a new system replaces an existing system,
you should automate the data conversion process • The old system might be capable of exporting
data in an acceptable format for the new system r • ODBC. ODBC (Open Database Connectivity) is an
industry-standard protocol that allows DBMSs from various vendors to interact and exchange data
• Middleware connects dissimilar applications and enables them to communicate
53
• Data Conversion Security and Controls • Maintain strict input controls during the
conversion process • Ensure that all system control measures are in
place and operational to protect data from unauthorized access and to help prevent erroneous input
54
System changeover is the process of putting the new information system online and retiring the old system
Changeover can be rapid or slow, depending on the method
The four changeover methods are:
◦ Direct cutover
◦ Parallel operation
◦ Pilot operation
◦ Phased operation

55
Direct Cutover ◦ Causes the changeover
from the old system to the new system to occur immediately when the new system becomes operational
◦ Usually is the least expensive changeover method because the IT group has to operate and maintain only one system at a time FIGURE 11-37 The four system
changeover methods
56
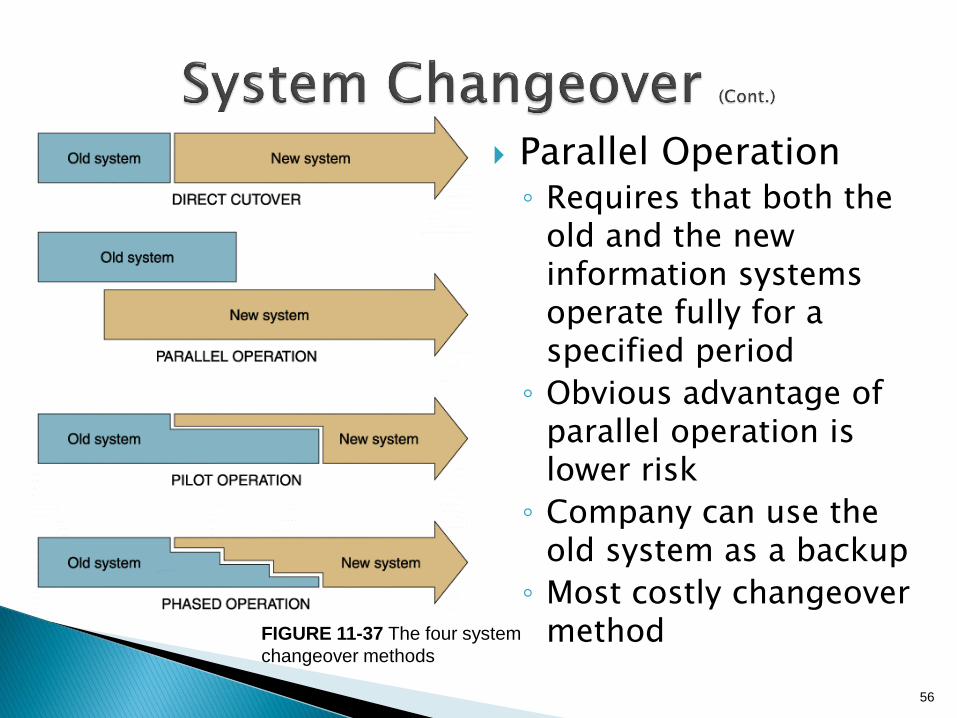
Parallel Operation ◦ Requires that both the
old and the new information systems operate fully for a specified period
◦ Obvious advantage of parallel operation is lower risk
◦ Company can use the old system as a backup
◦ Most costly changeover method FIGURE 11-37 The four system
changeover methods

57
Pilot Operation ◦ Implementing the
complete new system at a selected location of the company
◦ The old system continues to operate for the entire organization, including the pilot site
◦ Restricting the implementation to a pilot site reduces the risk of system failure
◦ Less expensive than a parallel operation for the entire company FIGURE 11-37 The four system
changeover methods
58
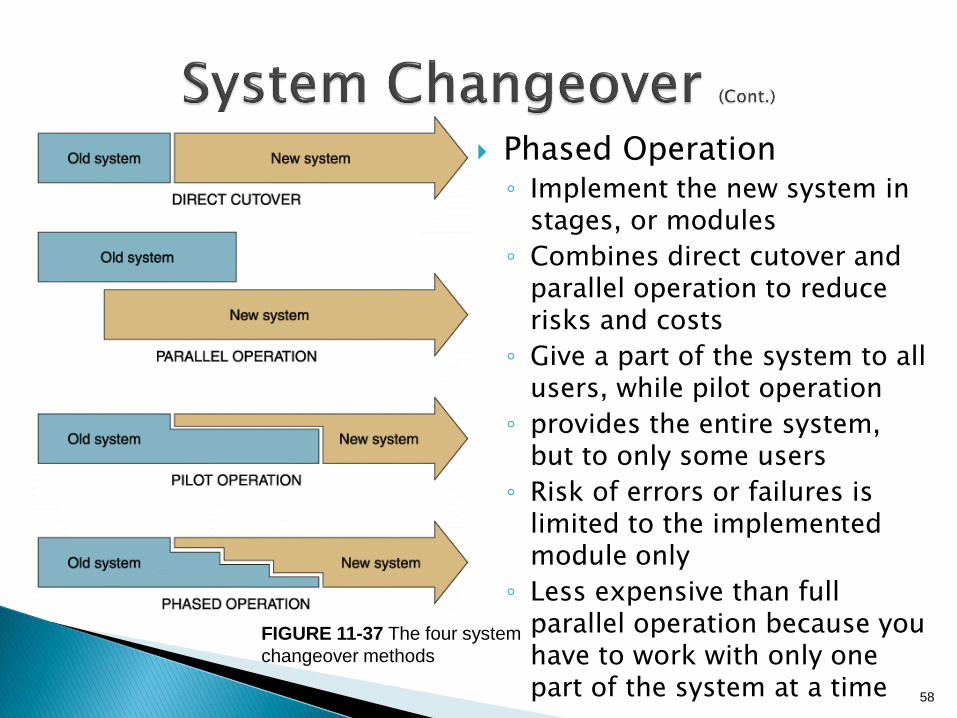
Phased Operation ◦ Implement the new system in
stages, or modules
◦ Combines direct cutover and parallel operation to reduce risks and costs
◦ Give a part of the system to all users, while pilot operation
◦ provides the entire system, but to only some users
◦ Risk of errors or failures is limited to the implemented module only
◦ Less expensive than full parallel operation because you have to work with only one part of the system at a time
FIGURE 11-37 The four system
changeover methods

59
FIGURE 11-38 Relative risk and cost characteristics of the four changeover methods
60
Post-Implementation Evaluation ◦ A post-implementation evaluation assesses the
overall quality of the information system
Accuracy, completeness, and timeliness of information system output
User satisfaction
System reliability and maintainability
Adequacy of system controls and security measures
Hardware efficiency and platform performance
Effectiveness of database implementation
Performance of the IT team
Completeness and quality of documentation
61
Quality and effectiveness of training Accuracy of cost-benefit estimates and
development schedules When evaluating a system, you should: ◦ Interview members of management and key
users ◦ Observe users and computer operations
personnel actually working with the new information system
◦ Read all documentation and training materials ◦ Examine all source documents, output reports,
and screen displays ◦ Use questionnaires to gather information and
opinions from a large number of users ◦ Analyze maintenance and help desk logs
62
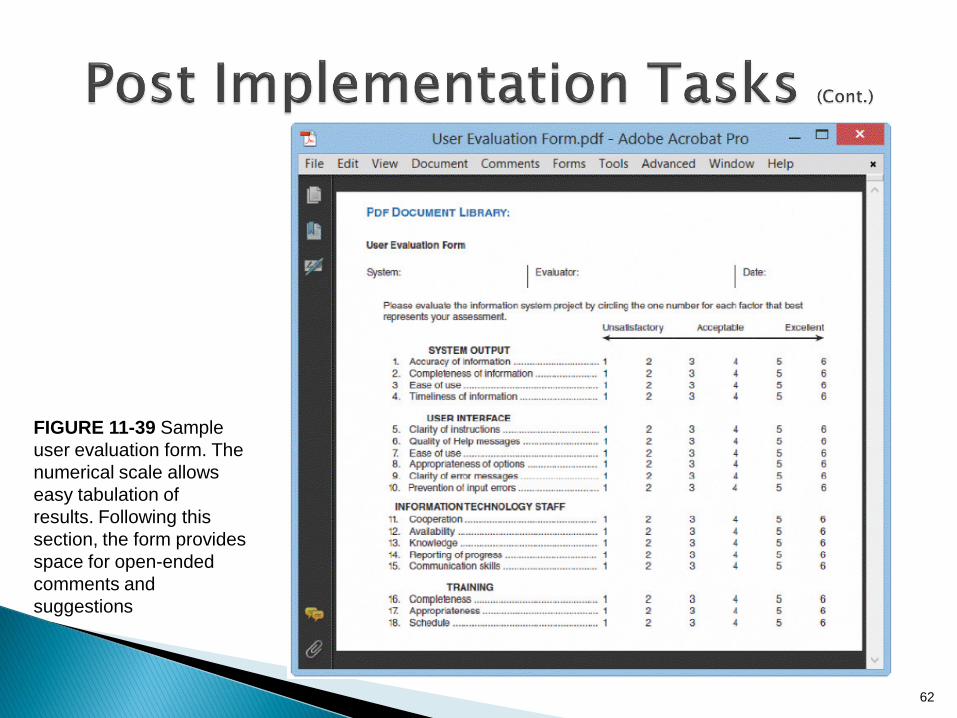
FIGURE 11-39 Sample
user evaluation form. The
numerical scale allows
easy tabulation of
results. Following this
section, the form provides
space for open-ended
comments and
suggestions
63
◦ Final Report to Management
At the end of each SDLC phase, you submit a report to management
This report should include the following:
Final versions of all system documentation
Planned modifications and enhancements to the system that have been identified
Recap of all systems development costs and schedules
Comparison of actual costs and schedules to the original estimates
Post-implementation evaluation, if it has been performed
64
The systems implementation phase consists of application development, testing, installation, and evaluation of the new system
Structured development relies heavily on DFDs and structure charts
System developers also can use more generic tools to help them translate the system logic into properly functioning program modules
These tools include entity-relationship diagrams, flowcharts, pseudocode, decision tables, and decision trees
In agile development the customer creates user stories describing required features and priority levels
Cohesion measures a module’s scope and processing characteristics
Coupling measures relationships and interdependence among modules
The four steps to creating a structure chart are review DFDs and object models to identify the processes and methods, identify the program modules and determine control-subordinate relationships, add symbols for couples and loops, and analyze the structure chart
65

Programmers perform desk checking, code review, and unit testing tasks during application development
In addition to system documentation, analysts and technical writers also prepare operations documentation and user documentation
During the installation process, you establish an operational, or production, environment for the new information system that is completely separate from the test environment
66

Everyone who interacts with the new information system should receive training appropriate to his or her role and skills
Data conversion often is necessary when installing a new information system
System changeover is the process of putting the new system into operation. Four changeover methods exist: direct cutover, parallel operation, pilot operation, and phased operation
67
A post-implementation evaluation assesses and reports on the quality of the new system and the work done by the project team
The final report to management includes the final system documentation, describes any future system enhancements that already have been identified, and details the project costs
68