Chapter 11 Conventional Gas Chromatography
78
Chapter 11 Conventional Gas Chromatography
Transcript of Chapter 11 Conventional Gas Chromatography

Chapter 11
Conventional Gas Chromatography

Gas Chromatography
• GC is the first instrumental chromatographic method developed commercially
• It is relatively easy to introduce a stable flow and pressure for the mobile phase, that is the carrier gas
• The equipment is simple. All that is really needed is cylinder of compressed air, pressure regulator and a valve

Introduction
Principles
• Partition of molecules between mobile phase
and stationary phase
Separation technique
• Gas is the mobile phase and liquid (GLC) or solid (GSC) is the stationary phase
• GLC: liquid is coated on an inert solid;
separation is the result of variable solubilities in the liquid phase
• GSC: Particulate solid like molecular sieve is the
stationary phase;
separation is the result of variable adsorption on the
solid surface

A
BC
D
E
Sample: mixture of volatile liquids (~1L)
Gas Chromatography
Gas Chromatogram
0 5 10 15 20
Time (minutes)
Ab
un
dan
ce
A
B
C
D
E
Gas Chromatograph

Uses of GC
• Separation and analysis of organic
compounds
• Testing purity of compounds
• Determine relative amounts of
components in mixtures
• Compound identification
• Isolation of pure compounds (micro
scale work)

Advantages of the GC
• Speed: minutes or seconds
• Resolution: complex samples
• Sensitivity: 10-9 or even 10-12 g/s
• Versatility: Gases, liquids or solids (qualitative & quantitative)
• GLC is more common than GSC in terms of flexibility and resolution
• Salts and other ionic compounds + high molecular weight may not be determined by the GC. They can be determined by liquid chromatography or pyrolysis chromatography
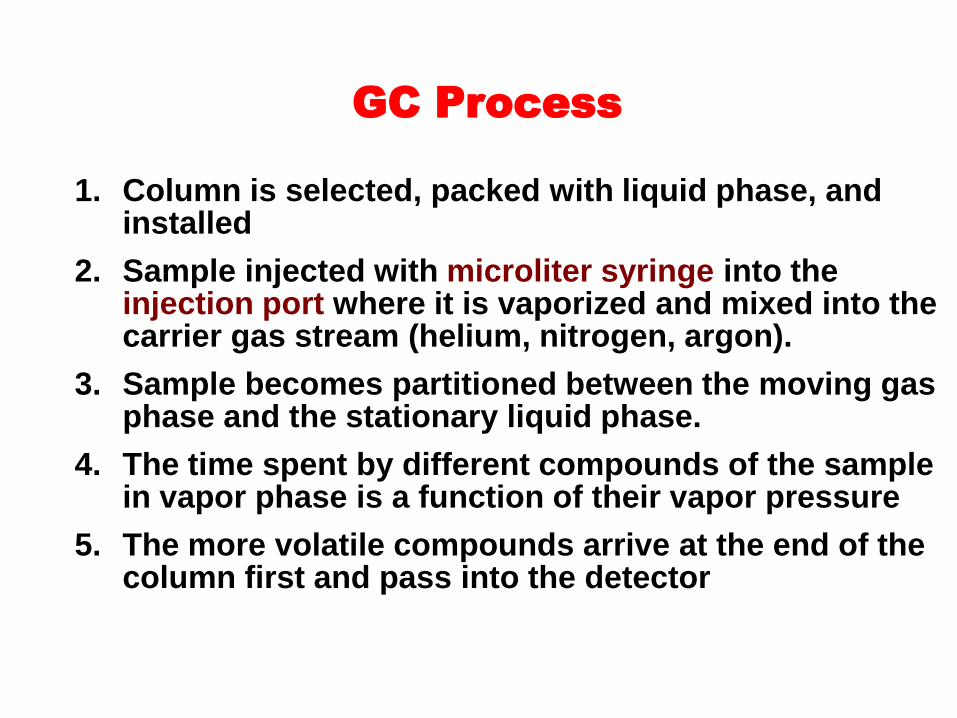
GC Process
1. Column is selected, packed with liquid phase, and installed
2. Sample injected with microliter syringe into the injection port where it is vaporized and mixed into the carrier gas stream (helium, nitrogen, argon).
3. Sample becomes partitioned between the moving gas phase and the stationary liquid phase.
4. The time spent by different compounds of the sample in vapor phase is a function of their vapor pressure
5. The more volatile compounds arrive at the end of the column first and pass into the detector
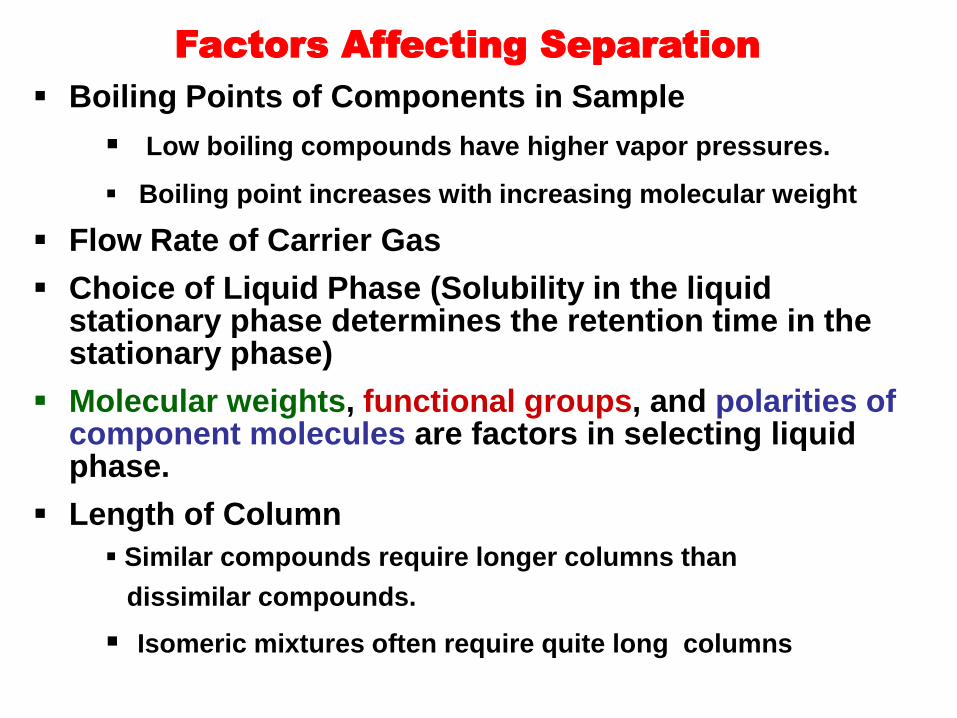
Factors Affecting Separation
Boiling Points of Components in Sample
Low boiling compounds have higher vapor pressures.
Boiling point increases with increasing molecular weight
Flow Rate of Carrier Gas
Choice of Liquid Phase (Solubility in the liquid stationary phase determines the retention time in the stationary phase)
Molecular weights, functional groups, and polarities of component molecules are factors in selecting liquid phase.
Length of Column
Similar compounds require longer columns than
dissimilar compounds.
Isomeric mixtures often require quite long columns
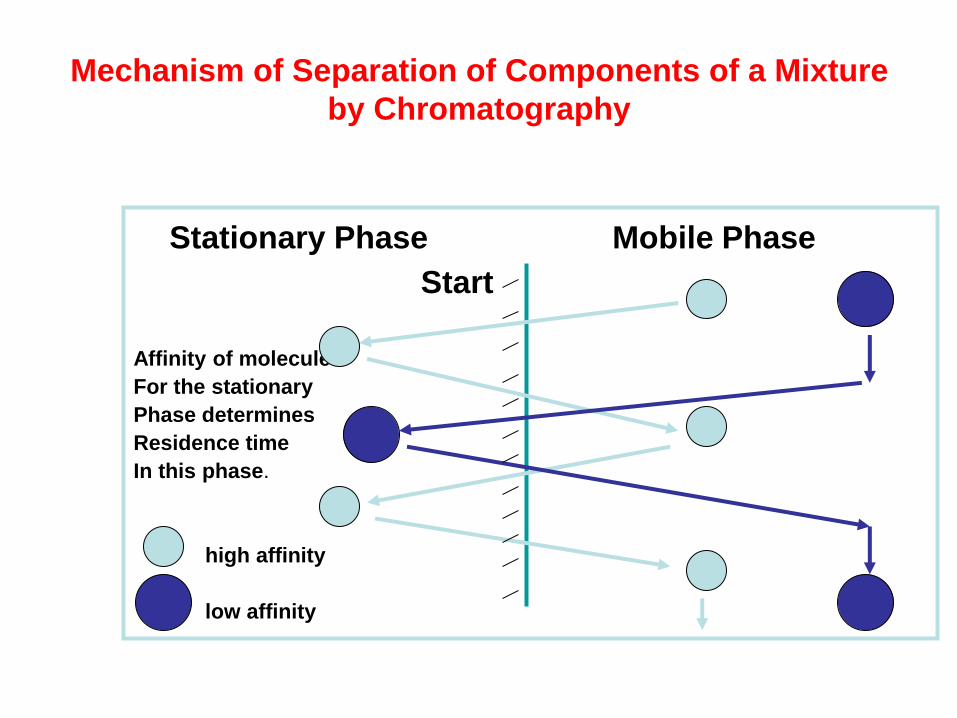
Mechanism of Separation of Components of a Mixture
by Chromatography
Stationary Phase Mobile Phase
Start
Affinity of molecule
For the stationary
Phase determines
Residence time
In this phase.
high affinity
low affinity
GC Instrumentation
• Carrier gas
• Sample Injector
• Column
• Detector

Schematic Diagram of a Gas Chromatograph

Filters/Traps
Air
Hyd
rog
en
Ga
s C
arrie
r
Column
Gas Chromatography System
• gas system
• Inlet (Injector)
• column
• detector
• Readout system
Data system
Syringe/Sampler
Inlets
Detectors
Regulators
H
RESET


Gas Flow

Carrier Gas
• Carrier gases, must be chemically inert,
• Include helium, argon, nitrogen, carbon dioxide, and hydrogen.
• The choice of gases is often dictated by the detector used.
• Associated with the gas supply are pressure regulators, gauges, and flow meters.
• The carrier gas system often contains a molecular
sieve to remove water or other impurities.
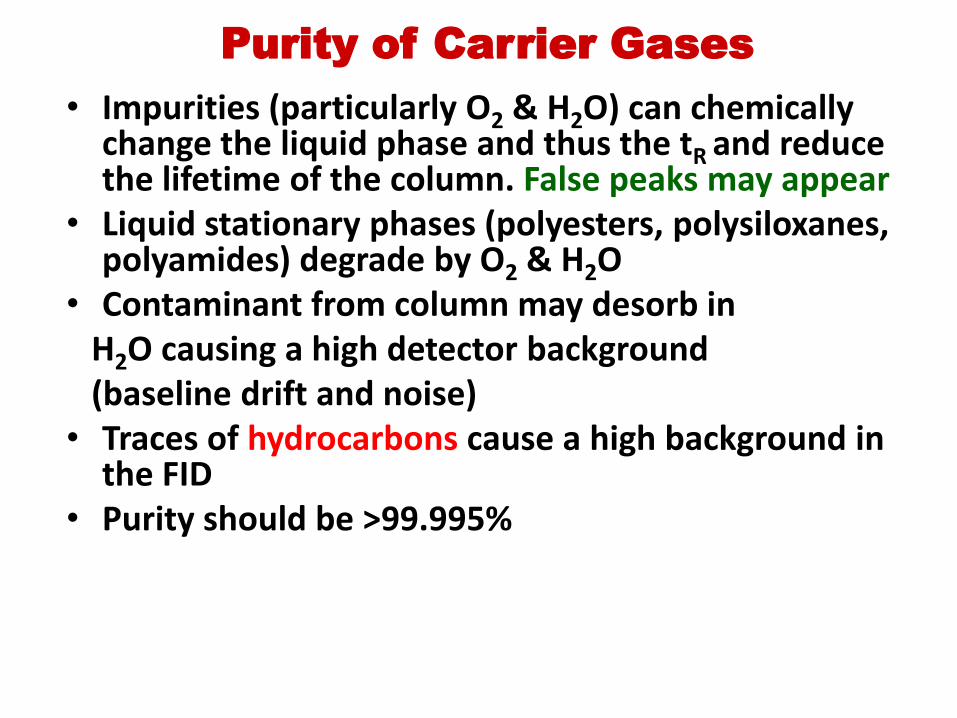
Purity of Carrier Gases
• Impurities (particularly O2 & H2O) can chemically change the liquid phase and thus the tR and reduce the lifetime of the column. False peaks may appear
• Liquid stationary phases (polyesters, polysiloxanes, polyamides) degrade by O2 & H2O
• Contaminant from column may desorb in H2O causing a high detector background (baseline drift and noise) • Traces of hydrocarbons cause a high background in
the FID • Purity should be >99.995%

Two stage pressure regulator
1. It indicates the pressure left in the cylinder (min. 40 psi)
2. It indicates the increasing pressure delivered to the GC
(min. = 20 psi)
Carrier gas: mainly He and N2

Injection systems
Function
• Introduce sample
• Vaporize sample
• Split sample
Main Components
It is a metal block containing:
•Heaters
•Temperature sensors
•Septum holder on the front
•Connection for the column on the rear
Packed column injection
• Injector is a simple portion of the GC system when packed columns are used
• There are two basic approaches for these injectors
– Injection ports
– Sampling loops/ valves

Various Types of Injection ports
• Split - only a small portion (10:1 and 100:1) of the injected sample goes on column
• Splitless - “all” material injected goes on column
• Usually split/splitless modes are provided to the same instrument.
• Cool on-column injection (Direct on column cold injection. It is used for sensitive materials)
• Programmed temperature - sensitive materials (more durable method than OC)
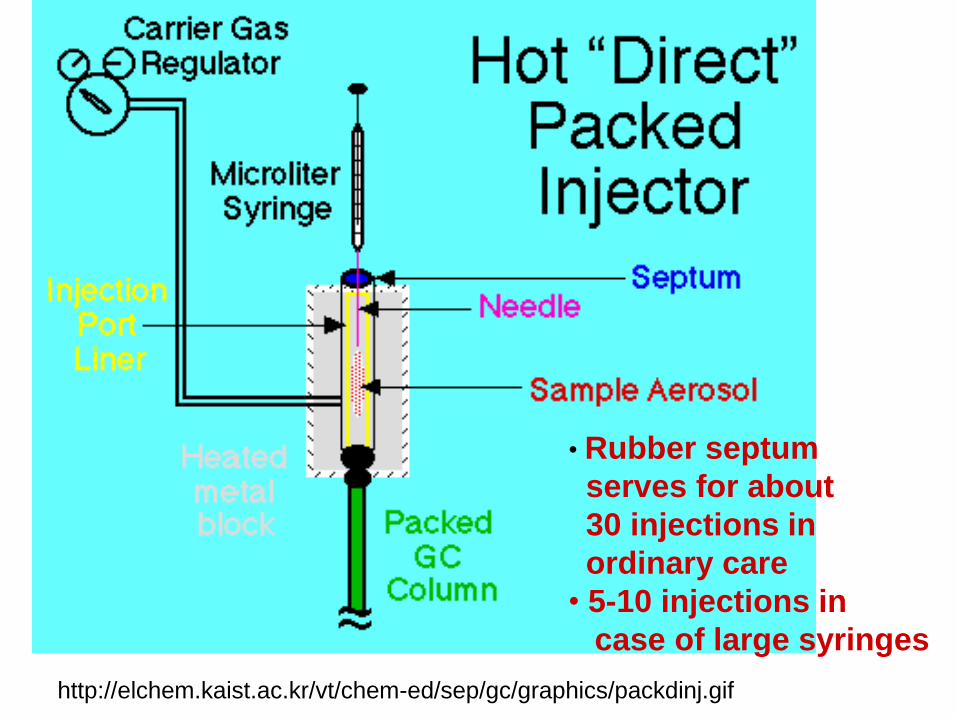
• Rubber septum
serves for about
30 injections in
ordinary care
• 5-10 injections in
case of large syringes
http://elchem.kaist.ac.kr/vt/chem-ed/sep/gc/graphics/packdinj.gif


Injection Port/ Temperature Effects
• The purpose of the port is to flash vaporize the sample and introduce it into the column
• Tinjector should be > 50oC above T column
• Septum of the injector must be:
– Stable at the Tinj
– Replaced regularly to maintain seal

Syringe Injection Methods
• Major source of precision error results from poor injection technique
• Both automatic and manual injection methods are available
• If automatic equipment is present, use it. If not, several approaches can be tried to help reduce injection errors

Injection of liquid sample
• 10 µl syringe is the most popular device • Load the desired volume of liquid, then draw the
plunger back to pull the liquid out of the needle • Insert the needle quickly through the septum as far
as it will go
• Depress the plunger and immediately remove the needle from the injection port
Gas Sampling Loops
(Sampling Valves)
• Introducing a constant amount of a gas can be difficult with a syringe
• Gas sampling loops and valves offer a high precision (+/- 1%) means of introducing gases
• Equipment is relatively inexpensive and only requires a constant temperature for easy use
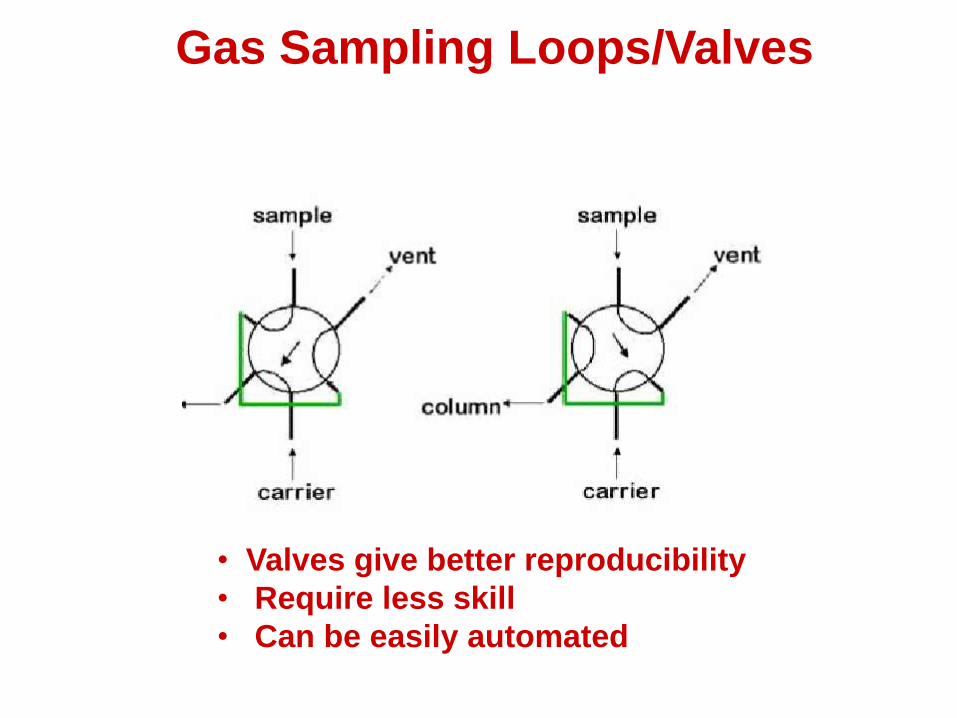
• Valves give better reproducibility
• Require less skill
• Can be easily automated
Gas Sampling Loops/Valves
Injection valve

Injection Port Temperature
• The temp. should be 20-30 oC hotter than the boiling point of the least volatile component – But low enough to prevent sample decomposition and septum bleed
• Temp. may be checked by raising it and watching : Position, or area, or shape of the peaks. Drastic changes
mean the temp. setting is high • It should be 10% above that of the column to ensure rapid
volatilization of the sample. The efficiency of the column is almost constant under this condition
• Components may be vaporized at a temp. ~100oC below its
atmospheric boiling point
• Very high boiling point or temp. sensitive material can be handled by dilution with volatile solvent that permits lowering the injection temp.
This will lower the sensitivity!
• Try various temperatures until peak broadening becomes apparent
• With temp. programming techniques low injection temps become very practical. No rush to vaporize the high boiling components
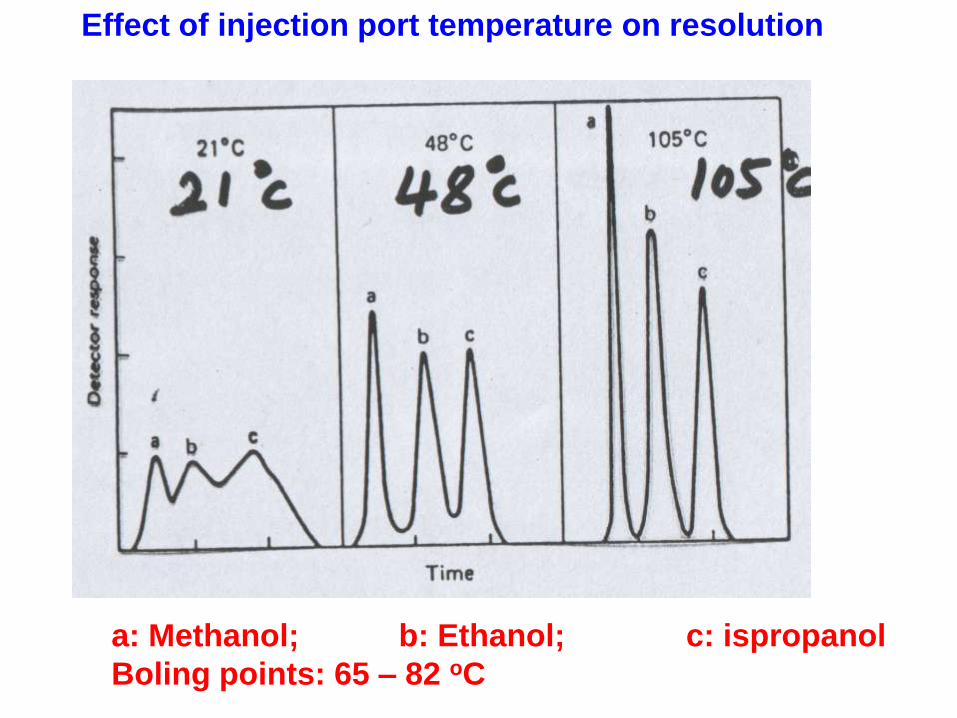
Effect of injection port temperature on resolution
a: Methanol; b: Ethanol; c: ispropanol
Boling points: 65 – 82 oC
Gas Chromatographic Columns
1. Packed Columns for GLC
2. Packed Columns for GSC
3. Capillary Columns

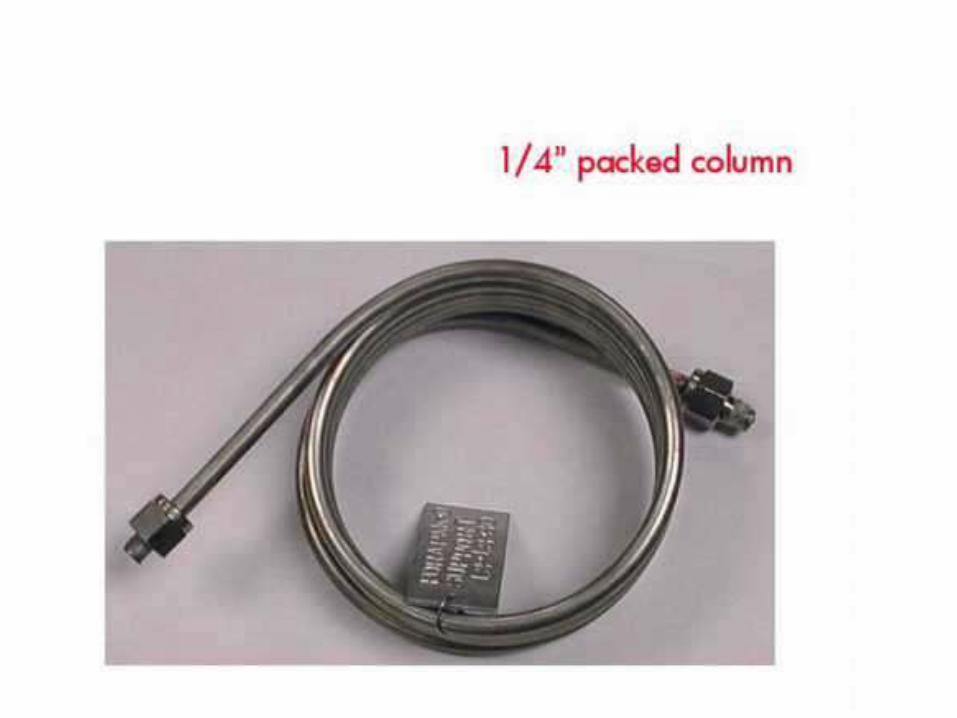
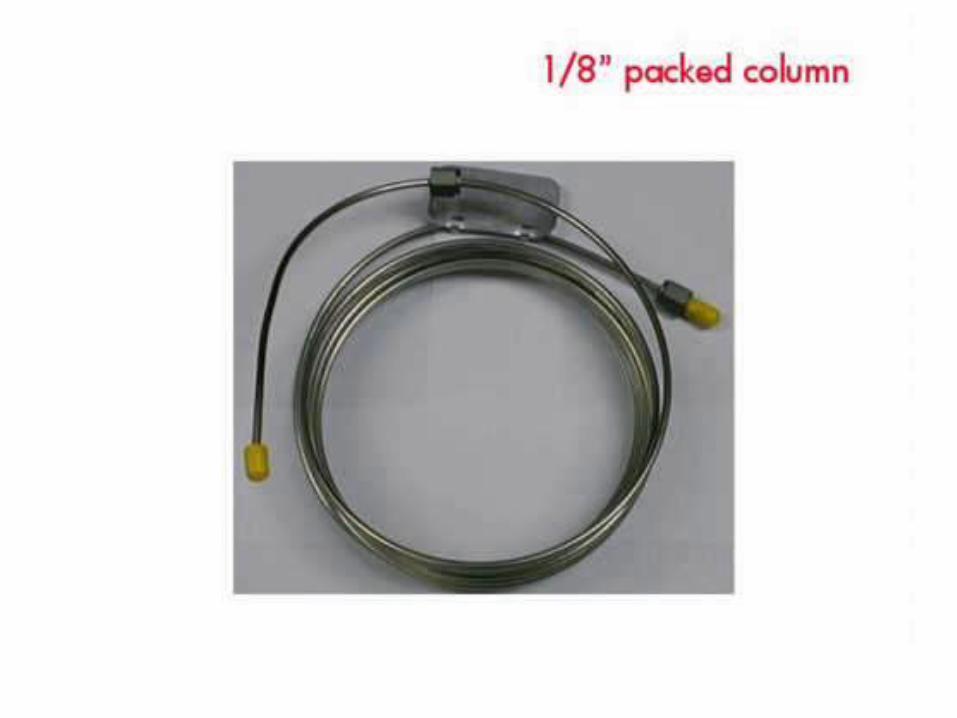
Types of columns
• Packed columns
1/8 – 1/4˝ OD, stainless steel or glass tube
6-20 feet in length
• Capillary (open tubular) columns
0.1- 0.5 mm ID
10-100 meters in length

Capillary (Open tubular columns)


Packed Columns
1. Column material
2. packing material (solid or inert support)
3. Stationary phase
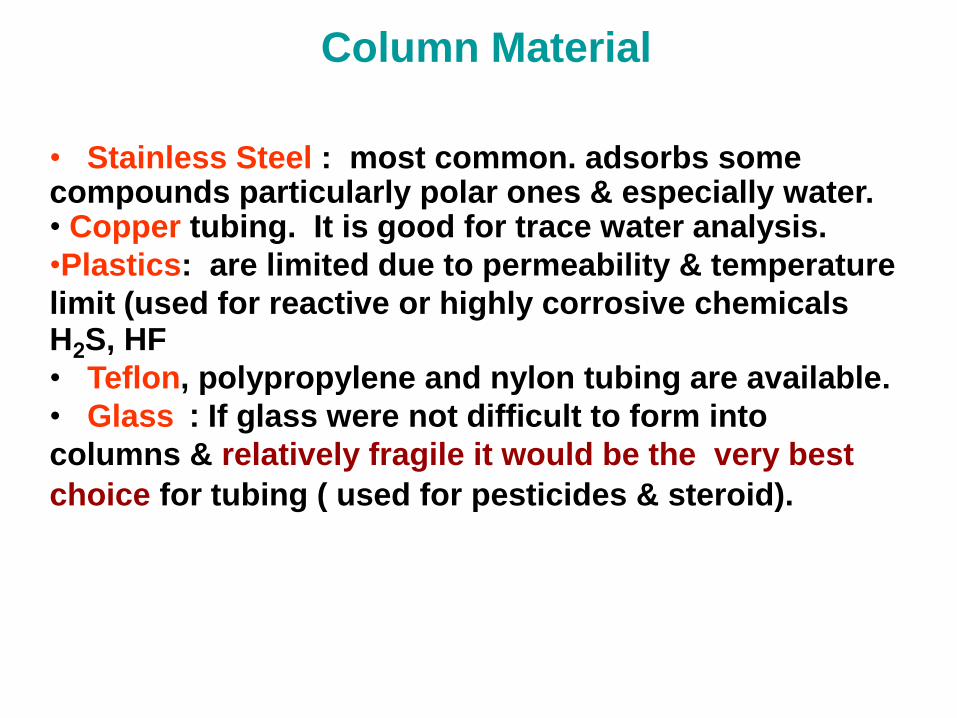
• Stainless Steel : most common. adsorbs some compounds particularly polar ones & especially water. • Copper tubing. It is good for trace water analysis.
•Plastics: are limited due to permeability & temperature
limit (used for reactive or highly corrosive chemicals H2S, HF
• Teflon, polypropylene and nylon tubing are available. • Glass : If glass were not difficult to form into
columns & relatively fragile it would be the very best
choice for tubing ( used for pesticides & steroid).
Column Material
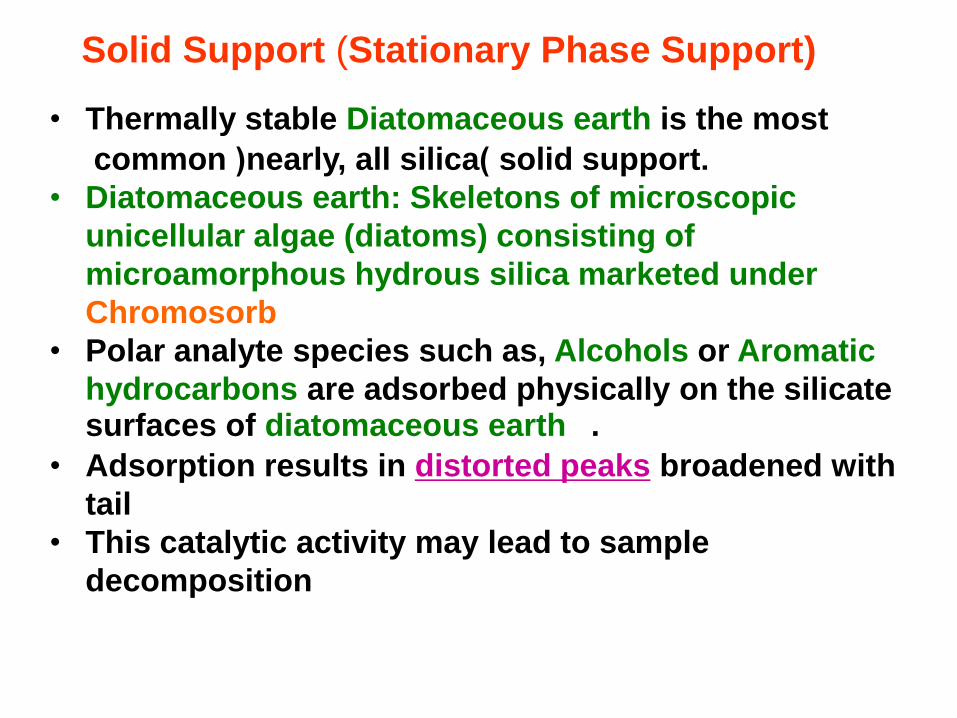
Solid Support (Stationary Phase Support) • Thermally stable Diatomaceous earth is the most
common (nearly, all silica) solid support.
• Diatomaceous earth: Skeletons of microscopic
unicellular algae (diatoms) consisting of
microamorphous hydrous silica marketed under
Chromosorb
• Polar analyte species such as, Alcohols or Aromatic
hydrocarbons are adsorbed physically on the silicate surfaces of diatomaceous earth .
• Adsorption results in distorted peaks broadened with
tail
• This catalytic activity may lead to sample
decomposition
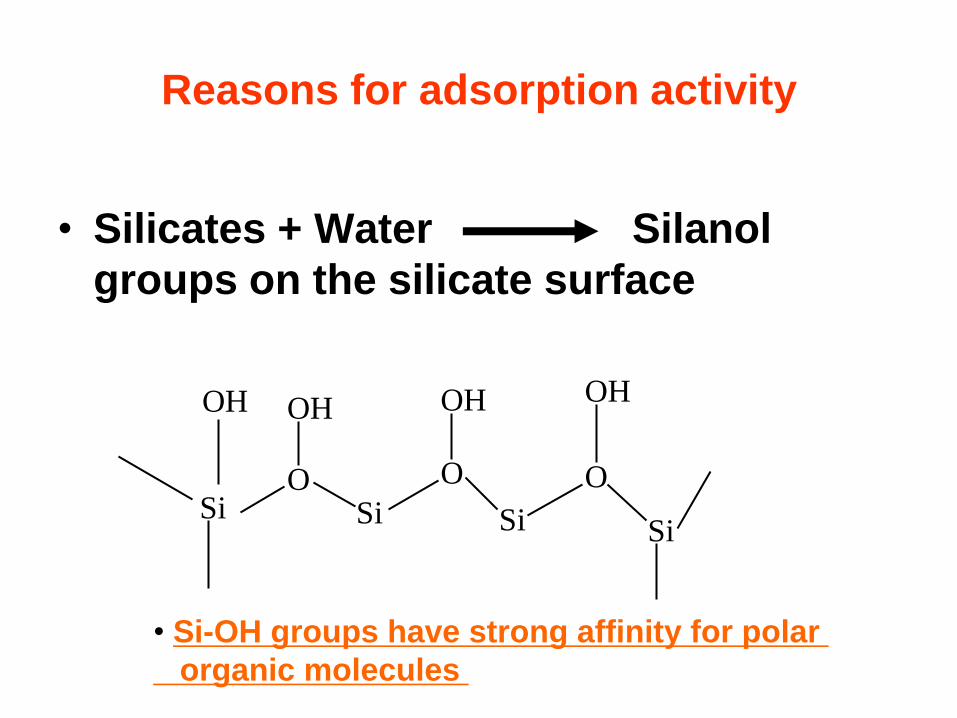
Reasons for adsorption activity
• Silicates + Water Silanol
groups on the silicate surface
SiO
OHOH
Si
O
OH
Si
O
OH
Si
• Si-OH groups have strong affinity for polar
organic molecules
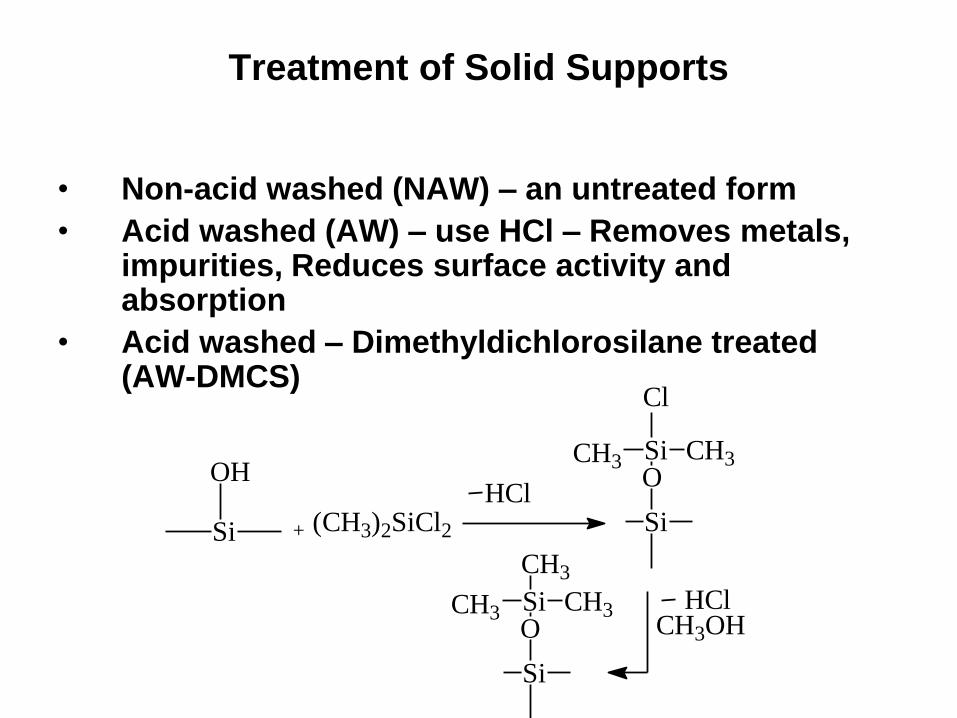
Treatment of Solid Supports
• Non-acid washed (NAW) – an untreated form
• Acid washed (AW) – use HCl – Removes metals, impurities, Reduces surface activity and absorption
• Acid washed – Dimethyldichlorosilane treated (AW-DMCS)
Si
OH
+ (CH3)2SiCl2
HClSi
OSi CH3
CH3OH HCl
Cl
CH3
CH3
Si
OSi
CH3
CH3

Stationary
Liquid Phase
Characteristics of Stationary Liquid Phase
• The stationary phase should provide separation of the sample with a reasonable column life
• Suitable phase is chosen on the basis of : Experience or Experiment.
• It is desirable to have maximum information
about the sample composition : bp.range,
components expected & their structure
• Stationary phases should have similar chemical structure to the sample components
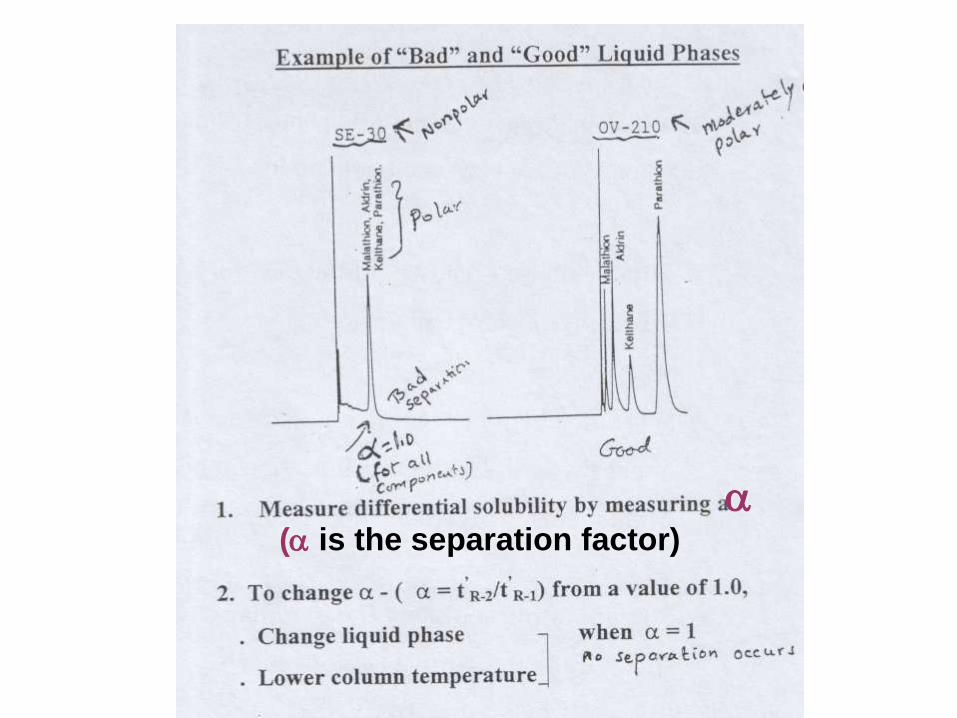
( is the separation factor)
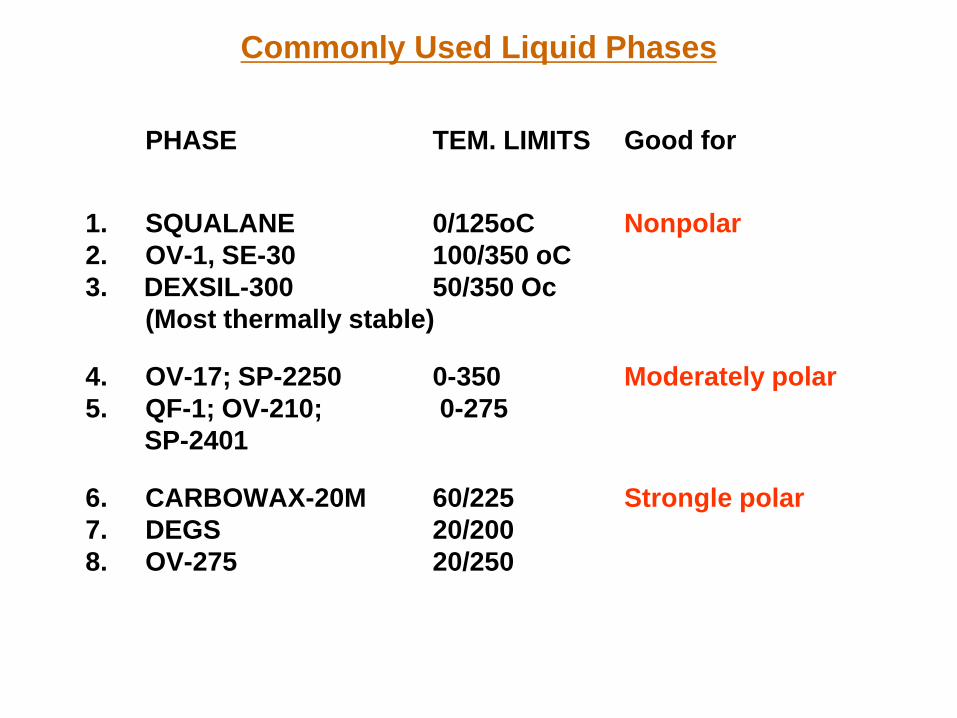
Commonly Used Liquid Phases
PHASE TEM. LIMITS Good for
1. SQUALANE 0/125oC Nonpolar
2. OV-1, SE-30 100/350 oC
3. DEXSIL-300 50/350 Oc
(Most thermally stable)
4. OV-17; SP-2250 0-350 Moderately polar
5. QF-1; OV-210; 0-275
SP-2401
6. CARBOWAX-20M 60/225 Strongle polar
7. DEGS 20/200
8. OV-275 20/250

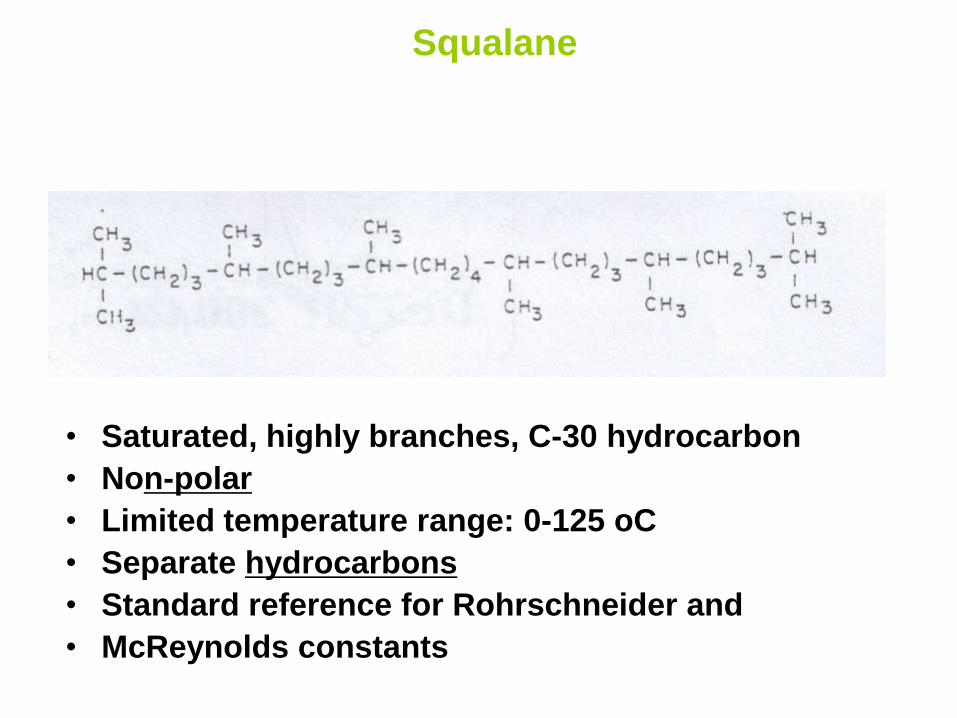
Squalane
• Saturated, highly branches, C-30 hydrocarbon
• Non-polar
• Limited temperature range: 0-125 oC
• Separate hydrocarbons
• Standard reference for Rohrschneider and
• McReynolds constants

• Non-polar
• Temperature range: 100-350oC
• Most widely used liquid phase
• Separate all sample types
OV-1 ( SE-30 )AND SP-2100

OV-17 (SP-2250)
• 50% methyl, 50% phenylpolysiloxane
• Semi-polar
• Temperature range : 0-350oC
• Widely used to separate drugs,
steroids, carbohydrates

Carbowax 20-M
HO – ( - CH2 – CH2 – O-)n – H
• Polymeric polyethylene glycol
• Polar
• Temperature range : 60-225oC
• Widely used for polar samples

Column Temperature
1. As the Column temp. increases a sample component spends more time in the mobile phase.
* This will cause a decrease in the tR (Faster separation)
* tR doubles for every 30oC decrease.
2. Increasing the temp. decreases the band broadening since it
leads to a decrease in the available time for diffusion in the
column.
3. The lower the temperature the better is the separation
* The column temp. should not be less than about 10oC below
the bp of the highest-boiling sample component (other wise
distorted peaks may result).
* Roughly, a temp. equal or slightly above the average b.p of a
sample results in a reasonable elution time (20 to 30 min.).
4. Optimum column temp. depends upon: b.p. of the sample Degree of separation required.

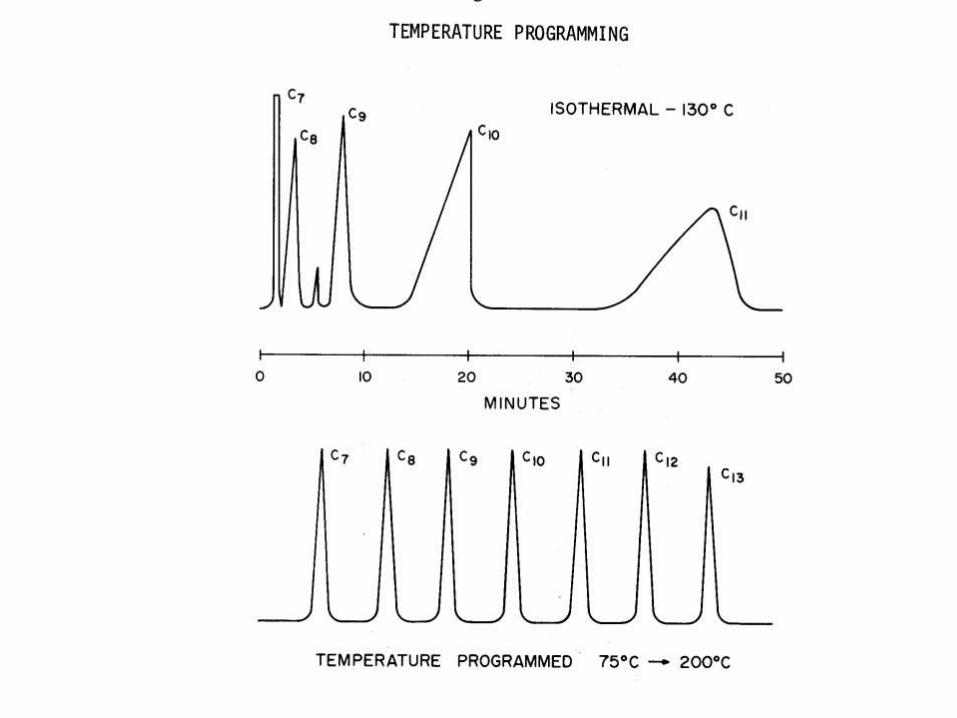
Isothermal and temperature programming analysis
• The column is placed in the oven
– If the temperature is held constant during the
entire analysis then it is called analysis under an
isothermal mode.
– If the temperature is varied during the analysis,
then the process is called temperature
programming
•

Column Temperature Effect (Isothermal Analysis)
Isothermal chromatographic analysis is one which is performed at a constant column temperature.

Conclusion
• Higher temp. enables rapid analysis but
loss in resolution.
• Lower temp. achieves better resolution
but longer analysis time
Narrow Boiling Range Samples
• Isothermal column temperature should be used.
• Select temperature 20-50oC lower than boiling range of sample when thin films are handled.
• Use highest temperature that still allows adequate resolution and stability to shorten analysis time.
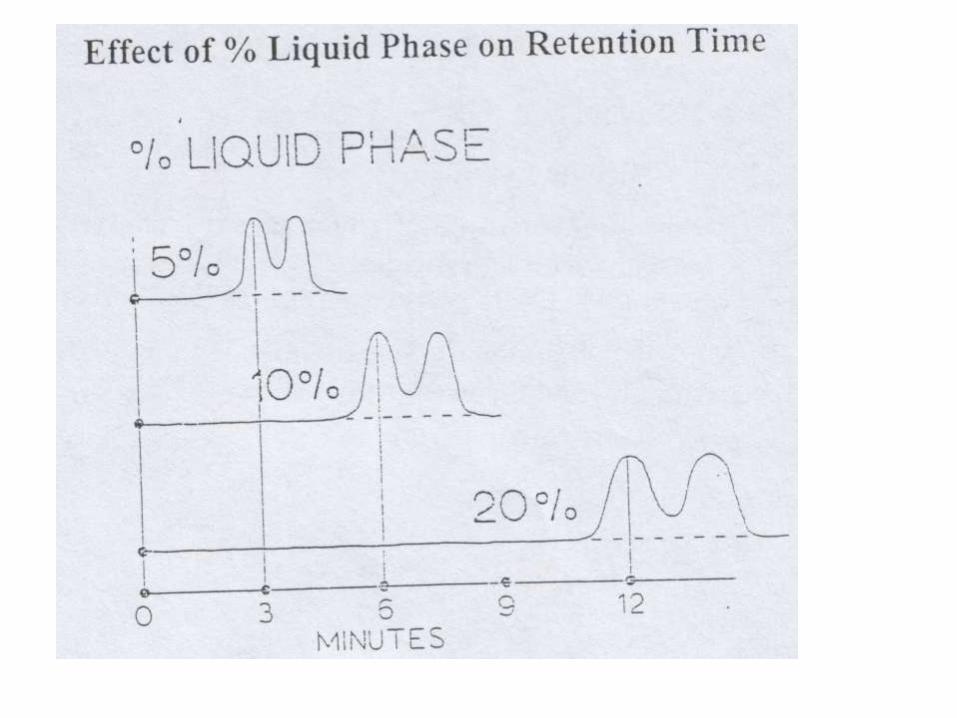
PERCENT LOADING OF STATIONARY PHASE
• How much liquid phase should be coated on the support?
• For analytical columns: 5 – 10%
• Higher loading ( up to ~ 30% ) can be applied for light gases (C1 to C4 hydrocarbons)
• Low Loading (1- 5% ) with very high boiling compounds
• The liquid phase should cover the support almost completely. If the support is inert, this condition is not a must
LIQUID PHASE AND TEMPERATURE LIMIT
• To avoid decomposition, column bleeding and high retention
• Practical Temperature Limits depend upon the following:
* Nature of liquid phase
* Percent loading
* Sensitivity of detector
• Temp. limits reported in most cases for TCD Limits; for FID may be about 100oC less than that for the TCD.

Conditioning the column • Why?
Remove: impurities in liquid phase ; residual
solvent from coating
• How?
• Install the column but do not connect to the detector
• Set the carrier flow 30 ml/min for 1/8 inch
• Heat for 1 hr at 100oC
• Raise the temperature to slightly below the b.p. of liqid phase (about 30 oC higher than expected operating column operation temp.(. Continue heating over night
• Cap the column when it is removed from the instrument
Deatectors
Features of Detectors
• A device that measures physical properties
(preferred), not chemical properties
• The detector generates an electrical signal
proportional to the sample concentration
• Detector and connections must be hot enough
(20 to 30 oC above the column temp. or the
boiling point of the highest boiling component)
so that condensation of the sample or liquid
phase does not occur
• Peak broadening or disappearance is characteristic for condensation in the connections
• Ionization type detectors must be maintained at temp. high enough to avoid not only condensation of sample but also the water or by-products formed in thr ionization process

Most Common GC Detectors
Most common detectors roughly in order from most common
•Thermal Conductivity Detector (TCD or hot wire detector),
•Flame Ionization Detector (FID),
•Electron Capture Detector (ECD),
•Photo Ionization Detector (PID),
•Flame Photometric Detector (FPD),
•Thermionic Detector
•VERY expensive choices: Atomic Emission Detector (AED)
•Ozone- or Fluorine-Induced Chemiluminescence Detectors.
•All of these (except the AED) produce an electrical signal that
varies with the amount of analyte exiting the chromatographic
column.
• Fourier Transform Infrared Detector (FTIR)
• Mass Spectrometer (MS)
• Other: UV, FT-NMR
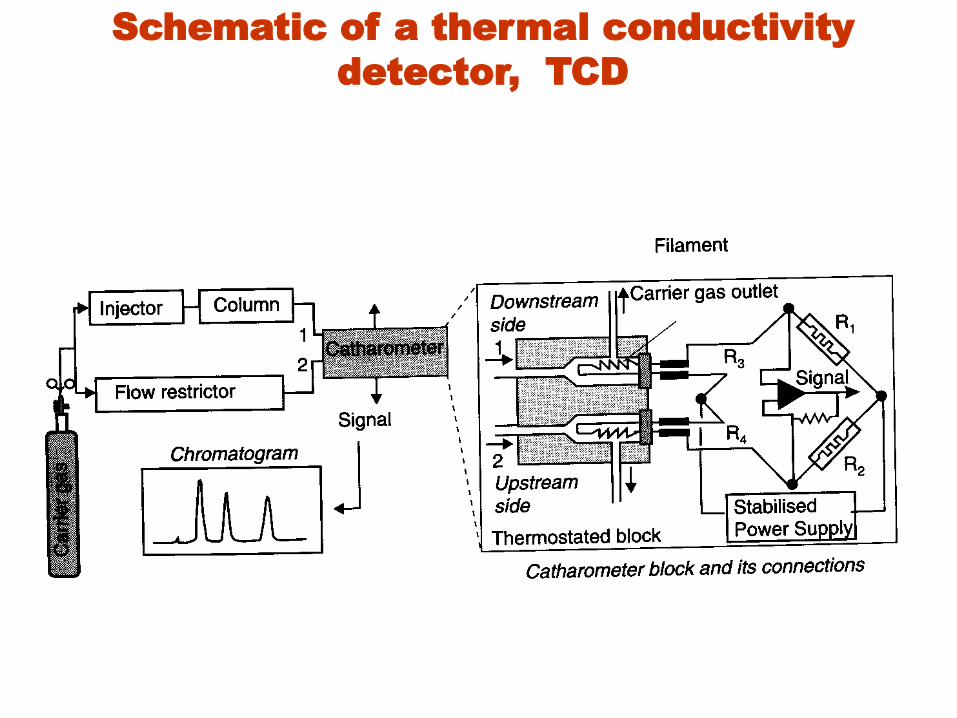
Schematic of a thermal conductivity
detector, TCD

• Two pairs of TCDs are used in gas chromatographs.
• One pair is placed in the column effluent to detect
the separated components as they leave the column.
• Another pair is placed before the injector or in a
separate reference column.
• The resistances of the two sets of pairs are then
arranged in a bridge circuit.
• The heated element may be a fine platinum, gold, or
tungsten wire or, alternatively, a semi conducting
thermistor.
• The resistance of the wire or thermistor gives a
measure of the thermal conductivity of the gas.
• Elutionheat lossincreased resistance needed to
balance bridge = recorded
Flame Ionization Detector
Basic Principle • The effluent from the column is mixed with hydrogen
and air, and ignited.
• Organic compounds burning in the flame produce
ions and electrons which can conduct electricity
through the flame.
• A large electrical potential is applied at the burner tip,
and a collector electrode is located above the flame.
• The current resulting from the pyrolysis of any
organic compound is measured which is proportional
to the carbon content of the molecule entering.
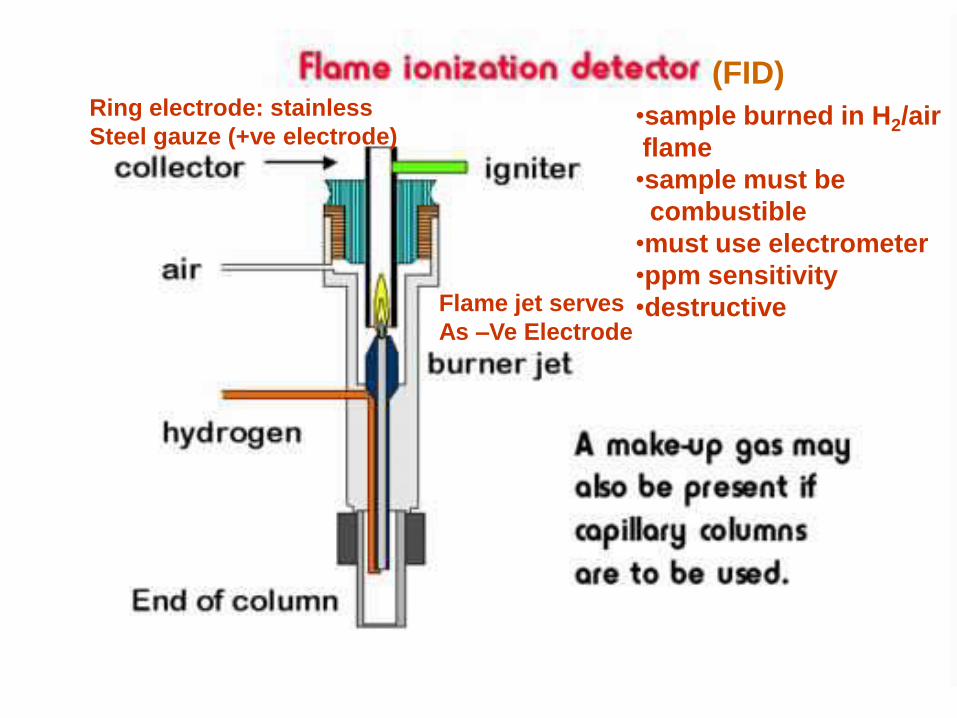
•sample burned in H2/air
flame
•sample must be
combustible
•must use electrometer
•ppm sensitivity
•destructive
(FID)
Flame jet serves
As –Ve Electrode
Ring electrode: stainless
Steel gauze (+ve electrode)

Qualitative analysis by
Chromatographic methods
• Qualitative analysis is based on retention data
• Retention time tR is characteristic of a substance, compared to a standard.
• Reproducibility of retention depends upon several experimental conditions: – column length and diameter,
– stationary and mobile phases,
– column packing,
– column temperature,
– mobile phase flow rate
– and others

Retention time, tR
• tR: It is the time elapsed from the point of injection
to the peak maximum
• Adjusted t’R : It is the time from the maximum of
unretained peak (the peak of the mobile phase or the
air peak) to the peak maximum of a certain
component
• tM (hold up time): is the time required for the mobile
phase to be eluted completely from the column
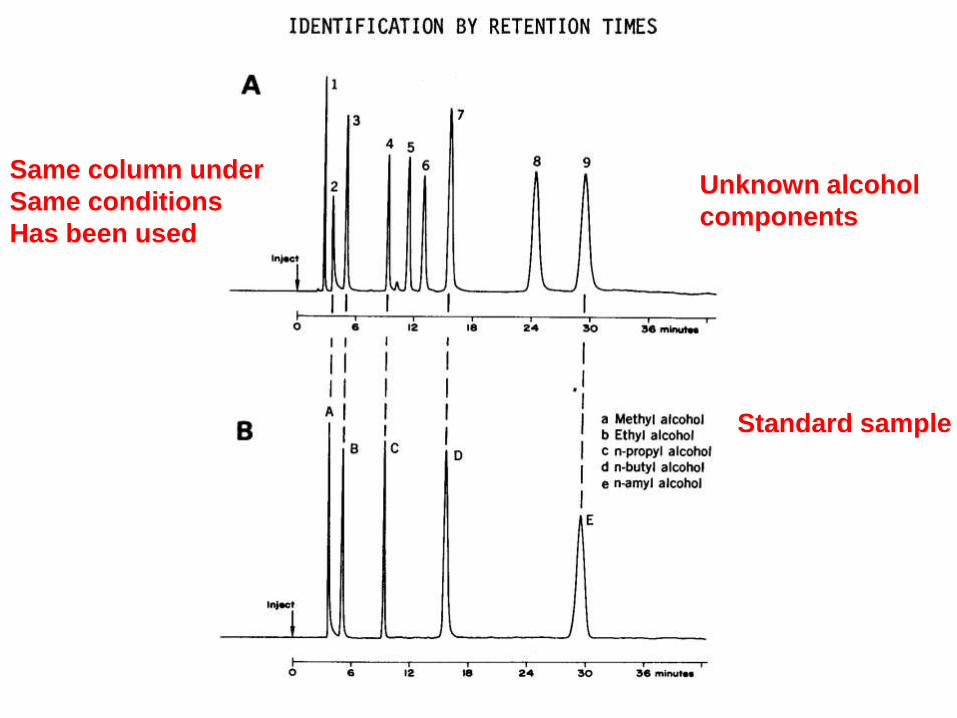
Unknown alcohol
components
Standard sample
Same column under
Same conditions
Has been used
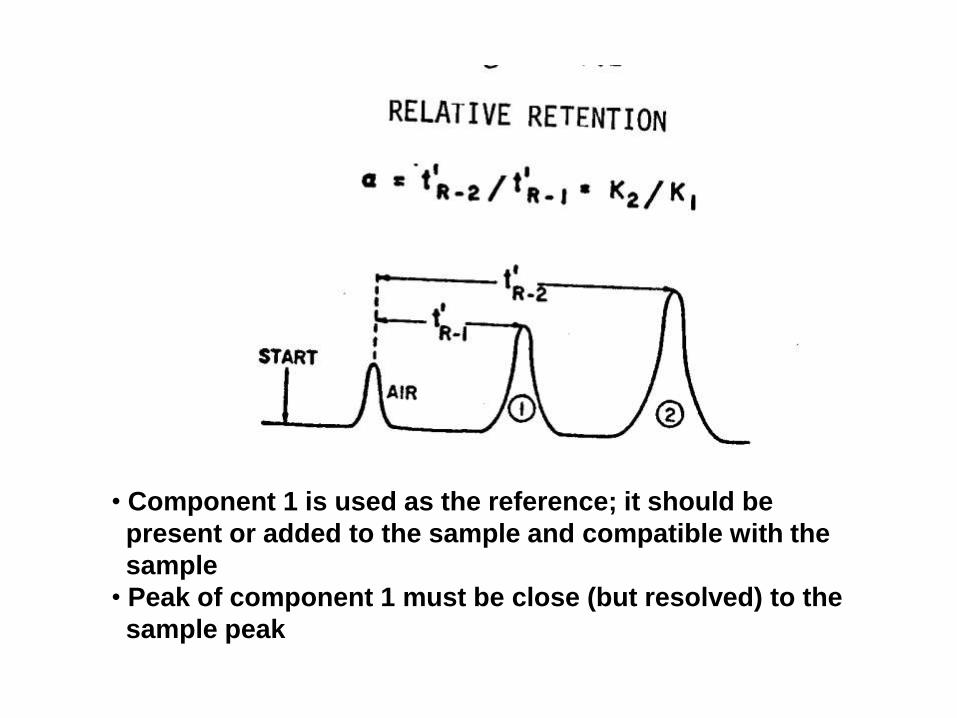
• Component 1 is used as the reference; it should be
present or added to the sample and compatible with the
sample
• Peak of component 1 must be close (but resolved) to the
sample peak

When component 3 is suspected, add more of this component to the
sample and watch any change in its peak
Basis for Quantitative Analysis • The peaks in the chromatogram are the basis for
quantitative analysis Peaks of interest should fulfill the following requirements:
• must be undistorted • must be well separated • Must have a large S/N ratio • must have a flat baseline Peak shape: The ideal chromatographic peak is
symmetric and narrow
• Peak integration
The peak height or, better, the area must be determined and this is done by the computer
• Calculation – External standard method
– Internal standard method
– Internal normalization
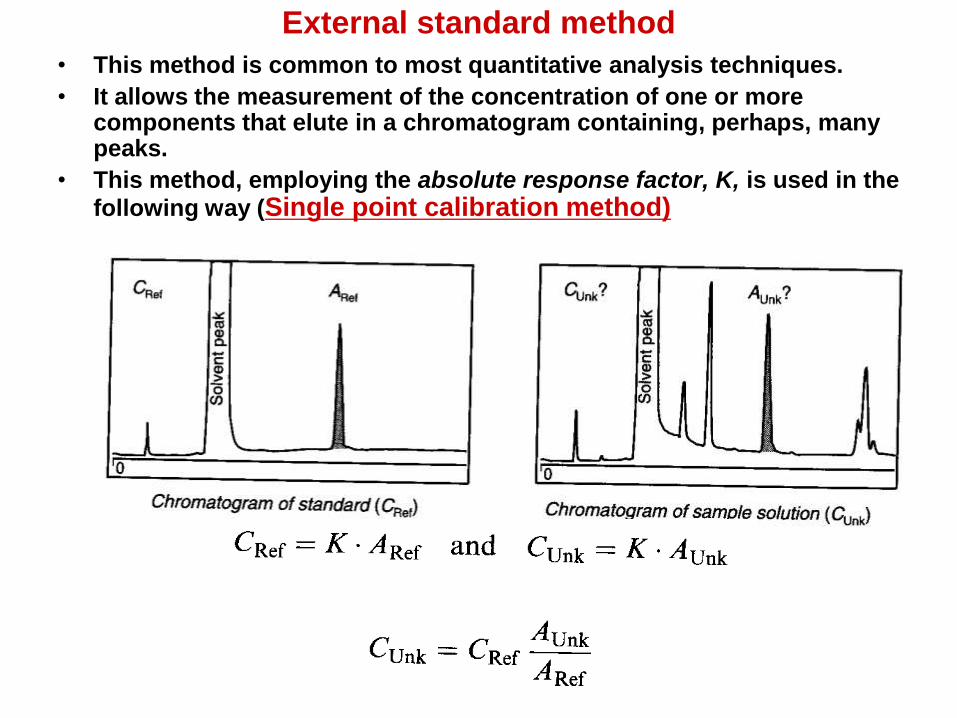
External standard method
• This method is common to most quantitative analysis techniques.
• It allows the measurement of the concentration of one or more components that elute in a chromatogram containing, perhaps, many peaks.
• This method, employing the absolute response factor, K, is used in the
following way (Single point calibration method)

Multilevel calibration
• In a multilevel calibration several different amounts
of the standard are prepared and analyzed.
• A regression method is used (e.g. linear
least-square) and this leads to a more precise value
for Cunk.
• This quantitative method is the only one adapted to
gaseous samples.
• This simple method is used in industry for repetitive
analyses.
• For such analyses, chromatograph must be
equipped with an autosampler,
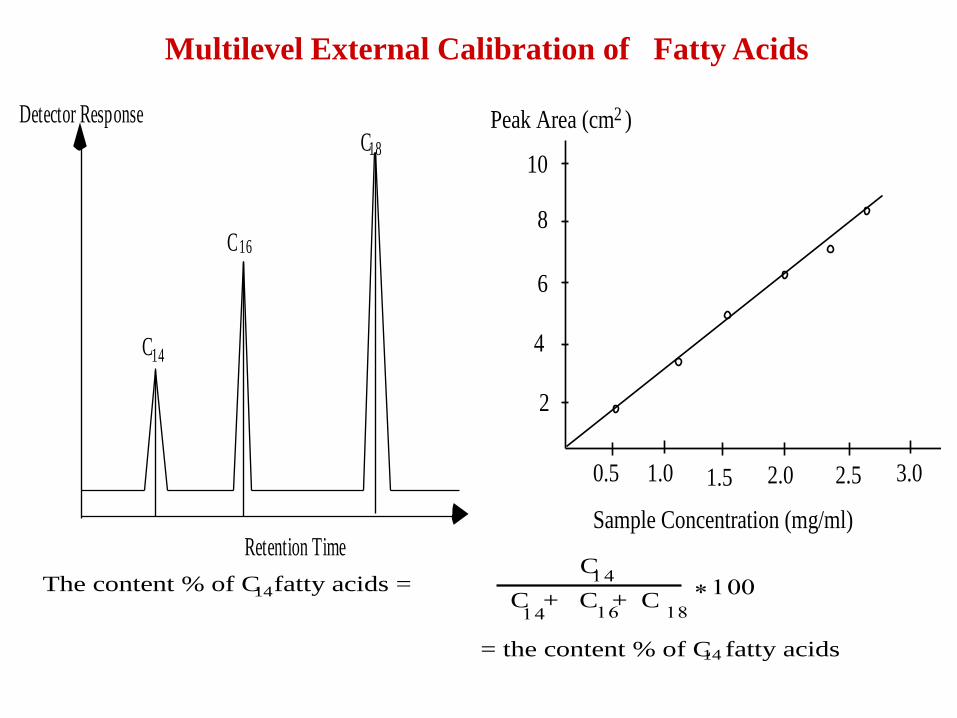
Multilevel External Calibration of Fatty Acids
C
C
CDetector Response
Retention Time
14
16
18
Peak Area (cm )
Sample Concentration (mg/ml)
2
4
6
8
10
0.5 1.0 1.5 2.0 2.5 3.0
2
The content % of C fatty acids =C
C + C + C
= the content % of C fatty acids14
14