Chapter 11 Comparing Two Population Parameters
25
Chapter 11 Comparing Two Population Parameters Section 11.1A/11.1 Comparing Two Population Proportions Objectives ➊Distinguish between independent and dependent sampling Use randomization to compare two population proportions ➋Test hypotheses regarding two proportions from independent samples ➌Construct and interpret confidence intervals for the difference between two population proportions ➍Determine the sample size necessary for estimating the difference between two population proportions ❶ Distinguish between Independent and Dependent Sampling Example Distinguish between Independent and Dependent Sampling For each of the following, determine whether the sampling method is independent or dependent. A researcher wants to know whether the price of a one night stay at a Holiday Inn Express is less than the price of a one night stay at a Red Roof Inn. She randomly selects 8 towns where the location of the hotels is close to each other and determines the price of a one night stay. Do a higher proportion of men or women vote in presidential elections? Use Randomization to Compare Two Population Proportions In Chapter 10, we focused on determining whether a sample may come from a population with a specified characteristic (such as a specified proportion of the population with a given characteristic, or a specified population mean). Now, we shift gears to comparing the characteristics of two groups. Comparison of two groups may occur through either observational studies (such as comparing the proportion of Republicans to the proportion of Democrats in favor of some policy) or through designed experiments. Recall in a completely randomized design, a group of individuals is randomly assigned to two or more treatment groups, the treatment is
Transcript of Chapter 11 Comparing Two Population Parameters

Chapter11ComparingTwoPopulationParametersSection11.1A/11.1ComparingTwoPopulationProportionsObjectives➊ Distinguish between independent and dependent sampling Use randomization to compare two population proportions ➋ Test hypotheses regarding two proportions from independent samples ➌ Construct and interpret confidence intervals for the difference between two population proportions ➍ Determine the sample size necessary for estimating the difference between two population proportions ❶ Distinguish between Independent and Dependent Sampling
Example DistinguishbetweenIndependentandDependentSampling
Foreachofthefollowing,determinewhetherthesamplingmethodisindependentordependent.
AresearcherwantstoknowwhetherthepriceofaonenightstayataHolidayInnExpressislessthanthepriceofaonenightstayataRedRoofInn.Sherandomlyselects8townswherethelocationofthehotelsisclosetoeachotheranddeterminesthepriceofaonenightstay.
Doahigherproportionofmenorwomenvoteinpresidentialelections?
Use Randomization to Compare Two Population Proportions InChapter10,wefocusedondeterminingwhetherasamplemaycomefromapopulationwithaspecifiedcharacteristic(suchasaspecifiedproportionofthepopulationwithagivencharacteristic,oraspecifiedpopulationmean).
Now,weshiftgearstocomparingthecharacteristicsoftwogroups.Comparisonoftwogroupsmayoccurthrougheitherobservationalstudies(suchascomparingtheproportionofRepublicanstotheproportionofDemocratsinfavorofsomepolicy)orthroughdesignedexperiments.Recallinacompletelyrandomizeddesign,agroupofindividualsisrandomlyassignedtotwoormoretreatmentgroups,thetreatmentis
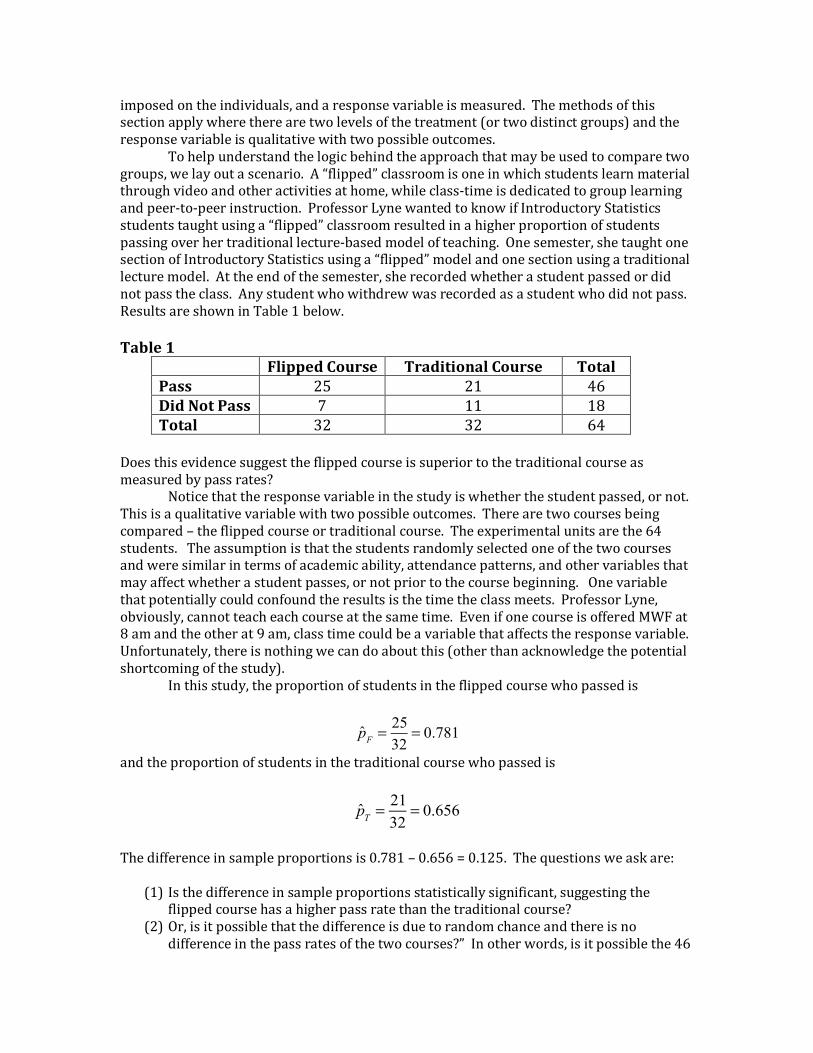
imposedontheindividuals,andaresponsevariableismeasured.Themethodsofthissectionapplywheretherearetwolevelsofthetreatment(ortwodistinctgroups)andtheresponsevariableisqualitativewithtwopossibleoutcomes. Tohelpunderstandthelogicbehindtheapproachthatmaybeusedtocomparetwogroups,welayoutascenario.A“flipped”classroomisoneinwhichstudentslearnmaterialthroughvideoandotheractivitiesathome,whileclass-timeisdedicatedtogrouplearningandpeer-to-peerinstruction.ProfessorLynewantedtoknowifIntroductoryStatisticsstudentstaughtusinga“flipped”classroomresultedinahigherproportionofstudentspassingoverhertraditionallecture-basedmodelofteaching.Onesemester,shetaughtonesectionofIntroductoryStatisticsusinga“flipped”modelandonesectionusingatraditionallecturemodel.Attheendofthesemester,sherecordedwhetherastudentpassedordidnotpasstheclass.Anystudentwhowithdrewwasrecordedasastudentwhodidnotpass.ResultsareshowninTable1below.Table1
FlippedCourse TraditionalCourse TotalPass 25 21 46DidNotPass 7 11 18Total 32 32 64
Doesthisevidencesuggesttheflippedcourseissuperiortothetraditionalcourseasmeasuredbypassrates? Noticethattheresponsevariableinthestudyiswhetherthestudentpassed,ornot.Thisisaqualitativevariablewithtwopossibleoutcomes.Therearetwocoursesbeingcompared–theflippedcourseortraditionalcourse.Theexperimentalunitsarethe64students.Theassumptionisthatthestudentsrandomlyselectedoneofthetwocoursesandweresimilarintermsofacademicability,attendancepatterns,andothervariablesthatmayaffectwhetherastudentpasses,ornotpriortothecoursebeginning.Onevariablethatpotentiallycouldconfoundtheresultsisthetimetheclassmeets.ProfessorLyne,obviously,cannotteacheachcourseatthesametime.EvenifonecourseisofferedMWFat8amandtheotherat9am,classtimecouldbeavariablethataffectstheresponsevariable.Unfortunately,thereisnothingwecandoaboutthis(otherthanacknowledgethepotentialshortcomingofthestudy). Inthisstudy,theproportionofstudentsintheflippedcoursewhopassedis
andtheproportionofstudentsinthetraditionalcoursewhopassedis
Thedifferenceinsampleproportionsis0.781–0.656=0.125.Thequestionsweaskare:
(1) Isthedifferenceinsampleproportionsstatisticallysignificant,suggestingtheflippedcoursehasahigherpassratethanthetraditionalcourse?
(2) Or,isitpossiblethatthedifferenceisduetorandomchanceandthereisnodifferenceinthepassratesofthetwocourses?”Inotherwords,isitpossiblethe46
p̂F =2532
= 0.781
p̂T =2132
= 0.656

studentswhopassedwouldhavepassedregardlessofwhichcoursetheywereenrolledin,andahigherproportionofthesestudentsjusthappenedtoenrollintheflippedcourse?
Therearetwopossibilitieshere:
(1) Theflippedcourseisnotmoreeffectiveandthehigherpassrateintheflippedcoursewasduetorandomchance.Thatis,theproportionofstudentswhopasstheflippedcourseequalstheproportionwhopassthetraditionalcourse.
(2) Theflippedcourseismoreeffectiveandthisexplainsthedifferenceinpassrates.Thatis,theproportionofstudentswhopasstheflippedcourseisgreaterthantheproportionofstudentswhopassthetraditionalcourse.
Wecanstatethesetwopossibilitiesusingthenotationofhypothesistests.
Wecouldalsowriteeachofthesestatementsasadifferenceinproportions:
Toanswerthequestionsposed,assumethatStatement(1),thenullhypothesis,istruebecausethisisthestatementof“noeffect”or“nodifference”.Usethisstatementtobuildthenullmodel.Todevelopaconceptualunderstandingforbuildingthenullmodel,weuseanurn.Let46greenballsrepresentthe46studentswhopassedthecourseandlet18redballsrepresentthe18studentswhodidnotpass.Mixthe64ballsintheurnandrandomlychoose32balls.These32ballswillrepresentthe32studentswhoenrolledintheflippedcourse.Noticethatthisrandomassignmentisdoneundertheassumptionthestatementinthenullhypothesisistruebecauseeachballhasanequallylikelychanceofgoingtotheflippedcourseorthetraditionalcourse.Note:Wearenotsayingthatpassingversusnotpassingisequallylikely,justthatthelikelihoodofa“passing”studentgoingtotheflippedcourseisthesameasthatstudentgoingtothetraditionalcourse.
Ratherthanphysicallyworkingwithanurn,wecanuseStatCrunch.Figure1showsthedialogueboxtobuildtheurnappletinStatCrunch.Noticethatwearedrawing32balls(the32students).Inaddition,wewanttheapplettorecordhowoftenweobserve25ormoregreenballs.Thisisanalogoustodetermininghowmanyofthestudentsintheflippedcoursepass.Thevalueof25servesastheteststatisticforthishypothesistest.Notethatwecouldalsohaveused0.781,thesampleproportionofstudentswhopassedintheflippedcourse,astheteststatistic.
Click“1run”.Howmanyofthestudentspassedtheflippedcourse?Click“1run”asecondtime.Howmanyofthestudentspassedtheflippedcourse?
H0 : pF = pT This is Statement (1)H1 : pF > pT This is Statement (2)
H0 : pF − pT = 0 This is Statement (1)H1 : pF − pT > 0 This is Statement (2)

Figure1
Todeterminealong-runpatternofoutcomes,wecanrepeatthisrandomassignmentmanytimesbyclicking“1000runs”intheapplet.Click“1000runs”fivetimes(foratotalof5002randomassignments).Whatproportionoftherandomassignmentsresultedin25ormoreflippedstudentspassing(assumingthereisnodifferenceinthepassratesofthetwocourses)?Whatdoyouconclude?
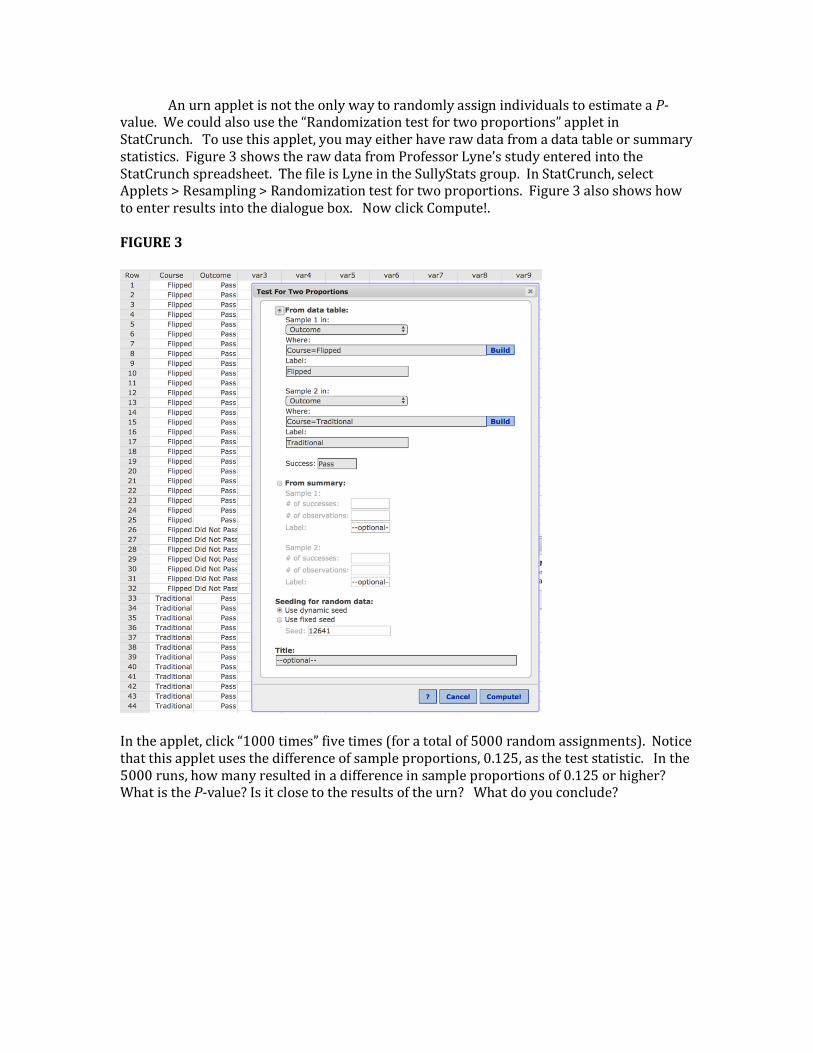
AnurnappletisnottheonlywaytorandomlyassignindividualstoestimateaP-value.Wecouldalsousethe“Randomizationtestfortwoproportions”appletinStatCrunch.Tousethisapplet,youmayeitherhaverawdatafromadatatableorsummarystatistics.Figure3showstherawdatafromProfessorLyne’sstudyenteredintotheStatCrunchspreadsheet.ThefileisLyneintheSullyStatsgroup.InStatCrunch,selectApplets>Resampling>Randomizationtestfortwoproportions.Figure3alsoshowshowtoenterresultsintothedialoguebox.NowclickCompute!.FIGURE3
Intheapplet,click“1000times”fivetimes(foratotalof5000randomassignments).Noticethatthisappletusesthedifferenceofsampleproportions,0.125,astheteststatistic.Inthe5000runs,howmanyresultedinadifferenceinsampleproportionsof0.125orhigher?WhatistheP-value?Isitclosetotheresultsoftheurn?Whatdoyouconclude?
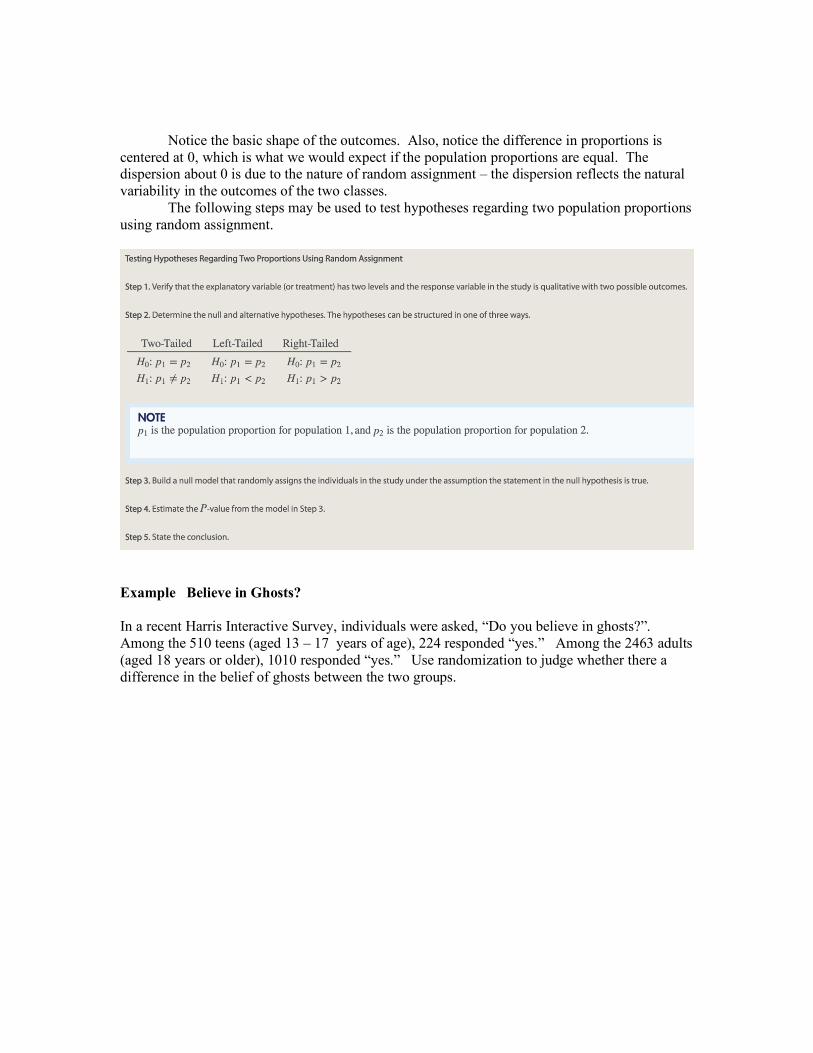
Notice the basic shape of the outcomes. Also, notice the difference in proportions is centered at 0, which is what we would expect if the population proportions are equal. The dispersion about 0 is due to the nature of random assignment – the dispersion reflects the natural variability in the outcomes of the two classes. The following steps may be used to test hypotheses regarding two population proportions using random assignment.
Example Believe in Ghosts? In a recent Harris Interactive Survey, individuals were asked, “Do you believe in ghosts?”. Among the 510 teens (aged 13 – 17 years of age), 224 responded “yes.” Among the 2463 adults (aged 18 years or older), 1010 responded “yes.” Use randomization to judge whether there a difference in the belief of ghosts between the two groups.

❷ Test Hypotheses Regarding Two Population Proportions from Independent Samples (Using the Normal Model) To perform inference comparing two population proportions from independent samples using a model, we first need to know the sampling distribution for the difference between two proportions from independent samples. The shape of the outcomes from random assignment in the Ghosts example suggests the sampling distribution is approximately normal.
From the applet where the Ghost data was analyzed using randomization, click Analyze. This exports the difference in sample proportions for all the random assignments. Find the mean and standard deviation of the difference in sample proportions. Compare these to the theoretical mean and standard deviation.

Example Believe in Ghosts? In a recent Harris Interactive Survey, individuals were asked, “Do you believe in ghosts?”. Among the 510 teens (aged 13 – 17 years of age), 224 responded “yes.” Among the 2463 adults (aged 18 years or older), 1010 responded “yes.” Is there a difference in the belief of ghosts between the two groups?

❸ Construct and Interpret Confidence Intervals for the Difference between Two Population Proportions
Example Position on Divorce In a recent Harris Interactive Survey, respondents were asked, “How acceptable is divorce to you personally?”. Among the 970 individuals who considered themselves religious, 834 considered divorce to be acceptable. Among the 1285 individuals who did not consider themselves religious, 1157 considered divorce to be acceptable. Construct and interpret a 95% confidence interval for the difference in the two proportions.

❹ Determine the Sample Size Necessary for Estimating the Difference between Two Population Proportions
ExampleDeterminingSampleSize
Adoctorwantstoestimatethedifferenceintheproportionof15-19yearoldmothersthatreceivedprenatalcareandtheproportionof30-34yearoldmothersthatreceivedprenatalcare.Whatsamplesizeshouldbeobtainedifshewishedtheestimatetobewithin2percentagepointswith95%confidenceassuming:
A. sheusestheresultsoftheNationalVitalStatisticsReportresultsinwhich98%ofthe15-19yearoldmothersreceivedprenatalcareand99.2%of30-34yearoldmothersreceivedprenatalcare.
B. shedoesnotuseanypriorestimates. 11.2 Inference about Two Means: Dependent Samples Objectives
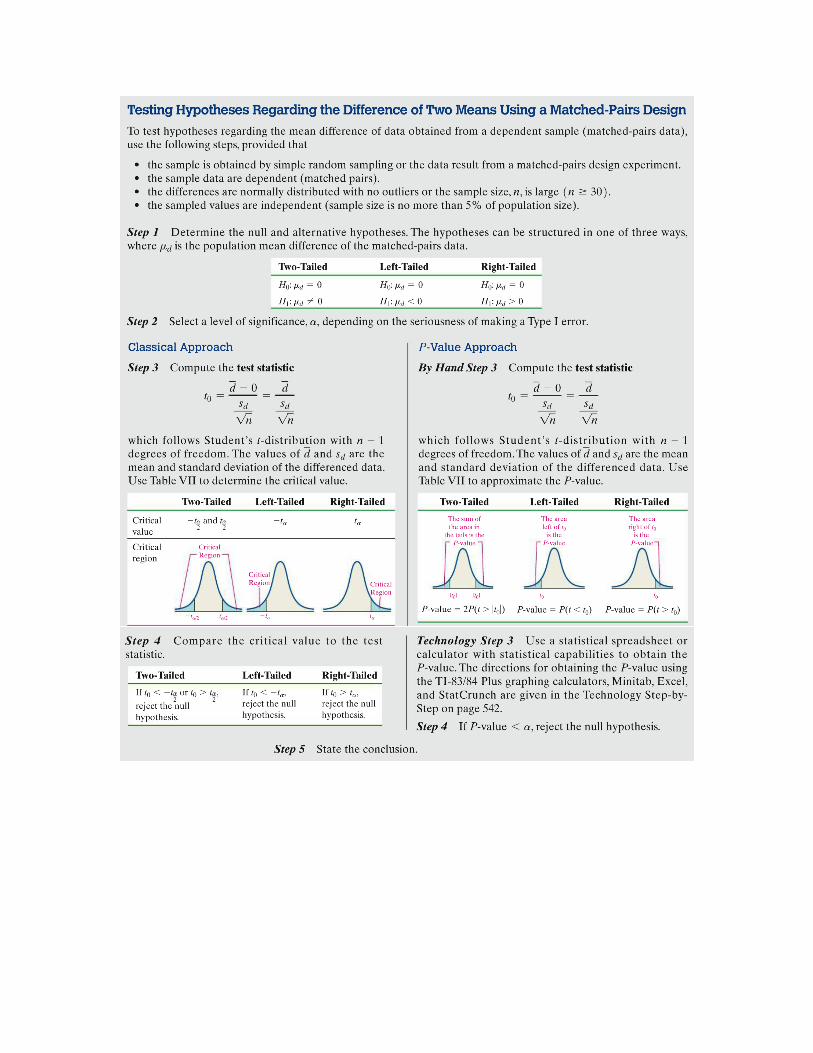
1. Test hypotheses for a population mean from matched-pairs data 2. Construct and interpret confidence intervals about the population mean difference
of matched-pairs data The statistical inference methods on matched-pairs data use the same methods as inference on a single population mean, except that the differences are analyzed.

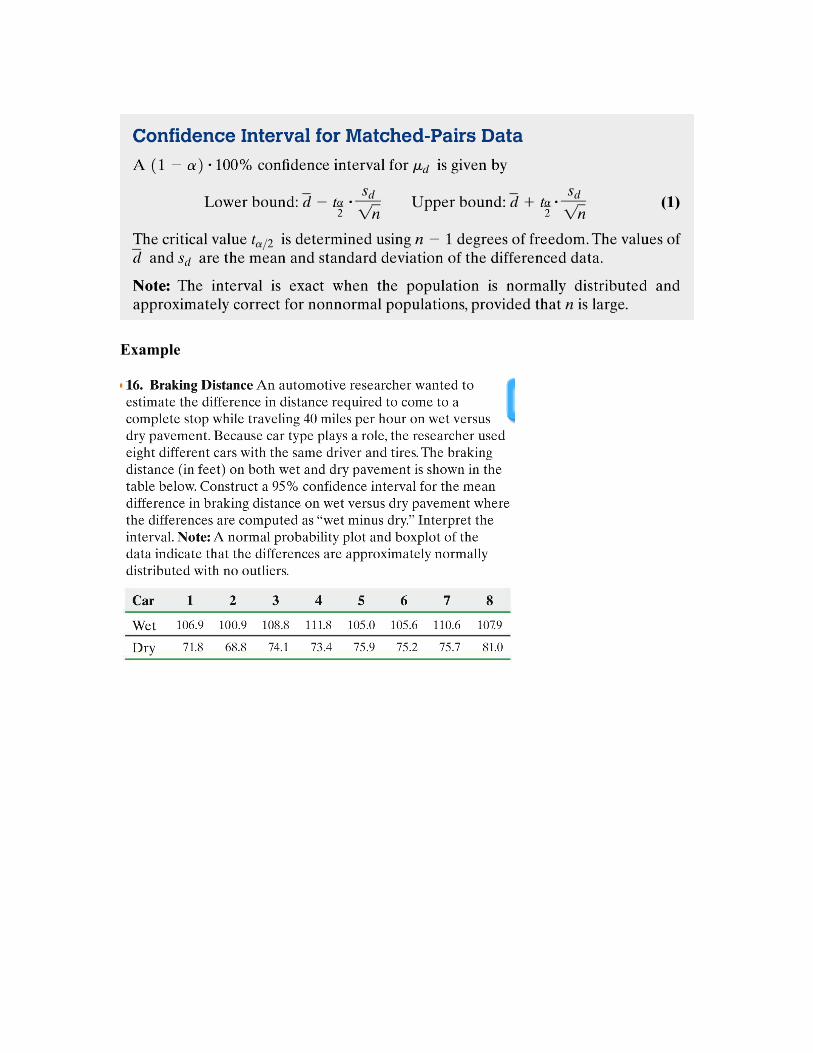
Example Testing a Claim Regarding Matched-Pairs Data The following data represent the cost of a one night stay in Hampton Inn Hotels and La Quinta Inn Hotels for a random sample of 10 cities. Does the sample evidence suggest that Hampton Inn is more expensive than La Quinta? Use the α = 0.05 level of significance.
City Hampton Inn La Quinta Dallas 129 105 Tampa Bay 149 96 St. Louis 149 159 Seattle 189 149 San Diego 109 119 Chicago 160 125 New Orleans 149 92 Phoenix 129 89 Atlanta 129 119 Orlando 119 113
Example
11.3A/11.3InferenceaboutTwoMeans:IndependentSamplesSection11.1dealtwithusingrandomassignmenttocomparetwoindependentproportions.Wecanalsouserandomassignmenttocomparetwoindependentmeans.Thedatainthisscenarioiscollectedfromacompletelyrandomizeddesignwithtwolevelsoftreatmentandaquantitativeresponsevariable.Or,thedataiscollectedusinganobservationstudyinwhichtherearetwodistinctgroupsandthevariableofinterestisquantitative. Itiscommonforteacherstoprintexamsondifferentcoloredpaperasadeterrenttocheating.Isthispracticefair?Thatis,doesthecolorofthepaperaffectexamperformance?Totestthisaninstructorprintedthesamemultiplechoiceexamonwhitepaperandmarinebluepaper(distractorchoiceswerescrambled,butotherthanthattheexamswereidentical).Theinstructorrandomlyhandedtheexamtostudentsastheyenteredtheclassroomanddidnotallowthesamecolorpapertositnexttoeachother.Table1showstheexamresultsforanintroductorypsychologycourse.Note:ThisscenarioisbasedonastudyconductedbyresearchersattheUniversityofNewMexico.“EffectofPaperColorandQuestionOrderonExamPerformance”byIlanitR.Tal,KatherineG.Akers,andGordonK.Hodge.TeachingofPsychology35:25-28,2008.Table1WhitePaper BluePaper77 78 74 91 65 90 71 6685 87 83 61 68 60 88 5884 86 74 70 67 70 76 7372 81 77 78 69 61 76 89
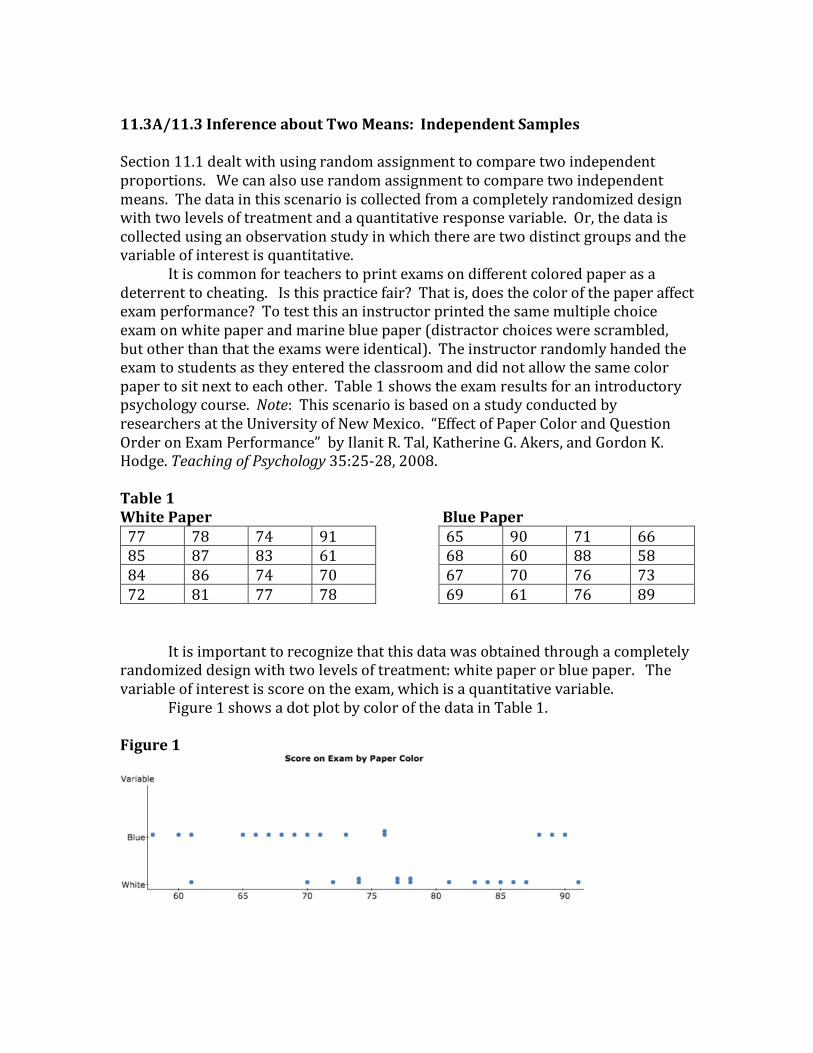
Itisimportanttorecognizethatthisdatawasobtainedthroughacompletelyrandomizeddesignwithtwolevelsoftreatment:whitepaperorbluepaper.Thevariableofinterestisscoreontheexam,whichisaquantitativevariable.
Figure1showsadotplotbycolorofthedatainTable1.Figure1
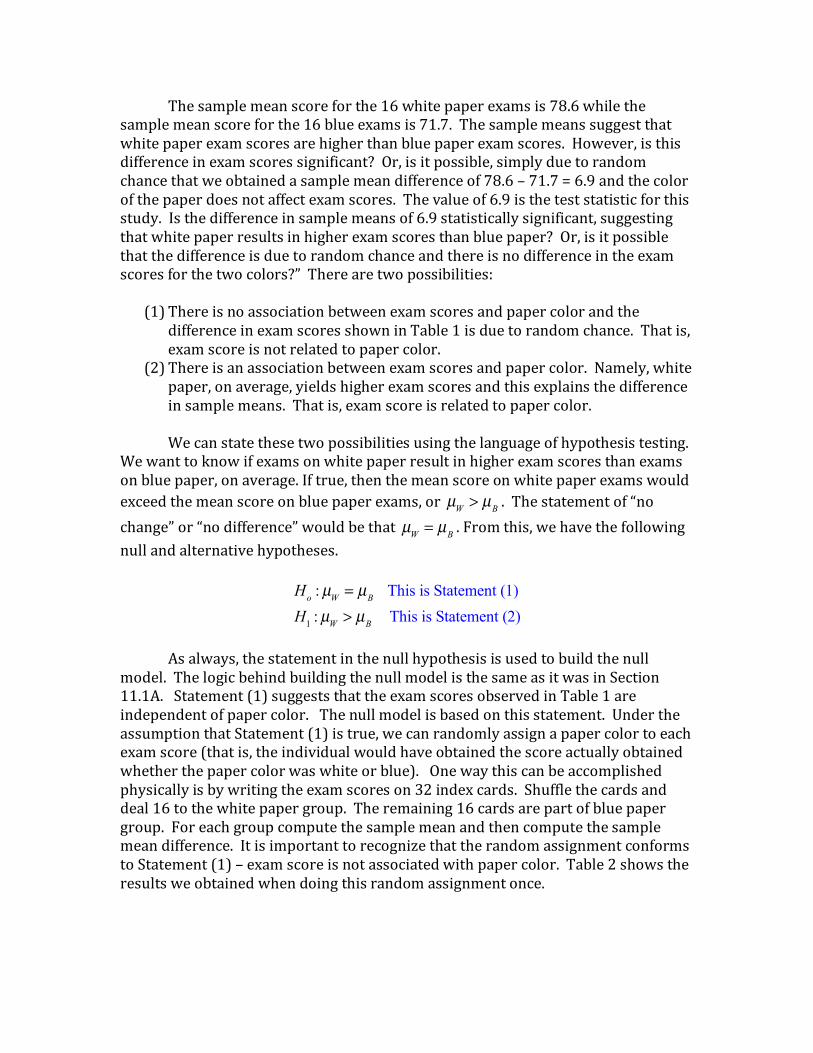
Thesamplemeanscoreforthe16whitepaperexamsis78.6whilethesamplemeanscoreforthe16blueexamsis71.7.Thesamplemeanssuggestthatwhitepaperexamscoresarehigherthanbluepaperexamscores.However,isthisdifferenceinexamscoressignificant?Or,isitpossible,simplyduetorandomchancethatweobtainedasamplemeandifferenceof78.6–71.7=6.9andthecolorofthepaperdoesnotaffectexamscores.Thevalueof6.9istheteststatisticforthisstudy.Isthedifferenceinsamplemeansof6.9statisticallysignificant,suggestingthatwhitepaperresultsinhigherexamscoresthanbluepaper?Or,isitpossiblethatthedifferenceisduetorandomchanceandthereisnodifferenceintheexamscoresforthetwocolors?”Therearetwopossibilities:
(1) ThereisnoassociationbetweenexamscoresandpapercolorandthedifferenceinexamscoresshowninTable1isduetorandomchance.Thatis,examscoreisnotrelatedtopapercolor.
(2) Thereisanassociationbetweenexamscoresandpapercolor.Namely,whitepaper,onaverage,yieldshigherexamscoresandthisexplainsthedifferenceinsamplemeans.Thatis,examscoreisrelatedtopapercolor.
Wecanstatethesetwopossibilitiesusingthelanguageofhypothesistesting.
Wewanttoknowifexamsonwhitepaperresultinhigherexamscoresthanexamsonbluepaper,onaverage.Iftrue,thenthemeanscoreonwhitepaperexamswouldexceedthemeanscoreonbluepaperexams,or .Thestatementof“nochange”or“nodifference”wouldbethat .Fromthis,wehavethefollowingnullandalternativehypotheses.
Asalways,thestatementinthenullhypothesisisusedtobuildthenull
model.ThelogicbehindbuildingthenullmodelisthesameasitwasinSection11.1A.Statement(1)suggeststhattheexamscoresobservedinTable1areindependentofpapercolor.Thenullmodelisbasedonthisstatement.UndertheassumptionthatStatement(1)istrue,wecanrandomlyassignapapercolortoeachexamscore(thatis,theindividualwouldhaveobtainedthescoreactuallyobtainedwhetherthepapercolorwaswhiteorblue).Onewaythiscanbeaccomplishedphysicallyisbywritingtheexamscoreson32indexcards.Shufflethecardsanddeal16tothewhitepapergroup.Theremaining16cardsarepartofbluepapergroup.Foreachgroupcomputethesamplemeanandthencomputethesamplemeandifference.ItisimportanttorecognizethattherandomassignmentconformstoStatement(1)–examscoreisnotassociatedwithpapercolor.Table2showstheresultsweobtainedwhendoingthisrandomassignmentonce.
µW > µB
µW = µB
Ho :µW = µB This is Statement (1)H1 :µW > µB This is Statement (2)

Table2WhitePaper BluePaper58 65 66 67 60 61 61 6968 70 72 73 70 71 76 7674 74 77 81 77 78 78 8583 84 88 90 86 87 89 91 Figure2showsadotplotoftherandomlyassigneddatainTable2.Thesamplemeanscoreforwhitepaperis74.4andthesamplemeanforbluepaperis75.9.Thesamplemeandifference(whiteminusblue)is74.4–75.9=-1.5.Thissamplemeandifferencewouldbecomepartofthenullmodel.Figure2
Ratherthanphysicallydoingtherandomassignment,wecoulduse
StatCrunch.Todothis,firstenterthepapercolorandexamscoreintoaStatCrunchspreadsheet.Now,selectData,thenhighlightSample.Selectthecolumn“Paper”,makethesamplesize32(forthe32students).Let“Numberofsamples:”equal1.ClickCompute!.StatCrunchessentiallyrandomlyassignsagendertoastudytime.SeeFigure3.
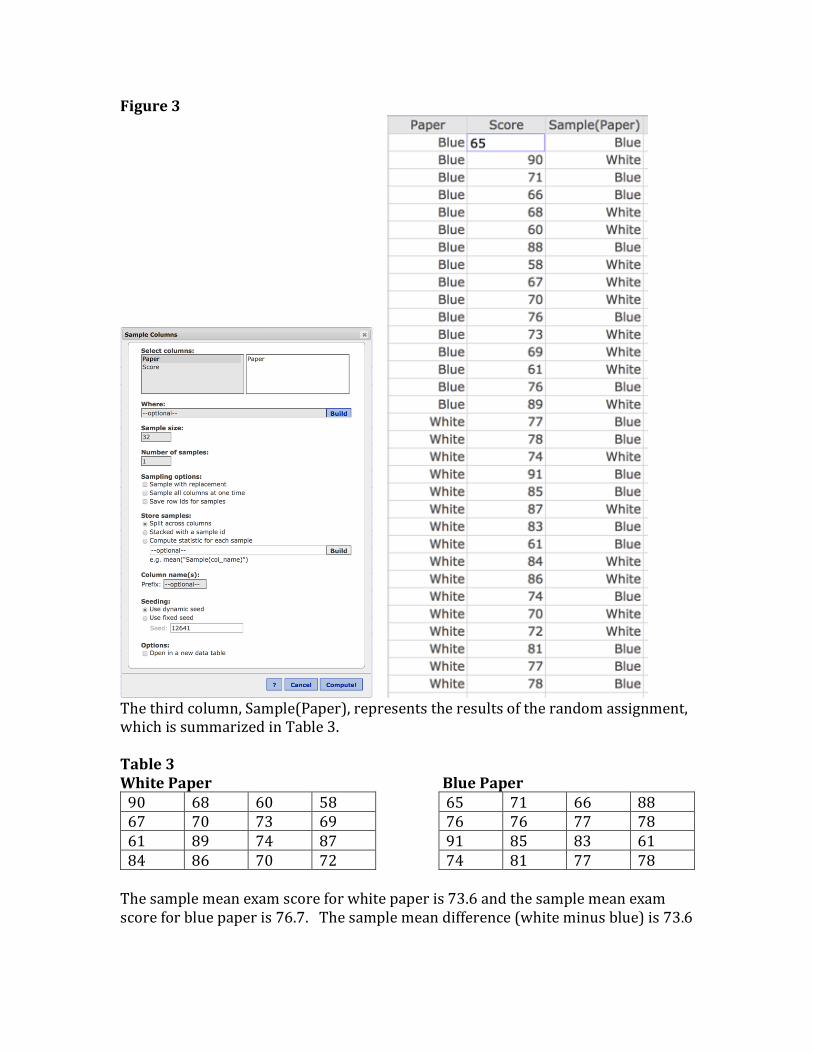
Figure3
Thethirdcolumn,Sample(Paper),representstheresultsoftherandomassignment,whichissummarizedinTable3.Table3WhitePaper BluePaper90 68 60 58 65 71 66 8867 70 73 69 76 76 77 7861 89 74 87 91 85 83 6184 86 70 72 74 81 77 78Thesamplemeanexamscoreforwhitepaperis73.6andthesamplemeanexamscoreforbluepaperis76.7.Thesamplemeandifference(whiteminusblue)is73.6
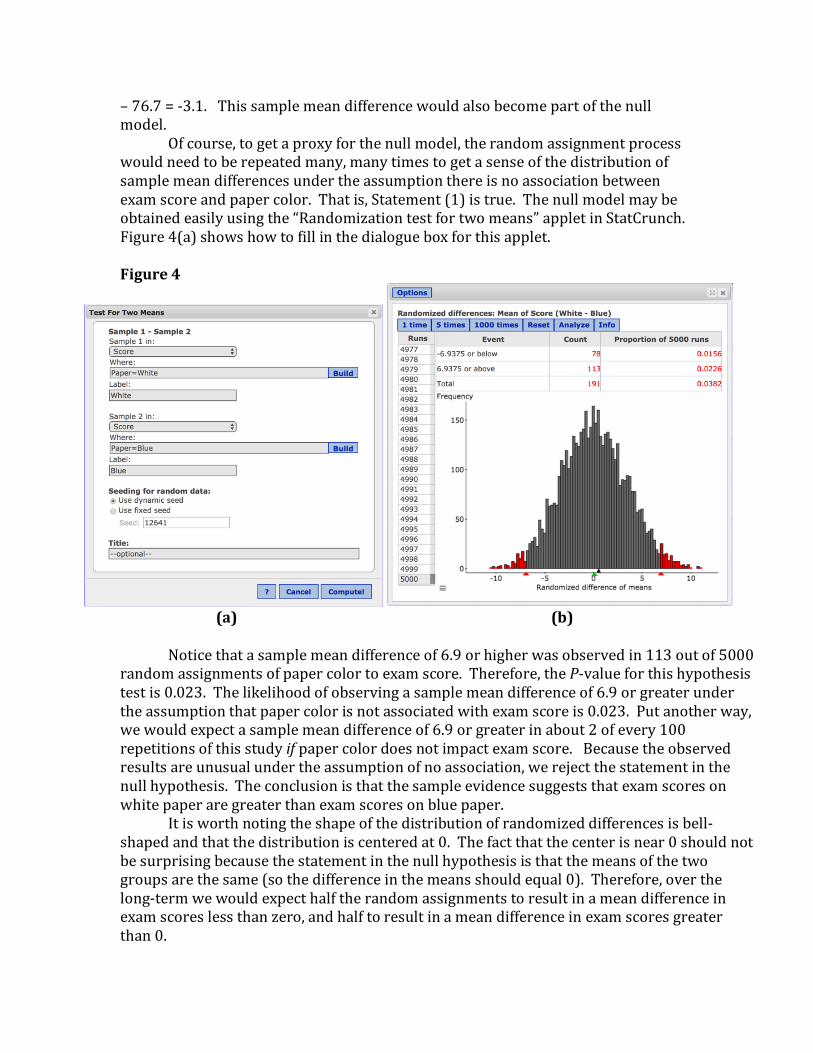
–76.7=-3.1.Thissamplemeandifferencewouldalsobecomepartofthenullmodel. Ofcourse,togetaproxyforthenullmodel,therandomassignmentprocesswouldneedtoberepeatedmany,manytimestogetasenseofthedistributionofsamplemeandifferencesundertheassumptionthereisnoassociationbetweenexamscoreandpapercolor.Thatis,Statement(1)istrue.Thenullmodelmaybeobtainedeasilyusingthe“Randomizationtestfortwomeans”appletinStatCrunch.Figure4(a)showshowtofillinthedialogueboxforthisapplet.Figure4
(a) (b)
Noticethatasamplemeandifferenceof6.9orhigherwasobservedin113outof5000
randomassignmentsofpapercolortoexamscore.Therefore,theP-valueforthishypothesistestis0.023.Thelikelihoodofobservingasamplemeandifferenceof6.9orgreaterundertheassumptionthatpapercolorisnotassociatedwithexamscoreis0.023.Putanotherway,wewouldexpectasamplemeandifferenceof6.9orgreaterinabout2ofevery100repetitionsofthisstudyifpapercolordoesnotimpactexamscore.Becausetheobservedresultsareunusualundertheassumptionofnoassociation,werejectthestatementinthenullhypothesis.Theconclusionisthatthesampleevidencesuggeststhatexamscoresonwhitepaperaregreaterthanexamscoresonbluepaper. Itisworthnotingtheshapeofthedistributionofrandomizeddifferencesisbell-shapedandthatthedistributioniscenteredat0.Thefactthatthecenterisnear0shouldnotbesurprisingbecausethestatementinthenullhypothesisisthatthemeansofthetwogroupsarethesame(sothedifferenceinthemeansshouldequal0).Therefore,overthelong-termwewouldexpecthalftherandomassignmentstoresultinameandifferenceinexamscoreslessthanzero,andhalftoresultinameandifferenceinexamscoresgreaterthan0.
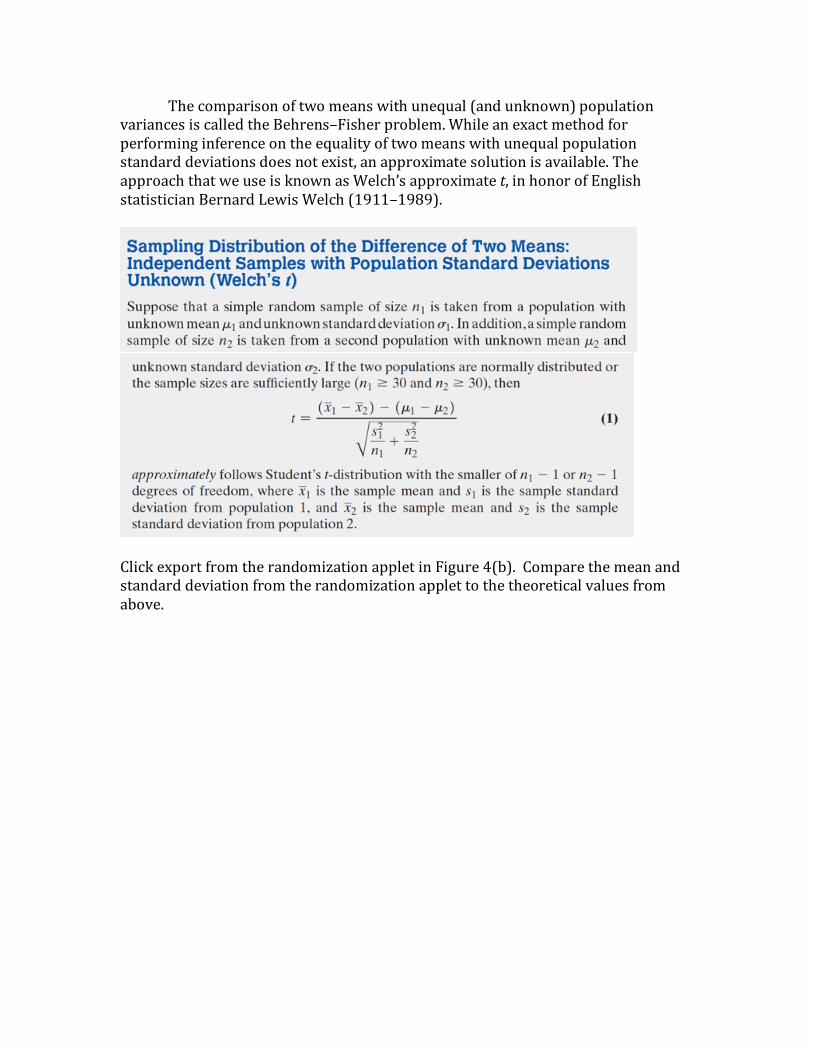
Thecomparisonoftwomeanswithunequal(andunknown)populationvariancesiscalledtheBehrens–Fisherproblem.Whileanexactmethodforperforminginferenceontheequalityoftwomeanswithunequalpopulationstandarddeviationsdoesnotexist,anapproximatesolutionisavailable.TheapproachthatweuseisknownasWelch’sapproximatet,inhonorofEnglishstatisticianBernardLewisWelch(1911–1989).
ClickexportfromtherandomizationappletinFigure4(b).Comparethemeanandstandarddeviationfromtherandomizationapplettothetheoreticalvaluesfromabove.
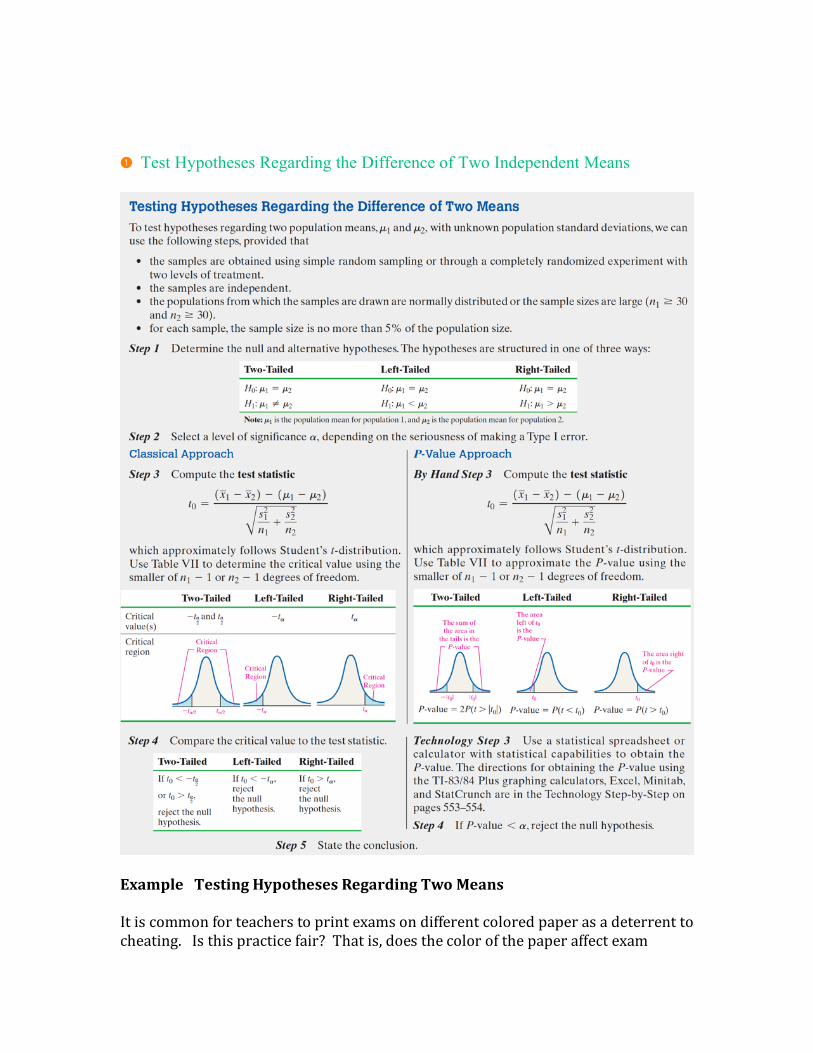
❶ Test Hypotheses Regarding the Difference of Two Independent Means
ExampleTestingHypothesesRegardingTwoMeansItiscommonforteacherstoprintexamsondifferentcoloredpaperasadeterrenttocheating.Isthispracticefair?Thatis,doesthecolorofthepaperaffectexam

performance?Totestthisaninstructorprintedthesamemultiple-choiceexamonwhitepaperandmarinebluepaper(distractorchoiceswerescrambled,butotherthanthattheexamswereidentical).Theinstructorrandomlyhandedtheexamtostudentsastheyenteredtheclassroomanddidnotallowthesamecolorpapertositnexttoeachother.Table1showstheexamresultsforanintroductorypsychologycourse.Doesthesampleevidencesuggestthatstudentsscorehigheronexamswrittenonwhitepaperthanexamswrittenonbluepaper?Note:ThisscenarioisbasedonastudyconductedbyresearchersattheUniversityofNewMexico.“EffectofPaperColorandQuestionOrderonExamPerformance”byIlanitR.Tal,KatherineG.Akers,andGordonK.Hodge.TeachingofPsychology35:25-28,2008.Table1WhitePaper BluePaper77 78 74 91 65 90 71 6685 87 83 61 68 60 88 5884 86 74 70 67 70 76 7372 81 77 78 69 61 76 89
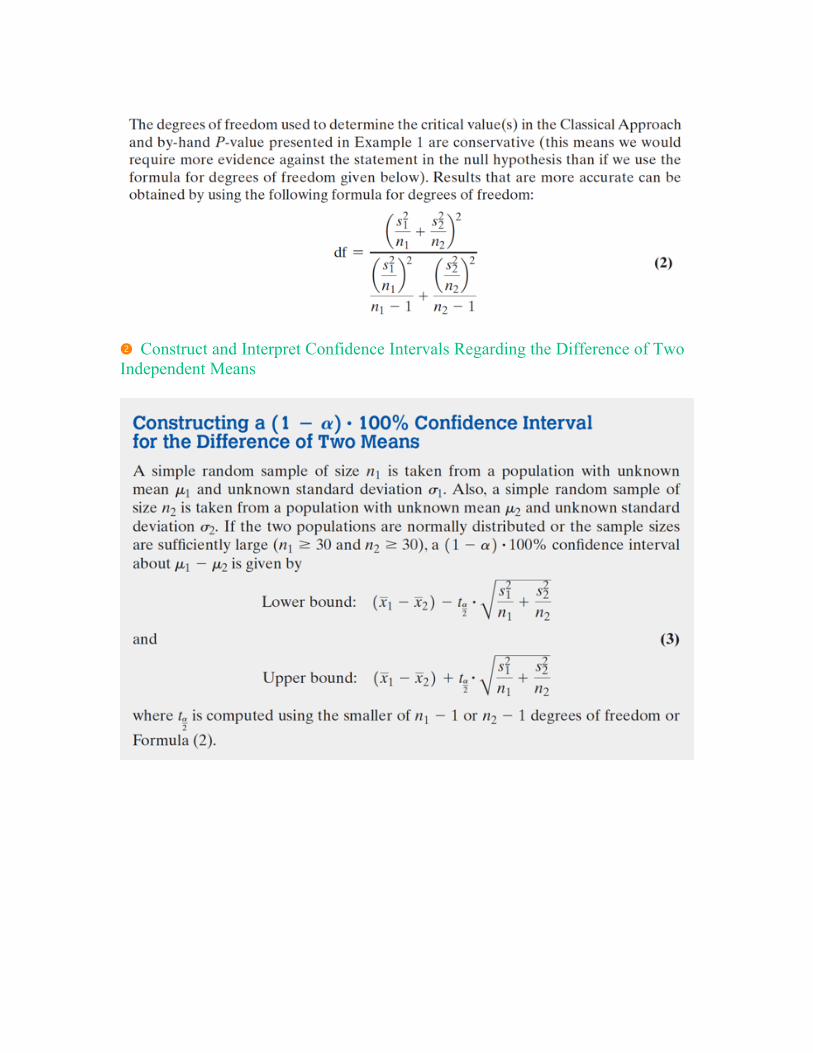
❷ Construct and Interpret Confidence Intervals Regarding the Difference of Two Independent Means

CAUTION!
Wewouldusethepooledtwo-samplet-testwhenthetwosamplescomefrompopulationsthathavethesamevariance.Poolingreferstofindingaweightedaverageofthetwosamplevariancesfromtheindependentsamples.Itisdifficulttoverifythattwopopulationvariancesmightbeequalbasedonsampledata,sowewillalwaysuseWelch’stwhencomparingtwomeans.

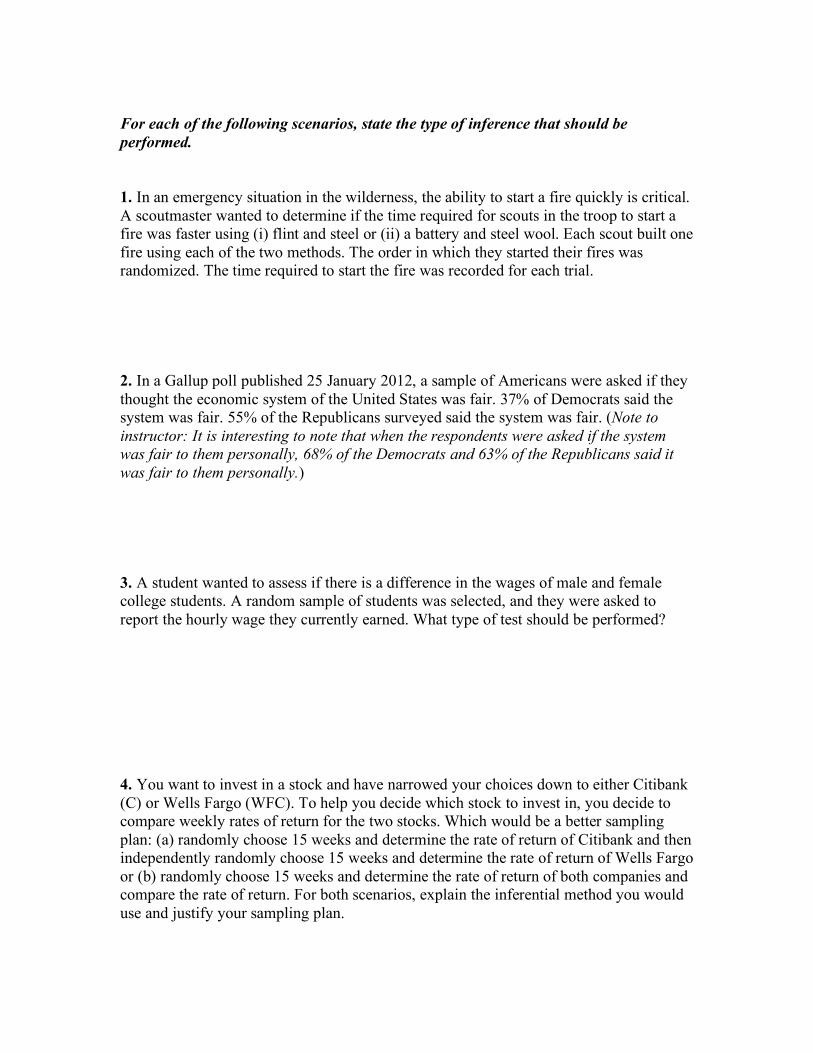
For each of the following scenarios, state the type of inference that should be performed. 1. In an emergency situation in the wilderness, the ability to start a fire quickly is critical. A scoutmaster wanted to determine if the time required for scouts in the troop to start a fire was faster using (i) flint and steel or (ii) a battery and steel wool. Each scout built one fire using each of the two methods. The order in which they started their fires was randomized. The time required to start the fire was recorded for each trial. 2. In a Gallup poll published 25 January 2012, a sample of Americans were asked if they thought the economic system of the United States was fair. 37% of Democrats said the system was fair. 55% of the Republicans surveyed said the system was fair. (Note to instructor: It is interesting to note that when the respondents were asked if the system was fair to them personally, 68% of the Democrats and 63% of the Republicans said it was fair to them personally.) 3. A student wanted to assess if there is a difference in the wages of male and female college students. A random sample of students was selected, and they were asked to report the hourly wage they currently earned. What type of test should be performed? 4. You want to invest in a stock and have narrowed your choices down to either Citibank (C) or Wells Fargo (WFC). To help you decide which stock to invest in, you decide to compare weekly rates of return for the two stocks. Which would be a better sampling plan: (a) randomly choose 15 weeks and determine the rate of return of Citibank and then independently randomly choose 15 weeks and determine the rate of return of Wells Fargo or (b) randomly choose 15 weeks and determine the rate of return of both companies and compare the rate of return. For both scenarios, explain the inferential method you would use and justify your sampling plan.