
Chapter 10 Screening for Disease - Kids in Prison Program · Chapter 10 Screening for Disease. 2...
30
1 Chapter 10 Screening for Disease
Transcript of Chapter 10 Screening for Disease - Kids in Prison Program · Chapter 10 Screening for Disease. 2...

1
Chapter 10
Screening for Disease

2
Terminology• Reliability ≡ agreement of
ratings/diagnoses, “reproducibility”
– Inter-rater reliability ≡agreement between two independent raters
– Intra-rater reliability ≡agreement of the same rater with him/herself
• Validity ≡ ability to discriminate without error
• Accuracy ≡ a combination of reliability and validity

3
Inter-Rater Reliability• Two independent
raters
• Cross-tabulate
• Observed proportion in agreement NOTadequate because a certain amount of agreement is due to chance
Rater B
Rater A + − Total
+ a b g1
− c d g2
Total f1 f2 N

4
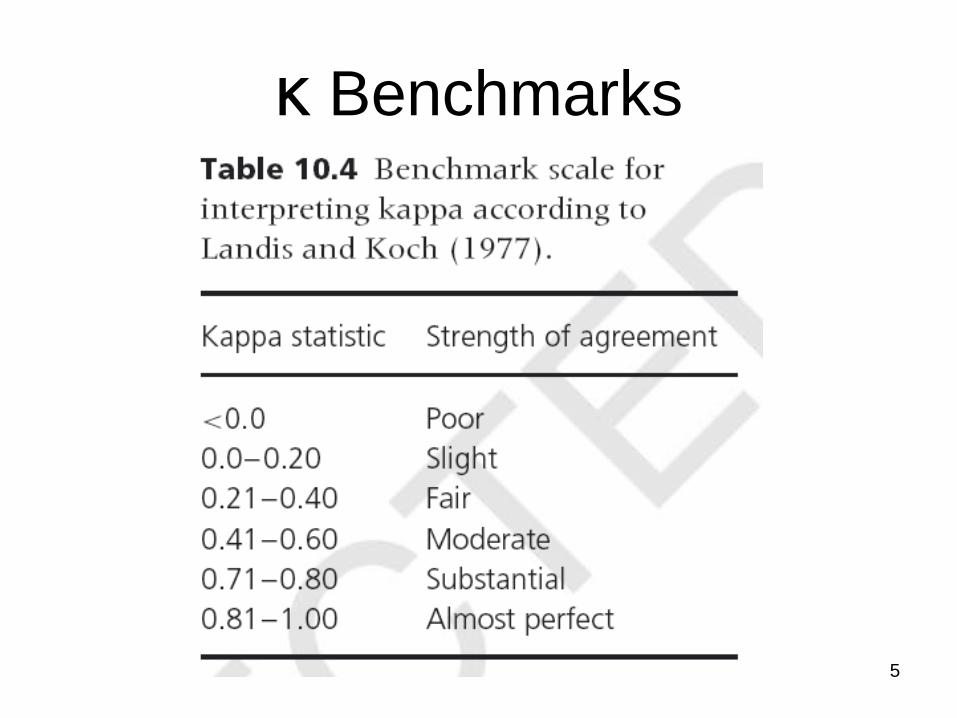
Kappa (κ)
1 1 2 2e 2= [Expected agreement due to chance]
f g f gp
N
Rater B
Rater A + − Total
+ a b g1
− c d g2
Total f1 f2 N
o = [Observed agreement; chance corrected]a d
p notN
o e
e
1
p p
p
[Agreement corrected for chance]
5
κ Benchmarks
6
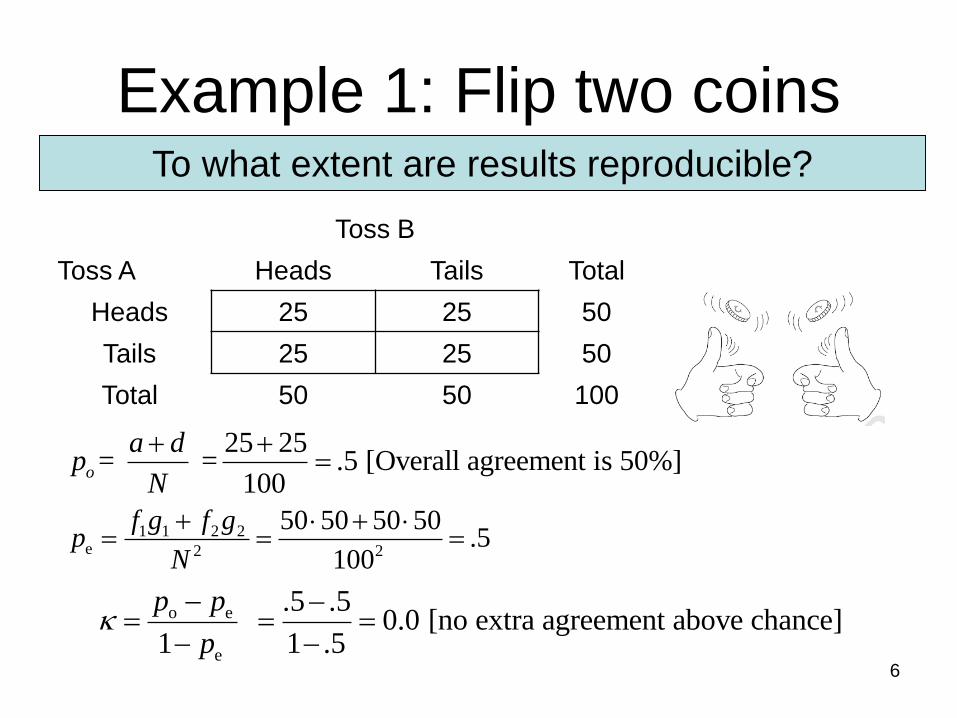
Example 1: Flip two coins
o e
e
.5 .5 0.0 [no extra agreement above chance]
1 1 .5
p p
p
Toss B
Toss A Heads Tails Total
Heads 25 25 50
Tails 25 25 50
Total 50 50 100
To what extent are results reproducible?
1 1 2 2e 2 2
50 50 50 50.5
100
f g f gp
N
25 25= = .5 [Overall agreement is 50%]
100o
a dp
N

7
Example 2
obs exp
exp
.91 .6276 .758
1 1 .6276
p p
p
Rater B
Rater A + − Total
+ 20 4 24
− 5 71 76
Total 25 75 100
To what extent are these diagnoses reproducible?
“substantial” agreement
1 1 2 2exp 2 2
25 24 75 76.6276
100
f g f gp
N
20 71= = .9100
100obs
a dp
N

8
§10.3 Validity• Compare screening test results to a gold
standard (“definitive diagnosis”)
• Each patient is classified as either true positive
(TP), true negative (TN), false positive (FP), or
false negative (FN)
Test D+ D− Total
T+ TP FP TP+FP
T− FN TN FN+TN
Total TP+FN FP+TN N

9
Sensitivity
Test D+ D− Total
T+ TP FP TP+FP
T− FN TN FN+TN
Total TP+FN FP+TN N
SEN ≡ proportion of cases that test positive
FNTP
TP
w/diseasethose
TPSEN

10
Specificity
SPEC ≡ proportion of noncases that test negative
Test D+ D− Total
T+ TP FP TP+FP
T− FN TN FN+TN
Total TP+FN FP+TN N
FPTN
TN
disease w/out those
TNSPEC
11
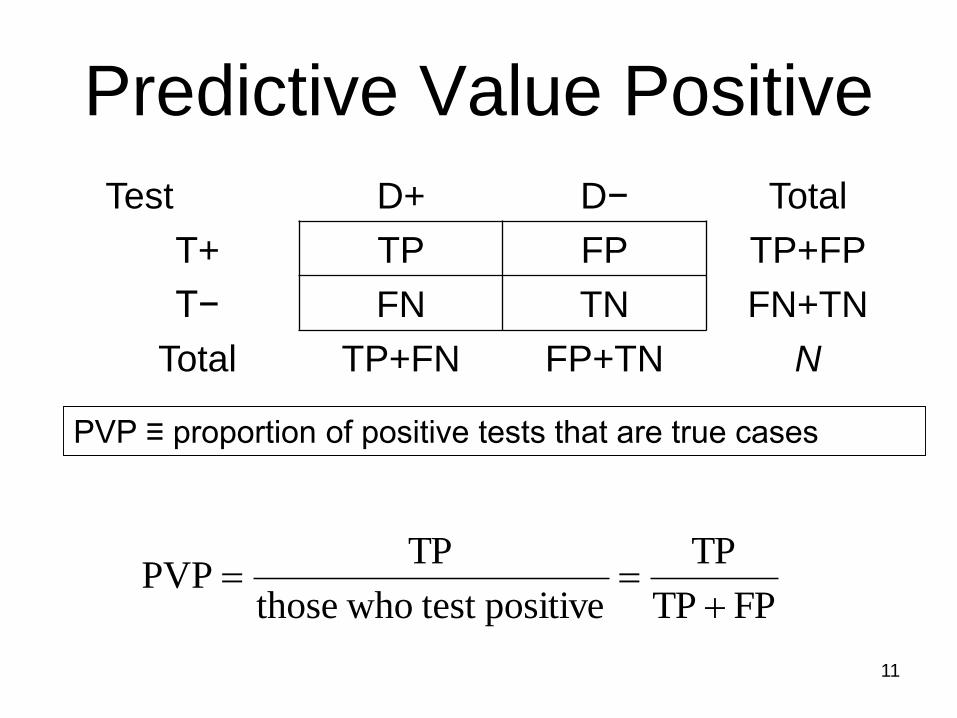
Predictive Value Positive
Test D+ D− Total
T+ TP FP TP+FP
T− FN TN FN+TN
Total TP+FN FP+TN N
PVP ≡ proportion of positive tests that are true cases
FPTP
TP
positive test whothose
TPPVP

12
Predictive Value Negative
Test D+ D− Total
T+ TP FP TP+FP
T− FN TN FN+TN
Total TP+FN FP+TN N
PVN ≡ proportion of negative tests that are
true non-cases
FNTN
TN
negative test whothose
TNPVN

13
Prevalence
• [True] prevalence = (TP + FN) / N
• Apparent prevalence = (TP + FP) / N
Test D+ D− Total
T+ TP FP TP+FP
T− FN TN FN+TN
Total TP+FN FP+TN N

14
Conditional Probability Notation
• Pr(A|B) ≡ “the probability of A given B”
• For example Pr(T+|D+) ≡ “probability
test positive given disease positive” =
SENsitivity
• SPEC ≡ Pr(T−|D−)
• PVP = Pr(D+|T+)
• PVN= Pr(D−|T−)

15
Example
Low Prevalence Population
D+ D− Total
T+
T−
Total 1000 1,000,000
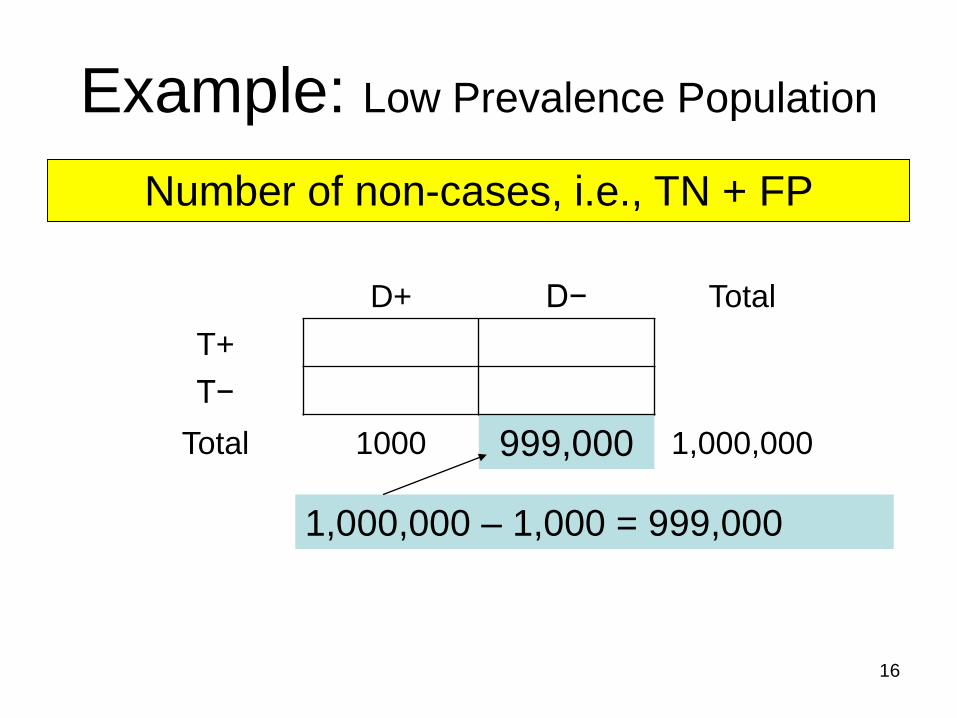
Conditions: N = 1,000,000; Prevalence = .001
Prevalence = (those with disease) / N
Therefore:
(Those with disease) = Prevalence × N
= .001× 1,000,000 = 1000
16
Example: Low Prevalence Population
D+ D− Total
T+
T−
Total 1000 999,000 1,000,000
Number of non-cases, i.e., TN + FP
1,000,000 – 1,000 = 999,000

17
Example: Low Prevalence Population
D+ D− Total
T+ 990
T−
Total 1000
TP = SEN × (those with disease)
= 0.99 × 1000
= 990
Assume test SENsitivity = .99, i.e.,
Test will pick up 99% of those with disease
18
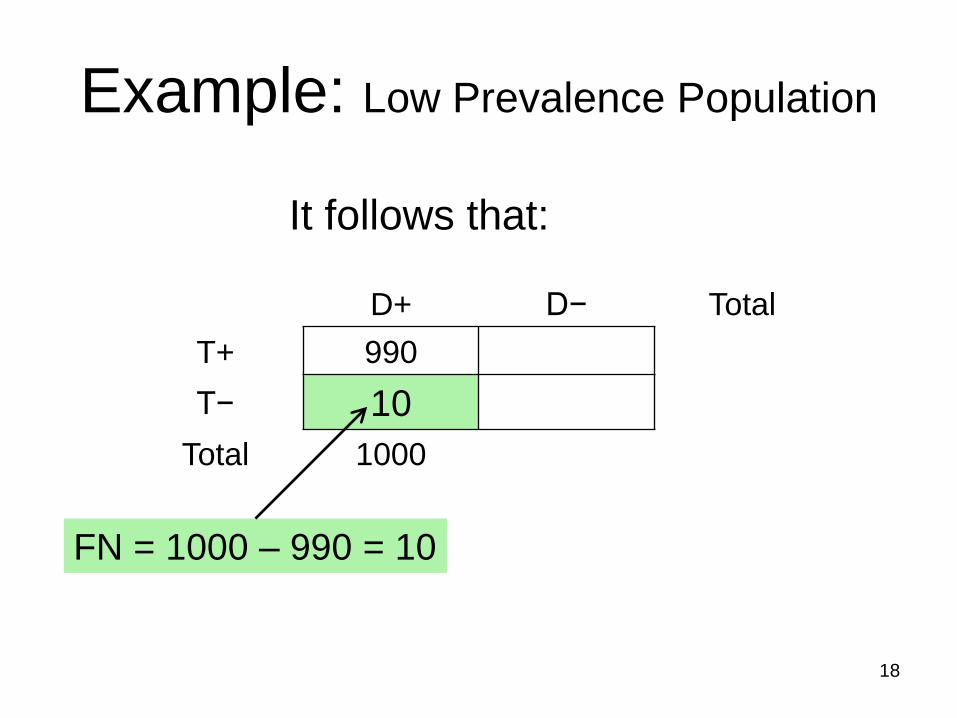
Example: Low Prevalence Population
D+ D− Total
T+ 990
T− 10
Total 1000
FN = 1000 – 990 = 10
It follows that:

19
Example: Low Prevalence Population
D+ D− Total
T+
T− 989,010
Total 999,000
TN = SPEC × (those without disease)
= 0.99 × 999,000
= 989,010
Suppose test SPECificity = .99
i.e., it will correctly identify 99% of the noncases
20
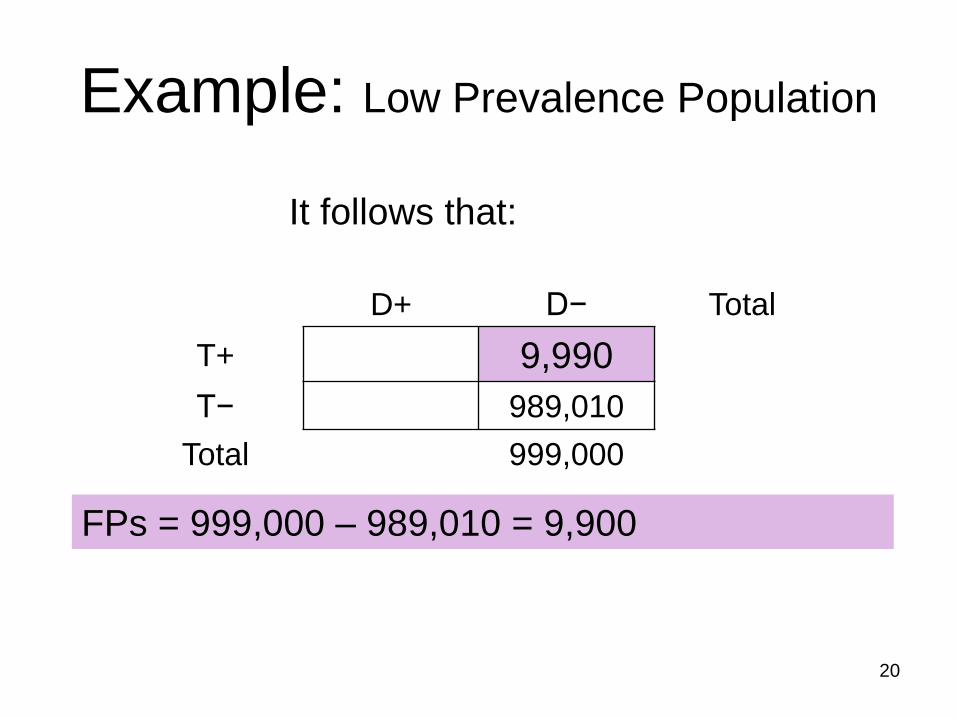
Example: Low Prevalence Population
D+ D− Total
T+ 9,990
T− 989,010
Total 999,000
FPs = 999,000 – 989,010 = 9,900
It follows that:
21
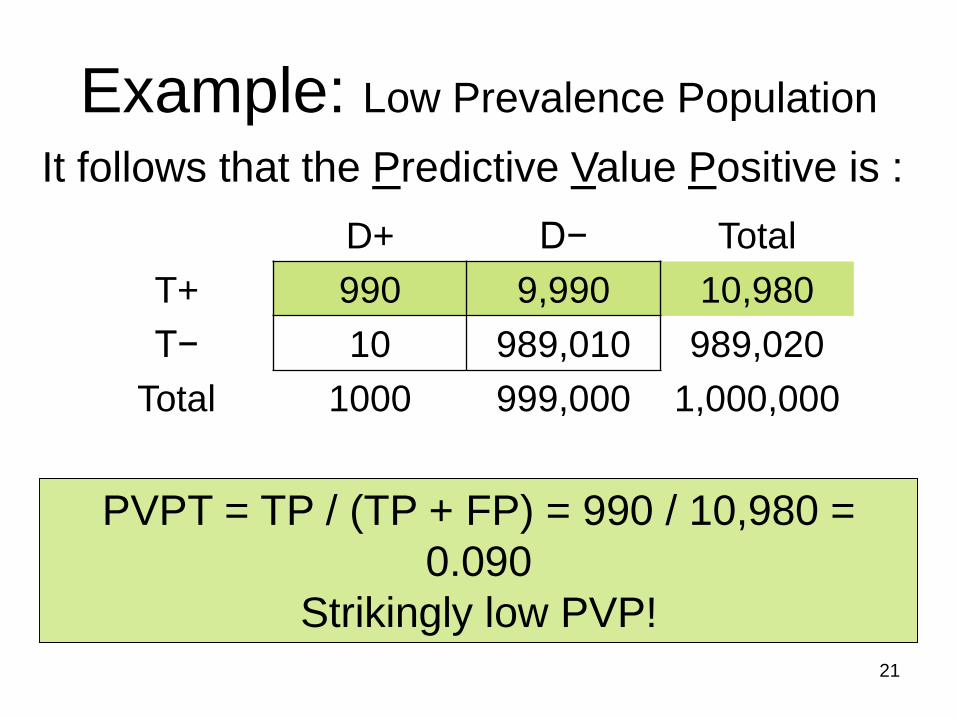
Example: Low Prevalence Population
D+ D− Total
T+ 990 9,990 10,980
T− 10 989,010 989,020
Total 1000 999,000 1,000,000
PVPT = TP / (TP + FP) = 990 / 10,980 =
0.090
Strikingly low PVP!
It follows that the Predictive Value Positive is :
22
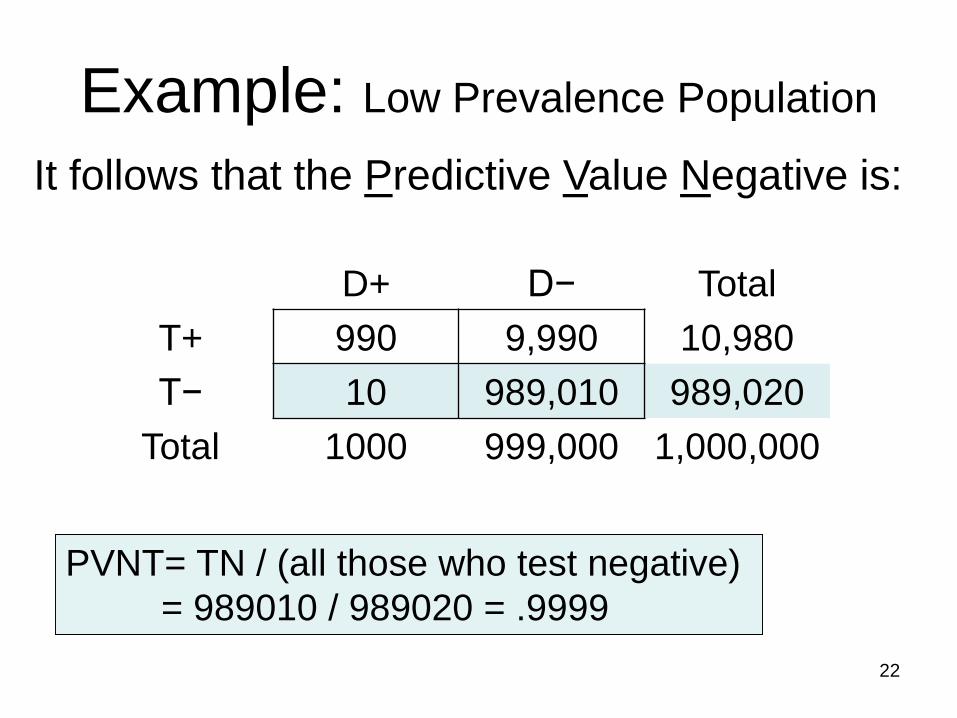
Example: Low Prevalence Population
D+ D− Total
T+ 990 9,990 10,980
T− 10 989,010 989,020
Total 1000 999,000 1,000,000
PVNT= TN / (all those who test negative)
= 989010 / 989020 = .9999
It follows that the Predictive Value Negative is:

23
Example: High prevalence population
D+ D− Total
T+ 99,000 9,000 108,000
T− 1,000 891,000 892,000
Total 100,000 900,000 1,000,000
SEN = 99000 / 100,000 = 0.99
SPEC = 891,000 / 900,000 = 0.99
Prev = 100000 / 1,000,000 = 0.10
Same test parameters but used in population
with true prevalence of .10
24
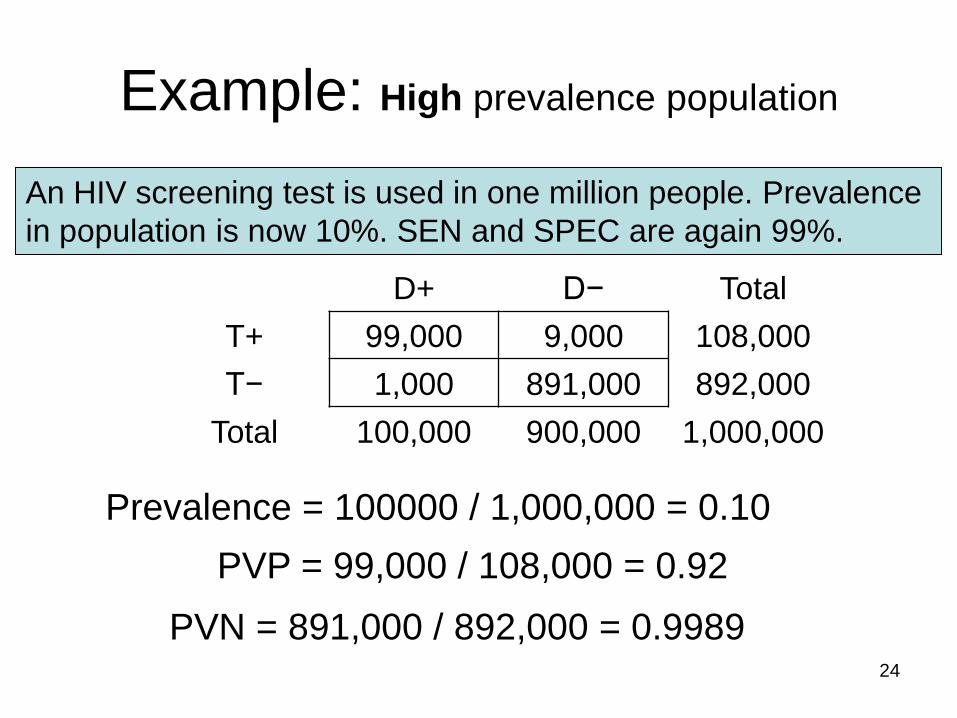
Example: High prevalence population
D+ D− Total
T+ 99,000 9,000 108,000
T− 1,000 891,000 892,000
Total 100,000 900,000 1,000,000
PVP = 99,000 / 108,000 = 0.92
PVN = 891,000 / 892,000 = 0.9989
Prevalence = 100000 / 1,000,000 = 0.10
An HIV screening test is used in one million people. Prevalence
in population is now 10%. SEN and SPEC are again 99%.

25
PVPT and Prevalence• As PREValence
goes down, PVPT
is affected
• Figure shows
relation between
PVP, PREV, &
SPEC (test SEN =
constant .99)

26
Screening Strategy• First stage
high SENS (don’t
want to miss cases)
• Second stage
high SPEC (sort out
false positives from
true positives)
27
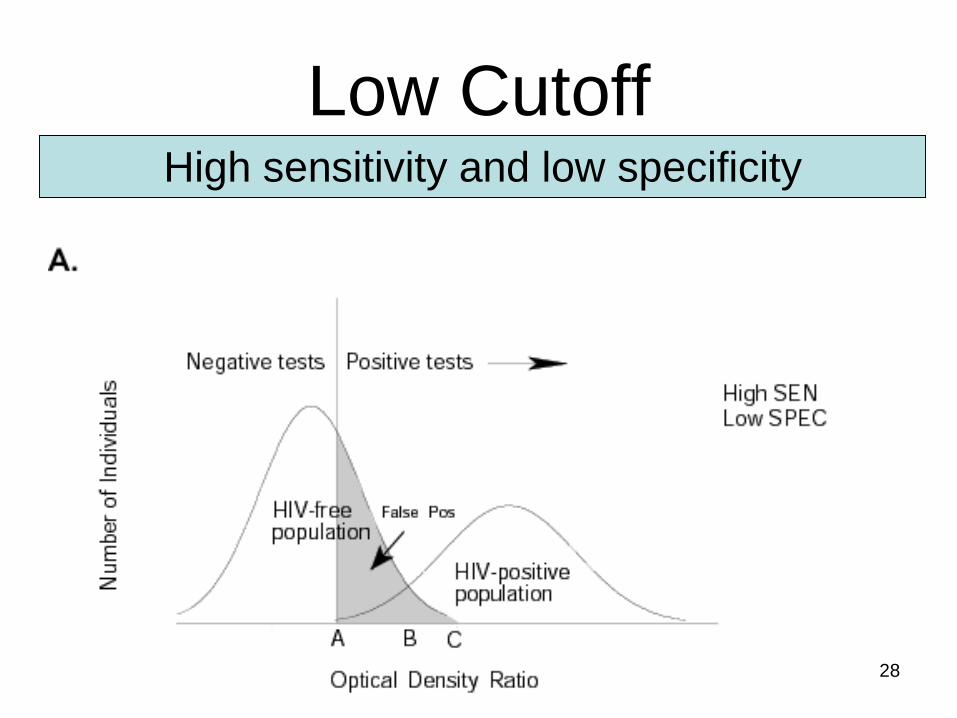
Selecting a Cutoff Point• There is often an overlap in test results
for diseased and non-diseased population
• Sensitivity and specificity are influenced by the chosen cutoff point used to determine positive results
• Example: Immunofluorescence test for HIV based on optical density ratio (next slide)
28
Low Cutoff High sensitivity and low specificity

29
High Cutoff Low sensitivity and high specificity

30
Intermediate Cutoff moderate sensitivity & moderate specificity