
CHAPTER 10 ISOLATION OF...
17
135 CHAPTER 10 ISOLATION OF PHYTOCONSTITUENTS 10.1 COLUMN CHROMATOGRAPHY Column chromatography is one of the most useful method for the separation and purification of plant constituents individually. It is another solid-liquid technique in which the two phases are a solid (stationary phase) and a liquid (mobile phase). The theory of column chromatography is analogous to that of thin-layer chromatography. The most common adsorbents - silica gel and alumina - are the same ones used in TLC. The sample is dissolved in a small quantity of solvent (the eluent) and applied to the top of the column. The Eluent, instead of rising by capillary action up a thin layer, flows down through the column filled with the adsorbent. Just as in TLC, there is an equilibrium established between the solute adsorbed on the silica gel or alumina and the eluting solvent flowing down through the column. Column chromatography is generally used as a purification technique, it isolates desired compounds from a mixture. 10.1.1 Materials and Methods NMR spectra were recorded on a Bruker 200 MHZ instrument using TMS as the internal reference for both 1 H and 13 C NMR experiments.CDCl 3 was used as the solvent. Chemical shifts are given in terms of parts per million (d scale). MS analyses were recorded on a Shimadzu QP 5000 instrument. IR spectra (cm -1 ) were recorded on a Perkin –
Transcript of CHAPTER 10 ISOLATION OF...

135
CHAPTER 10
ISOLATION OF PHYTOCONSTITUENTS
10.1 COLUMN CHROMATOGRAPHY
Column chromatography is one of the most useful method for the
separation and purification of plant constituents individually. It is another
solid-liquid technique in which the two phases are a solid (stationary phase)
and a liquid (mobile phase). The theory of column chromatography is
analogous to that of thin-layer chromatography. The most common adsorbents
- silica gel and alumina - are the same ones used in TLC. The sample is
dissolved in a small quantity of solvent (the eluent) and applied to the top of
the column. The Eluent, instead of rising by capillary action up a thin layer,
flows down through the column filled with the adsorbent. Just as in TLC,
there is an equilibrium established between the solute adsorbed on the silica
gel or alumina and the eluting solvent flowing down through the column.
Column chromatography is generally used as a purification technique, it
isolates desired compounds from a mixture.
10.1.1 Materials and Methods
NMR spectra were recorded on a Bruker 200 MHZ instrument
using TMS as the internal reference for both 1H and 13C NMR
experiments.CDCl3 was used as the solvent. Chemical shifts are given in
terms of parts per million (d scale). MS analyses were recorded on a
Shimadzu QP 5000 instrument. IR spectra (cm-1) were recorded on a Perkin –

136
Elmer RX1 FT-IR spectrophotometer. All the Spectral analyses were done at
Sophisticated Analytical Instrument Facility (SAIF) centre at IIT, Chennai.
Precoated thin layer chromatography plates (E-Merck, Darmastdt,
Germany; Silica gel 60 F254, 0.2 mm thickness, coated on aluminium sheets)
were used. Column chromatography was performed using silica gel (70-325
mesh).
Extract used : Methanolic extract
Method : Wet packing method
Packing material : Silica gel 70 – 325
10.1.2 Procedure
Isolation of phytoconstituents from the methanolic extract of
Limonia acidissima was done by column chromatography. The lower end of
the column was plugged with glass wool. The activated silica was mixed eith
hexane and the slurry formed was charged in to the column, in small portion,
with gentle tapping after each addition in order to ensure uniform packing and
to remove air bubbles, if any.
A small quantity of eluent was allowed to remain at the top of the
column (about 4cms) in order to prevent the drying and possible cracking of
the packed column. After the adsorbent had settled, a filter paper disc was
placed, the methanolic extract of Limonia acidissima was then dissolved in
the solvent system and adsorbed on silica gel and allowed to dry. This mixture
in a powder form was loaded at top of the column and eluted with n-hexane,
then with hexane-ethyl acetate mixture, followed by ethyl acetate - methanol
mixture gradiently. Several 50ml fractions were collected and each fraction
was checked by TLC technique. Similar Rf value containing fractions were
mixed together, allowed to evaporate to remove solvent. These fractions were

137
grouped together according to their homogeneity, judged from the TLC
analysis.
Totally about 200 fractions were collected from column. Among all
the fractions collected, the fractions from 51-100 and 150- 200 gave a single
compound with an Rf value of 0.86 and 0.74 respectively and assigned as
compound I and II.
Table 10.1 Purification of isolated compound I and II by TLC
S. No. Fraction No. Number of Spotson TLC plate
Rf value
1 1-50 1 0.86 (I)
2 51-100 0 -
3 101-150 0 -
4 151- 200 1 0.74 (II)
The isolated compounds I and II were subjected to spectroscopy
techniques like IR,1HNMR,13CNMR and MS to determine the functional
group and confirm the structure.
10.2 RESULT
Physical and Chemical Properties of Compound 1
Physical state : White crystals
Melting Point : 284ºC
Chemical Test : It gave pink to purple colour with
Liebermann-Burchard’s test indicating
terpenoidal nature.
Molecular formula : C25H28O12
Molecular weight : 452

138
Spectral Data of Compound I
IR spectrum of compound I
a) The IR (KBr) vmax : 1740(Aliphatic–CH bending), 1720(aromatic –
CH bending), 1030(C - O- C stretching), 975(C-C
Stretching) cm-1, 2926 (CH – stretching, 1686,
(C=O stretching), 1602 (COO– asymmetry).
b) MASS Spectrum of Compound I
GC-MS : m/z 453.1551 [M+1], 411, 397, 381, 345, 241, 229,
201, 193, 175, 174, 135, 123, 121, 119, 115, 109,
107, 105, 95, 91, 77, 69, 59 and 43.
c) 1H NMR Spectrum of Compound I
δ7.41(1H, s, H-21), 7.40(1H, s, H-23), 6.53(1H, d, H-1), 6.32(1H, s, H-22),
6.13(1H, s, H-2) 6.06(1H, s, H-19) 5.53 (1H, s, H-17), 3.99 (1H, s, H-15),
2.60-2.75 (4H, m, H-6, H-9, H-5), 1.50-1.87 (4H, s, H-11, H-12), 1.36 (3H, s,
H-30), 1.28 (6H, s, H-18, H-29) and 1.16 (3H, s, H-28).
d) 13C NMR Spectrum of Compound I
Position Number and 13C NMR δ values (ppm):150.5(C1), 118.8(C2),
160.1(C3), 86.2(C4), 53.1(C5),37.5(C6), 208.7(C7), 49.2(C8),41.7(C9),
49.1(C10), 19.0(C11), 29.0(C12), 38.3(C13), 67.1(C14), 54.1(C15), 166.5(C16),
77.7(C17), 24.8(C18), 103.8(C19), 119.7(C20), 141.0(C21), 109.5(C22),
143.1(C23), 20.1(C28) and 31.5(C30).
The 13C and 1H NMR Spectra of compound I gave some
characteristic features of glycoside type of triterpenoids.

139
e) Structure for Compound-1
ACIDISSIMIN (Limonoid) – A Triterpenoid Glycoside
O O
O
O
O
OH
O
A
C D
O
Physical and Chemical Properties of Compound 1I
Physical state : Brown semisolid
Melting Point : 104º
Chemical Test : It gave brown colour with Molisch reagent indicating
Carbohydrate nature.
Molecular formula : C14H20O12
Molecular weight : 380
Spectral Data of Compound II
a) IR spectrum
IR Cm-1 : 3446(OH), 2988(CH), 1728(C=O), 1600 (C=C), 1394 (C-O),
1075 (C-O), 668 (CH).

140
Figure 10.1 IR Spectrum of Compound I

141
Figure 10.2 1HNMR spectra of compound I

142
Figure 10.3 13CNMR spectra of compound I

143
Figure 10.4 13CNMR Spectrum of Compound I

144
Figure 10.5 Mass Spectrum of Compound I

145
Figure 10.6 IR Spectrum of Compound II

146
Figure 10.7 1HNMR Spectrum of Compound II
147
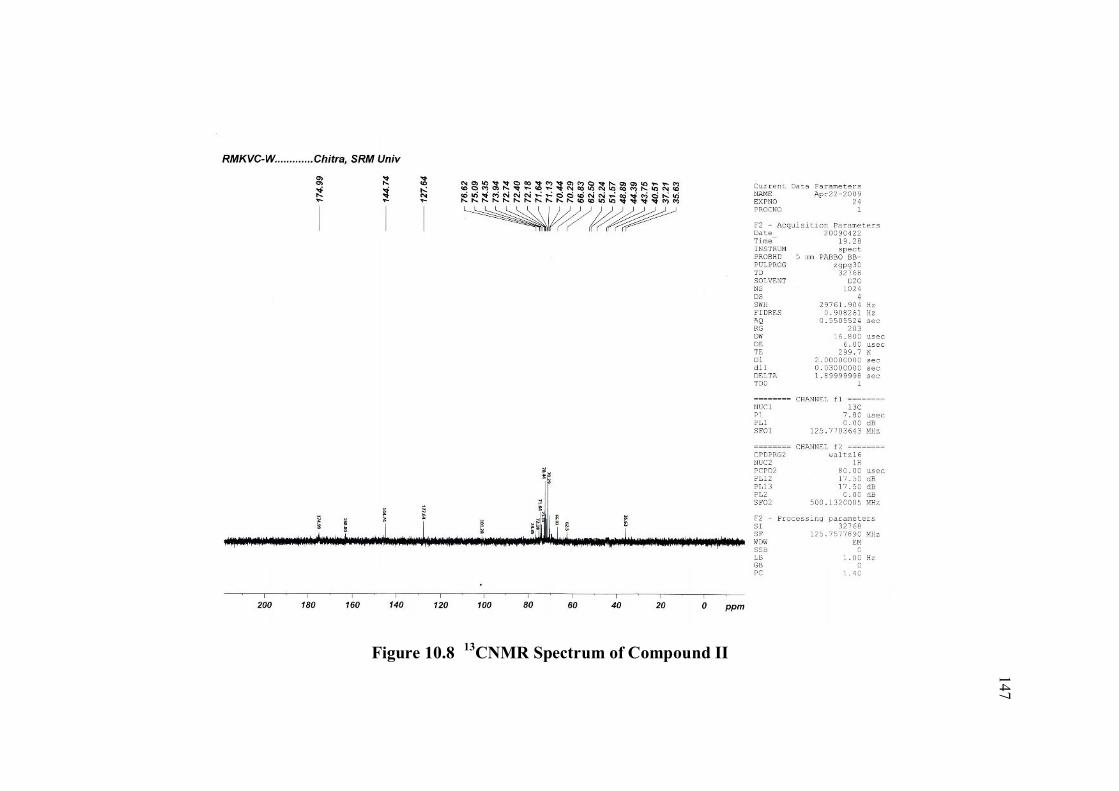
Figure 10.8 13CNMR Spectrum of Compound II

148
Figure 10.9 Mass Spectrum of Compound II

149
c) 13C - NMR spectra
168.80 and 174.99 (C1 and C1’), 144.74 and 70.44 (C2 and C2’), 127.64 and
101.28 (C3 and C3’), 70.29 and 74.35 (C4 and C4’), 71.64 and 62.50 (C5 and
C5’) 72.18 and 35.63 (C6 and C6’) and 71.13 and 66.83(C7 and C7’).
d) Mass Spectrum
(m/z)382(m+z) 382(m+2) 340 ,324, 310, 294, 263, 234, 217, 183, 152 , 120,
82.
e) Structure of Compound II
O
HO O
HO
OH
O
O
O
OH
HO
HO
OH
H
1
1'
2
2'3
4 56
7
3'4'
5'
6'
7'
Unsaturated Di galacturonic acid
10.3 RESULT AND DISCUSSION
The methanolic extract of L.acidissima was subjected to column
chromatography.The preliminary phytochemical investigation of MELA
revealed the presence of various constituents like coumarins, triterpenoids,
tannins, flavonoids, glycosides and carbohydrates. In the current study a
crystalline compound, acidissimin was isolated which yielded a molecular ion
peak at 453.15 consistent with the limonoid skeleton.
The first compound was obtained as a white crystalline natured
substance and exhibited a positive test to Liebermann burchard reagent.

150
The IR spectrum indicated that the compound I possessed carbonyl
chromophore (1720 cm-1) aromatic – CH bending (3030 cm-1), aliphatic – CH
bending (1740 cm-1), C= C stretching 1680 cm-1, C- C stretching (975 cm-1),
C- O- C stretching (1030 cm-1) groups.
The 1HNMR spectral displayed two pairs of typical H1 and H2
protons at δH 6.53, 6.11 (d 1H). The characteristic signals at H5, H6, H9, H11,
and H12 exhibited multiplet which proves the existence of methylene and
methine proton. Further signals for two exomethyl protons resonated a singlet
peak at δ value of 1.16, 1.28 and multiplet at 6.32 - 7.40 establish the
aromatic proton.
The 13CNMR spectra composed of one ester carbonyl carbon 160.1
(C3), two olefinic methines 150.5(C1), 118.8 (C2), two C-methyl groups 15.6
(C28), 20.1 (C29) one methane 103.8 (C19) and one SP3 hybridized quaternary
carbon attached to an oxygen atom 86.2 (C4). The spectral details of13CNMR substantiated the existence of the quaternary carbon, methane
carbon 54.1 (C15), 77.7(C17), 103.8, (C19) 141(C21), 109.5 (C22), 49.2 (C8),
41.7(C9), 49.1 (C10), 38.3 (C13), 119.7(C20) methyl carbon. On comparison of
complete spectral detail of the compound it was concluded that the proposed
structure was identified as acidissimin (a tetra nor triterpene limonoid
skeleton).
These results suggest that isolated compound I was reported from
the fruit pulp source of Limonia acidissima for the first time.
The second compound Unsaturated Digalacturonic acid was
obtained as brown semisolid and exhibited a positive response to Molisch
reagent. In the Mass spectrometry, it gave molecular ion peak at m/z 382
(M+2) + corresponding to a molecular formula C14H20O12. The IR spectrum
showed absorption bands at 3446,2988,1728,1600,1394,1075,and 668 cm-1

151
which were in agreement with hydroxl, carboxyl, olefinic and aliphatic
groups. The 1H–NMR spectrum revealed the presence of two groups of
equivalent proton signals at δ 9.02 and 85.34 resonated a singlet and multiplet
respectively. The multiplet peaks at δ 3.58 – 3.68 depicted the presence of
hydroxyl protons furthermore the 13CNMR spectrum displayed 14 carbon
atoms corresponding to two galactopyranose rings joined by glycosidic
linkage. Thus the compound II was identified for the first time as unsaturated
Digalactruonic acid.
It has a molecular formula of C14H20O12 based on the Mass
spectrum exhibiting a molecular ion peak at m/z 382 (M+2)+.
The IR spectrum exhibited a strong absorption band corresponding
to OH group (3446 cm-1), CH stretching (2988 cm-1), carbonyl stretching at
1728 cm-1 and olefinic stretching at 1600 cm-1.
The 1HNMR spectrum showed six hydroxyl protons at (9.02, 5.35,
5.58, 3.58, 3.68), 4.33.
The 13CNMR indicated the presence of 14 carbons, including 2
carboxylic carbon (C-168.80 and 174.99), 5 oxy methene groups (C-101.28,
70.29, 74.35, 71.64, 62.50), 4 methene groups (C-127.64, 72.18, 35.63,
70.44), 2 methylene groups (at C-71.13, 66.83) and quarternary carbon at
C-144.74. Therefore compound II was determined to be an Unsaturated
Digalacturonic acid.
![Lecture 31 - Hydrolysable Tannins [Compatibility Mode]](https://static.fdocuments.us/doc/165x107/577d230e1a28ab4e1e98dd9c/lecture-31-hydrolysable-tannins-compatibility-mode.jpg)


![Lecture 32 - Condensed Tannins [Compatibility Mode]](https://static.fdocuments.us/doc/165x107/543699bb219acdda5f8b5278/lecture-32-condensed-tannins-compatibility-mode.jpg)