Chapter 10 - Energy Scenarios ENERGY ASSESSMENT: ENERGY AND THE CHALLENGE OF SUSTAINABILITY Chapter...
35
part III are sustainable futures possible?
Transcript of Chapter 10 - Energy Scenarios ENERGY ASSESSMENT: ENERGY AND THE CHALLENGE OF SUSTAINABILITY Chapter...

part IIIa r e s u s t a i n a b l e f u t u r e s p o s s i b l e ?

CHAPTER 9
Nebojsa Nakicenovic (Austria)LEAD AUTHORS: Tom Kram (Netherlands), Alexj Makarov (Russian Federation), Bent Sørensen, (Denmark), Keiichi Yokobori (Japan), and Zhou Fengqi (China)
CONTRIBUTING AUTHORS: Yasumasa Fujii (Japan), Jeffrey Stewart (United States),and John Weyant (United States)
energy scenarios

WORLD ENERGY ASSESSMENT: ENERGY AND THE CHALLENGE OF SUSTAINABILITY
Chapter 9: Energy Scenarios
334
Energy scenarios provide a framework for exploring future energy perspectives, includingvarious combinations of technology options and their implications. Many scenarios in the
literature illustrate how energy system developments will affect the global issues analysed in part 1(chapters 1–4). Some describe energy futures that are compatible with sustainable developmentgoals, such as improved energy efficiencies and the adoption of advanced energy supply technologies.Sustainable development scenarios are also characterised by low environmental impacts (local,regional, global) and equitable allocation of resources and wealth.
The three cases of alternative global developments presented in this chapter suggest how thefuture could unfold in terms of economic growth, population trends, and energy use. The challengeis formidable. For example, by 2100, 6–8 billion additional people—significantly more than theworld population today—will need access to affordable, reliable, flexible, and convenient energyservices. All three cases achieve this, through different energy system developments, but with varyingdegrees of sustainability.
A middle-course reference case (B) includes one scenario and is based on the direction in whichthe world is headed. Assuming continued moderate economic growth and modest technologicalimprovement, this scenario leads to adverse environmental impacts, ranging from regional acidification to climate change. Thus—although it is a substantial improvement over the current situation—this scenario falls short of achieving a transition towards sustainable development. Theother two cases and their variants lead to higher levels of economic development with vigorousimprovement of energy technologies. They both—especially the ecologically driven case (C)—alsoresult in a transition towards sustainable development.
Case A includes three scenarios with high economic growth throughout the world. One of them,A3, achieves some sustainable development goals through rapid economic growth in conjunctionwith a shift towards more environmentally benign energy technologies, including a significant rolefor clean fossil, renewables, and nuclear energy. The other two lead to a higher dependence on carbon-intensive fossil fuels, resulting in high energy-related emissions—and so are unsustainable.
Case C includes two ecologically driven scenarios with high growth in developing countries(towards being rich and ‘green’). One of them, C1, assumes a global phaseout of nuclear energy by 2100. The other, C2, does not. Both assume that carbon and energy taxes will be introduced topromote renewables and end-use efficiency improvements—rather than to reduce other taxes inindustrialised regions.
The considerable differences in expected total energy consumption among the scenarios reflectvarying approaches to addressing the need for energy services in the future and demonstrate that policy matters. Increases in research, development, and deployment efforts for new energy technologies are a prerequisite for the achievement of the three scenarios that have characteristicsof sustainable development. Significant technological advances will be required, as well as incrementalimprovements in conventional energy technologies. In general, scenarios A3, C1, and C2 requiresignificant policy and behavioural changes in the next few decades to achieve more sustainabledevelopment paths. Taken together, these changes, which are described in more detail in part 4(chapters 11 and 12), represent a clear departure from a business-as-usual approach.
Another crucial prerequisite for achieving sustainability in the scenarios is near-universal accessto adequate and affordable energy services and more equitable allocation of resources. Finally, environmental protection—from indoor pollution to climate change—is an essential characteristicof sustainable development in the scenarios. The resolution of these future challenges offers a windowof opportunity between now and 2020. Because of the long lifetimes of power plants, refineries, andother energy-related infrastructure investments, there will not be sufficient turnover of such facilitiesto reveal large differences among the alternative scenarios presented here before 2020. But theseeds of the post-2020 world will have been sown by then. Although choices about the world’s futureenergy systems are now relatively wide open, they will narrow by 2020, and development opportunities,such as achieving sustainability, might not be achievable later if forgone today. ■
ABSTRACT
WORLD ENERGY ASSESSMENT: ENERGY AND THE CHALLENGE OF SUSTAINABILITY
Chapter 9: Energy Scenarios
335
ustainable development hasbecome a synonym for desirable
transitions into the new millennium.This is often reflected in energy scenariosthat consider conditions for achieving sustainable development. Because energy systems change slowly, energy scenarios have longtime horizons—often extending more than 100 years intothe future. These long time periods are needed to formulate transitionsto sustainable development paths. And because energy is also an importantprerequisite for sustainability, there is a large body of literature onenergy scenarios that describe sustainable development paths.
This chapter assesses that literature and summarises the maindriving forces of future energy developments and their implications.The objective of the chapter is to link—through global scenarios—the energy options presented in part 2 (chapters 5–8) with the salientenergy issues presented in part 1 (chapters 1–4), thereby illustratingthe conditions for sustainable futures. Three global scenarios (A3,C1, and C2) are considered that to varying degrees lead towardssustainability. All of them require polices and measures in the nearfuture to accomplish the envisaged transition, and none is compatiblewith current trends. They are compared with a third reference scenario (B) that also outlines positive future developments butlacks many of the characteristics of sustainability. This scenario ismore consistent with current developments and trends. These threescenarios have been developed jointly by the International Institutefor Applied Systems Analysis (IIASA) and the World Energy Council(WEC) and are presented here to represent a wider literature onreference and sustainable development scenarios (IIASA-WEC,1995; Morita and Lee, 1998; Nakicenovic, Grübler, and McDonald,1998; Nakicenovic, Victor, and Morita, 1998).
What are scenarios and how are theyused for energy assessments?Scenarios are images of alternative futures. Scenarios are neitherpredictions nor forecasts. Each scenario can be interpreted as oneparticular image of how the future could unfold. Scenarios are useful tools for investigating alternative future developments andtheir implications, for learning about the behaviour of complex systems, and for policy-making.
Energy systems are complex, their behaviour may be uncertainand is not always well understood, and information on them is oftenincomplete. Frequently scenarios are the best tool for understandingalternative energy developments and their implications. In scientificenergy assessments, scenarios are usually based on an internallyconsistent, reproducible set of assumptions or theories about thekey relationships and driving forces of change, which are derivedfrom our understanding of both history and the current situation.Often such energy scenarios are formulated with the help of formalmodels. More than 400 quantitative energy scenarios are documentedin the database developed by Morita and Lee (1998).
Formal models cannot, however, capture all aspects of energy
systems. Some aspects of energyperspectives can only be appreciated
through intuition and are best com-municated by images and stories. Thus
scenarios are sometimes less quantitativeand more descriptive, and in a few cases do not
involve any formal analysis and are expressed inqualitative terms. Energy scenarios can also involve components
of both; they sometimes have a narrative part, often called a “storyline”,and a number of corresponding quantitative scenarios for each storyline. Some scenarios are primarily narrative and qualitative,even if actual numbers are used for illustrative purposes. This isoften the case with energy scenarios that prescribe the achievementof sustainability and thus make particularly strong assumptionsabout the future.
Scenarios are not value free, and can often be divided into twobroad groups: descriptive and normative. Descriptive scenarios areevolutionary and open-ended, and explore paths into the futurewithout any preconceived endpoint. Normative (or prescriptive)scenarios are explicitly values-based and teleological, and explorethe routes to desired or undesired endpoints (utopias or dystopias). Thedistinction between the two groups is not always clear (Nakicenovicand others, 2000). For instance, two of the three scenarios from theInternational Institute for Applied Systems Analysis and WorldEnergy Council (IIASA-WEC) that are considered here describe howmany conditions of sustainability could be achieved by the end of the21st century but also contain many normative elements that illustratepolices and measures that would be required to change current trends.
Alternative development paths and how they are reflected in scenariosThe starting point for any analysis of energy development is aprospective look into the future. Because it is impossible to predictfuture energy developments, an important purpose of alternative energyscenarios is to analyse possible global and regional developmentsfor periods of a century or more so that their implications for sustainable development can be assessed. For now, these long-termenergy scenarios are the best way to integrate demographic, economic,societal, and technological knowledge with our understanding ofecological systems and environmental implications. As an integrationtool, scenarios also allow a role for intuition, analysis, and synthesis.By developing scenarios, researchers can analyse future determinantsof energy requirements and compare them to supply availabilities,financing, environmental constraints, and other salient factors anddriving forces. Long-term scenarios can provide a framework for a‘retrospective view from the future’ and for assessing near-termmeasures to achieve sustainable and other desirable development paths.
The traditional method of formulating scenarios first involvesdeveloping a ‘business-as-usual’ baseline that essentially assumesthat things will not change in the future; then ‘policy’ cases startingfrom the baseline are developed. But it is becoming increasinglyevident that it is next to impossible to formulate future developments
Each scenario can be interpreted as one particular image
of how the future could unfold.
S
that do not include any change incomparison with today; namely,futures that capture the business-as-usual course of events. In fact, even thoughenergy futures are unpredictable, one thingthat appears almost certain is that the futurewill be different from today. In addition, it is virtuallyimpossible to imagine future developments that can avoidchanges. Within a century, for example, two technological discontinuitiescould occur, along with a major shift in societal values and perhapsa change in the balance of geopolitical power. Thus there is a growingliterature on alternative scenarios that map a wide range of futurepossibilities. The hope is that, by mapping alternative developmentscenarios, it will be possible to identify a wider range of differingcourses of action. These alternative scenarios are tools for capturingdifferent relationships and the evolution of factors that determinefuture energy trajectories and spatial patterns.
It is important to realise that such approaches depend on assessmentsof the driving forces of energy futures and the relationships amongthem, ranging from population developments to technological change.Usually a very small subset of alternative scenarios can be identifiedthat will lead to sustainability. The driving forces in these scenariosmust be consistent with the concept of sustainability. For example,such scenarios should not have dangerously high environmentalimpacts or inequitable resource allocation.
Such approaches also allow for the unfolding of different futures.Differing scenarios, while sharing similar outcomes, might havevarying mixes of the same characteristics. For example, differenteconomic development paths might lead to similar global energyrequirements by the middle of the 21st century. A world with highpopulation and relatively low levels of development might havealmost the same total energy needs as a world with low populationand high levels of affluence. But the latter clearly would offer morepossible choices for achieving sustainability.
Energy scenarios for sustainable developmentTo assess what kinds of development will ultimately be sustainable,one must have a global perspective and a very long time horizoncovering periods of at least a century. Chapters 1–4 amply illustratethat access to affordable energy services is a crucial prerequisite forsustainable development. At the same time, energy use is also a maincause of environmental degradation at all scales and thus can impedeachieving sustainability. (Often a higher degree of equity in theworld is also included in the concept of sustainable development.)
Sustainable development is an elusive concept. It is often easierto define those development paths that are not sustainable thanthose that are. In many ways, this is the advantage of the concept. Ithas sufficient clarity to identify which development paths do not leadto a sustainable future, and it offers flexibility while being prescriptive.Sustainable energy scenarios are often designed to offer policy guidanceon managing, for example, an orderly transition from today’s energysystem, which relies largely on fossil fuels, towards an energy system
more compatible with sustainabledevelopment in all its dimensions
(Goldemberg and others, 1988).1
All sustainable futures are in somesense positive and have some normative
elements. In all of them the world developsequitably with relatively low environmental impacts.
Sustainable energy scenarios sometimes include strongassumptions about desirable futures; because they prescribe howsuch futures can be achieved, they are normative. In such normativeapproaches, sustainable futures usually are not considered to be achievable with current policies and prevailing development trends, but rather often depend on a fundamental change or a major paradigm shift.
Brief review of the literature on energy scenariosThe construction of scenarios to investigate alternative future developments under a set of assumed conditions dates far back inhistory. Scenarios were and continue to be one of the main tools fordealing with the complexity and uncertainty of future challenges.
The first scenarios were probably used to plan military operations.Scenarios now are being increasingly used in business enterprisesand for many other commercial purposes. Perhaps most famous inthe literature is the use of scenarios by the Shell Group in the wakeof the so-called oil crisis to plan its corporate response strategies(Schwartz, 1991). Today scenarios are quite widespread and arefound in all kinds of enterprises around the world. Many are quantitative; this is often the case for enterprises in the energy sector. Some of them also include considerations of sustainability.Recently the World Business Council for Sustainable Developmentpresented a set of scenarios that was developed in collaborationwith 35 major corporations (WBCSD, 1998).
During the past 30 years a number of global studies have usedscenarios as a tool to assess future paths of energy system development.One of the first global studies to employ scenarios for this purposewas conducted by IIASA during the late 1970s (Häfele, 1981).Another influential series of scenarios that included the assessmentof sustainable development was formulated by the World EnergyCouncil (WEC, 1993). The Intergovernmental Panel on Climate Change(IPCC) has used scenarios since its inception to assess greenhousegas emissions and climate change. In 1992 it developed a set of veryinfluential scenarios that gave a detailed treatment of energy sectordevelopments. The set includes six scenarios called IS92, three ofwhich describe futures that include characteristics of sustainabledevelopment (Pepper and others, 1992; Leggett, Pepper, and Swart, 1992).
A growing number of global studies consider futures with radicalpolicy and behavioural changes to achieve sustainable development(Goldemberg and others, 1988). One of the first global scenarios tofocus on achieving sustainable development was formulated byGreenpeace (Lazarus and others, 1993). Another among the first globalenergy scenarios with characteristics of sustainable development
WORLD ENERGY ASSESSMENT: ENERGY AND THE CHALLENGE OF SUSTAINABILITY
Chapter 9: Energy Scenarios
336
Sustainable futures usually are not considered
to be achievable with current policies and prevailing development trends.
WORLD ENERGY ASSESSMENT: ENERGY AND THE CHALLENGE OF SUSTAINABILITY
Chapter 9: Energy Scenarios
337
describes a transition to renewable energy futures (Johansson andothers, 1993). In its second assessment report, the IPCC also considereda range of global energy scenarios, based on some elements of the IS92set, with varying degrees of sustainability (Ishitani and others, 1996).
In more recent studies, sustainable development scenarios areusually included among other alternative futures. This class of sustainable scenarios can be characterised by low environmentalimpacts at all scales and more equitable allocation of resources andwealth relative to current situations. Recently the Global ScenarioGroup presented a set of three scenarios that received considerableattention (Raskin and others, 1998). These scenarios were basedon elaborate narratives describing alternative futures, includingsome that are decisively sustainable. The set of scenarios developedby the WBCSD also includes narratives and describes alternativedevelopment paths, some of which include strong emphasis on sustainable development (WBCSD, 1998).
There is also a large literature of global energy scenarios thatserve as a reference for showing that, under business-as-usual conditions, many of the developments crucial for the achievement ofsustainability would not be realised. For example, the World EnergyOutlook, regularly published by the International Energy Agency(IEA, 1998), is very influential. Many of these global energy scenariosare limited to developments during the next 20–30 years and do not go far enough into the future to assess all crucial aspects of sustainable development, such as climate change. But they often arevery relevant to issues such as the conditions for meeting the carbonemissions targets specified in the Kyoto Protocol under the UnitedNations Framework Convention on Climate Change (UNFCCC, 1992).
The literature on sustainable energy scenarios is large, and thisbrief review cannot give a comprehensive account. The IPCC hasdeveloped a database that includes a number of global energy scenarios that can be characterised as describing sustainable development (Morita and Lee, 1998). This database, which includesmore than 400 global and regional scenarios, illustrates that the literature is quite rich; thus not all scenarios can be described inthis chapter. (In the following sections dealing with such scenariodriving forces as economic development, some of the comparisonsuse scenarios from the database.)
The IPCC, in its recent Special Report on Emissions Scenarios,considers 40 scenarios that include a large number of sustainablefutures (Nakicenovic and others, 2000). This set of scenarios isunique in a number of respects—it was developed using six differentmodels, it covers a wide range of alternative futures based on the scenarios in the literature, it includes narrative descriptions of alternative futures, and it has been reviewed extensively.
Here some of the conditions for achieving a transition towardssustainable development will be illustrated with the three scenariosdeveloped by IIASA and WEC. These will then be contrasted to a reference case that captures many positive future developments butcannot be characterised as leading to sustainability. These scenarioscover a wide range of possible future developments and are representativeof the scenario literature. Where appropriate, other scenarios will
be drawn upon to illustrate the conditions and implications of sustainable development.
Three energy scenarios for the 21st centuryIIASA and WEC undertook a five-year joint study published as GlobalEnergy Perspectives (Nakicenovic, Grübler, and McDonald, 1998).The objectives of the study were to integrate near-term strategies through2020 with long-term opportunities to 2100; analyse alternativefuture developments; ensure consistency and reproducibility with aunified methodological framework using formal models and databases;incorporate a dynamic treatment of technological change; and harmonise regional aspirations with global possibilities. The studycentres on three cases of future social, economic, and technologicaldevelopment for 11 world regions.
The three cases unfold into six scenarios of energy system alternatives.Together they span a wider range of alternative future developmentsand driving forces. The three cases are designated as A, B, and C.Case A includes three variant scenarios and reflects a high-growthfuture of vigorous economic development and rapid technologicalimprovements. One of its variants (A3) includes many characteristicsof sustainable and equitable development. Case B represents a middle course, with intermediate economic growth and more modesttechnological improvements. Case C is ecologically driven (with twovariants: C1, with new renewables and a phaseout of nuclear energyby 2100; and C2, with renewables and new nuclear); it incorporateschallenging environmental and energy taxes to simultaneously protect the environment and transfer wealth from North to South toenhance economic equity. This approach leads to lower energy usebut high overall growth, especially in the South. Case C illustrates mostvividly the conditions for achieving a high degree of sustainabilityand equity in the world. Table 9.1 gives an overview of the three casesand their six scenarios of energy development. Full documentationis available in the published study report (Nakicenovic, Grübler, andMcDonald, 1998) and at the study Website (http://www.iiasa.ac.at/cgi-bin/ecs/book_dyn/bookcnt.py).
These scenarios received a wide review that included about 100leading energy experts. They incorporate both a top-down approachbased on an integrated set of energy, economic, and environmentalmodels to initially develop the set of scenarios, and a bottom-upevaluation of the regional perspectives provided by the 11 reviewgroups. This set of scenarios will be used to illustrate to what extentthe concepts of sustainable development are captured across thescenarios. They have been chosen because they cover a wide rangeof alternative future developments and are quite representative ofthe recent scenario literature. Again, where appropriate, referencewill be given to other scenarios from the literature.
Three of the six scenarios will be used to illustrate alternativeconditions for achieving transitions of energy systems towards sustainability. Table 9.2 provides a number of indicators that may beused to characterise the achievement of sustainable development inenergy scenarios and shows how the three scenarios selected for

WORLD ENERGY ASSESSMENT: ENERGY AND THE CHALLENGE OF SUSTAINABILITY
Chapter 9: Energy Scenarios
338
TABLE 9.1. SUMMARY OF THREE ENERGY DEVELOPMENT CASES IN 2050 AND 2100 COMPARED WITH 1990
The three cases unfold into six scenarios of energy system alternatives: three case A scenarios (A1, ample oil and gas; A2, return to coal; and A3, non-fossil future), a single case B scenario (middle course), and two case C scenarios (C1, new renewables; and C2, renewables andnew nuclear). Some of the scenario characteristics, such as cumulative energy consumption, cumulative carbon dioxide emissions, anddecarbonisation, are shown as ranges for the three case A and two C scenarios. Source: Nakicenovic, Grübler, and McDonald, 1998.
Population (billions)
Gross world product (trillions of 1990 dollars)
Gross world product (annual percentage change)
Primary energy intensity (megajoules per 1990 dollarof gross world product)
Primary energy intensity improvement rate (annual percentage change)
Primary energy consumption (exajoules)
Cumulative primary energy consumption, 1990–2100 (thousands of exajoules)
Energy technology cost reductions (through learning)
Energy technology diffusion rates
Environmental taxes (excluding carbon dioxide taxes)
Sulphur dioxide emissions (millions of tonnes of sulphur)
Carbon dioxide emission constraints and taxes
Net carbon dioxide emissions (gigatonnes of carbon)
Cumulative carbon dioxide emissions (gigatonnes of carbon)
Carbon dioxide concentrations (parts per million by volume)
Carbon intensity (grams of carbon per 1990 dollar of gross world product)
Investments in energy supply sector (trillions of 1990 dollars)
Number of scenarios
199020502100
199020502100
1990–20501990–2100
199020502100
1990–20501990–2100
199020502100
CoalOil
Natural gasNuclear energy
HydropowerBiomass
Solar energyOther
Global total
FossilNon-fossil
FossilNon-fossil
199020502100
199020502100
1990–2100
199020502100
199020502100
1990–20202020–50
2050–2100
Case AHigh growth
5.310.111.7
20100300
High2.72.5
19.010.4
6.1
Medium–0.9–1.0
3791,0411,859
8.9 – 30.727.6 – 15.718.4 – 28.76.2 – 11.23.7 – 4.27.4 – 14.31.8 – 7.73.0 – 4.7
94.0 – 94.9
HighHigh
HighHigh
No
58.644.8 – 64.2
9.3 – 55.4
No
69 – 156 – 20
910 – 1,450
358460 – 510530 – 730
28090 – 14020 – 60
15.724.793.7
3
Case BMiddle growth
5.310.111.7
2075
200
Medium2.22.1
19.011.27.3
Low–0.8–0.8
379837
1,464
17.515.315.810.53.68.31.94.3
77.2
MediumMedium
MediumMedium
No
58.654.958.3
No
61011
1,000
358470590
28013060
12.422.382.3
1
Case CEcologically driven
5.310.111.7
2075
220
Medium2.22.2
19.08.04.0
High–1.4–1.4
379601880
7.1 – 7.210.9
12.2 – 12.92.1 – 6.23.6 – 4.09.1 – 10.16.3 – 7.41.4 – 2.2
56.9
LowHigh
MediumHigh
Yes
58.622.1
7.1
Yes
652
540
358430430
2807010
9.414.143.3
2

WORLD ENERGY ASSESSMENT: ENERGY AND THE CHALLENGE OF SUSTAINABILITY
Chapter 9: Energy Scenarios
339
this assessment fare in comparison with each other. The middle-course scenario (B) was chosen to serve as a reference baseline becauseit was designed to represent a future characterised by incrementaland gradual changes. In fact, this scenario would represent a majorimprovement in the global energy system and its use, but it does fallshort of fulfilling many indicators of the sustainability suggested intable 9.2. The other two scenarios shown in table 9.2 (A3 and C1)describe futures that include characteristics of sustainability. Thethird scenario (C2), which can also be characterised along thesame lines, includes continuous reliance on nuclear energy, in contrast to the other ecologically driven scenario, which has a globalnuclear phaseout by 2100 (C1). Neither the A3 nor the C1 scenario,however, is compatible with current trends and developments, soboth would require new policy initiatives and measures directedtowards achieving sustainable development. Even so, neither of thescenarios ranks very high on all 13 indicators of sustainability consideredin table 9.2. At the same time, table 9.2 indicates that, among thespectrum of energy futures considered here, C1 represents the energyfuture that is the most compatible with sustainable development.
Scenario A3 envisions a future with impressive technologicalimprovements and subsequent high degrees of economic development,a structural shift first towards natural gas and then towards renewableand nuclear energy options, and very high levels of energy efficiency.Environmental impacts are therefore quite low in this future. Equityis achieved through rapid development, with today’s developingregions achieving a high level of affluence by the end of the 21st
century. The development gap narrows, increasing equity in theworld. This scenario also includes characteristics of sustainability.This is achieved primarily through vigorous development (withoutactive redistribution of income). Rapid technological and economicdevelopment allows access to an ever-expanding resource base withdecreasing energy and material intensities, and a radical decline inadverse environmental impacts. However, it requires a paradigmshift and a host of new policies.
The ecologically driven case C scenario presents a rich and‘green’ future and represents a fundamentally different developmentpath. It includes both substantial technological progress andunprecedented international cooperation centred explicitly on environmental protection and international equity—it includes ahigh degree of environmental protection at all scales, from indoorair pollution to climate, with active redistribution of wealth and veryhigh levels of energy efficiency and conservation. It fulfils most of the other criteria associated with sustainable development (see table 9.2), such as increasing equity, both in an economic andecological sense, among regions and countries. Thus it can be considered to lead to sustainable development. For example, itincorporates a challenging, broad portfolio of environmental control technologies and policies, such as emissions standards andcaps, incentives to encourage energy producers and consumers touse energy more efficiently and carefully, ‘green’ taxes (levied onenergy and carbon), international environmental and economicagreements, and technology transfer.
TABLE 9.2. CHARACTERISTICS OF SUSTAINABILITY IN THREE ENERGY DEVELOPMENT SCENARIOS IN 2050 AND 2100 COMPARED WITH 1990
1990
Low
Low
Low
Low
Medium
Medium
Medium
Medium
Low
Medium
Medium
Low
Low
Scenario A3
Very high
High
Very high
High
Very high
Very high
Very low
High
High
High
Very high
High
Very high
Scenario B
Medium
Medium
High
Medium
High
High
Very low
Low
Low
Low
High
Medium
Medium
Scenario C1
Very high
Very high
Very high
Very high
Very high
Very high
High
High
Very high
Very high
Very high
Very high
Medium
Indicator of sustainability
Eradicating poverty
Reducing relative income gaps
Providing universal access to energy
Increasing affordability of energy
Reducing adverse health impacts
Reducing air pollution
Limiting long-lived radionuclides
Limiting toxic materialsa
Limiting GHG emissions
Raising indigenous energy use
Improving supply efficiency
Increasing end-use efficiency
Accelerating technology diffusion
a. For this row only, the qualitative indicators are not based on quantitative features of the scenarios, but were specified by the authors on the basis ofadditional assumptions.

WORLD ENERGY ASSESSMENT: ENERGY AND THE CHALLENGE OF SUSTAINABILITY
Chapter 9: Energy Scenarios
340
The case C scenario also reflects substantial resource transfersfrom industrialised to developing countries to spur growth anderadicate poverty. These transfers include stringent internationalenvironmental taxes and incentives, which recycle funds fromindustrialised countries (members of the Organisation forEconomic Co-operation and Development, or OECD) to developingcountries. Specifically, it is assumed that energy and carbon taxesare applied universally, albeit at different rates and timing, and thatthe tax revenues are used to promote development. In the scenario,this means that the proceeds from these taxes in OECD countries arerecycled as resource transfers to developing countries and are earmarked for the development of energy infrastructure, clean technologies, efficiency, and conservation. Because this scenariorequires a fundamental paradigm shift from current socioeconomic,technological, and environmental development trends, new policieswould be required to achieve the future it describes. Thus the transition towards more sustainable development paths in bothcases C and A3 would require a host of new policies to promote thediffusion of advanced technologies, reliable and affordable access toenergy for all, free trade, vigorous economic growth, and reducedemissions at all scales. These findings are consistent with chapter12, where it is stated that new policies would be required to achievemore sustainable development.
The three cases have a number of common features. All providefor substantial social and economic development, particularly in the developing world, and all give much wider access to reliable,affordable energy throughout the world. During the 21st century, asaffluence increases throughout the world, the current distinctionbetween developing and industrialised regions will become less and
less appropriate in the scenarios considered here. All the scenariosprovide for improved energy efficiencies and environmental compatibility, and hence for associated growth in both the quantityand quality of energy services.
The task is indeed daunting. Nearly 2 billion people, or a third ofthe world’s population, lack access to adequate, affordable, clean,and convenient energy services such as electricity (chapter 2). Thecurrent disparities in energy use mirror the disparities in access toaffordable energy services and in the distribution of wealth—therichest 20 percent of the world’s population uses 55 percent of final,primary energy, while the poorest 20 percent uses only 5 percent.Exclusion from modern energy services is generally associated withpoverty and environmental degradation.
Although it is true that about two-thirds of the global population,or about 4 billion people, are now connected to electricity and thatgreat progress has been achieved, the challenge ahead is formidable;a simple calculation illustrates its magnitude. In addition to the 2 billion people today who still need to be connected to energy distribution or decentralised systems and endowed with sufficientpurchasing power to be able to afford modern energy services, twoto three times as many people are likely to be added to the globalpopulation during the new century. This means that 6–8 billion people would need to be provided with the access to affordable,clean, flexible, and convenient energy services during the 21st century, a number larger than the current world population. All scenarios considered here achieve this transition—to a varyingextent and through different energy system developments. Some of them do so while fulfilling some of the criteria of sustainable development as well (see the conclusion to this chapter).
In all three cases the structure of final energy develops towardsgreater flexibility, quality, and environmental compatibility, andenergy intensities improve steadily. To facilitate comparisons amongthe three cases, all share the same central demographic baselineassumption, in which global population grows to 10 billion peopleby 2050 and to nearly 11.7 billion by 2100. This is higher than thecurrent medium projections of about 10.4 billion in 2100 by theWorld Bank, United Nations, and IIASA (box 9.1). This means that6–8 billion additional people would achieve access to adequateenergy services in all three cases.
Economic development and equityEconomic development and growth are fundamental prerequisitesfor achieving an increase in living standards and equity in the world.It is therefore not surprising that assumptions about economicdevelopment are among the most important determinants of energyscenarios. At the same time, economic growth prospects are amongthe most uncertain determinants of scenarios.
Economic and social development has many dimensions, and anumber of indicators have been devised to assess progress and setbacks in human development. The United Nations DevelopmentProgramme defines development as the furthering of human choices(UNDP, 1997). Arguably, choices are only possible once basic human
BOX 9.1. DEMOGRAPHIC TRANSITION AND POPULATION GROWTH
Population is one of the driving forces of future energy requirements.Today there are three main sources of global population projections:the United Nations (UN, 1998), World Bank (Bos and Vu, 1994), andIIASA (Lutz, Sanderson, and Scherbov, 1997).
Most central population projections lead to a doubling of globalpopulation by 2100, to about 10 billion, compared with 5.3 billion in 1990. In recent years the central population projections for 2100have declined somewhat but are still in line with a doubling by 2100.For example, the latest UN (1998) medium-low and medium-highprojections indicate a range of between 7.2 and 14.6 billion peopleby 2100, with the medium scenario at 10.4 billion. The IIASA centralestimate for 2100 is also 10.4 billion, with 95 percent probabilitythat world population would exceed 6 billion and be lower than 17 billion (Lutz, Sanderson, and Scherbov, 1997).
Thus the population assumptions in the IIASA-WEC scenariosare higher (11.7 billion in comparison with 10.4 billion) but still consistent with recent population projections (see figure 9.3). Itshould be noted that the population projections used in most scenarios that describe sustainable development paths appear to have the same range as for all other scenarios in the literature.This implies that population policies are apparently not consideredappropriate for achieving sustainability, nor is energy seen as anappropriate instrument for achieving the population transition, atleast across most of the scenarios in the literature (see chapter 2).

needs for food, shelter, healthcare, and education have been met.Eradication of poverty is essential forachieving sustainability and humandevelopment in general. Beyond the satisfaction of basic needs, the issue of whatconstitutes development involves many cultural,social, and economic factors that inherently involve questions of values, preferences, and policies.
Income is not an end in itself, but rather a means of enablinghuman choices—or foreclosing them, in the case of poverty.Therefore per capita income (usually measured by per capita GDP)has been widely used to indicate the degree of economic development.In many instances this is closely correlated (as lead or lag indicator)with other indicators and dimensions of social development, suchas mortality, nutrition, and access to basic services.
Although future rates of economic development are highly uncertain, in all three cases of economic development consideredin the IIASA-WEC study, future economic and energy markets move to today’s developing countries. The rate and timing of thistransition varies across the three cases, but the overall direction ofchange is the same. Along with population growth, the economiccatch-up of developing to industrialised countries implies a long-term shift in the geographic focus of economic activities.
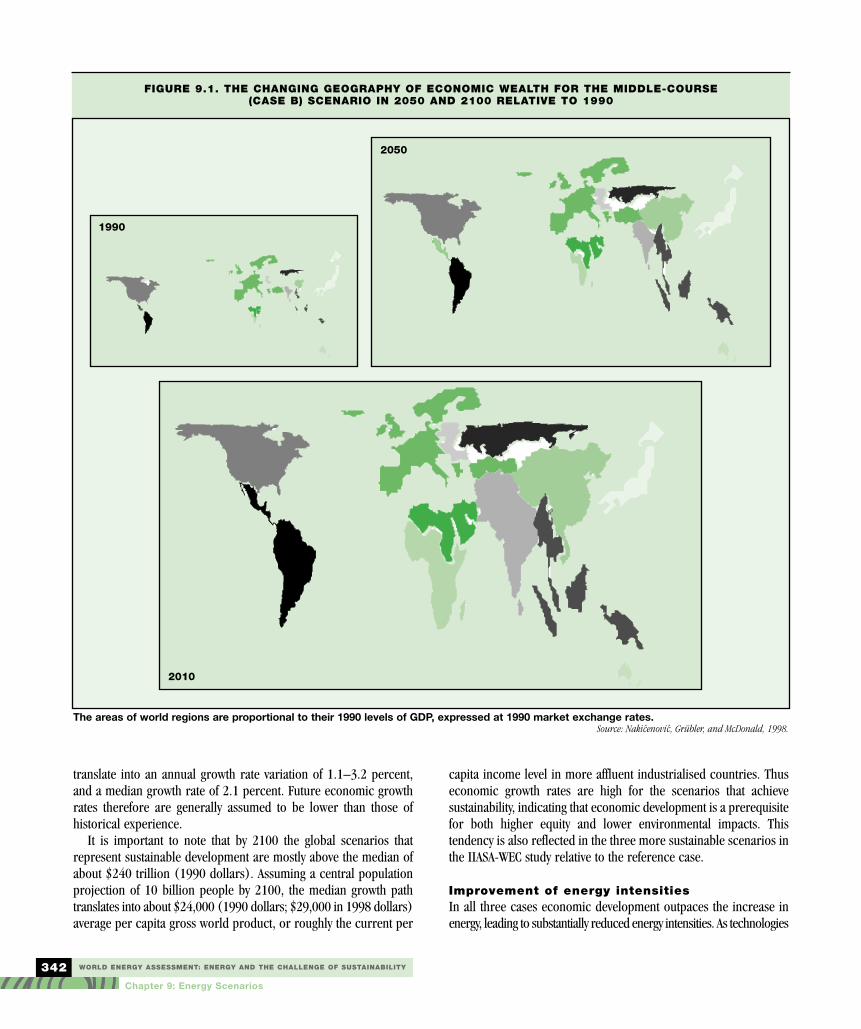
Currently the situation is fundamentally different. OECD countriesproduce and consume close to 80 percent of global economic output (measured by gross world product), while they account forless than 20 percent of global population. These disparities areillustrated in figure 9.1, which shows the size of 11 world regions inproportion to their 1990 GDP (at market exchange rates and 1990prices). In 1990 the economic map of the world was very differentfrom geographic maps (Mercartor projections)—it was highly distorted as a result of disparities among regions. Most developingregions were barely discernible relative to Japan, Western Europe,and North America. In figure 9.1, for example, compare the size ofJapan in 1990 with that of China or the Indian subcontinent.
For 2050 and 2100, the economic maps shown in figure 9.1 correspond to case B, the middle-course scenario of the IIASA-WECstudy that is the most cautious with respect to the speed of the developing world’s economic catch-up. Nonetheless, over the longterm economic maps begin to resemble the geographic maps withwhich all of us are familiar. This means two things. First, economiccatch-up, even in relative terms, is a century-long process and oneof the greatest human challenges. Some regions may forge ahead,but in the aggregate developing countries will require more than 50years to approach the income levels that OECD countries had in the1960s or 1970s. Second, with long-term development and catch-up(in relative but not absolute terms), economic, as well as energymarket, growth will be primarily in the developing world.
In figure 9.1, between 1990 and 2100 the world economy increasesin size 10 times, from $20 trillion to $200 trillion (1990 dollars; or$24 trillion to $240 trillion in 1998 dollars). This leads to more equitable
distribution of economic activitiesgeographically, but the gap in per
capita income remains very large.Therefore, in this scenario, in many parts
of the world local difficulties will persistand, despite rapid economic development, adequate
energy services may not be available to every citizeneven 100 years from now. Higher rates of economic development
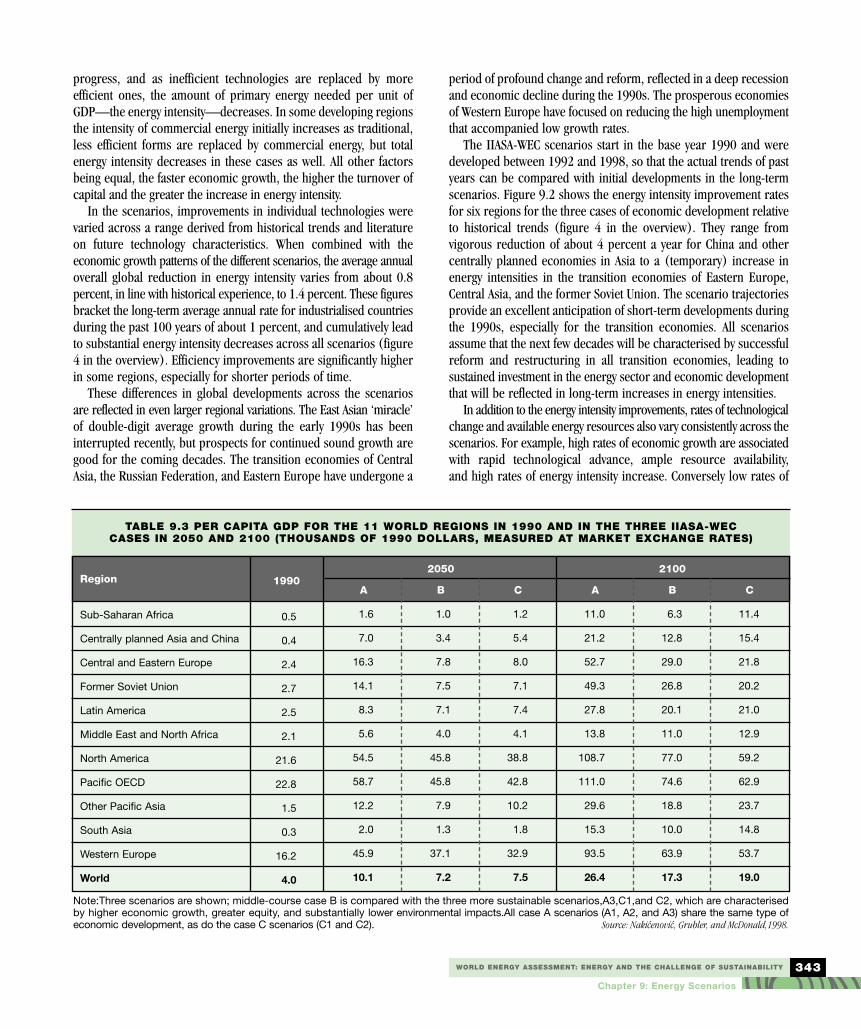
are required to narrow the gap more substantially.This is illustrated in table 9.3, which compares per capita income
for the three cases (A, B, and C) for the 11 world regions. Cases Aand C include the three more sustainable scenarios (A3, C1, andC2). The table shows that in case B only half of today’s developingregions will achieve the 1990 income levels of OECD countries by2100, whereas this is the case for most of the regions in the otherthree scenarios (A3, C1, and C2). The attainment of this higherdegree of economic catch-up is, however, fundamentally differentfor the three more sustainable scenarios. In A3 this is achieved primarily through economic growth that results from liberalisedmarkets, free trade, and high investment rates, whereas in C1 andC2 it is achieved through a substantial redistribution of wealth (fromindustrialised to developing countries and possibly from rich topoor) with a strong focus on maintaining environmental enmities.All three futures are more equitable than reference case B, leadingto much higher economic development in the world. Gross worldproduct increases by a factor of 11–15 in A3, C1, and C2, to$220–300 trillion (1990 dollars; $270–370 trillion in 1998 dollars) by 2100.
A comparison of these three cases of economic developmentshows considerable uncertainty about future per capita GDP growthrates and about the effectiveness of different policy measures inreducing the relative income gap between today’s industrialised anddeveloping countries. The range across the scenarios is consistentwith earlier reviews of economic growth assumptions for long-termscenarios by Nordhaus and Yohe (1983), Grübler (1994), Manneand Richels (1994), and Alcamo and others (1995). For instance,in the scenarios reviewed in Alcamo and others (1995), andGrübler (1994), per capita annual GDP growth rates typically are1–3 percent for 1990–2100. On the basis of an average per capitaincome of $4,000 in 1990, global per capita GDP could range from$10,000–100,000 by 2100. Such uncertainties become amplified byregional disparities, in particular future productivity growth indeveloping countries.
The great inherent uncertainty of future economic developmentprospects is reflected in the wide range of economic developmentpaths assumed in the scenarios from the literature. The further onelooks into the future, the higher is the uncertainty. By 2100 therange is between 3 (IS92c scenario, Pepper and others, 1992) and30 times (FUND/EMF, modeller’s choice scenario, Tol, 1995) the1990 level (Nakicenovic, Victor, and Morita, 1998). Thus the scenarios give a range of $60–$700 trillion, with a median of $240trillion (1990 dollars; $290 trillion in 1998 dollars). These figures
WORLD ENERGY ASSESSMENT: ENERGY AND THE CHALLENGE OF SUSTAINABILITY
Chapter 9: Energy Scenarios
341
The richest 20 percent of the world�s population uses 55 percent
of final, primary energy, while the poorest 20 percent uses
only 5 percent.
WORLD ENERGY ASSESSMENT: ENERGY AND THE CHALLENGE OF SUSTAINABILITY
Chapter 9: Energy Scenarios
342
translate into an annual growth rate variation of 1.1–3.2 percent,and a median growth rate of 2.1 percent. Future economic growthrates therefore are generally assumed to be lower than those of historical experience.
It is important to note that by 2100 the global scenarios that represent sustainable development are mostly above the median ofabout $240 trillion (1990 dollars). Assuming a central populationprojection of 10 billion people by 2100, the median growth pathtranslates into about $24,000 (1990 dollars; $29,000 in 1998 dollars)average per capita gross world product, or roughly the current per
capita income level in more affluent industrialised countries. Thuseconomic growth rates are high for the scenarios that achieve sustainability, indicating that economic development is a prerequisitefor both higher equity and lower environmental impacts. This tendency is also reflected in the three more sustainable scenarios inthe IIASA-WEC study relative to the reference case.
Improvement of energy intensitiesIn all three cases economic development outpaces the increase inenergy, leading to substantially reduced energy intensities. As technologies
FIGURE 9.1. THE CHANGING GEOGRAPHY OF ECONOMIC WEALTH FOR THE MIDDLE-COURSE (CASE B) SCENARIO IN 2050 AND 2100 RELATIVE TO 1990
The areas of world regions are proportional to their 1990 levels of GDP, expressed at 1990 market exchange rates. Source: Nakicenovic, Grübler, and McDonald, 1998.
1990
2050
2010
WORLD ENERGY ASSESSMENT: ENERGY AND THE CHALLENGE OF SUSTAINABILITY
Chapter 9: Energy Scenarios
343
progress, and as inefficient technologies are replaced by more efficient ones, the amount of primary energy needed per unit ofGDP—the energy intensity—decreases. In some developing regionsthe intensity of commercial energy initially increases as traditional,less efficient forms are replaced by commercial energy, but totalenergy intensity decreases in these cases as well. All other factorsbeing equal, the faster economic growth, the higher the turnover ofcapital and the greater the increase in energy intensity.
In the scenarios, improvements in individual technologies werevaried across a range derived from historical trends and literatureon future technology characteristics. When combined with the economic growth patterns of the different scenarios, the average annualoverall global reduction in energy intensity varies from about 0.8percent, in line with historical experience, to 1.4 percent. These figuresbracket the long-term average annual rate for industrialised countriesduring the past 100 years of about 1 percent, and cumulatively leadto substantial energy intensity decreases across all scenarios (figure4 in the overview). Efficiency improvements are significantly higherin some regions, especially for shorter periods of time.
These differences in global developments across the scenariosare reflected in even larger regional variations. The East Asian ‘miracle’of double-digit average growth during the early 1990s has beeninterrupted recently, but prospects for continued sound growth aregood for the coming decades. The transition economies of CentralAsia, the Russian Federation, and Eastern Europe have undergone a
period of profound change and reform, reflected in a deep recessionand economic decline during the 1990s. The prosperous economiesof Western Europe have focused on reducing the high unemploymentthat accompanied low growth rates.
The IIASA-WEC scenarios start in the base year 1990 and weredeveloped between 1992 and 1998, so that the actual trends of pastyears can be compared with initial developments in the long-termscenarios. Figure 9.2 shows the energy intensity improvement ratesfor six regions for the three cases of economic development relativeto historical trends (figure 4 in the overview). They range from vigorous reduction of about 4 percent a year for China and othercentrally planned economies in Asia to a (temporary) increase inenergy intensities in the transition economies of Eastern Europe,Central Asia, and the former Soviet Union. The scenario trajectoriesprovide an excellent anticipation of short-term developments duringthe 1990s, especially for the transition economies. All scenariosassume that the next few decades will be characterised by successfulreform and restructuring in all transition economies, leading to sustained investment in the energy sector and economic developmentthat will be reflected in long-term increases in energy intensities.
In addition to the energy intensity improvements, rates of technologicalchange and available energy resources also vary consistently across thescenarios. For example, high rates of economic growth are associatedwith rapid technological advance, ample resource availability, and high rates of energy intensity increase. Conversely low rates of
TABLE 9.3 PER CAPITA GDP FOR THE 11 WORLD REGIONS IN 1990 AND IN THE THREE IIASA-WEC CASES IN 2050 AND 2100 (THOUSANDS OF 1990 DOLLARS, MEASURED AT MARKET EXCHANGE RATES)
Region
Sub-Saharan Africa
Centrally planned Asia and China
Central and Eastern Europe
Former Soviet Union
Latin America
Middle East and North Africa
North America
Pacific OECD
Other Pacific Asia
South Asia
Western Europe
World
Note:Three scenarios are shown; middle-course case B is compared with the three more sustainable scenarios,A3,C1,and C2, which are characterisedby higher economic growth, greater equity, and substantially lower environmental impacts.All case A scenarios (A1, A2, and A3) share the same type ofeconomic development, as do the case C scenarios (C1 and C2). Source: Nakicenovic, Grubler, and McDonald,1998.
1990
0.5
0.4
2.4
2.7
2.5
2.1
21.6
22.8
1.5
0.3
16.2
4.0
A
1.6
7.0
16.3
14.1
8.3
5.6
54.5
58.7
12.2
2.0
45.9
10.1
2050
B
1.0
3.4
7.8
7.5
7.1
4.0
45.8
45.8
7.9
1.3
37.1
7.2
C
1.2
5.4
8.0
7.1
7.4
4.1
38.8
42.8
10.2
1.8
32.9
7.5
A
11.0
21.2
52.7
49.3
27.8
13.8
108.7
111.0
29.6
15.3
93.5
26.4
2100
B
6.3
12.8
29.0
26.8
20.1
11.0
77.0
74.6
18.8
10.0
63.9
17.3
C
11.4
15.4
21.8
20.2
21.0
12.9
59.2
62.9
23.7
14.8
53.7
19.0

WORLD ENERGY ASSESSMENT: ENERGY AND THE CHALLENGE OF SUSTAINABILITY
Chapter 9: Energy Scenarios
344
economic growth result in a more limited expansion of energyresources, lower rates of technological innovation in general, andlower rates of decrease in energy intensities.
Primary energy requirements and supplyFuture rates of economic development are among the most importantdeterminants of energy demand in the long term.2 The IIASA-WEC studyspans an increase in global energy needs in the range of 1.5–3 times by2050, and 2–5 times by 2100. Taken together, energy requirements areenvisaged to increase at lower rates than economic growth. This meansthat energy intensity is presumed to decline across all scenarios. By2100 it falls to between 80 and 20 percent of 1990 levels. This translatesinto annual declines of between 0.8 percent and more than 1.5 percent,with a median of about 1 percent. Thus the lowest future energyintensity improvements of 0.8 percent a year are in line with the historical experience of industrialised countries.
Figure 9.3 shows a wide range of alternative future primary energyrequirements for the three scenarios. The energy needs for referencecase B are in the middle, about tripling by 2100. This developmentis bracketed by the three more sustainable scenarios. A3 indicatessubstantially higher energy needs resulting from more rapid economic growth, despite much higher energy intensity. It nevertheless includes important characteristics of sustainabilitybecause it leads to a substantially higher degree of economic equity with lower environmental impacts at all scales. C1 (as well asC2) leads to the lowest energy requirements of all scenarios, toabout a doubling by 2100, resulting from efficiency improvementsand conservation; it is marked by a higher degree of economic equity and very low environmental impacts.
For comparison, figure 9.3 also shows the highest and lowestenergy demand trajectories from the literature (Morita and Lee, 1998).The range of future energy requirements across the scenarios is
FIGURE 9.2. PRIMARY ENERGY INTENSITIES FOR 6 REPRESENTATIVE REGIONS OUT OF THE 11 WORLD REGIONS, 1970–96, AND IN THREE CASES, 1990–2020
0
50
100
150
200
1970 1980 1990 2000 2010 2020
Source: Nakicenovic, Grübler, and McDonald, 1998.
Megajo
ule
s per
unit
of
GD
P i
n 1
990 d
olla
rs,
measu
red a
t m
ark
et
exc
hange r
ate
s
China and centrally planned Asia
Former Soviet Union
Central and Eastern Europe
North America
Pacific OECD
Western Europe

WORLD ENERGY ASSESSMENT: ENERGY AND THE CHALLENGE OF SUSTAINABILITY
Chapter 9: Energy Scenarios
345
indeed large, from a decline in the lowest scenario to an increase of10 times in the highest. In absolute terms, the increase by 2100 inprimary energy requirements—in comparison with 379 exajoulesin 1990—is expected to range from a moderate increase, to 500exajoules, to almost 3,200 exajoules. The highest energy requirementscorrespond to an annual growth rate of 2 percent, exactly in linewith historical experience (since 1850; see figure 9.3). Also in linewith historical experience, many scenarios project a growingdemand for fossil energy, even if relative shares might be decliningrelative to alternative sources of energy. This again emphasises theneed for continuing improvement in all energy efficiencies, includingclean fossil fuels. The three IIASA-WEC scenarios cover a significantpart of the full range of primary energy consumption spanned byother scenarios in the literature.
Finally, the inset in figure 9.3 shows the global population projectionscommon to all IIASA-WEC scenarios. C1 leads to roughly constantper capita primary energy consumption during the 21st century and
describes a transition towards more equity and lower environmentalimpacts. But it assumes implementation of challenging policies,such as world-wide energy and carbon taxes, that will change currentdevelopment trends. In contrast A3 leads to a higher increase—by 2.5times—in per capita energy requirements, but it shows that vigorousstructural change of the energy system towards decarbonisation canlead to low environmental impacts, even in conjunction with veryhigh levels of economic development and energy needs. The highrates of decarbonisation are, however, not sufficient to offsetincreased energy demand, so the total carbon emissions with A3 aresubstantially higher than those with C. Reference case B indicates energyneeds in the median range relative to the other two alternatives (Aand C) and the scenario literature in general, but it falls short of thetransitions described in the other three more sustainable alternatives.
Alternative structures of future energy systems are capable ofmeeting this growing demand for higher-quality energy end use andservices. Despite all the variations the scenarios look quite similar
FIGURE 9.3 GLOBAL PRIMARY ENERGY REQUIREMENTS, 1850–1990, AND IN THREE CASES, 1990–2100
The figure also shows the wide range of future energy requirements for other scenarios in the literature. The vertical line that spans the scenario range in 1990 indicates the uncertainty across the literature of base-year energy requirements. The insert shows global populationgrowth, 1850–2000, and projections to 2100. Source: Nakicenovic, Grübler, and McDonald, 1998; Morita and Lee, 1998; Nakicenovic, Victor, and Morita, 1998; Bos and Vu, 1994.
Exa
joule
s
Worl
d p
opula
tion (
bill
ions) A
B
C
2,000
1,600
1,200
800
400
0
12
10
8
6
4
2
01850 1900 1950 2000 2050 2100
1900 1950 2000 2050 21001850

WORLD ENERGY ASSESSMENT: ENERGY AND THE CHALLENGE OF SUSTAINABILITY
Chapter 9: Energy Scenarios
346
through 2020, and all still rely on fossil fuels. But after 2020 the scenarios diverge, and the energy transitions of the three more sustainable scenarios undergo a similar degree of structural changein the energy system.
The roles of different primary energy sources, which vary acrossthe six scenarios, contribute to this divergence. Some continue to befossil fuel intensive; others envisage stronger shifts towards alternativesources such as renewables or nuclear power. The geophysical
availability of energy resources is not a major constraint, even though currently estimated conventional oil and gas reserves would soon be depleted across most of the scenarios. Instead the availability of energy resources and the rates at which they areconverted into reserves are a function of the envisaged developmentstrategies in the scenarios. Part of the divergence in the structuresof energy systems depends on policy choices and developmentstrategies. For example, the two case C scenarios that assume strong
FIGURE 9.4. EVOLUTION OF PRIMARY ENERGY STRUCTURE: SHARES OF OIL AND GAS, COAL, AND NON-FOSSIL SOURCES (RENEWABLES AND NUCLEAR), 1850–2000, AND IN SIX SCENARIOS, 2000–2100
0%
0%
0%
20%
20%
20%
40%
40%
40%
60%
60%
60%
80%
80%
80%
100%
100%
100%
A3
C1, C2
A1
B
A2
2020
19901970
2020
2050
2050
20101920
1900
1850
Shares are measured against the grid lines with percentages shown on the three axes; see text for explanation of the figure.Source: Nakicenovic, Grübler, and McDonald, 1998.
Oil and gas
Coal Renewables and nuclear

WORLD ENERGY ASSESSMENT: ENERGY AND THE CHALLENGE OF SUSTAINABILITY
Chapter 9: Energy Scenarios
347
international cooperation focusedon environmental protection throughenergy and carbon taxes rely muchless on fossil fuel than do the other sce-narios. Figure 9.4 illustrates this long-termdivergence in the structures of energy systemsacross the scenarios.
Each corner of the triangle in figure 9.4 represents ahypothetical situation in which all primary energy is supplied by asingle energy source: oil and gas on the top, coal on the lower left,and renewables and nuclear energy on the lower right. Nuclearenergy and renewables are grouped together because they are inprinciple the non-fossil energy alternatives available in the longerterm. The illustration shows the historical development of the globalenergy system starting in the 1850s, when most primary energyneeds were met by traditional (renewable) sources of energy, suchas wood and animal power, which in some cases are still harnessedin an unsustainable manner—contributing to about 10 percent ofdeforestation and other adverse impacts (chapters 3, 5, and 7).
The first transition in the historical development of the globalenergy system, which lasted about 70 years, from 1850 to 1920,involved the substitution of coal for traditional energy sources. Theshare of traditional non-fossil energy sources declined from about80 to 20 percent during this period, while the share of coalincreased from 20 to more than 70 percent. The next transition hasalso lasted about 70 years, from 1920 to the present. It involves thesubstitution of oil and gas for coal. The share of coal has declinedto about 30 percent, while the share of oil and gas has increased toabout 50 percent.
Figure 9.4 illustrates alternative development paths in the structureof the energy system that might characterise the next transition.Scenarios branch out after 2020. Some become coal intensive, suchas reference case B and high-growth A2. Others are more renewableand nuclear intensive, such as the more sustainable A3 and ecologicallydriven C1 and C2. All the scenarios eventually lead to a partial shift fromfossil fuels to other sources of energy; however, they follow alternativedevelopment paths. As the paths spread out, they form divergingfuture developments. To some extent they are mutually exclusive.
Most of the divergence after 2020 will depend on technologicaldevelopments and industrial strategies implemented between nowand then. Which energy sources in 2020 will best match the moreflexible, more convenient, cleaner forms of energy desired by consumers? Which firms will have made the investments in researchand development that will give them a technological edge? Andwhich will have refocused their operations away from merely providing tonnes of coal or kilowatt-hours of electricity and towardsoffering better energy services to consumers?
The answers to these questions will be determined between nowand 2020. Near-term investment decisions and efforts in technologyresearch and development will determine which of the alternativedevelopment paths will dominate the post-2020 period. For example,the scenarios have the same assumptions about fossil and nuclear
energy resources and renewableenergy potentials (chapter 5). But
their use differs across the scenarios,and these differences tend to be amplified
after 2020. Because of the long lifetimes ofinfrastructure, power plants, refineries, and other
energy investments, there will not be a sufficientlylarge turnover of such facilities to reveal large differences in
the scenarios before 2020. But the seeds of the post-2020 world willhave been sown by then. Figure 9.4 illustrates that the achievementof a more sustainably structured energy system should be seen as acumulative, evolutionary process: It needs to be initiated early toallow for the long time constants required for fundamental transitions,such as a shift to cleaner fossil fuels, renewables, and possiblynuclear energy.
Long-term global energy futures are no longer seen as being geologically preordained. The imminent resource scarcity forecastin the 1970s did not materialise. With continued exploration effortsand technological progress, accessible and affordable reserves haveincreased, and this trend is likely to continue. After 2020 all scenarios move away from their current reliance on conventionaloil and gas. As mentioned, the currently estimated conventional oiland gas reserves do not reach much into the post-2020 periods in any of the scenarios (chapter 5). This transition progresses relatively slowly in scenario A1, where oil and gas are plentiful. Inthe more sustainable scenarios, A3, C1 and C2, it progresses morerapidly because of faster technological progress towards cleanerfossil energy systems (A3) or because energy and environmentalpolicies favour non-fossil alternatives (C1 and C2).
An ecologically driven clean-fossil version of case C is also conceivable. Such a third C variant (C3) would incorporate most ofthe environmentally compatible fossil energy conversion systemtogether with decarbonisation and carbon removal and storage. Butsuch a scenario was not developed, for two reasons. First, A3already includes clean and efficient fossil energy technologies, alongwith some carbon removal and its use for enhanced oil recovery.Thus limited carbon removal and sequestration occur for economicreasons and are competitive with other options for enhanced oilrecovery. But additional carbon removal, although technically possible,is expensive and thus would require introducing carbon taxes oremissions limits. In A3 cumulative carbon emissions are about1,000 gigatonnes for 1990–2100. Thus that amount of carbon—about 50 percent more than now in the atmosphere—would needto be stored. Disposal in geological reservoirs is possible; however,the amounts involved are gigantic, and affordable disposal and storagesystems still need to be developed (chapter 8). Second, the advantageof an ecologically driven clean-fossil version of case C would basicallybe very similar to A3 but would have the advantage of requiring storageof much less carbon, but still a very large amount, comparable tothe current carbon dioxide in the atmosphere.
In scenario A2 and reference case B, the transition away from oiland gas includes an important contribution from coal, whose long-
The achievement of a more sustainablystructured energy system needs to be initiated early to allow for the long
time constants required for fundamental transitions
to cleaner fuels.
WORLD ENERGY ASSESSMENT: ENERGY AND THE CHALLENGE OF SUSTAINABILITY
Chapter 9: Energy Scenarios
348
term market share after 2050 is20–40 percent. Nonetheless little ofthis coal is used directly. Instead it isconverted to high-quality energy carriers(electricity, liquids, and gases) demandedby high-income consumers after 2050. Thusvery different resource and technological optionscan be drawn upon to meet the cleaner energy beingdemanded by more and more affluent consumers world-wide.
Technological dynamics and structural changeTechnology is the key determinant of economic development and isessential for raising standards of living and for easing humanity’sburden on the environment (Grübler, 1998b). Because technologicalprogress is based on human ingenuity, it is thus a human-maderesource that is renewable—as long as it is nurtured. But this nurture has a price. Innovation, especially the commercialisation ofnovel technologies and processes, requires continual investments ofeffort and money in research, development, and demonstration(RD&D). Technology diffusion, in turn, depends on both RD&D andlearning by doing. Some advanced technologies important in thescenarios—such as hydrogen production, distribution, and enduse—would be radical innovations that are not likely to result fromincremental improvement of current technologies. And withoutinvestment and experience, there can be no long-term technologicalimprovement, either through incremental or radical change.
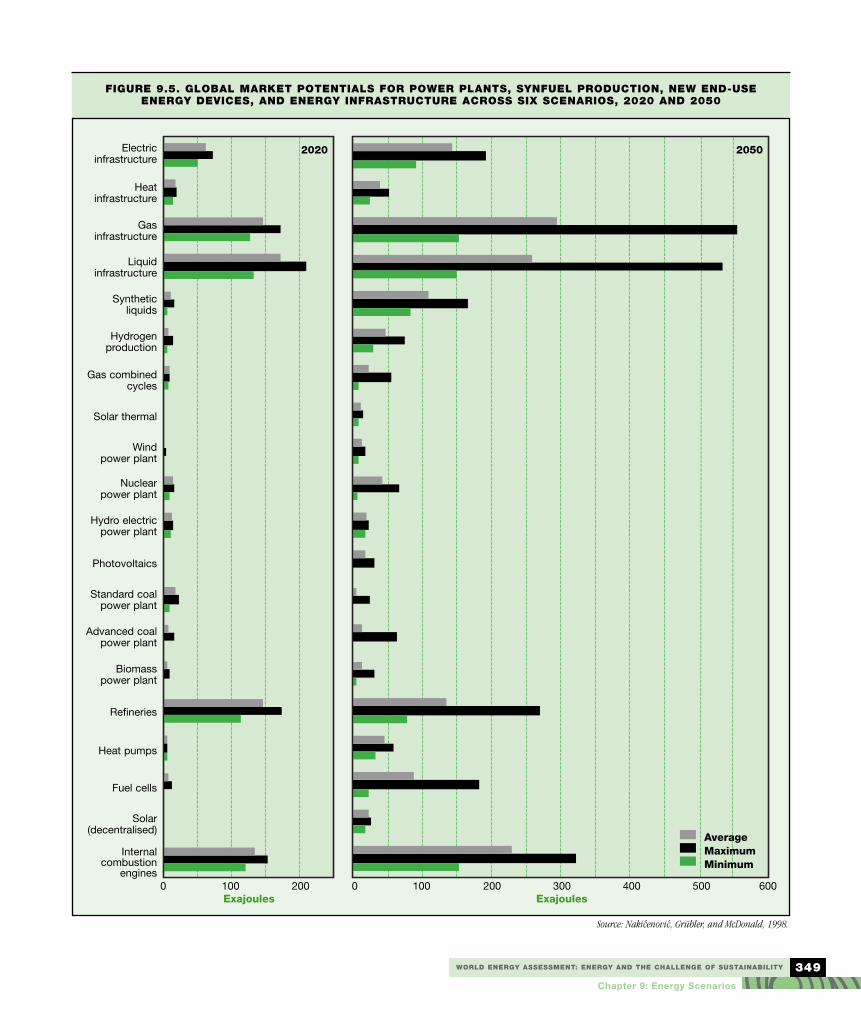
Innovation and technology diffusion require both that opportunitiesare perceived and that the entrepreneurial spirit exists to pursuethem. Long-term scenarios cannot forecast future technological‘winners’ or ‘losers’, but they can indicate areas of technologicalopportunity. Figure 9.5 illustrates the global market potential in theIIASA-WEC scenarios for four classes of energy technologies: newend-use energy devices (efficient lighting, heat pumps), powerplants, synfuel production (from biomass, coal, and natural gas),and energy transport, transmission, and distribution infrastructure.For each of the four classes of technologies, the minimum, maximum,and average market potential for the six scenarios are shown in2020, 2050, and 2100.
Across the wide variation in possible energy developmentsdepicted in the scenarios, the importance of energy infrastructuregrows persistently. Even in the sustainable, low-demand scenarios of case C (C1 and C2), energy infrastructure delivers at least 400 exajoules a year by 2050. By the end of the century it averages800 exajoules a year across all scenarios, reaching close to 1,600exajoules a year in the highest scenarios. The markets for powersector technologies also grow substantially, with a wide spreadbetween the maximum and minimum scenarios. By 2050 the annualrange is 120–560 exajoules (energy delivered). Part of this spreadis due to uncertainties about demand growth, but part arises fromenergy end-use innovations in the form of new, on-site decentralisedelectricity generation technologies, such as photovoltaics or fuel cells.The potential for decentralised systems in the long term outgrows
that of the power sector. The mostimportant customers for energy
technologies would no longer be alimited number of utility managers but
rather millions of energy consumers world-wide. Synfuels also emerge in the long term as
a major technology market. An orderly transitionaway from conventional oil and gas translates into large
technology markets for synliquids, syngas—and, in the long term,increasing shares of hydrogen produced from both fossil fuels (coaland natural gas) and renewables (biomass). By 2100 the globalsynfuels market could be at least 160 exajoules a year, comparableto the current global oil market.
As noted above, technological progress has a price—it requirescontinual investment in RD&D. All the technological improvementsin the scenarios that are reflected in the expansion of all technologycategories shown in figure 9.5 presume steady RD&D investment.Given the importance of strategic investment in RD&D, it is a cause forconcern that energy-related RD&D expenditures are currently decliningin most OECD countries. Evidently upfront RD&D expenditures areincreasingly viewed as too expensive in markets where maximisingshort-term shareholder value takes precedence over longer-termsocioeconomic development and environmental protection.
The important conclusion from this analysis of IIASA-WEC scenariosis that far-reaching technological improvements (chapters 6–8) arecentral to the transition towards sustainable development and thusneed to be developed and disseminated throughout the energy system—including to decentralised systems and end users. Perhapsthis is not surprising because end use is the least efficient part of thewhole energy system. These possible developments have two importantimplications. First, they weaken the argument for extensive RD&Dinvestment in large, sophisticated, ‘lumpy’, inflexible technologiessuch as fusion power and centralised solar thermal power plants.Improvements in end-use technologies, through which millions,rather than hundreds, of units are produced and used, are moreamenable to standardisation, modularisation, and mass production,and hence to benefit from learning-curve effects (resulting in costreductions and performance improvements). Second, institutionalarrangements governing final energy use and supply are critical. Thederegulation, reregulation, and liberalisation of electricity marketscan create incentives in this direction; service packages can be tailoredto various consumer preferences, especially because traditionalconsumers can sell electricity back to the grid. But liberalisationcould discourage long-term RD&D by emphasising short-term profits.
The structure of final energy requirementsIn virtually all energy scenarios in the literature, economic growthoutpaces the increase in energy consumption, leading to substantialreductions in energy intensities and efficiencies. This is to a largeextent due to technological change and structural changes towardsless materials-intensive, more knowledge-intensive activities. Asindividual technologies are developed and enter the marketplace,
Long-term scenarios cannot forecast future technological �winners�
or �losers�, but they can indicate areas of technological
opportunity.
WORLD ENERGY ASSESSMENT: ENERGY AND THE CHALLENGE OF SUSTAINABILITY
Chapter 9: Energy Scenarios
349
FIGURE 9.5. GLOBAL MARKET POTENTIALS FOR POWER PLANTS, SYNFUEL PRODUCTION, NEW END-USE ENERGY DEVICES, AND ENERGY INFRASTRUCTURE ACROSS SIX SCENARIOS, 2020 AND 2050
Source: Nakicenovic, Grübler, and McDonald, 1998.
0 100 200 0 100 200 300 400 500 600
Electric infrastructure
Heatinfrastructure
Gasinfrastructure
Liquidinfrastructure
Synthetic liquids
Hydrogen production
Gas combinedcycles
Solar thermal
Wind power plant
Nuclear power plant
Hydro electricpower plant
Photovoltaics
Standard coalpower plant
Advanced coalpower plant
Biomass power plant
Refineries
Heat pumps
Fuel cells
Solar (decentralised)
Internal combustion
engines
Exajoules Exajoules
2020 2050
AverageMaximumMinimum

WORLD ENERGY ASSESSMENT: ENERGY AND THE CHALLENGE OF SUSTAINABILITY
Chapter 9: Energy Scenarios
350
inefficient technologies are replaced by more efficient ones, and thestructure of the energy-supply system and patterns of energy serviceschange. These factors reduce the amount of primary energy neededper unit of final energy delivered to end users, as well as final energyper unit energy service. With all other factors being equal, the fastereconomic growth, the higher the rate of technological change, thehigher the turnover of capital, and the greater the decline in energyintensity and improvement of energy efficiency. These long-termrelationships between energy efficiency and economic developmentare reflected in the majority of scenarios in the literature and areconsistent with historical experience across a range of alternativedevelopment paths in different countries.
The scenarios cover a wide range of energy supply possibilities tomeet growing energy requirements, from a tremendous expansionof coal production to strict limits on it, from a phase-out of nuclearenergy to a substantial increase in its use. Yet all the variationsexplored in the alternative scenarios match the continuing need formore flexible, more convenient, cleaner forms of energy. This
means that all energy is increasingly converted into quality carrierssuch as electricity, liquids, and energy gases. For example, the directend use of solids by final consumers disappears by 2050. Solidenergy sources are more and more converted into liquids and gird-oriented energy carriers such as energy gases and electricity.
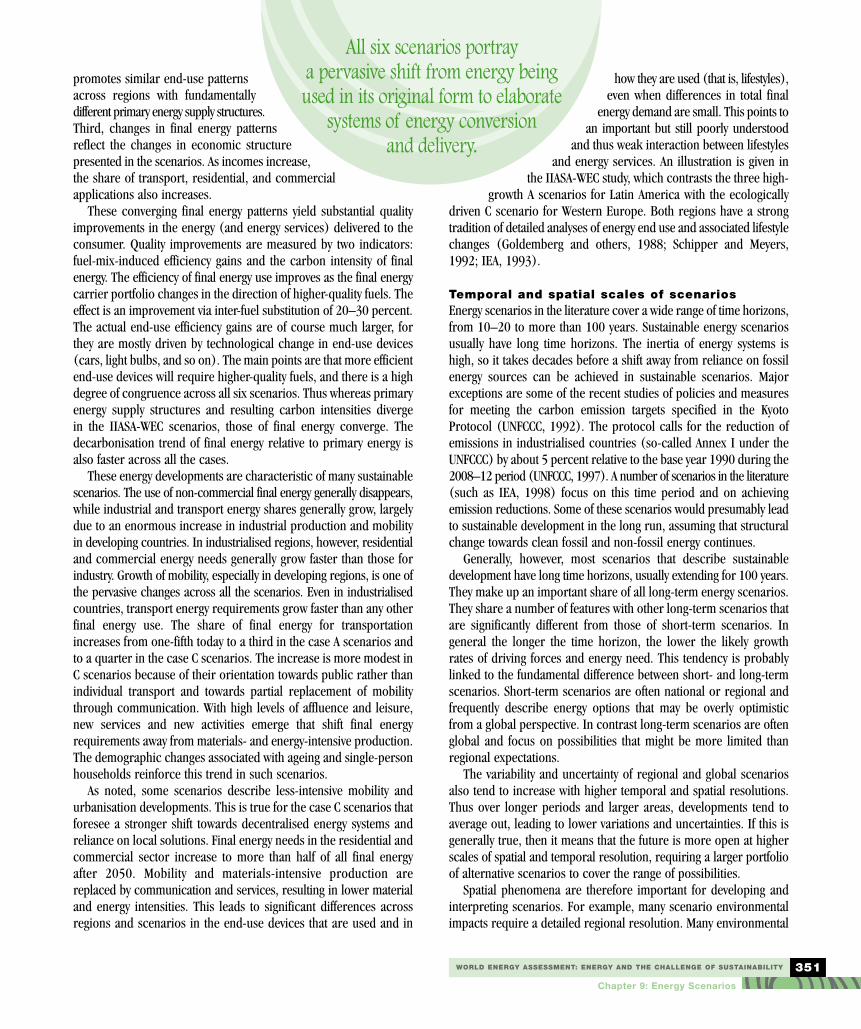
Thus despite all the variations in major driving forces of energyend use across a wide range of scenarios, the pattern of final energyuse is remarkably consistent across many scenarios that describesustainable energy development. Figure 9.6 illustrates the convergencein the structure of final energy for the IIASA-WEC scenarios.
As shown in figure 9.6, all six scenarios portray a pervasive shiftfrom energy being used in its original form, such as traditionaldirect uses of coal and biomass, to elaborate systems of energy conversion and delivery. This shift continues in all cases, leading toever more sophisticated energy systems and higher-quality energycarriers. A second profound transformation is the increasing deliveryof energy by dedicated transport infrastructure, such as pipelines andelectric networks. This development enhances trade possibilities and
FIGURE 9.6 GLOBAL FINAL ENERGY SHARES BY FORM IN THREE CASES
Solids include direct delivery to end users. Overlapping areas indicate variations across the cases. Source: Nakicenovic, Grübler, and McDonald, 1998.
2000 2050 2100
100
90
80
70
60
50
40
30
20
10
0
Case ACase BCase C
Grids (gas, electricity, district heating, hydrogen)
Liquids (oil products, synthetic fuels such as methanol and ethanol)
Solids (coal, biomass)
Perc
ent
WORLD ENERGY ASSESSMENT: ENERGY AND THE CHALLENGE OF SUSTAINABILITY
Chapter 9: Energy Scenarios
351
promotes similar end-use patternsacross regions with fundamentallydifferent primary energy supply structures.Third, changes in final energy patternsreflect the changes in economic structurepresented in the scenarios. As incomes increase,the share of transport, residential, and commercialapplications also increases.
These converging final energy patterns yield substantial qualityimprovements in the energy (and energy services) delivered to theconsumer. Quality improvements are measured by two indicators:fuel-mix-induced efficiency gains and the carbon intensity of finalenergy. The efficiency of final energy use improves as the final energycarrier portfolio changes in the direction of higher-quality fuels. Theeffect is an improvement via inter-fuel substitution of 20–30 percent.The actual end-use efficiency gains are of course much larger, forthey are mostly driven by technological change in end-use devices(cars, light bulbs, and so on). The main points are that more efficientend-use devices will require higher-quality fuels, and there is a highdegree of congruence across all six scenarios. Thus whereas primaryenergy supply structures and resulting carbon intensities diverge in the IIASA-WEC scenarios, those of final energy converge. Thedecarbonisation trend of final energy relative to primary energy isalso faster across all the cases.
These energy developments are characteristic of many sustainablescenarios. The use of non-commercial final energy generally disappears,while industrial and transport energy shares generally grow, largelydue to an enormous increase in industrial production and mobilityin developing countries. In industrialised regions, however, residentialand commercial energy needs generally grow faster than those forindustry. Growth of mobility, especially in developing regions, is one ofthe pervasive changes across all the scenarios. Even in industrialisedcountries, transport energy requirements grow faster than any otherfinal energy use. The share of final energy for transportationincreases from one-fifth today to a third in the case A scenarios andto a quarter in the case C scenarios. The increase is more modest inC scenarios because of their orientation towards public rather thanindividual transport and towards partial replacement of mobilitythrough communication. With high levels of affluence and leisure,new services and new activities emerge that shift final energyrequirements away from materials- and energy-intensive production.The demographic changes associated with ageing and single-personhouseholds reinforce this trend in such scenarios.
As noted, some scenarios describe less-intensive mobility andurbanisation developments. This is true for the case C scenarios thatforesee a stronger shift towards decentralised energy systems andreliance on local solutions. Final energy needs in the residential andcommercial sector increase to more than half of all final energyafter 2050. Mobility and materials-intensive production arereplaced by communication and services, resulting in lower materialand energy intensities. This leads to significant differences acrossregions and scenarios in the end-use devices that are used and in
how they are used (that is, lifestyles),even when differences in total final
energy demand are small. This points toan important but still poorly understood
and thus weak interaction between lifestylesand energy services. An illustration is given in
the IIASA-WEC study, which contrasts the three high-growth A scenarios for Latin America with the ecologically
driven C scenario for Western Europe. Both regions have a strongtradition of detailed analyses of energy end use and associated lifestylechanges (Goldemberg and others, 1988; Schipper and Meyers,1992; IEA, 1993).
Temporal and spatial scales of scenariosEnergy scenarios in the literature cover a wide range of time horizons,from 10–20 to more than 100 years. Sustainable energy scenariosusually have long time horizons. The inertia of energy systems ishigh, so it takes decades before a shift away from reliance on fossilenergy sources can be achieved in sustainable scenarios. Majorexceptions are some of the recent studies of policies and measuresfor meeting the carbon emission targets specified in the KyotoProtocol (UNFCCC, 1992). The protocol calls for the reduction ofemissions in industrialised countries (so-called Annex I under theUNFCCC) by about 5 percent relative to the base year 1990 during the2008–12 period (UNFCCC, 1997). A number of scenarios in the literature(such as IEA, 1998) focus on this time period and on achievingemission reductions. Some of these scenarios would presumably leadto sustainable development in the long run, assuming that structuralchange towards clean fossil and non-fossil energy continues.
Generally, however, most scenarios that describe sustainabledevelopment have long time horizons, usually extending for 100 years.They make up an important share of all long-term energy scenarios.They share a number of features with other long-term scenarios thatare significantly different from those of short-term scenarios. Ingeneral the longer the time horizon, the lower the likely growthrates of driving forces and energy need. This tendency is probablylinked to the fundamental difference between short- and long-termscenarios. Short-term scenarios are often national or regional andfrequently describe energy options that may be overly optimisticfrom a global perspective. In contrast long-term scenarios are oftenglobal and focus on possibilities that might be more limited thanregional expectations.
The variability and uncertainty of regional and global scenariosalso tend to increase with higher temporal and spatial resolutions.Thus over longer periods and larger areas, developments tend toaverage out, leading to lower variations and uncertainties. If this isgenerally true, then it means that the future is more open at higherscales of spatial and temporal resolution, requiring a larger portfolioof alternative scenarios to cover the range of possibilities.
Spatial phenomena are therefore important for developing andinterpreting scenarios. For example, many scenario environmentalimpacts require a detailed regional resolution. Many environmental
All six scenarios portray a pervasive shift from energy being used in its original form to elaborate
systems of energy conversion and delivery.

WORLD ENERGY ASSESSMENT: ENERGY AND THE CHALLENGE OF SUSTAINABILITY
Chapter 9: Energy Scenarios
352
phenomena require that scenario driving forces, energy use, andemissions be gridded with a very high spatial resolution. Very fewscenarios and modelling approaches are based on a fine geographicscale. Thus, for a number of reasons, national or regional spatialscales are not always ideal for energy scenarios. But such scenariosare rare due to many unresolved methodological issues. With currentmethodological approaches, energy-related spatial phenomena aremore difficult to capture on the global scale than evolution in time.
There are, of course, exceptions. Recent scenarios by Sørensen,Kuemmel, and Meibom (1999) have high geographic resolution fordriving forces as well as energy use patterns (box 9.2). The scenarioshighlight the uneven geographic distribution of economic activities,resources, and energy patterns—and also bring new insights intoenergy trade implications, energy infrastructure, and transport. Forexample, the scenarios that rely on clean fossil fuel and safe nuclearenergy options entail trade and transmission of energy in much thesame pattern as today. This situation has important implications foreconomic development in energy-importing countries that may havelower economic growth relative to other scenarios with more self-sufficient domestic provision of energy. The scenarios demonstratethat focusing on decentralised, renewable energy sources with low energydensities would make it difficult to match energy demand growth insome parts of the world by 2050. In contrast scenarios that also rely oncentrally produced renewable energy create supply in excess of demandand through trade foster robust energy systems and low adverseenvironmental impacts (Sørensen, Kuemmel, and Meibom, 1999).
The legacy of past generationsEnergy scenarios explore the future and rarely look at the past. Butthe dynamics of history matter for future developments. This is especiallyrelevant to scenarios that achieve sustainability for future generations.Equity often plays an important role in such considerations.
This is in stark contrast to our common history. Both in the pastand today, a small minority of the global population accounts formost economic activity, materials use, and mobility, just to mentiona few driving forces of energy use. Thus most energy is consumedby a relatively small, affluent part of the global population that livesin industrialised countries; this 20 percent of the population enjoysabout 80 percent of gross world product (see figure 9.1) and morethan 60 percent of global energy consumption. Historically, today’saffluent part of the global population has consumed about 80 percent of fossil energy. Its many benefits from this consumptioninclude enormous economic development. But many of the adverse environmental and other impacts of this cumulative energy consumption have been shared with the rest of the world.
Most sustainable energy scenarios envisage a fundamentalchange in the future from today’s inequitable distribution of benefits and adverse impacts. The scenarios use various methods to implement policies to move global development towards sustainability.For example, the IIASA-WEC case C scenarios assume revenue-neutralenergy and carbon dioxide taxes whose proceeds enhance internationalcollaboration and resource transfers from industrialised to developingregions. This situation may appear unrealistic from the current
BOX 9.2. SPATIAL SCENARIO OF ENERGY END USE
Sørensen, Kuemmel, and Meibom (1999) give an example of an energy scenario thatemphasises demand-side management, highlevels of energy efficiency, and conservationwhile attaining high levels of global prosperity.It assumes that average energy technologyefficiency in 2050 will correspond to the bestcurrent rates. This results in total global energyend-use demand of about 220 exajoules in2050. The scenario is thus characterised byrelatively low energy requirements relative tothe increase in per capita energy use. Theenergy available to the end user today is onlyabout 12 percent of primary energy, and thechallenge is to increase this fraction. Theresulting energy requirements are roughly half those in the IIASA-WEC case C scenarios.Population assumptions are about the same.Sørensen, Kuemmel, and Meibom (1999) base their scenario on UN median populationprojections (UN, 1996) and UN increasingurbanisation estimates (UN, 1997).
A unique feature of the scenario is a veryhigh geographic resolution (using the middlescenario of UN, 1996), increasing urbanisation(UN, 1997), and an increase from today’s percapita energy use by an average factor of 2.7. GNP growth is larger because of the
de-coupling of economic and energy growth,and the distribution of this growth acrossregions is not even (because a higher growth
rate is assumed for today’s poor regions).Figure below shows the ‘gridded’ total energydelivered to end users in 2050.
Scenario of total energy delivered to end users, 2050
Note: Includes energy for air conditioning, process heat, stationary mechanical energy, electricenergy, energy for transportation, and energy in food. The average energy demand is about 23gigajoules per capita, or three times the amount made useful at the end use today.
Source: Sørensen, Juemmel, and Meibom, 1999.
Energy flow (watts per square metre)■ 5.0000–10■ 2.0000–5.0000■ 1.0000–2.0000■ 0.5000–1.0000■ 0.2000–0.5000■ 0.1000–0.2000■ 0.0500–0.1000■ 0.0200–0.0500■ 0.0100–0.0200■ 0.0050–0.0100■ 0.0020–0.0050■ 0.0001–0.0020■ All others

WORLD ENERGY ASSESSMENT: ENERGY AND THE CHALLENGE OF SUSTAINABILITY
Chapter 9: Energy Scenarios
353
perspective, but it was necessary toachieve both rapid development of poor regions and environmental protection. Another example is the so-called B1 family of sustainable scenarios(developed by different modelling approaches)for the IPCC Special Report on Emissions Scenarios(Nakicenovic and others, 2000) that all achieve equity througha host of policy and behavioural changes in the world, along withimprovements of environmental compatibility at all scales (De Vriesand others, 2000). Thus sustainable energy scenarios require challenging changes.
The role of policiesSustainable energy scenarios usually assume or imply a host ofmeasures to achieve their goals, from a transition from fossil energysources to adoption of environmentally friendly behaviour patterns.The policies include market-based and regulatory mechanisms aswell as assumed changes in human behaviour (chapter 12).Regulatory standards, taxes, and emissions trading schemes arecomparatively easy to implement in scenarios developed using formal models. But it is much more difficult to determine whatmeasures would be required to achieve the behavioural and institutional changes called for in such scenarios. One examplefrom recent IPCC scenarios is given here for illustrative purposes(Nakicenovic and others, 2000).
The IPCC B1 scenario family includes many characteristics ofsustainable development. Its storyline or narrative description calls for extensive changes (for further details see the Website athttp://sres.ciesin.org; http://www.ipcc.ch; http://www.iiasa.ac.at/Research/TNT/Draft/Publications/publications.html; De Vries and others, 2000;Nakicenovic and others, 2000; and Nakicenovic, 2000). The storylineassumes a high level of environmental consciousness and institutionaleffectiveness. Consequently environmental quality is high becausemost of the potentially negative environmental aspects of rapiddevelopment are anticipated and dealt with effectively at local,national, and international levels. For example, transboundary airpollution (acid rain) is basically eliminated in the long term. Landuse is carefully managed to counteract the impacts of activities thatcould damage the environment. Cities are compact and designed forpublic and non-motorised transport, and suburban developments aretightly controlled. Strong incentives for low-input, low-impact agriculture,along with maintenance of large areas of wilderness, contribute tohigh food prices with much lower levels of meat consumption.
These proactive local and regional environmental measures andpolicies also lead to relatively low energy requirements and lowemissions, even in the absence of explicit interventions directed atconserving energy or mitigating climate change. The IPCC B1 worldinvests a large part of its gains in more efficient resource use(‘dematerialisation’), greater equity, stronger social institutions,and increased environmental protection. A strong welfare net preventssocial exclusion on the basis of poverty. But the storyline also considers
that counter-currents may develop,and in some places people may
not conform to the main social andenvironmental intentions of the main-
stream in this scenario family. Massiveincome redistribution and presumably high
taxes may adversely affect the functioning of worldmarkets. Environmental protection could become an issue in
some parts of the world. This all illustrates how achieving sustainabledevelopment is a very difficult task—even in scenarios—as newpolicies play out in relation to other driving forces.
Other examples of strong policies can be seen in nearly all sustainable development scenarios. The “Transformed World” ofHammond (1998), based on the “Great Transitions” of Gallopin andothers (1997), stresses the role of global technological innovationin addition to enlightened corporate actions, government policies,and empowerment of local groups. In the “Shared Space” of theMillennium Institute (Glenn and Gordon, 1997), resources are sharedmore equitably for the benefit of all and the safety of humanity. TheShell “Sustainable World” (1996, 1998) and the WBCSD (1998)“Geopolity” and “Jazz” also examine sustainable futures.
Implications of sustainable energy scenariosThe divergence among the three cases described in this chapterreflects different assumptions for a number of driving forces offuture development, such as demographic changes and economicgrowth. Assumptions about future technological change are themost important determinants of how the scenarios unfold. Theseassumptions include the effectiveness of RD&D and the direction andrate of technological diffusion (including lock-in effects and learningcurves). Future capital investments and financing are also crucialdeterminants of future energy development, as are global energy tradepatterns. Finally the impact of environmental changes at local, regional,and global levels will also drive change and energy developments.
RD&D trends and requirements and technological diffusionThe development of clean, efficient, affordable, reliable energy systemsis a common characteristic of most sustainable energy scenarios. Animportant prerequisite for such future technology developments issufficient investment in RD&D. But this alone is not a guarantee forsuccess. Radically new technologies need to be introduced into themarketplace and (if successful) need to be pervasively diffused tocontribute to sustainability. Incremental improvement of existingtechnologies is likely to fall short of changing technoeconomic paradigms, as is foreseen in the three scenarios characterised bysustainability. In fact, all these scenarios rely on pervasive diffusion,over a long time period, of new technoeconomic systems in theenergy system—from a combination of advanced, highly efficientenergy extractions, to conversion and end-use technologies, to new,clean energy carriers such as hydrogen.
Most sustainable energy scenarios envisage a fundamental change in the
future from today�s inequitable distribution of benefits and
adverse impacts.

WORLD ENERGY ASSESSMENT: ENERGY AND THE CHALLENGE OF SUSTAINABILITY
Chapter 9: Energy Scenarios
354
These technology needs forachieving sustainability are in starkcontrast to recent developments. RD&Defforts have increased substantially inmost OECD countries. But energy-relatedRD&D has declined in all of them except Japanand Switzerland. In share of GDP, energy-relatedefforts may have declined by as much as 10 percent a yearon average in OECD countries. It has been argued that this declinein public RD&D funding is more than compensated for by private sources as a consequence of recent energy privatisation andliberalisation. But the tentative evidence indicates that this is notnecessarily true for investments in radical new technologies, andthat private-sector energy RD&D focuses more on incrementallyimproving technologies and may be declining. For example, privateenergy-related RD&D has fallen by nearly a third in the United Statesduring the past five years, while RD&D in other sectors hasincreased (chapter 12).
Finally, it has been claimed that the deployment of new energytechnologies has occurred at an unprecedented rate in recent yearsdespite the declines in RD&D funding. This is supposed to indicatethat there are plenty of funds available for attractive new technologies.Perhaps this is true, but many of the energy technologies that havebeen deployed successfully in recent years—from combined-cyclegas turbine to horizontal drilling—were developed long ago, whenRD&D funding was plentiful. There also have been importantspillovers from other sectors; for example, the development of gasturbines benefited from enormous progress on both military andcivilian jet engines. But new competitive pressures have probablycontributed to price declines and wide diffusion of these technologies.
A strong conclusion for a whole range of sustainable scenarios isthat a substantial increase in RD&D for new energy technologies isneeded. Otherwise most clean, efficient fossil and renewable technologiesmay not reach competitiveness with traditional options. Significantimprovements in these technologies are required as traditionaltechnologies improve as well. This is not, however, an appeal toreturn to the types of exclusively public expenditure programs onenergy RD&D of past decades. The paradigm has shifted nowtowards a balance between publicly and privately funded basicresearch and towards far more reliance on incentives to promoteprivate RD&D and market applications, for example through tax andregulatory incentives for innovation.
These kinds of advances in knowledge and technology are likelyto be as important for achieving a sustainable future as they were forexplaining the productivity growth in today’s industrialised countries.In the original study by Solow (1956) it was estimated that 87 percentof per capita productivity growth was due to technological change(the remainder was attributed to increases in capital inputs). Thecontribution of technical progress to pollution abatement is evengreater: as the chapters on energy technology (7 and 8) and theeconomy (11) show, innovations in pollution control can often cutemissions by 95 percent, and potentially completely in some cases.
Advances in knowledge thus donot simply contribute to economic
development in general but also helpachieve a higher degree of affluence,
equity, and environmental compatibility.Economic growth theory suggests that
different capital and labour productivities acrosscountries lead to different productivity growth rates and
hence to conditional convergence across economies. As Rostow(1990) explained, the “poor get richer and the rich slow down”.This relative convergence of the poor and rich stems from theassumption of diminishing returns on capital. Additional convergencepotentials may accrue for economies with a higher ratio of humanto physical capital. In terms of a functional relationship for futuredevelopments, therefore, per capita GDP growth rates are expected(all other things being equal) to be higher for economies with lowper capita GDP levels. Notwithstanding many frustrating setbackslike the recent ‘lost decade’ for economic catch-up in Africa andLatin America, empirical data indicate that the convergence theoremholds. The evidence put forward by Barro (1997) and Barro and Sala-I-Martin (1995), based on the experience of some 100countries in 1960–85, shows per capita GDP growth rates as a function of GDP per capita levels after accounting for all othersalient influencing variables (such as education, inflation, terms oftrade, and institutional factors).
Many sustainable scenarios have in common this kind of relativeeconomic convergence and catch-up between today’s developingand industrialised regions in the next 100 years. The successful diffusion of new technologies and different consumption patternsare therefore important prerequisites for achieving sustainability insuch scenarios.
With a few notable exceptions (for example, the scenario developedby Lazarus and others, 1993, and the case C scenarios presented inthe IIASA-WEC study), the challenge of exploring conditions forclosing the income gap between developing and industrialisedregions appears to be a fundamental challenge for scenarios thatdescribe sustainable development. Differential economic growthrates can close a part of this gap; the other part needs to be closedthrough additional measures ranging from accelerated rates of technological diffusion to more equitable income and resource distribution. For example, the C scenarios incorporate a challenging,broad portfolio of environmental control technologies and policies,including incentives to encourage energy producers and consumersto use energy more efficiently and carefully, ‘green’ taxes (levied onenergy and carbon), international environmental and economicagreements, and technology transfer.
Case C reflects substantial resource transfers from industrialisedto developing countries, which spur growth and eradicate poverty.Specifically, C assumes that energy and carbon taxes are applied universally, albeit at different rates and timing, and are revenue neutral.The proceeds from these taxes in OECD countries are recycled asresource transfers to developing countries and are used to promote
Technological diffusion occurs over a long period of
time, from a new technology�s first introduction to its
pervasive adoption.

WORLD ENERGY ASSESSMENT: ENERGY AND THE CHALLENGE OF SUSTAINABILITY
Chapter 9: Energy Scenarios
355
energy infrastructure, clean technologies, efficiency, and conservation.Such transfers help solve part of the scenarios’ development problem,which is fundamental for a sustainable world. Solving the other part of the problem entails revitalising international programs to address world poverty. These poverty alleviation aspects of achieving sustainability are implicit in the scenarios—and include investmentin energy and environmental ends, but more important in education,health, security against natural disasters, and so forth.
Capital requirements and financingCapital investment is crucial for energy development. Both the overalldevelopment of and structural changes in energy systems resultfrom investments in plant, equipment, and energy infrastructure.Because adequate and affordable energy supplies are critical foreconomic growth, any difficulties in attracting capital for energyinvestment can slow economic development, especially in the leastdeveloped countries, where 2 billion people have yet to gain accessto commercial energy services. And—although energy investmentaccounts for only a small share of the global capital market—theavailability of the capital needed for a growing energy sector cannotbe taken for granted but depends on prices and regulations that permitinvestors to earn rates of return that are competitive with otheropportunities offered by international capital markets. This is especiallythe case for sustainable development paths, which require high levelsof investment in new technologies and conservation measures thatmay not be initially competitive with their traditional counterparts.
Capital markets have been growing faster than total GDP for quitesome time, and this trend is unlikely to change. Present annual globalenergy investments are approximately 7 percent of internationalcredit financing of about $3.6 trillion (Hanke, 1995). With capitalmarkets growing relative to GDP, and assuming largely stable futureenergy investment ratios, capital market size does not appear to bea limiting factor for energy sector finance today and is not likely tobe one across a wide range of scenarios.
Very few scenarios in the literature give a detailed account ofenergy-related investments. Even fewer describe investments thatwill promote sustainable energy futures. Thus estimates of globalcapital requirements for energy development are often based onback-of-the-envelope calculations of aggregate energy investmentindicators for several major energy-consuming countries that havebeen extrapolated to the rest of the world. These estimates tend tobe highly influenced by present market realities and short-termmarket expectations and necessarily incorporate a number of ad hoc(and not necessarily consistent) assumptions about the relationshipbetween income growth and energy requirements.
For example, if energy intensities are assumed to increase, capitalrequirements will, other things being equal, differ significantly fromscenarios in which energy intensities decline. Investments are likelyto grow faster than GDP in the former case and slower than GDP inthe latter. Capital estimates also depend greatly on the assumedcosts of different technologies, including infrastructure, and theprojected energy mix. As a result, comparisons among estimates of
future investment requirements must recognise that each reflects a set of assumptions consistent with a specific energy-economy-environment scenario.
The IIASA-WEC scenarios provide a comprehensive assessmentof energy-related investment requirements on the basis of detailedbottom-up cost calculations for the entire energy sector, extendingfrom resource extraction (such as coal mining and oil exploration)through development and production to delivery of energy productsto final consumers. The estimates of energy investments do not include,however, those required to achieve more efficient services or structuralchanges that lead to greater efficiencies. Each technology—an oilplatform, gas pipeline, liquefied natural gas (LNG) terminal, electricitygenerating plant, district heat grid, and so forth—is characterisedby a set of technoeconomic parameters, one of which is investmentcost in dollars per unit of installed capacity. These costs are thenaggregated into the total investment requirements for the entireenergy sector. But because these cost estimates were derived duringthe 1990s (for the base year 1990), they do not reflect more recentchanges, such as declines in energy costs.
A conclusion consistent across all six IIASA-WEC scenarios is thatthe capital requirements of the energy sector will be extremely largerelative to current standards, but will not be infeasible. During thenext 30 years capital requirements across the scenarios are estimatedto be $12–17 trillion, measured at market exchange rates and 1998dollars (or $10–15 trillion in 1990 dollars; this is to be comparedwith 1990 gross world product of about $20 trillion; see table 9.1).(In 2000–20, investment requirements are estimated to be $9–$13trillion, 1998 dollars.) Figure 9.7 shows this range of cumulative
FIGURE 9.7. CUMULATIVE ENERGY INVESTMENTSACROSS SIX SCENARIOS, 1990–2020
The highest investments refer to case A and the lowest to case C scenarios. Source: Nakicenovic, Grübler, and McDonald, 1998.
Trill
ions
of
1990 d
olla
rs,
measu
red a
t m
ark
et
exc
hange r
ate
s
OECDcountries
Transitioneconomies
Developingcountries
World
■■ Energy supply■■ Other energy conversion systems■■ Electricity sector
4
7
10
15
23
45
20
15
10
5
0

WORLD ENERGY ASSESSMENT: ENERGY AND THE CHALLENGE OF SUSTAINABILITY
Chapter 9: Energy Scenarios
356
global energy investment requirements between 1990 and 2020.They are desegregated into investments in the electricity sector,other energy conversion systems, and energy supply (extraction,upgrading, transmission, and distribution) for three major worldregions; table 9.1 shows the cumulative investments for 2020–50and 2050–2100. Note that capital requirements are lowest for thecase C scenarios that describe sustainable development paths. Thesescenarios’ relative advantage of substantially lower energy financingrequirements is an important indicator of the high economic valueof energy efficiency and conservation. But the costs of energy end-use changes are not included in the assessment.
As a share of GDP, global energy investments range from 1.5 to1.9 percent across the scenarios. This is in line with historicalnorms: During the early 1990s investment averaged just over 1 percentof global GDP (ranging from $240–280 billion a year). In the scenariosthey are highest in the transition economies of Europe and Asia,where they range up to 7–9 percent of GDP. These high investmentneeds are a legacy of the high energy intensity of the former centrallyplanned economies and recent declines in investment that wentalong with economic recession. The result is a substantial need toreconstruct and upgrade energy infrastructure. Another importantaspect of future energy investment is that the share of developingregions rises sharply, from today’s 25–30 percent to 42–48 percent,and these regions become the largest capital investment market in all scenarios.
Overall, energy investments in the scenarios decrease as a shareof GDP throughout the world. But the challenge will be that anincreasing fraction of capital requirements will need to be raisedfrom the private sector, where energy needs will face stiffer competitionand return-on-investment criteria. Also most investments must bemade in developing countries, where both international developmentcapital and private investment capital are often scarce.
Technological diffusionTechnological progress is central to all scenarios that describe sustainable development. The direction of technological change isof crucial importance in these scenarios. To varying degrees they allenvisage a transition from reliance on fossil energy sources to cleanfossil options, renewable energy sources, and in some cases to safenuclear energy. But they require the development and diffusion ofradical new technoeconomic systems. The IIASA-WEC scenariosillustrate this by different directions of technological change in theenergy system within the framework of the three case A scenarios.Energy systems structures range from continued reliance on fossil-intensive development paths to high rates of decarbonisation.Otherwise the scenarios share the same development of other drivingforces such as population, economic growth, and energy demand.Clearly the fossil-intensive scenarios do not meet sustainability criteria—unless they radically reduce emissions, including carbonremoval and storage. Other implications of these alternative technologicaldevelopment paths are equally important. This illustrates that thedirection of technological change can be as important for achieving
sustainable development as all other driving forces combined.Technological diffusion occurs over a long period of time, from
a new technology’s first introduction to its pervasive adoption. Forenergy technologies diffusion time may range from 10–20 years allthe way to 100 years. For example, the diffusion of motor vehiclesor air conditioning systems usually takes 10–20 years. In contrast,the diffusion of new energy systems consisting of numerous individualtechnologies, such as a shift to renewable sources, might takealmost 100 years. A principal conclusion of many sustainable energyscenarios is that the long-term transition to new energy technologieswill largely be determined by technological choices made in the next10–30 years. There is a need to anticipate technical characteristics—such as performance, cost, and diffusion—of new energy technologiessuch as photovoltaics, hydrogen production, and fuel cells; thelong-term diffusion, transfer, and performance of these technologiesdepends on near-term RD&D and investment policies and decisions.If new technologies are not developed through dedicated RD&Defforts, they will not be diffused and will not be available when needed.Diffusion is an endogenous process. This illustrates path dependencein technological diffusion; because there is a virtual lock-in to thedevelopment path formed by many individual, related decisions,other possibilities are excluded (for example, see Grübler, 1998b).
These lock-in effects have two implications. First, early investmentsand early applications are extremely important in determiningwhich technologies—and energy resources—will be most importantin the future. This means that there needs to be an early investmentin sustainable technologies if the sustainable development path is tobe achieved. Second, learning and lock-in make technology transfermore difficult. This means that—in this context—the differencebetween diffusion and transfer disappears; they are parts of thesame process. Successfully building and using computers, cars, andpower plants depends as much on learning through hands-on experience as on design drawings and instruction manuals. And atechnology that is tremendously productive when supported bycomplementary networks of suppliers, repair workers, training programs, and so forth, and by an infrastructure that has co-evolvedwith the technology, will be much less effective in isolation.
Technology costs and performance—including energy efficiencyin particular—improve with experience, and there is a commonpattern to such improvements for most technologies. This pattern of increasing returns to diffusion and transfer is important for thetransition to sustainable energy futures, and it needs to be incorporatedmore explicitly into the scenarios.
In case A, there are substantial learning-curve effects for all new,and currently marginal, energy production and conversion technologies.These developments are consistent with the technological perspectivesgiven in chapters 7 and 8. Thus there are considerable advances inhydrocarbon exploration, extraction, and conversion, carbonremoval and storage, renewable and nuclear electricity generation,and hydrogen and biofuel production and conversion. For case B,the learning-curve effects are also substantial, especially for new,environmentally desirable technologies. But they lag on average 30

WORLD ENERGY ASSESSMENT: ENERGY AND THE CHALLENGE OF SUSTAINABILITY
Chapter 9: Energy Scenarios
357
percent behind those in case A, which is consistent with the lessconcentrated RD&D efforts in case B. For case C, learning-curveeffects by design favour low-carbon fossil and renewable technologies.These technologies benefit from improvements equal to those incase A. All other technologies develop as in case B.
International energy trade and securityGenerally a lot of trade takes place in the scenarios, ranging fromcapital goods to energy. Energy-related trade in capital goodsincludes plant and equipment—required, for example, for theadoption of environmentally friendly technologies. So not only tradein energy is important in the scenarios. An analysis of the energytrade flows implied by the scenarios reveals a general decline in theshare of primary energy (equivalent) that is traded world-wide.Currently about 18 percent of global primary energy is tradedamong the main world regions (as defined in the IIASA-WEC study).This is in close agreement with the true country-by-country figure
for 1990 of about 19 percent (Nakicenovic, Grübler, and McDonald,1998). Crude oil and oil products are currently dominant, accountingfor 78 percent of global energy trade; coal accounts for 13 percentand natural gas for 9 percent. By 2050 primary energy tradeddeclines to between 11 and 16 percent. In comparison, oil and gas imports to Western Europe were about 34 percent of primaryenergy consumption in 1990, and oil imports to North Americawere about 16 percent of primary energy consumption the sameyear. But absolute volumes continue to increase in the scenarios—up to a factor of 2.5 for case A and a factor of 1.7 for case B. Theincrease in case C is much lower, at 10–40 percent. Energy trade incase C is limited primarily to sustainable energy forms (such asbiomass, methanol, ethanol, and to a lesser degree hydrogen) andactually shrinks beyond 2050. This indicates that even in case C scenarios world trade in oil and gas continues to increase, despitea shift towards stronger reliance on renewable energy sourcesthroughout the new century.
FIGURE 9.8. OIL EXPORT QUANTITIES, PRICES, AND REVENUES FOR THE MIDDLE EAST AND NORTH AFRICA, 1963–96, AND IN SIX SCENARIOS, 2010–2050
C1
20502020
C2
1985
2050
2020
A3 2050
2010
B
2010
1990
1975
1996
1995
1975
205020202020
A1
A2
2020
197019651963
Source: Nakicenovic, Grübler, and McDonald, 1998.
1963–9
9:
real
oil
pri
ce,
1990 d
olla
rs a
barr
el
2010–5
0:
pro
jecte
d s
hadow
pri
ce,
1990 d
olla
rs a
barr
el
Exports, millions of barrels a day
Isoquarts o
f consta
nt e
xport re
venues, b
illions o
f 1990 d
olla
rs a ye
ar
60
50
40
30
20
10
0
340
300
240
190
140
70
40
4 6 8 10 12 14 16 18 20 22 24 26
WORLD ENERGY ASSESSMENT: ENERGY AND THE CHALLENGE OF SUSTAINABILITY
Chapter 9: Energy Scenarios
358
The overall geopolitical shift in energy use from industrialisedregions to today’s developing regions across all scenarios is alsoreflected in energy trade. In 1990 OECD imports accounted for 84percent of international energy trade. By 2020 OECD-country sharesdrop to 55 percent in case C and 65 percent in case B, and by 2050to 10 percent in case C and 34 percent in case A. This shift is likelyto erode the current position of OECD countries as the dominantenergy buyers. Conversely import security concerns, which traditionallyhave been strong in import-dependent Western Europe and Japan,will increasingly be shared by today’s developing regions (chapter 4).Concerns about absolute import needs will also grow in developingcountries in comparison with OECD countries.
The prospects for oil-exporting regions are bright in the long run
across all scenarios, and, at least through 2050, oil revenue isunlikely to be below $170 billion (in 1998 dollars) a year in theMiddle East and North Africa. But there are differences among thethree cases, as shown in figure 9.8. In case C, environmental policiesreduce fossil fuel (that is, taxes and regulation) demand and causedeclining exports, but rising export prices keep revenue constant. Incases A and B, technological change and the speed at which reservesare replenished from the resource base (chapter 5) determine exportprices, export volumes, and revenues. In case A, greater technologicalprogress than in case B enables higher export at slightly elevatedexport prices, and long-term revenues may exceed $360 billion (in1998 dollars) annually. The slower the rate of technological change,the more important the price component becomes in revenue generation.Export volumes slip as reserves are replenished more slowly, pricesrise, and revenues vary as a function of the scenario-specific oil substitution possibilities. Long-term export revenues for the regionexceed $360 billion a year in case A and are at least $240 billion ayear in case B, and thus are substantially higher than at present.
Another potential exporter of fossil energy is the former SovietUnion, where natural gas will be the principal energy export (box 9.3).Gas exports from this region increase for all scenarios, from 4 exajoulesin 1990 to a relatively narrow range of 11–12 exajoules in 2020 anddiverge afterwards across the scenarios, as shown in figure 9.9. By2050 annual exports range up to 27 exajoules, and annual revenuesreach $150 billion (1990 dollars; $180 billion in 1998 dollars).
Overall, crude oil and oil products remain the most traded energycommodities through 2050. The spread is quite large, ranging between77 percent in case A and 33 percent in case C. After 2050 methanol,piped natural gas, LNG, and to a lesser extent also hydrogen becomethe key traded energy commodities. Electricity, an important componentof regional energy trade, and is thus considered in the scenarios butis not important in global energy trade. As noted above, trade andinvestment in technologies will be very important.
In general the global energy trade pattern shifts from primary tosecondary energy forms, which improves trade flexibility and lowersenergy security concerns. For example, methanol and hydrogen canbe produced from a number of primary sources ranging from coalto biomass (chapters 7 and 8). Biofuels and eventually hydrogenproduction leave more value added in the exporting regions than theexport of primary energy. Exporting secondary energy forms becomesa staple source of income for a number of developing regions.Nevertheless oil- and gas-exporting regions generally increase theirexport revenues even in the more sustainable scenarios, indicatingthat improved energy efficiency and a shift towards other energy sourceswould not necessarily erode the position of energy-exporting regions.
Environmental issues at the local and regional scalesLocal environmental impacts are likely to continue to take precedenceover global change in the achievement of sustainable energy developments.According to the IIASA-WEC study, the natural capacity of the environment to absorb higher levels of pollution is also likely to
BOX 9.3. ENERGY SCENARIOS FOR THE NEWLY INDEPENDENT STATES OF THE FORMER SOVIET UNION
Two scenarios of future energy developments for the former SovietUnion, considered to include characteristics of sustainable developmentfrom the regional perspective, are labelled “optimistic” and “probable”(Makarov, 1999). The optimistic scenario is similar in character toIIASA-WEC case A in that rapid globalisation of markets, vigoroustechnological development, and increasing concerns for the environmentare assumed. The probable scenario has a number of characteristicsin common with IIASA-WEC case B. It basically represents a worldwhere the optimistic scenario is implemented more moderately.
After the recovery from the current recession in 2000–10, bothscenarios envisage rapid economic growth. In the optimistic case, percapita income levels reach $10,000 by about 2030; in the probablescenario, by about 2040. Energy intensities are also assumed to improve,with economic growth reversing the recent increases as the consequenceof the deep recession.
The primary energy requirements range from 44 exajoules in theprobable scenario to 50 exajoules in the optimistic scenario by 2050,in comparison with 57 exajoules in 1990. Energy intensity improvementslead to generally lower energy requirements despite vigorous economicdevelopment. These energy requirements correspond to 137–145gigajoules per capita by 2050, in comparison with almost 200 gigajoulesper capita in 2050.
Already in 1990, 50 percent of final energy was delivered to consumersin the form of high-quality energy carriers such as electricity, gas,and district heat. The quality of final energy improves further in both scenarios.
Electricity and gas exports grow consistently in both scenarios,providing clean fuels to emerging energy markets in Europe and Asia.Gas is an essential transition fuel in the scenarios because it is sowell-matched to the pervasive trend in consumer preferences forhigh-quality, clean, flexible convenient final energy delivered by grids.
Both scenarios are characterised by declining energy sectorinvestments as a share of GDP, to 2.3–3.0 percent by 2050. In absoluteterms the cumulative financing requirements between 2000 and2020 are in the range of $500–$700 billion.
Concerns about possible climate change are considered limitedin the two scenarios for two reasons. First, the recession of the 1990sleft the region with other pressing economic, social, and environmentalpriorities. Second, the energy development outlined in the two scenariosresults in emissions that are well below the 1990 levels specified forRussia and Ukraine in the Kyoto Protocol. The difference betweenthese specified emissions levels and the much lower emissions inthe two scenarios through 2050 (way beyond Kyoto commitments)is an asset potentially worth money if and when the Kyoto Protocolenters into force.

WORLD ENERGY ASSESSMENT: ENERGY AND THE CHALLENGE OF SUSTAINABILITY
Chapter 9: Energy Scenarios
359
become a limiting factor on the unconstrained use of fossil fuels.This also appears to be the case in many other sustainable energyscenarios. Increasing income would also lead to a higher demandfor cleaner energy end uses in rural areas world-wide. This includesa shift away from cooking with wood and coal in inefficient traditionalopen fireplaces. Such a change would reduce indoor pollution levels,currently estimated to be 20 times higher than in industrialised countries.
A particularly urgent environmental problem in densely populatedmetropolitan areas is the high concentration of particulate matterand sulphur dioxide. Here cleaner fuels, such as natural gas, andactive abatement measures will be required. Regional air pollutioncould also prove problematic, especially in the rapidly growing,densely populated, coal-intensive economies of Asia. In the boomingcities of China and Southeast Asia, high levels of air pollution mustbe addressed with appropriate measures (box 9.4).
According to the findings of the IIASA-WEC study, one of the scenarios (A2), with a high dependence on coal (assuming noabatement measures), would result in high sulphur dioxide emissions
and significant regional acidification, causing key agricultural cropsin the region to suffer acid deposition 10 times the sustainable levelbefore 2020. Figure 9.10 shows excess sulphur deposition abovecritical loads in Asia for the unabated A2 scenario. According to thisscenario, emissions could triple in Asia by 2020, and ambient airquality in South and East Asia could deteriorate significantly in bothmetropolitan and rural areas. Sulphur deposition would reach twicethe worst levels ever observed in the most polluted areas of Centraland Eastern Europe (for example, in the so-called black trianglebetween the Czech Republic, Germany, and Poland). Of criticalimportance for economically important food crops in Asia is thatunabated sulphur emissions would cause critical loads to beexceeded by factors of up to 10. As a result severe losses in cropproduction could occur over large areas of Asia. In contrast to thisdire outlook of possible consequences of unabated sulphur emissionsin coal-intensive A2, A3 and C are relatively benign, leading to some,but not alarming, excess emissions in the future; perhaps moreimportant, by the middle of the 21st century global sulphur emissions
FIGURE 9.9. NATURAL GAS EXPORT QUANTITIES, PRICES, AND REVENUES FOR THE FORMER SOVIET UNION, 1975–96, AND IN SIX SCENARIOS, 2010–2050
2050
A1
2050A3
20101982
1980 1990
1996
1989
1975
2010
2020
2050
C2
2020
A2 2050
C1
B
2050
2050
Source: Nakicenovic, Grübler, and McDonald, 1998.
1963–9
9:
real
gas
pri
ce,
1990 d
olla
rs a
cubic
metr
e2010–5
0:
pro
jecte
d s
hadow
pri
ce,
1990 d
olla
rs a
cubic
metr
e
Exports, billions of cubic metres a year
Isoquarts o
f consta
nt e
xport re
venues, b
illions o
f 1990 d
olla
rs a ye
ar
0.25
0.20
0.15
0.10
0.05
0
150
140
120
100
80
60
40
20
105
0 100 200 300 400 500 600 700

WORLD ENERGY ASSESSMENT: ENERGY AND THE CHALLENGE OF SUSTAINABILITY
Chapter 9: Energy Scenarios
360
would be reduced to well below current levels.People world-wide already suffer from local and regional air pollution,
and both governments and individuals are taking steps to improvethe situation. These actions are part of the drive towards higher efficiencies and cleaner fuels and may also contribute to the shifttowards a more sustainable development path. They also have thepositive spin-off effect of reducing carbon emissions and possibleglobal warming, although that is not their principal motivation.
Consequently emissions of sulphur aerosol precursors portrayvery dynamic patterns in time and space in most sustainable energyscenarios, in contrast to the development in many reference scenarios
(see figure 9.10). A detailed review of long-term global and regionalsulphur emission scenarios is given in Grübler (1998a). Most recentscenarios recognise the significant adverse impacts of sulphur emissionson human health, food production, and ecosystems. As a result scenarios published since 1995 generally assume various degrees ofsulphur controls to be implemented in the future and are thus substantially lower than previous projections. Other developments,such more sulphur-poor coals and clean fossil technologies and ashift towards renewables and natural gas in scenarios A3 and C, helppromote substantial additional emissions reductions as ancillary benefits.
A related reason for lower sulphur emission projections is therecent tightening of sulphur-control policies in OECD countries thatcontinue to dominate global emissions, such as the amendments tothe U.S. Clean Air Act and implementation of the Second EuropeanSulphur Protocol. These legislative changes were not yet reflected inprevious long-term emission scenarios, as noted in Alcamo and others(1995) and Houghton and others (1995). The median from newersulphur-control scenarios is consequently significantly lower relative to the older scenarios, indicating a continual decline inglobal sulphur emissions.
Scenarios A3 and C include a host of environmental controlmeasures that help reduce emissions of sulphur dioxide and otherpollutants. This is consistent with most of the scenarios that lead toa long-term, sustainable decline of particulate and sulphur levels,which would return emission levels to those of 1900. As a generalpattern, global sulphur emissions do rise initially in recent scenarios,but eventually decline even in absolute terms after 2050. The spatialdistribution of emissions changes markedly, generally from OECDregions to rapidly developing regions in Asia, and varies across scenarios.
In the sustainable IIASA-WEC scenarios (A3 and C), emissions inOECD countries continue their recent declining trend, reflecting atightening of control measures. Emissions outside OECD countries,most notably in Asia, initially rise and then decline, resembling thecurrent trend in OECD emissions. The reductions are especiallypronounced in the C scenarios because of a virtual transition to thepost-fossil era by 2100, essentially eliminating sulphur emissions.A3 leads to substantial sulphur declines, even though it has the sameeconomic growth prospects as A2. There are many reasons. First,clean coal technologies, such as gasification, remove sulphur as aninherent property of the conversion process. Then there is a shift infossil energy supply to low sulphur-grade coals, higher shares ofnatural gas, and later to non-fossils as well. Over the long term sulphur emissions decline in both scenarios throughout the world,but the timing and magnitude vary.
Climate change: land use and other global issuesOne important implication of the varying pattern of particulate andsulphur emissions across the scenarios is that the historicallyimportant, but uncertain, negative radiative forcing of sulfate aerosolsmay decline in the very long run (Hulme, 1997; chapter 3). Thismeans that the current cooling effect on the climate that results from
BOX 9.4. ENERGY SCENARIOS FOR CHINA
Five scenarios are considered for China. The first is a baseline scenario; the other four illustrate different strategies to achieve moresustainable development from a regional perspective (Zhou, 1999).
The baseline scenario is intended to represent a practical, feasiblefulfilment of future energy demand with low risk. It is assumed thatGDP will expand by 22.7 times between 1990 and 2050, whileenergy demand will increase relatively modestly by about 1.7 timesduring the same period. This is due to vigorous improvement ofenergy intensities in combination with rapid economic growth. The future energy supply in the baseline scenario continues to bedominated by coal, however, with substantial technology and efficiency improvements. The main limitations and concerns arerelated to potential adverse environmental impacts. In particular,this coal-intensive baseline scenario is likely to lead to air pollutionand energy-related emissions that substantially exceed acceptablelevels. This is the main reason for the formulation of alternativedevelopment paths that fulfil the development objectives of China,but with substantially lower adverse environmental impacts.
The four sustainable scenarios explore alternative measures and policies to reduce the environmental burden of energy. The first scenario focuses on strengthening energy conservation. It isestimated that the energy conservation potential, if fully utilised,could reduce energy demand in China by 12 percent relative to the baseline by 2050. The second alternative scenario focuses onadoption of clean coal technologies. The main advantage of thisscenario is that it would allow for the use of large domestic coalresources while curbing air pollution and sulphur emissions. But it would still lead to high carbon dioxide emissions. The third scenario focuses on renewable energy sources as replacements for coal. The fourth scenario focuses on nuclear energy, includingbreeder reactors, as a replacement for coal.
Combinations of these alternative scenarios were also considered,resulting in a substantial decrease in the ultimate share of coal tobelow 40 percent by 2050. Nevertheless coal remains the mostimportant energy source across all these alternatives. Thus one ofthe conclusions is that a high priority should be placed on developingand diffusing clean coal technologies—in addition to conservation—in the four more sustainable scenarios. This strategy could lead tomitigation of 40 percent of future sulphur emissions (for example, in the second alternative scenario, at relatively modest increases in investment requirements, sulphur emissions decline from 23.7million tonnes in 1995 to 13.5 millions tonnes in 2050). The energyconservation scenario had the advantage of low financing requirementsand the lowest carbon dioxide emissions—but at the expense of a 60 percent increase in sulphur emissions. In contrast the cleancoal scenario achieves a 40 percent reduction of sulphur emissionsbut has the highest carbon dioxide emissions. The renewable andnuclear energy scenarios lead to reductions in emissions at all scales,but the reductions in sulphur and carbon dioxide are not very large(10 percent and 20 percent), while the investment costs are very high.

WORLD ENERGY ASSESSMENT: ENERGY AND THE CHALLENGE OF SUSTAINABILITY
Chapter 9: Energy Scenarios
361
the emissions of particulates and sulphur aerosols would diminish,causing additional, spatially different patterns of climate change.This view is also confirmed by the model calculations reported inSubak, Hulme, and Bohn (1997), Nakicenovic, Grübler, and McDonald(1998), Nakicenovic (2000), Smith and others (forthcoming), andWigley (1999) and is based on recent long-term greenhouse gasand sulphur emission scenarios. This means that precursors of airpollution and acidification at the local and regional levels have animportant role in global climate change. But emissions of green-house gases such as carbon dioxide continue to be the main sourceof climate warming.
Cumulative future CO2 emissions are in the first approximationindicative of potential climate change (chapter 3). Carbon dioxideemissions are the major anthropogenic source of climate change,and energy is the most important source of CO2 emissions. A numberof energy scenarios in the literature account for the emissions ofother greenhouse gases and thus provide a more complete pictureof possible implications for climate change. For simplicity, onlyenergy-related sources of CO2 emissions are evaluated here.
Figure 9.11 shows the CO2 emissions of the six IIASA-WEC scenarios
superimposed on the emissions range of the energy scenarios fromthe literature. The range is very wide by 2100, from more than seventimes current emissions to almost none for scenarios that assume acomplete transition away from fossil energy. The emission profilesare different across the range of scenarios. Most portray a continuousincrease throughout the 21st century, whereas the sustainable scenarios generally have lower, more dynamic emission profiles.Some of them curve through a maximum and decline.
For the scenarios in the literature, the distribution of emissionsby 2100 is very asymmetrical and portrays a structure resembling atrimodal frequency distribution: those with emissions of more than30 gigatonnes of carbon (20 scenarios), those with emissions of12–30 gigatonnes of carbon (88 scenarios), and those with emissionsof less than 12 gigatonnes of carbon (82 scenarios). Most of thescenarios in this lowest cluster are situated at 2–9 gigatonnes of carbon; this cluster appears to include many of the sustainableenergy scenarios, and the second and third clusters most likelyinclude only a few of them. The lowest cluster may have been influencedby many analyses of stabilising atmospheric concentrations, forexample at 450 and 550 parts per million by volume (ppmv), in
FIGURE 9.10. EXCESS SULPHUR DEPOSITION ABOVE CRITICAL LOADS IN ASIA FOR AN UNABATED A2 SCENARIO, 2020
Source: Amann and others, 1995.
■■ No excess■■ < 0.1■■ 0.1–0.5■■ 0.5–1.0■■ 1.0–1.0■■ 2.0–5.0■■ 5.0–10■■ > 10
Grams of sulphur persquare metre

WORLD ENERGY ASSESSMENT: ENERGY AND THE CHALLENGE OF SUSTAINABILITY
Chapter 9: Energy Scenarios
362
accordance with the United Nations Framework Convention on ClimateChange (UNFCCC, 1992).
The cumulative carbon emissions between 1990 and 2100 are540 gigatonnes in the case C scenarios, 1,000 gigatonnes in B,1,210 gigatonnes in A1, 1,450 gigatonnes in A2, and 910 gigatonnesin A3. Thus A3 and C have both the lowest cumulative emissions andlowest annual emissions towards the end of the century.Accumulated emissions across the scenarios between 1990 and2100 are shown in table 9.1 as well as the resulting atmosphericcarbon dioxide concentrations. Table 9.1 shows that the rising carbon dioxide emissions in cases A and B lead to atmospheric carbon concentrations of 530–730 ppmv in 2100. This compareswith concentrations of 280 ppmv around 1800 (the beginning of thefossil-fuel age) and current concentrations of 370 ppmv. A3, whichincludes characteristics of sustainability, leads to the lowest atmos-pheric concentrations of all A scenarios, about 530 ppmv by 2100.In B and A1, carbon concentrations approach 590 and 620 ppmv,respectively, by 2100. The concentrations of the coal-intensive A2scenarios are the highest, 730 ppmv by 2100, about twice currentlevels. Only C scenarios lead to relatively benign concentration levels of less than 450 ppmv (chapter 3).
Thus all scenarios except case C approach the doubling of pre-industrial carbon concentrations. And again in all scenariosexcept C, concentrations continue to rise throughout the 21st century. On the basis of current knowledge, an increase of carbonconcentrations to 600 ppmv by the end of the 21st century couldlead to an increase in the mean global surface temperature of about
2.5 degrees Celsius, assuming the mean climate sensitivity and withan uncertainty range of 1.5–4.5 degrees Celsius (chapter 3).
The C scenarios are the only ones in which carbon concentrationsstabilise by 2100, reflecting their ambitious emission reduction profile, from 6 gigatonnes in 1990 to 2 gigatonnes in 2100. Afterpeaking at about 450 ppmv around 2080, carbon concentrationsslowly begin to decline as natural sinks absorb excess carbon dioxide.The present carbon cycle models indicate that the emissions reductionto about 2 gigatonnes of carbon a year (or about a third to at mosthalf the current global emissions) is an essential prerequisite foreventually achieving stabilisation of atmospheric concentrations.This is the reason why all other scenarios, including A3, result incontinuously increasing concentrations over the time horizon(although A3 is consistent, with stabilisation at 550 ppmv in the22nd century, assuming that the emissions would further bereduced to about 2 gigatonnes of carbon a year).
Even with its ambitious emission reduction measures, C’s atmospheric carbon concentrations rise by up to 90 ppmv duringthe 21st century. This increase is about equal to the concentrationrise since the onset of industrialisation until today (from 280 to 370ppmv during the past 200 years). Thus even in C, some climatechange appears inevitable: perhaps 1.5 degrees Celsius (with anuncertainty range of 1.0–2.5 degrees Celsius) in increased globalmean surface temperature. This illustrates both the legacy of ourpast dependence on fossil fuels and the considerable lead timesrequired for an orderly transition towards a zero-carbon economyand sustainable development paths. It also illustrates the long residencetime of carbon in the atmosphere. Some of the carbon dioxide emissionsfrom Watt’s first steam engine are still airborne.
Both IIASA-WEC scenarios with characteristics of sustainability, Cand A3, are situated within the lowest cluster with emissions foundin the literature, at 2–9 gigatonnes of carbon by 2100. Thus they appearto cover the range of future emissions associated with sustainabledevelopment quite well—their range excludes only the mostextreme emission scenarios found in the literature. This leads to asubstantial overlap in emission ranges across different scenarios. Inother words a similar quantification of the driving forces that are allconsistent with various concepts of sustainable development canlead to a wide range of future emissions. Because this result is offundamental importance for assessing climate change and sustainabledevelopment, it warrants further discussion.
Another interpretation is that a given combination of drivingforces is not sufficient to determine future emission paths. A particularcombination of forces, such as those specified in the three IIASA-WECcase A scenarios, is associated with a whole range of possible emissionpaths. These three A scenarios jointly cover the largest part of thescenario distribution shown in figure 9.11. But only one of them, A3,can be characterised as sustainable. The three scenarios exploredifferent specific structures of future energy systems, from carbon-intensive development paths to high rates of decarbonisation. Allthree otherwise share the same assumptions about the drivingforces. This indicates that different structures of the energy system
FIGURE 9.11. GLOBAL CARBON EMISSIONS FROM FOSSIL FUEL USE, 1850–1990, AND IN SIX SCENARIOS, 1990–2100
For each scenario, the range shows the difference between grossand net emissions. Gross emissions are actual carbon dioxidereleased into the atmosphere. Net emissions include deductionsfor carbon absorption (through biomass regrowth and sequestration).The figure also shows the wider range of emissions for 190 scenariosin the literature. The vertical line that spans the scenario range in1990 indicates the uncertainty across the literature of base-yearcarbon emissions.
Source: Nakicenovic, Grübler, and McDonald, 1998; Morita and Lee, 1998.
Gig
ato
nnes
of
carb
on
1850 1900 1950 2000 2050 2100
25
20
15
10
5
0
A2
A1
B
A3
C1, C2

WORLD ENERGY ASSESSMENT: ENERGY AND THE CHALLENGE OF SUSTAINABILITY
Chapter 9: Energy Scenarios
363
can lead to basically the same variationin future emissions as can be generatedby different combinations of the othermain driving forces—population, economicactivities, and energy consumption levels—with basically the same structure of the energysystem. The implication is that decarbonisation ofenergy systems—the shift from carbon-intensive to less carbon-intensive and carbon-free sources of energy—is of similar importanceas other driving forces in determining future emission paths.
Figure 9.12 shows the degree of decarbonisation achieved in thescenarios relative to historical trends and the range observed in scenarios from the literature. Carbon intensity of primary energy isshown as an indicator of decarbonisation. The carbon intensityimproves across all IIASA-WEC scenarios, but is especially pronouncedin the three with characteristics of sustainability, C1, C2, and A3.Sustained decarbonisation requires the development and successfuldiffusion of new technologies. An important implication of the varying
interplay of the main scenariodriving forces is that investments in
new technologies during the comingdecades might have the same magnitude
of influence on future emissions as populationgrowth, economic development, and levels of
energy consumption taken together. Thus high orlow emissions can be associated with a range of social and
economic scenarios; the distinguishing feature of the low emissionsand low pollution scenarios is that the policies and technologies arein place to reduce emissions. But countries will be better placed toimplement climate-friendly policies if development, in its broadestsense, is successful.
Furthermore decarbonisation also means that other environmentalimpacts tend to be lower (Nakicenovic, 1996). Thus the energy systemsstructure of IIASA-WEC scenario A3 is one of the main determinantsof its sustainability. In contrast, C scenarios require fundamentalchanges that encompass energy end use as well. In many ways the
FIGURE 9.12. GLOBAL CARBON INTENSITY OF PRIMARY ENERGY, 1850–1990, AND IN SIX SCENARIOS, 1990–2100, RELATIVE TO THE SCENARIOS FROM THE LITERATURE AND THE IPCC IS92 SCENARIOS
Source: Nakicenovic, Grübler, and McDonald, 1998.
Gig
ato
nnes
of
carb
on p
er
gig
ajo
ule
The long-term transition to new energy technologies will largely be determined by technological
choices made in the next 10�30 years.
1850 1900 1950 2000 2050 2100
30
25
20
15
10
5
0
A1
B
A2
A3
C1/C2IS92a and range of IPCC scenariosRange of non-IPCC scenarios
WORLD ENERGY ASSESSMENT: ENERGY AND THE CHALLENGE OF SUSTAINABILITY
Chapter 9: Energy Scenarios
364
transitions in the structures of theenergy systems described by the scenarios cannot be seen in isolationfrom the overall development pathtowards sustainability. Other scenarios presented in the IIASA-WEC study do not appearto be consistent with the characteristics of sustainabilitygiven in table 9.2. This result suggests that the future directionof technological change in the energy system is not only importantfor reducing the dangers of climate change but can also help nudgethe overall development path in the direction of sustainability.
Conclusion Scenarios are frequently used to assess sustainable developmentpaths. Sustainable futures often are easier to illustrate when they arecompared with other scenarios that contradict some of the conditionsfor achieving sustainability. This is one of the reasons that, in recentstudies, sustainable scenarios are usually included among alternativefutures. This class of sustainable scenarios can be characterised bylow environmental impacts at all scales and more equitable allocationof resources and wealth relative to the current situations and otheralternative future energy developments. Recently IIASA and WECpresented a set of six global and regional scenarios (Nakicenovic,Grübler, and McDonald, 1998). Three of the scenarios describefutures with characteristics of sustainability. They are used in thischapter to illustrate the measures and policies for the near-termfuture that would be required to move away from other alternativebut unsustainable development paths. A single reference scenario isused to outline quite positive future developments, but they do notfulfil the essential conditions for achieving sustainability.
One of the three sustainable scenarios, C1, is consistent withmost of the conditions and concepts of sustainable developmentadvanced in this report. It presents a rich and green future andpresents a fundamentally different future development path thatincludes both substantial technological progress and unprecedentedinternational cooperation centred on environmental protection andinternational equity—it includes a high degree of environmentalprotection at all scales, from eradication of indoor air pollution tolow impacts on climate change, with an active redistribution ofwealth and very high levels of energy efficiency and conservation.Thus it fulfils most of the criteria for sustainable development—such as increasing both economic and ecological equity amongworld regions and countries—and leads to a significantly lowerimpact on the climate than scenarios with higher greenhouse gasemissions This scenario requires a virtually complete transitionaway from reliance on fossil energy sources and towards renewableenergy sources.
Two variants of this scenario were considered. One of them, C2,foresees a nuclear phaseout by 2100. Both are characterised by ahigh degree of energy conservation and vigorous efficiency improvementsthroughout the whole energy system and among end users. Consequentlytotal energy requirements are relatively low relative to the high levels
of affluence and quality of life,especially in today’s developing
regions. The achievement of such afuture is indeed challenging, and ranges
from devising new RD&D policies to bringingto market new energy technologies, to imposing
energy and carbon taxes as incentives for improvingenergy efficiency and conservation and increasing the shift
away from fossil fuels.The second scenario that includes characteristics of sustainability,
A3, is fundamentally different in nature and quite similar to the reference scenario except in the future structure of the energy system.Thus environmental protection and higher levels of affluence areachieved less through changes in levels of energy end use and structureand more through a dedicated decarbonisation of the energy system.Again efficiency improvements are important, and clean fossils such asnatural gas are foreseen as gaining much larger shares of global energyneeds, along with renewable sources of energy—all contributingtowards decarbonisation. Decarbonisation is in part also achievedthrough more sophisticated energy conversion and processing thatincludes carbon removal along with more conventional pollutants.
These scenarios illustrate different levels of compatibility betweenfuture energy systems and sustainable development. C1 shows thehighest level of compatibility with sustainable development characteristics.It exemplifies that the energy aspects of the major issues analysed inchapters 1–4 can be addressed simultaneously. But C1 should betaken only as one illustration of an energy system compatible with asustainable development future. Other combinations of primaryenergy sources and energy use levels might be equally or more compatible with sustainable development, as illustrated by C2 andA3, depending on the level of success with the development and dissemination of new technologies (chapters 6–8). For example, ifthe carbon sequestration options discussed in chapter 8 are realised,there need not be a large conflict between using coal and reducingcarbon emissions, and the fossil fuel share in a sustainable futurecould be much larger than in C1, as illustrated in A3 scenario.
All sustainable scenarios, including the three IIASA-WEC scenariosdescribed in this chapter in detail, have positive (desirable) andnormative (prescriptive) elements. They usually include strongassumptions about desirable futures and prescribe how such futurescan be achieved. Common to most is that they show that sustainablefutures are not achievable with current policies and prevailingdevelopment trends. Their achievement often requires a fundamentalchange or major paradigm shift. Thus sustainable energy scenariosare often designed to offer policy guidance on managing, for example,an orderly transition from today’s energy system, which relies largelyon fossil fuels, towards a more sustainable system with more equitableaccess to resources.
More global studies are considering futures with radical policyand behavioural changes to achieve a transition to a sustainabledevelopment path during the 21st century. The great merit of RD&Dpolicies, diffusion, and the adoption of new technologies associated
Local environmental impacts are likely to continue to take precedence
over global change in the achievement of sustainable
energy developments.

WORLD ENERGY ASSESSMENT: ENERGY AND THE CHALLENGE OF SUSTAINABILITY
Chapter 9: Energy Scenarios
365
with market-based instruments for environmental change is thatradical developments often proceed gradually from seemingly moderate policies, leading to major improvements over time. Butthey require continuity over decades so that the cumulative effects ofmoderate polices can result in radical change. These are some ofthe crucial characteristics of the three IIASA-WEC scenarios thatlead towards sustainable development.
Another central feature of these three scenarios is that adequateprovision of energy services and more equitable allocation ofresources are crucial for achieving sustainability. At the same time,energy use is a main cause of environmental degradation at allscales and so can inhibit the achievement of sustainability. Thusenvironmental protection—from indoor pollution to climatechange—is an essential element of sustainable development inthese scenarios. Rapid development and clean, efficient energy arecomplementary elements of most of the scenarios. The resolution ofthese future challenges offers a window of opportunity between nowand 2020. Because of the long lifetimes of power plants, refineries,and other energy investments, there is not a sufficient turnover ofsuch facilities to reveal large differences among the alternative scenarios presented here before 2020, but the seeds of the post-2020 world will have been sown by then.
The choice of the world’s future energy systems may be wide opennow. It will be a lot narrower by 2020, and certain developmentopportunities that are forgone now might not be achievable later.There may well be environmental irreversibilities, but technicalchanges may still take place, and it is a question of whether they willbe too late rather than whether they will occur at all. Perhaps moreimportant is the question of development initiatives directed at eradicating poverty, disease, and illiteracy in the world, and whetherthey will be timely and sufficient to offset currently inadequateefforts. The achievement of sustainable development dictates a global perspective, a very long time horizon, and immediate policymeasures that take into account the long lead times needed tochange the system. ■
Notes1. Table 9.2 provides a number of indicators that can be used to characterisethe achievement of sustainable development in energy scenarios andshows how the three scenarios selected for this assessment fare relativeto one another.
2. Energy prices are an important determinant in the short to mediumterm. But in the long term, technology and policy are more importantdeterminants, although important feedback mechanisms do exist—forexample, in the form of induced technical change. As a result future levelsof energy demand can vary widely, even for otherwise similar scenariocharacteristics, in terms of population and level of economic development.
ReferencesAlcamo, J., A. Bouwman, J. Edmonds, A. Grübler, T. Morita, and A. Sugandhy.
1995. “An Evaluation of the IPCC IS92 Emission Scenarios.” InHoughton, J.T., L.G. Meira Filho, J. Bruce, Hoesung Lee, B. A.Callander, E. Haites, N. Harris, and K. Maskell, eds., ClimateChange 1994: Radiative Forcing of Climate Change and AnEvaluation of the IPCC IS92 Emission Scenarios. Cambridge:Cambridge University Press for the Intergovernmental Panel onClimate Change.
Amann, M., J. Cofala, P. Dörfner, F. Gyarfas, and W. Schöpp. 1995.“Impacts of Energy Scenarios on Regional Acidifications.” In WECProject 4 on Environment, Working Group C, Local and RegionalEnergy Related Environmental Issues. London: World Energy Council.
Barro, R.J. 1997. Determinants of Economic Growth. Cambridge, Mass.:MIT Press.
Barro, R.J., and X. Sala-I-Martin. 1995. Economic Growth. New York:McGraw-Hill.
Bos, E., and M.T. Vu. 1994. World Population Projections: Estimates andProjections with Related Demographic Statistics, 1994-1995 Edition.Washington, D.C.: World Bank.
De Vries, B., J. Bollen, L. Bouwman, M. den Elzen, M. Janssen, and E.Kreileman. 2000. “Greenhouse Gas Emissions in an Equity-,Environment- and Service-Oriented World: An IMAGE-BasedScenario for the Next Century.” Technological Forecasting & SocialChange 63 (2–3).
Gallopin, G., A. Hammond, P. Raskin, and R. Swart. 1997. Branch Points.PoleStar Series Report 7. Boston: Stockholm Environment InstituteBoston Center.
Glenn, J.C., and T.J. Gordon, eds. 1997. “State of the Future: Implicationsfor Actions Today.” American Council for the United NationsUniversity, Millennium Project, Washington, D.C.
Goldemberg, J., T.B. Johansson, A.K. Reddy, and R.H. Williams. 1988.Energy for a Sustainable World. New Delhi: Wiley Eastern.
Grübler, A. 1994. “A Comparison of Global and Regional EnergyEmission Scenarios.” WP-94-132. International Institute forApplied Systems Analysis, Laxenburg, Austria.
———. 1998a. “A Review of Global and Regional Sulfur EmissionScenarios.” Mitigation and Adaptation Strategies for Global Change3 (2–4): 383–418.
———. 1998b. Technology and Global Change. Cambridge: CambridgeUniversity Press.
Hammond, A. 1998: Which World? Scenarios for the 21st Century,Global Destinies, Regional Choices. London: Earthscan.
Häfele, W., ed. 1981. Energy in a Finite World: A Global Systems Analysis.Cambridge, Mass.: Ballinger.
Hanke, T. 1995. “Die Märke spielen verrückt [in German].” Die Zeit 18: 33.
Houghton, J.T., L.G. Meira Filho, J. Bruce, Hoesung Lee, B. A. Callander,E. Haites, N. Harris, and K. Maskell, eds. 1995. Climate Change1994: Radiative Forcing of Climate Change and an Evaluation of theIPCC IS92 Emissions Scenarios. Cambridge: Cambridge UniversityPress for the Intergovernmental Panel on Climate Change.
Hulme, M. 1997. “Comment on the First Draft of the Sulfur DiscussionPaper.” Climate Research Unit, University of East Anglia, Norwich, U.K.
IEA (International Energy Agency). 1993. Cars and Climate Change.Paris: Organisation for Economic Co-operation and Development.
———. 1998. World Energy Outlook. Paris: Organisation for EconomicCo-operation and Development.
IIASA-WEC (International Institute for Applied Systems Analysis andWorld Energy Council). 1995. Global Energy Perspectives to 2050and Beyond. Laxenburg, Austria: International Institute for AppliedSystems Analysis.
Ishitani H., T.B. Johansson, S. Al-Khouli, H. Audus, E. Bertel and others.1996. “Energy Supply Mitigation Options.” In R.T. Watson, M.C.Zinyowera, and R.H. Moss, eds., Climate Change 1995—Impacts,Adaptation and Mitigation of Climate Change: Scientific Analysis.Cambridge University Press for the Intergovernmental Panel onClimate Change.
Johansson, T.B, H. Kelly, A.K.N. Reddy, and R.H. Williams. 1993.“Renewable Fuels and Electricity for a Growing World Economy:Defining and Achieving the Potential.” In T.B. Johansson, H. Kelly,A.K.N. Reddy, and R.H. Williams, ed., Renewable Energy: Sourcesfor Fuels and Electricity. Washington, D.C.: Island Press.

Kram, T., K. Riahi, R.A. Roehrl, S. van Rooijen, T. Morita, and B. de Vries.2000. “Global and Regional Greenhouse Gas EmissionsScenarios.” Technological Forecasting & Social Change 63 (2–3).
Lazarus, M.L., L. Greber, J. Hall, C. Bartels, S. Bernow, E. Hansen, P. Raskin,and D. von Hippel. 1993. Towards a Fossil Free Energy Future: The NextEnergy Transition. Technical Analysis for Greenpeace International.Boston: Stockholm Environmental Institute Boston Center.
Leggett, J., W.J. Pepper, and R.J. Swart. 1992. “Emissions Scenarios forIPCC: An Update.” In J.T. Houghton, B.A. Callander, and S.K.Varney, eds., Climate Change 1992: The Supplementary Report tothe IPCC Scientific Assessment. Cambridge: Cambridge UniversityPress for the Intergovernmental Panel on Climate Change.
Lutz, W., W. Sanderson, and S. Scherbov. 1997. “Doubling of WorldPopulation Unlikely.” Nature 387 (6635): 803–05.
Makarov, A.A. 1999. “Newly Independent States of the Former SovietUnion.” Paper prepared for the World Energy Assessment. UnitedNations Development Programme, New York.
Manne, A., and R. Richels. 1994. “The Costs of Stabilizing Global CO2Emissions: A Probabilistic Analysis Based on Expert Judgements.”Energy Journal 15 (1): 31–56.
Morita, T., and H.-C. Lee. 1998. “IPCC SRES Database, Version 0.1,Emission Scenario.” Database prepared for IPCC Special Report onEmissions Scenarios, http://www-cger.nies.go.jp/cger-e/db/ipcc.html
Nakicenovic, N. 1996. “Freeing Energy from Carbon.” Daedalus 125 (3):95–112.
———. 2000. “Greenhouse Gas Emissions Scenarios.” TechnologicalForecasting & Social Change 65 (3).
Nakicenovic, N., A. Grübler, and A. McDonald, eds. 1998. Global EnergyPerspectives. Cambridge: Cambridge University Press.
Nakicenovic, N., N. Victor, and T. Morita. 1998. “Emissions ScenariosDatabase and Review of Scenarios.” Mitigation and AdaptationStrategies for Global Change 3 (2–4): 95–120.
Nakicenovic, N., J. Alcamo, G. Davis, B. de Vries, J. Fenhann, and others.2000. Special Report on Emissions Scenarios by the IntergovernmentalPanel on Climate Change. Cambridge: Cambridge University Pressfor the Intergovernmental Panel on Climate Change.
Nordhaus, W.D., and G.W. Yohe. 1983. “Future Paths of Energy andCarbon Dioxide Emissions.” In W.A. Nierenberg, ed., ChangingClimate: Report of the Carbon Dioxide Assessment Committee.Washington, D.C.: National Academy Press.
Pepper, W.J., J. Leggett, R. Swart, J. Wasson, J. Edmonds, and I.Mintzer. 1992. “Emissions Scenarios for the IPCC. An Update:Assumptions, Methodology, and Results. Support Document forChapter A3.” In J.T. Houghton, B.A. Callandar, and S.K. Varney,eds., Climate Change 1992: Supplementary Report to the IPCCScientific Assessment. Cambridge: Cambridge University Press forthe Intergovernmental Panel on Climate Change.
Raskin, P., G. Gallopin, P. Gutman, A. Hammond, and R. Swart. 1998.Bending the Curve: Toward Global Sustainability. Report of theGlobal Scenario Group, PoleStar Series Report 8. Stockholm:Stockholm Environment Institute.
Rostow, W.W. 1990. The Stages of Economic Growth. 3rd edition.Cambridge: Cambridge University Press.
Schipper, L., and S. Meyers. 1992. Energy Efficiency and Human Activity:Past Trends, Future Prospects. Cambridge: Cambridge University Press.
Schwartz, P. 1991. The Art of the Longview: Three Global Scenarios to2005. New York: Doubleday.
Shell International Ltd. 1996. The Evolution of the World’s EnergySystems. The Hague: Shell International.
———. 1998. People and the Environment: The 1997 Shell InternationalExploration and Production Health, Safety and EnvironmentReport. The Hague: Shell International.
Smith, S.J., T.M.L. Wigley, N. Nakicenovic, and S.C.B. Raper.Forthcoming. “Climate Implications of Greenhouse Gas EmissionsScenarios.” Technological Forecasting & Social Change.
Solow, R. 1956. “A Contribution to the Theory of Economic Growth.”Quarterly Journal of Economics 70: 56–94.
Sørensen, B., B. Kuemmel, and P. Meibom. 1999. “Long-Term ScenariosGlobal Energy Demand and Supply.” IMFUFA [Department ofStudies in Mathematics and Physics and their Functions inEducation, Research and Applications], Roskilde University,Roskilde, Denmark.
Subak, S., M. Hulme, and L. Bohn. 1997. The Implications of FCCCProtocol Proposals for Future Global Temperature: ResultsConsidering Alternative Sulfur Forcing. CSERGE Working PaperGEC-97-19. Centre for Social and Economic Research on theGlobal Environment, University of East Anglia, Norwich, U.K.
Tol, R.S.J. 1995. “The Climate Fund Sensitivity, Uncertainty, andRobustness Analyses.” W-95/02, Institute for EnvironmentalStudies, Climate Framework. Vrije Universiteit, Amsterdam.
UN (United Nations). 1996. Annual Populations 1950–2050: The 1996Revision. New York: UN Population Division (data on diskettes).
———. 1997. United Nations Commission on Population and Development,Thirteenth Session, Report of the Secretary General on Progress onWork in the Field of Population in 1996. New York: United Nations.
———. 1998. World Population Projections to 2150. New York: PopulationDivision, UN Department of Economics and Social Affairs.
UNDP (United Nations Development Programme). 1997. HumanDevelopment Report 1997. Oxford: Oxford University Press.
UNFCCC (United Nations Framework Convention on Climate Change).1992. “United Nations Framework Convention on ClimateChange.” UNEP/WMO Information Unit of Climate Change (IUCC)on behalf of the Interim Secretariat of the Convention. IUCC,Geneva.
———. 1997. “Kyoto Protocol to the United Nations FrameworkConvention on Climate Change.” FCCC/CP/L7/Add.1, 10December 1997. United Nations, New York.
WBCSD (World Business Council for Sustainable Development). 1998.“Exploring Sustainable Development.” Geneva.
Wigley, T.M.L. 1999. “The Science of Climate Change. Global and U.S.Perspectives.” PEW Center on Global Climate Change, Arlington, Va.
WEC (World Energy Council). 1993. Energy for Tomorrow’s World. London:Kogan Page.
Zhou, F. 1999. “China’s Future Energy Scenario Analysis.” Paper preparedfor the World Energy Assessment. United Nations DevelopmentProgramme, New York.
WORLD ENERGY ASSESSMENT: ENERGY AND THE CHALLENGE OF SUSTAINABILITY
Chapter 9: Energy Scenarios
366