Chapter 10 - Colts Neck School District of 20 flips, you think you will flip heads 10 times. Check...
36
Chapter 10 Copyright © Big Ideas Learning, LLC Big Ideas Math Red Accelerated All rights reserved. Worked-Out Solutions 285 Chapter 10 Opener Try It Yourself (p. 399) 1. Baseballs 2 Footballs 6 3 1 = = So, the ratio of baseballs to footballs is 1 . 3 2. Footballs 6 3 Total pieces of equipment 8 4 = = So, the ratio of footballs to total pieces of equipment is 3 . 4 3. Sneakers 2 1 Ballet slippers 4 2 = = So, the ratio of sneakers to ballet slippers is 1 . 2 4. Sneakers 2 1 Total number of shoes 6 3 = = So, the ratio of sneakers to total number of shoes is 1 . 3 5. green beads 3 1 blue beads 6 2 = = The ratio of green beads to blue beads is 1 . 2 6. red beads 4 green beads 3 = The ratio of red beads to green beads is 4 . 3 7. green beads 3 1 total beads 15 5 = = The ratio of green beads to the total number of beads is 1 . 5 Section 10.1 10.1 Activity (pp. 400 –401) 1. a. There are 2 possible results. Out of 20 flips, you think you will flip heads 10 times. Check students’ work with tallies in a table and closeness of their guess. b. There are 5 possible results. Out of 20 spins, you think you will spin orange 4 times. Check students’ work with tallies in a table and closeness of their guess. c. There are 10 possible results. Out of 20 spins, you think you will spin a 4 two times. Check students’ work with tallies in a table and closeness of their guess. 2. a. an even number; Spinning an even number has 5 possible results: 2, 4, 6, 8, or 10. Spinning a multiple of 4 has only 2 possible results: 4 or 8. b. neither; Spinning an even number has 5 possible results: 2, 4, 6, 8, or 10. Spinning an odd number has 5 possible results: 1, 3, 5, 7, or 9. 3. a. Answer should include, but is not limited to: Students will work in pairs to play Rock Paper Scissors 30 times and record the results in a table. b. There are 9 possible outcomes because there are 9 results possible in the table. c. There are three ways Player A can win, three ways Player B can win, and three ways the players can tie. d. no; Each player has an equal chance of winning because there are three ways for each player to win. 4. Make a list or table that shows all possible results. 10.1 On Your Own (p. 403) 1. a. The possible outcomes are choosing A, B, C, D, E, F, G, H, I, J, and K. b. The favorable outcomes of choosing a vowel are choosing A, E, and I. 2. a. There are 8 marbles. So, there are 8 possible outcomes. b. There are 2 blue marbles. So, choosing blue can occur in 2 ways. c. There are 5 marbles that are not yellow. So, choosing not yellow can occur in 5 ways. The favorable outcomes of choosing not yellow are blue, blue, green, red, and purple. Player A Rock Paper Scissors Player B Rock Tie A wins B wins Paper B wins Tie A wins Scissors A wins B wins Tie consonants vowels B, C, D, F, G, H, J, K A, E, I yellow not yellow yellow, yellow, yellow blue, blue, green, red, purple blue not blue blue, blue green, red, purple, yellow, yellow, yellow
Transcript of Chapter 10 - Colts Neck School District of 20 flips, you think you will flip heads 10 times. Check...

Chapter 10
Copyright © Big Ideas Learning, LLC Big Ideas Math Red Accelerated All rights reserved. Worked-Out Solutions
285
Chapter 10 Opener Try It Yourself (p. 399)
1. Baseballs 2
Footballs 6 3
1= =
So, the ratio of baseballs to footballs is 1
.3
2. Footballs 6 3
Total pieces of equipment 8 4= =
So, the ratio of footballs to total pieces of equipment
is 3
.4
3. Sneakers 2 1
Ballet slippers 4 2= =
So, the ratio of sneakers to ballet slippers is 1
.2
4. Sneakers 2 1
Total number of shoes 6 3= =
So, the ratio of sneakers to total number of shoes is 1
.3
5. green beads 3 1
blue beads 6 2= =
The ratio of green beads to blue beads is 1
.2
6. red beads 4
green beads 3=
The ratio of red beads to green beads is 4
.3
7. green beads 3 1
total beads 15 5= =
The ratio of green beads to the total number of beads
is 1
.5
Section 10.1 10.1 Activity (pp. 400–401)
1. a. There are 2 possible results. Out of 20 flips, you think you will flip heads 10 times. Check students’ work with tallies in a table and closeness of their guess.
b. There are 5 possible results. Out of 20 spins, you think you will spin orange 4 times. Check students’ work with tallies in a table and closeness of their guess.
c. There are 10 possible results. Out of 20 spins, you think you will spin a 4 two times. Check students’ work with tallies in a table and closeness of their guess.
2. a. an even number; Spinning an even number has 5 possible results: 2, 4, 6, 8, or 10. Spinning a multiple of 4 has only 2 possible results: 4 or 8.
b. neither; Spinning an even number has 5 possible results: 2, 4, 6, 8, or 10. Spinning an odd number has 5 possible results: 1, 3, 5, 7, or 9.
3. a. Answer should include, but is not limited to: Students will work in pairs to play Rock Paper Scissors 30 times and record the results in a table.
b. There are 9 possible outcomes because there are 9 results possible in the table.
c.
There are three ways Player A can win, three ways Player B can win, and three ways the players can tie.
d. no; Each player has an equal chance of winning because there are three ways for each player to win.
4. Make a list or table that shows all possible results.
10.1 On Your Own (p. 403)
1. a. The possible outcomes are choosing A, B, C, D, E, F, G, H, I, J, and K.
b.
The favorable outcomes of choosing a vowel are choosing A, E, and I.
2. a. There are 8 marbles. So, there are 8 possible outcomes.
b.
There are 2 blue marbles. So, choosing blue can occur in 2 ways.
c.
There are 5 marbles that are not yellow. So, choosing not yellow can occur in 5 ways. The favorable outcomes of choosing not yellow are blue, blue, green, red, and purple.
Player A
Rock Paper Scissors
Play
er B
Rock Tie A wins B wins
Paper B wins Tie A wins
Scissors A wins B wins Tie
consonants vowels
B, C, D, F, G, H, J, K A, E, I
yellow not yellow
yellow, yellow, yellow blue, blue, green,red, purple
blue not blue
blue, blue green, red, purple,
yellow, yellow, yellow

Chapter 10
Big Ideas Math Red Accelerated Copyright © Big Ideas Learning, LLC Worked-Out Solutions All rights reserved. 286
10.1 Exercises (pp. 404–405)
Vocabulary and Concept Check
1. Rolling an even number on a number cube is an event because it is a collection of several outcomes.
2. Sample answer: An outcome is any of the possible results of an experiment, while a favorable outcome is an outcome of a specific event of the experiment.
Practice and Problem Solving
3. Because the spinner has 8 different numbers, there are 8 possible outcomes.
4.
There are 4 ways to spin an even number and 4 ways to spin an odd number.
5. The possible outcomes are choosing 1, 2, 3, 4, 5, 6, 7, 8, and 9.
6.
The favorable outcome is choosing a 6.
7.
The favorable outcomes of choosing an odd number are choosing 1, 3, 5, 7, and 9.
8.
The favorable outcomes of choosing a number greater than 5 are choosing 6, 7, 8, and 9.
9.
The favorable outcomes of choosing an odd number less than 5 are choosing 1 and 3.
10.
The favorable outcomes of choosing a number less than 3 are choosing 1 and 2.
11.
The favorable outcomes of choosing a number divisible by 3 are choosing 3, 6, and 9.
12. a. There are 2 blue marbles. So, choosing blue can occur in 2 ways.
b. The favorable outcomes of the event are blue and blue.
13. a. There is 1 green marble. So, choosing green can occur in 1 way.
b. The favorable outcome of the event is green.
14. a. There are 2 purple marbles. So, choosing purple can occur in 2 ways.
b. The favorable outcomes of the event are purple and purple.
15. a. There is 1 yellow marble. So, choosing yellow can occur in 1 way.
b. The favorable outcome of the event is yellow.
16. a.
There are 6 marbles that are not red. So, choosing not red can occur in 6 ways.
b. The favorable outcomes of the event are green, blue, blue, purple, purple, and yellow.
17. a.
There are 7 marbles that are not blue. So, choosing not blue can occur in 7 ways.
b. The favorable outcomes of the event are green, red, red, red, purple, purple, and yellow.
18. There are 7 marbles that are not purple, even though there are only 4 colors. Choosing not purple could be red, red, red, blue, blue, green, or yellow.
19.
There are 7 coins that are not Presidential Dollars. So, choosing not a Presidential Dollar can occur in 7 ways.
20. false; Spinning blue and spinning red have the same number of favorable outcomes on Spinner A.
even odd
2, 4, 6, 8 1, 3, 5, 7
6 not 6
6 1, 2, 3, 4, 5, 7, 8, 9
odd not odd
1, 3, 5, 7, 9 2, 4, 6, 8
greater than 5 not greater than 5
6, 7, 8, 9 1, 2, 3, 4, 5
odd number less than 5 not an odd number less than 5
1, 3 2, 4, 5, 6, 7, 8, 9
divisible by 3 not divisible by 3
3, 6, 9 1, 2, 4, 5, 7, 8
Presidential not Presidential
Presidential,Presidential,Presidential
Susan B. Anthony, Susan B. Anthony,Susan B Anthony, Susan B. Anthony,Susan B. Anthony, Kennedy, Kennedy
blue not blue
blue, blue green, red, red, red,
purple, purple, yellow
red not red
red, red, red green, blue, blue,
purple, purple, yellow
less than 3 not less than 3
1, 2 3, 4, 5, 6, 7, 8, 9

Chapter 10
Copyright © Big Ideas Learning, LLC Big Ideas Math Red Accelerated All rights reserved. Worked-Out Solutions
287
21. true; There are three blue sections and two green sections.
22. false; There are five possible outcomes when spinning Spinner A.
23. true; There are four red sections.
24. false; Spinning not green can occur in eight ways on Spinner B.
25. Because the events “choosing a rock CD” and “not choosing a rock CD” have the same number of favorable outcomes, half of the CDs must be rock CDs. So, there are 30 rock CDs.
26. There are 5 cards, so there are 5 possible outcomes. After choosing a card, there are 4 cards left. So, the number of possible outcomes changes to 4.
Fair Game Review
27. 1
10 51
10 1010 5
2
x
x
x
=
• = •
=
28. 60 20
760 7 20
420 20
21
nn
nn
=
• = •==
29. 1
3 361
36 363 36
12
w
w
w
=
• = •
=
30. 25 100
1725 100 17
25 1700
68
bbbb
=
• = •==
31. C;
( )( ) ( )( ) ( )( )2 2 2
2 12 6 2 12 5 2 6 5
144 120 60
324
S lw lh wh= + +
= + +
= + +=
The surface area of the rectangular prism is 2324 in.
Section 10.2 10.2 Activity (pp. 406–407)
1. a. Answer should include, but is not limited to: Students will write rules for a game that uses the given spinner. The rules should be written so players can clearly understand the object of the game.
b. Answer should include, but is not limited to: After playing the game and analyzing the outcome, students will determine if they should revise the rules that they wrote for the game in part (a).
c. yes; Each section measures 60°. When each section is the same size, it is equally likely to spin a given number. When you increase or decrease the angle of a section, you increase or decrease the likelihood of landing on that section because its area is changing.
d. Sample answer: Each section of the spinner is the same size. So, your friend has an equal chance of landing on any of the numbers.
2. a.
Section 3 measures 90° and makes up one-quarter of the spinner. Your chance of landing on 3 is greater than the other numbered sections.
b.
Section 2 measures 120° and makes up one-third of the spinner. Your chance of landing on 2 is greater than the other numbered sections.
Answer should include, but is not limited to: Students should explain that the rules still make sense, but the game is not fair because of the unequal sections.
3. The rules of the game are fair for Activities 1 and 2b. The sum of the angle measures for the odd numbered pie pieces is equal to the sum of the angle measures for the even numbered pie pieces, so there is an equal likelihood of the events happening. The rules of the game are not fair for Activity 2a. The sum of the angle measures for the odd numbered pie pieces is 195°, and the sum of the angle measures for the even numbered pie pieces is 165°. So, Player 1 has a better chance of winning.
4. Sample answer: You can describe an event as impossible, unlikely to occur, likely to occur, certain, or equally likely to happen or not happen.
5. It is impossible to spin an 8 in Activity 1 because the numbers on the spinner are only 1 through 6.
Angle 1 2 3 4 5 6
Measure 60° 60° 90° 45° 45° 60°
Angle 1 2 3 4 5 6
Measure 60° 120° 90° 45° 30° 15°
Chapter 10
Big Ideas Math Red Accelerated Copyright © Big Ideas Learning, LLC Worked-Out Solutions All rights reserved. 288
6. Sample answers: medical fields, weather forecasters, insurance policy writers, various sports managers.
10.2 On Your Own (pp. 408–409)
1. Because the probability of landing a jump on a
snowboard is 1
,2
it is equally likely to happen or not
happen.
2. Because the probability is 100%, it is certain that the temperature will be less than 120 F° tomorrow.
3. ( ) 4greater than 2
62
3
P =
=
The probability of rolling a number greater than 2 is 2
3or 66.7%.
4. The number cube has only the numbers 1 through 6. So, rolling a number 7 is impossible, and its probability is 0 or 0%.
5. ( ) number of short strawsshort
total number of straws1
15 7575 15
5
P
n
nn
=
=
==
There are 5 short straws.
10.2 Exercises (pp. 410–411)
Vocabulary and Concept Check
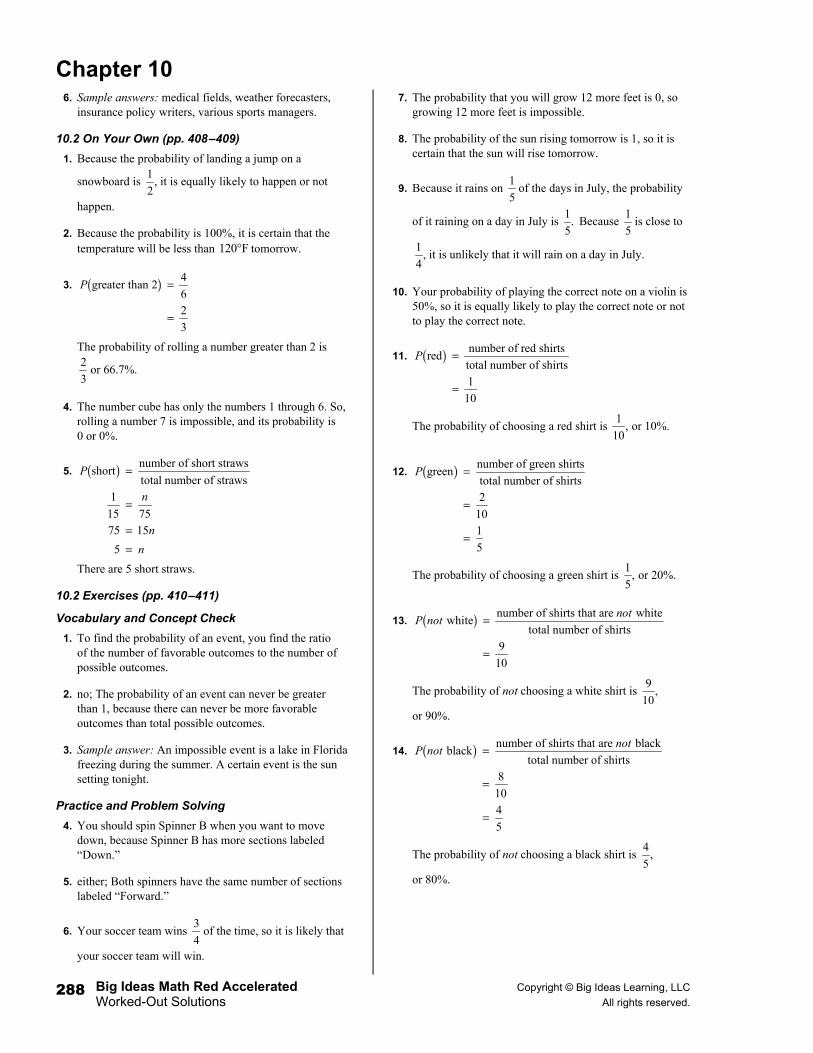
1. To find the probability of an event, you find the ratio of the number of favorable outcomes to the number of possible outcomes.
2. no; The probability of an event can never be greater than 1, because there can never be more favorable outcomes than total possible outcomes.
3. Sample answer: An impossible event is a lake in Florida freezing during the summer. A certain event is the sun setting tonight.
Practice and Problem Solving
4. You should spin Spinner B when you want to move down, because Spinner B has more sections labeled “Down.”
5. either; Both spinners have the same number of sections labeled “Forward.”
6. Your soccer team wins 3
4of the time, so it is likely that
your soccer team will win.
7. The probability that you will grow 12 more feet is 0, so growing 12 more feet is impossible.
8. The probability of the sun rising tomorrow is 1, so it is certain that the sun will rise tomorrow.
9. Because it rains on 1
5of the days in July, the probability
of it raining on a day in July is 1
.5
Because 1
5is close to
1,
4it is unlikely that it will rain on a day in July.
10. Your probability of playing the correct note on a violin is 50%, so it is equally likely to play the correct note or not to play the correct note.
11. ( ) number of red shirtsred
total number of shirts1
10
P =
=
The probability of choosing a red shirt is 1
,10
or 10%.
12. ( ) number of green shirtsgreen
total number of shirts2
101
5
P =
=
=
The probability of choosing a green shirt is 1
,5
or 20%.
13. ( ) number of shirts that are white white
total number of shirts9
10
notP not =
=
The probability of not choosing a white shirt is 9
,10
or 90%.
14. ( ) number of shirts that are black black
total number of shirts8
104
5
notP not =
=
=
The probability of not choosing a black shirt is 4
,5
or 80%.
Chapter 10
Copyright © Big Ideas Learning, LLC Big Ideas Math Red Accelerated All rights reserved. Worked-Out Solutions
289
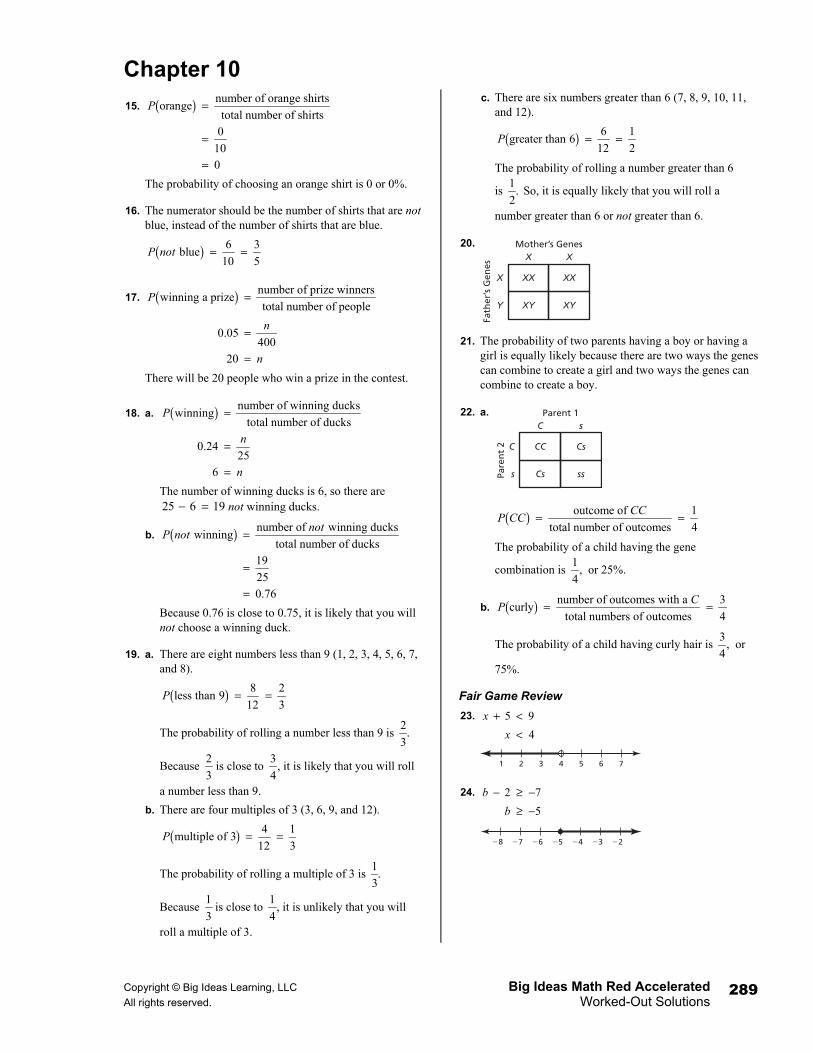
15. ( ) number of orange shirtsorange
total number of shirts0
100
P =
=
=
The probability of choosing an orange shirt is 0 or 0%.
16. The numerator should be the number of shirts that are not blue, instead of the number of shirts that are blue.
( ) 6 3 blue
10 5P not = =
17. ( ) number of prize winnerswinning a prize
total number of people
0.05400
20
P
n
n
=
=
=
There will be 20 people who win a prize in the contest.
18. a. ( ) number of winning duckswinning
total number of ducks
0.2425
6
P
n
n
=
=
=
The number of winning ducks is 6, so there are 25 6 19− = not winning ducks.
b. ( ) number of winning ducks winning
total number of ducks19
250.76
notP not =
=
=
Because 0.76 is close to 0.75, it is likely that you will not choose a winning duck.
19. a. There are eight numbers less than 9 (1, 2, 3, 4, 5, 6, 7, and 8).
( ) 8 2less than 9
12 3P = =
The probability of rolling a number less than 9 is 2
.3
Because 2
3is close to
3,
4it is likely that you will roll
a number less than 9.
b. There are four multiples of 3 (3, 6, 9, and 12).
( ) 4 1multiple of 3
12 3P = =
The probability of rolling a multiple of 3 is 1
.3
Because 1
3is close to
1,
4it is unlikely that you will
roll a multiple of 3.
c. There are six numbers greater than 6 (7, 8, 9, 10, 11, and 12).
( ) 6 1greater than 6
12 2P = =
The probability of rolling a number greater than 6
is 1
.2
So, it is equally likely that you will roll a
number greater than 6 or not greater than 6.
20.
21. The probability of two parents having a boy or having a girl is equally likely because there are two ways the genes can combine to create a girl and two ways the genes can combine to create a boy.
22. a.
( ) outcome of 1
total number of outcomes 4
CCP CC = =
The probability of a child having the gene
combination is 1
,4
or 25%.
b. ( ) number of outcomes with a 3curly
total numbers of outcomes 4
CP = =
The probability of a child having curly hair is 3
,4
or
75%.
Fair Game Review
23. 5 9
4
xx
+ <<
24. 2 7
5
bb
− ≥ −≥ −
Mother’s Genes
Fath
er’s
Gen
es
XXX
X
XX
XYY XY
X
Parent 1
Pare
nt
2 CCC
C
Cs
Css ss
s
3 4 51 2 6 7
−5 −4 −3−7 −6 −2−8
Chapter 10
Big Ideas Math Red Accelerated Copyright © Big Ideas Learning, LLC Worked-Out Solutions All rights reserved. 290
25. 13
3 , or
3
w
ww
> −
− <> −
26. 6 2
3 , or
3
gg
g
≤ −− ≥
≤ −
27. C; 46 135 86 360
267 360
93
xxx
+ + + =+ =
=
Section 10.3 10.3 Activity (pp. 412–413)
1. a. Check students’ work.
b. Check students’ work.
c. Check students’ work. Relative frequencies should get
closer to the probabilities of 1
.2
d. Check students’ work. Relative frequencies should get
closer to the probabilities of 1
.2
2. a. no; The relative frequencies can help you estimate the number of each type of chip in the bag, but you cannot be sure of the exact numbers.
b. Sample answer: 100 times; The greater the number of times you perform the experiment, the more accurate your approximations will be.
3. a. no; Just because there are two outcomes does not mean that each outcome is equally likely.
b. no; Each outcome is not equally likely. Check students’ work.
4. Sample answer: You can find the probability of an event occurring based on a relative frequency. You randomly draw a marble from a bag and replace it. You do this 50 times. You draw a red marble 25 times. So, the
probability of drawing a red marble is 1
,2
or 50%.
5. The probability of rolling an odd number is 1
,2
or 50%.
The relative frequency of rolling an odd number should
be close to 1
.2
So, your friend should roll an odd number
about 250 times.
6. Sample answer: Most likely this is true because there are only 20 chips in the bag and you did not select an orange chip in 50 tries. However, you cannot say this for certain because there may be 1 orange chip in the bag and you never selected it.
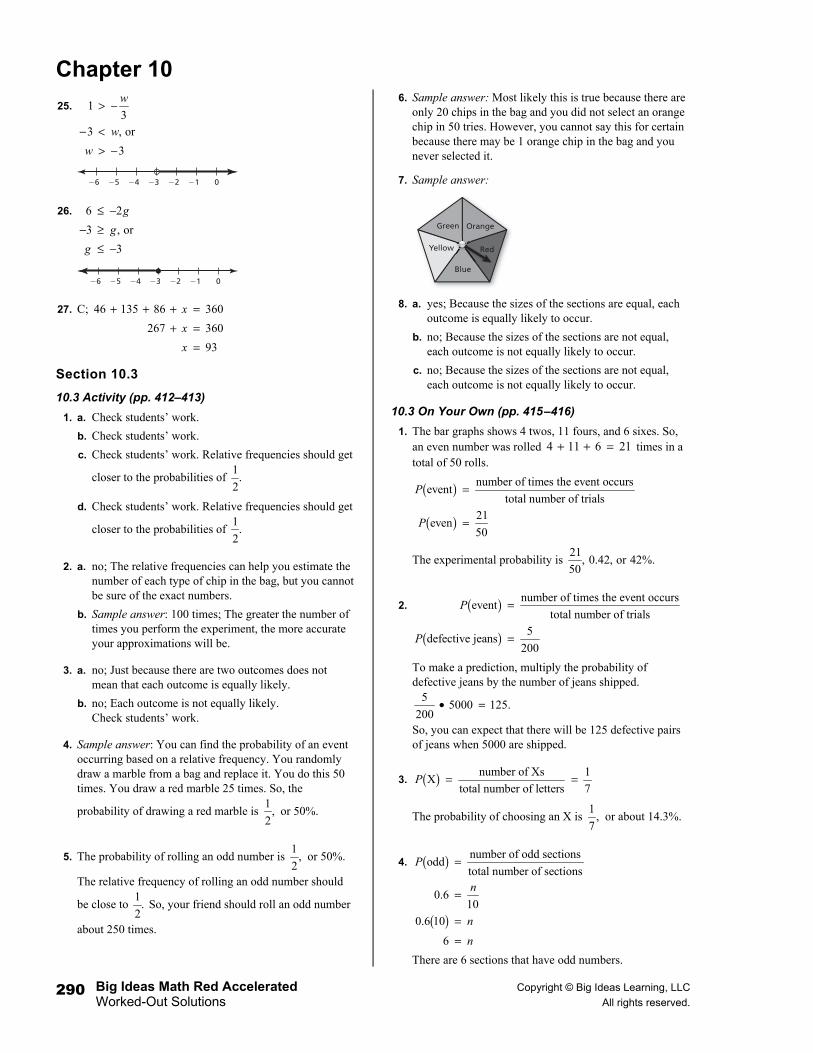
7. Sample answer:
8. a. yes; Because the sizes of the sections are equal, each outcome is equally likely to occur.
b. no; Because the sizes of the sections are not equal, each outcome is not equally likely to occur.
c. no; Because the sizes of the sections are not equal, each outcome is not equally likely to occur.
10.3 On Your Own (pp. 415–416)
1. The bar graphs shows 4 twos, 11 fours, and 6 sixes. So, an even number was rolled 4 11 6 21+ + = times in a total of 50 rolls.
( )
( )
number of times the event occursevent
total number of trials21
even50
P
P
=
=
The experimental probability is 21
, 0.42, or 42%.50
2. ( )
( )
number of times the event occursevent
total number of trials5
defective jeans200
P
P
=
=
To make a prediction, multiply the probability of defective jeans by the number of jeans shipped.
55000 125.
200• =
So, you can expect that there will be 125 defective pairs of jeans when 5000 are shipped.
3. ( ) number of Xs 1X
total number of letters 7P = =
The probability of choosing an X is 1
,7
or about 14.3%.
4. ( )
( )
number of odd sectionsodd
total number of sections
0.610
0.6 10
6
P
n
nn
=
=
=
=
There are 6 sections that have odd numbers.
−3 −2 −1−5 −4 0−6
−3 −2 −1−5 −4 0−6
Red
OrangeGreen
Yellow
Blue

Chapter 10
Copyright © Big Ideas Learning, LLC Big Ideas Math Red Accelerated All rights reserved. Worked-Out Solutions
291
5. 1
540 906
• =
You would expect 90 bobbleheads to be won.
6. The bar graphs shows 53 twos, 50 threes, 52 fours, 49 fives, and 48 sixes. So, a number greater than 1 was rolled 53 50 52 49 48 252+ + + + = times in a total of 300 rolls.
( )
( )
number of times the event occursevent
total number of trials252
greater than 130021
25
P
P
=
=
=
The experimental probability is 21
, or 84%.25
Because there are 5 possible outcomes for numbers greater than 1 on a number cube (2, 3, 4, 5, and 6), the theoretical probability of rolling a number greater than 1
is 5 1
83 %,6 3
= which is close to the experimental
probability.
10.3 Exercises (pp. 417–419)
Vocabulary and Concept Check
1. To find the experimental probability of an event, perform an experiment and find the ratio of the number of times the event occurs to the total number of trials in the experiment.
2. yes; You could flip tails 7 out of 10 times, but with more trials the probability of flipping tails should get closer to 0.5.
3. An event that has a theoretical probability of 0.5 means there is a 50% chance you will get a favorable outcome.
4. Sample answer: The theoretical probability of spinning red on a spinner with four equal sections colored red,
blue, green, and yellow is 1
.4
5. Because the pollster surveys only a subset of the population, experimental probability should be used. The pollster cannot find theoretical probability without surveying every person who will participate in the election.
Practice and Problem Solving
6. The total number of times the spinner was spun is 8 6 9 11 9 7 50.+ + + + + =
number of times 6 spun 7
relative frequencytotal number of spins 50
= =
The relative frequency of spinning a 6 is 7
,50
or 14%.
7. An even number was spun 6 11 7 24+ + = times.
number of times an even number spunrelative frequency
total number of spins
24
5012
25
=
=
=
The relative frequency of spinning an even number is 12
,25
or 48%.
8. A number less than 3 was spun 8 6 14+ = times.
( ) number of times less than 3 spunless than 3
total number of spins
14
507
25
P =
=
=
The experimental probability of spinning a number less
than 3 is 7
,25
or 28%.
9. The total number of times a number that is not 1 was spun is 6 9 11 9 7 42.+ + + + =
( ) number of times 1 spun 42 21 1
total number of spins 50 25
notP not = = =
The experimental probability of not spinning a 1 is 21
,25
or 84%.
10. A 1 or a 3 was spun 8 9 17+ = times.
( ) number of times a 1 or a 3 spun 171 or 3
total number of spins 50P = =
The experimental probability of spinning a 1 or a 3 is 17
,50
or 34%.
11. ( ) number of times 7 spun 07 0
total number of spins 50P = = =
The experimental probability of spinning a 7 is 0, or 0%.
12. ( )at least 1 cracked egg
number of cartons with at least 1 cracked egg
total number of cartons checked3
20
P
=
=
The experimental probability that a carton of eggs has at
least one cracked egg is 3
,20
or 15%.

Chapter 10
Big Ideas Math Red Accelerated Copyright © Big Ideas Learning, LLC Worked-Out Solutions All rights reserved. 292
13. ( ) number of vowels chosen 3vowels
total number of letters chosen 7P = =
3
105 457
• =
You can expect 45 tiles to be vowels.
14. ( ) number of cards chosen with flowers 1flowers
total number of cards chosen 4P = =
1
20 54
• =
You can expect 5 cards to have flowers on them.
15. ( ) number of red sections 2 1red
total number of sections 6 3P = = =
The probability of spinning red is 1
,3
or about 1
33 %.3
16. ( ) number of sections with 1 11
total number of sections 6P = =
The probability of spinning a 1 is 1
,6
or 2
16 %.3
17. ( ) number of odd sections 3 1odd
total number of section 6 2P = = =
The probability of spinning an odd number is 1
,2
or 50%.
18. ( )multiple of 2
number of sections with a multiple of 2
total number of sections3
61
2
P
=
=
=
The probability of spinning a multiple of 2 is 1
,2
or 50%.
19. ( ) number of sections less than 7less than 7
total number of sections6
61
P =
=
=
The probability of spinning a number less than 7 is 1, or 100%.
20. ( ) number of sections with 9 09 0
total number of sections 6P = = =
The probability of spinning a 9 is 0, or 0%.
21. ( ) number of letters Z 25letter except Z
total number of letters 26
notP = =
The probability of choosing any letter except Z is 25
,26
or
about 96.2%.
22. ( ) number of strikesstrike
total number of chips
3 9
103 9 10
3 90
30
P
nnnn
=
=
• = •==
There are 30 chips in the bag.
23. ( )
( )
pop songs playedpop song
total songs played
0.4580
0.45 80
36
P
n
n
n
=
=
=
=
There are 36 pop songs on your MP3 player.
24. a. ( ) number of femalesfemale
total number in class16
16 2016
364
9
P =
=+
=
=
The probability of randomly choosing a female is 4
,9
or about 44.4%.
b. ( ) number of femalesfemale
total number in class4
9 454 45 9
180 9
20
P
f
ff
f
=
=
• = •==
Number of males 45 20 25= − =
So, 25 20 5− = males joined the class.
Chapter 10
Copyright © Big Ideas Learning, LLC Big Ideas Math Red Accelerated All rights reserved. Worked-Out Solutions
293
25. ( ) number of “4” spins 374
total number of spins 200P = =
The experimental probability of spinning a 4 is 37
,200
or 18.5%.
( ) number of “4” sections 14
total number of sections 5P = =
The theoretical probability of spinning a 4 is 1
,5
or 20%.
The experimental probability is close to the theoretical probability.
26. ( ) number of “3” spins 393
total number of spins 200P = =
The experimental probability of spinning a 3 is 39
,200
or 19.5%.
( ) number of “3” sections 13
total number of sections 5P = =
The theoretical probability of spinning a 3 is 1
,5
or 20%.
The experimental probability is very close to the theoretical probability.
27. ( ) number of spins greater than 4greater than 4
total number of spins
40
2001
5
P =
=
=
The experimental probability of spinning a number
greater than 4 is 1
,5
or 20%.
( ) number of sections greater than 4greater than 4
total number of sections1
5
P =
=
The theoretical probability of spinning a number greater
than 4 is 1
,5
or 20%.
The experimental and theoretical probabilities are equal.
28. theoretical; Spinning the spinner 10,000 times is very time consuming if using experimental probability.
29. a. ( ) number of TT’s 1TT
number of trials 12P = =
The experimental probability of flipping two tails is 1
,12
or 1
8 %.3
( ) expected number of TT’sTT
total number of trials1
12 600600 12
50
P
n
nn
=
=
==
You can expect to flip two tails 50 times in 600 trials.
b. ( ) number of TT’s 22 11TT
number of trials 100 50P = = =
The experimental probability of flipping two tails is 11
,50
or 22%.
( ) expected number of TT’sTT
total number of trials11
50 60011
600 60050 600
132
P
n
n
n
=
=
• = •
=
You can expect to flip two tails 132 times in 600 trials.
c. Sample answer: A larger number of trials should result in a more accurate probability, which gives a more accurate prediction.

Chapter 10
Big Ideas Math Red Accelerated Copyright © Big Ideas Learning, LLC Worked-Out Solutions All rights reserved. 294
30. ( ) number of times sum of 2 rolled 2 12
total number of rolls 60 30P = = =
( ) number of times sum of 3 rolled 4 13
total number of rolls 60 15P = = =
( ) number of times sum of 4 rolled 5 14
total number of rolls 60 12P = = =
( ) number of times sum of 5 rolled 6 15
total number of rolls 60 10P = = =
( ) number of times sum of 6 rolled 136
total number of rolls 60P = =
( ) number of times sum of 7 rolled 10 17
total number of rolls 60 6P = = =
( ) number of times sum of 8 rolled 6 18
total number of rolls 60 10P = = =
( ) number of times sum of 9 rolled 8 29
total number of rolls 60 15P = = =
( ) number of times sum of 10 rolled 2 110
total number of rolls 60 30P = = =
( ) number of times sum of 11 rolled 3 111
total number of rolls 60 20P = = =
( ) number of times sum of 12 rolled 112
total number of rolls 60P = =
Each sum is not equally likely because they do not have the same outcomes. The event with the greatest experimental probability is rolling a sum of 6. So, a sum of 6 is most likely.
31. ( ) number of favorable outcomes 12
number of possible outcomes 36P = =
( ) number of favorable outcomes 2 13
number of possible outcomes 36 18P = = =
( ) number of favorable outcomes 3 14
number of possible outcomes 36 12P = = =
( ) number of favorable outcomes 4 15
number of possible outcomes 36 9P = = =
( ) number of favorable outcomes 56
number of possible outcomes 36P = =
( ) number of favorable outcomes 6 17
number of possible outcomes 36 6P = = =
( ) number of favorable outcomes 58
number of possible outcomes 36P = =
( ) number of favorable outcomes 4 19
number of possible outcomes 36 9P = = =
( ) number of favorable outcomes 3 110
number of possible outcomes 36 12P = = =
( ) number of favorable outcomes 2 111
number of possible outcomes 36 18P = = =
( ) number of favorable outcomes 112
number of possible outcomes 36P = =
Each sum is not equally likely because they do not have the same outcomes. The event with the greatest probability is rolling a sum of 7. So, a sum of 7 is most likely.
32. The experimental and theoretical probabilities from Exercises 30 and 31 are similar.
33. a. Sample answer: After 500 trials, you would expect a sum of 6, 7, or 8 to be most likely. After 1000 or 10,000 trials, a sum of 7 would probably be most likely.
b. As the number of trials increases, the experimental probability approaches the theoretical probability.
34. a. Check students’ work. The cup should land on its side most of the time.
b. Check students’ work.
c. Check students’ work.
d. more likely; Due to the added weight, the cup will be more likely to hit open-end up and thus more likely to land open-end up. Some students may justify by performing multiple trials with a quarter taped to the bottom of the cup.
Chapter 10
Copyright © Big Ideas Learning, LLC Big Ideas Math Red Accelerated All rights reserved. Worked-Out Solutions
295
Fair Game Review
35.
( )( )16 200 2
16 400
0.04
I Prt
r
rr
=
=
==
The annual interest rate is 0.04, or 4%.
36.
( ) 1826.25 500
12
26.25 750
0.035
I Prt
r
rr
=
=
==
The annual interest rate is 0.035, or 3.5%.
37. D;3 3
3 3 33
3 ft 27 ft9 yd 9 yd 243 ft
1 yd 1 yd
× = × =
Section 10.4 10.4 Activity (pp. 420–421)
1. a. 000; 999; 1000
b. 10; 10; 10; Sample answer: Multiply to find the total number of possible combinations: 10 10 10 1000• • = combinations.
c. 40 40 40 64,000• • = combinations
d. 10 10 10 10 10,000• • • = combinations
e. The lock in part (c) is most difficult to guess because it has the greatest number of possible combinations compared to the other two locks.
2. a. There are 10 choices for each digit.
10 10 10 10 10,000• • • =
There are 10,000 possible passwords.
b. There are 10 choices for each digit.
10 10 10 10 10 100,000• • • • =
There are 100,000 possible passwords.
c. There are 26 choices for each letter.
26 26 26 26 26 26 308,915,776• • • • • =
There are 308,915,776 possible passwords.
d. There are 26 10 36+ = choices for each character.
36 36 36 36 36 36 36 36
2,821,109,907,456
• • • • • • •=
There are 2,821,109,907,456 possible passwords.
The password requirement in part (d) in most secure because it has the greatest number of possible passwords.
3. Sample answer: You can use an organized list, a table, a tree diagram, or multiplication.
4. a. 10,000 passswords1 min
600 passwords×
16.7 minutes≈
It could take up to 16.7 minutes, or 16 minutes 40 seconds to guess the password.
b. 100,000 passswords1 min×
600 passwords
1 h
60 min×
2.8 hours≈
It could take up to 2.8 hours to guess the password.
c. 308,915,776 passswords1 min×
600 passwords
1 h ×60 min
1 day
24 h×
357.5 days≈
It could take up to 357.5 days to guess the password.
d. 2,821,109,907,456 passswords1 min×
600 passwords
1 h ×60 min
1 day×
24 h
1 yr 365 days
×
8945.7 years≈
It could take up to 8945.7 years to guess the password.
10.4 On Your Own (pp. 422–424)
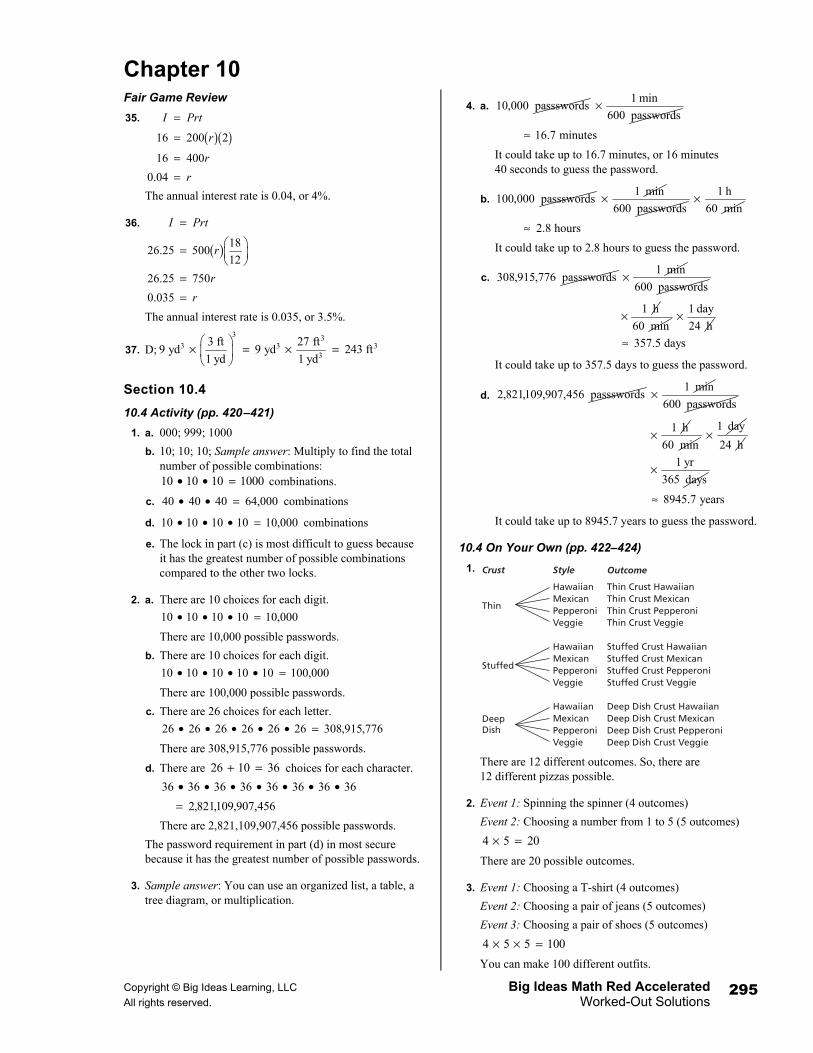
1.
There are 12 different outcomes. So, there are 12 different pizzas possible.
2. Event 1: Spinning the spinner (4 outcomes)
Event 2: Choosing a number from 1 to 5 (5 outcomes)
4 5 20× =
There are 20 possible outcomes.
3. Event 1: Choosing a T-shirt (4 outcomes)
Event 2: Choosing a pair of jeans (5 outcomes)
Event 3: Choosing a pair of shoes (5 outcomes)
4 5 5 100× × =
You can make 100 different outfits.
Thin
Thin Crust HawaiianThin Crust MexicanThin Crust PepperoniThin Crust Veggie
Crust Style Outcome
HawaiianMexicanPepperoniVeggie
Stuffed
Stuffed Crust HawaiianStuffed Crust MexicanStuffed Crust PepperoniStuffed Crust Veggie
HawaiianMexicanPepperoniVeggie
DeepDish
Deep Dish Crust HawaiianDeep Dish Crust MexicanDeep Dish Crust PepperoniDeep Dish Crust Veggie
HawaiianMexicanPepperoniVeggie

Chapter 10
Big Ideas Math Red Accelerated Copyright © Big Ideas Learning, LLC Worked-Out Solutions All rights reserved. 296
4. There are four favorable outcomes in the sample space for rolling at most 4 and flipping heads: 1H, 2H, 3H and 4H.
( )
( )
number of favorable outcomesevent
number of possible outcomes
4at most 4 and heads
121
3
P
P
=
=
=
The probability is 1 1
, or 33 %.3 3
5. There are four favorable outcomes in the sample space for flipping at least two tails: HTT, THT, TTH, and TTT.
( )
( )
number of favorable outcomesevent
number of possible outcomes
4at least 2 tails
81
2
P
P
=
=
=
The probability is 1
, or 50%.2
6. Using the table from Exercise #31 of Section 10.3, there is one favorable outcome in the sample space for rolling double threes.
( )
( )
number of favorable outcomesevent
number of possible outcomes
1double threes
36
P
P
=
=
The probability is 1 7
, or 2 %.36 9
7. There is one favorable outcome in the sample space for choosing a stuffed crust Hawaiian pizza.
( )
( )
number of favorable outcomesevent
number of possible outcomes
1double threes
8
P
P
=
=
The probability is 1 1
, or 12 %.8 2
10.4 Exercises (pp. 425–427)
Vocabulary and Concept Check
1. A sample space is the set of all possible outcomes of an event. Use a table or tree diagram to list all the possible outcomes.
2. To use the Fundamental Counting Principle, first identify the number of possible outcomes for each event. Then the total number of possible outcomes is the product of these numbers.
3. One way is to use a tree diagram to find the total number of possible outcomes. Another way is to use the Fundamental Counting Principle by finding the number of possible outcomes of spinning the spinner and multiplying it by the number of possible outcomes of rolling the number cube. The total number of possible outcomes is 30.
4. Sample answer: An example of a compound event is drawing two names out of a hat.
Practice and Problem Solving
5. Event 1: Choosing a number from 0 to 49 (50 outcomes)
Event 2: Choosing a number from 0 to 49 (50 outcomes)
Event 3: Choosing a number from 0 to 49 (50 outcomes)
50 50 50 125,000× × =
There are 125,000 possible combinations for the lock.
6.
There are 6 possible outcomes for the birthday party.
7.
There are 8 possible outcomes for the new school mascot.
8. Event 1: There are 3 possible sizes.
Event 2: There are 7 possible flavors.
3 7 21× =
There are 21 possible beverages.
9. Event 1: There are 4 possible amounts of memory.
Event 2: There are 5 possible colors.
4 5 20× =
There are 20 possible types of MP3 players.
10. Event 1: There are 3 possible suits.
Event 2: There are 2 possible wigs.
Event 3: There are 4 possible talents.
3 2 4 24× × =
There are 24 possible types of clowns.
MiniatureGolf
Miniature Golf, 1 P.M. – 3 P.M.
Miniature Golf, 6 P.M. – 8 P.M.
Event Time Outcome
1 P.M. – 3 P.M.
6 P.M. – 8 P.M.
Laser Tag, 1 P.M. – 3 P.M.
Laser Tag, 6 P.M. – 8 P.M.
1 P.M. – 3 P.M.
6 P.M. – 8 P.M.
Roller Skating, 1 P.M. – 3 P.M.
Roller Skating, 6 P.M. – 8 P.M.
1 P.M. – 3 P.M.
6 P.M. – 8 P.M.
RollerSkating
LaserTag
LionRealistic lionCartoon lion
Type Style Outcome
RealisticCartoon
Realistic bearCartoon bear
RealisticCartoon
Realistic hawkCartoon hawk
RealisticCartoon
Realistic dragonCartoon dragon
RealisticCartoon
Bear
Hawk
Dragon
Chapter 10
Copyright © Big Ideas Learning, LLC Big Ideas Math Red Accelerated All rights reserved. Worked-Out Solutions
297
11. Event 1: There are 5 possible appetizers.
Event 2: There are 4 possible entrées.
Event 3: There are 3 possible desserts.
5 4 3 60× × =
There are 60 possible different meals.
12. Method 1:
The store sells a total of 9 different note cards.
Method 2: Event 1: There are 3 possible types.
Event 2: There are 3 possible sizes.
3 3 9× =
The store sells a total of 9 different note cards.
13. The total number of outcomes is the product of the possible outcomes of each event, not the sum.
Event 1: Question 1 (2 possible answers)
Event 2: Question 2 (2 possible answers)
Event 3: Question 3 (2 possible answers)
Event 4: Question 4 (2 possible answers)
Event 5: Question 5 (2 possible answers)
2 2 2 2 2 32× × × × =
The quiz can be answered 32 different ways.
14. a. Use a tree diagram or the Fundamental Counting Principle.
b. Let G green, B blue, R red, and Y yellow.= = = =
There are 12 possible outcomes.
Using the Fundamental Counting Principle, there are 4 possible outcomes for choosing the first marble, and 3 possible outcomes for choosing the second marble. So, there are 4 3 12× = possible outcomes.
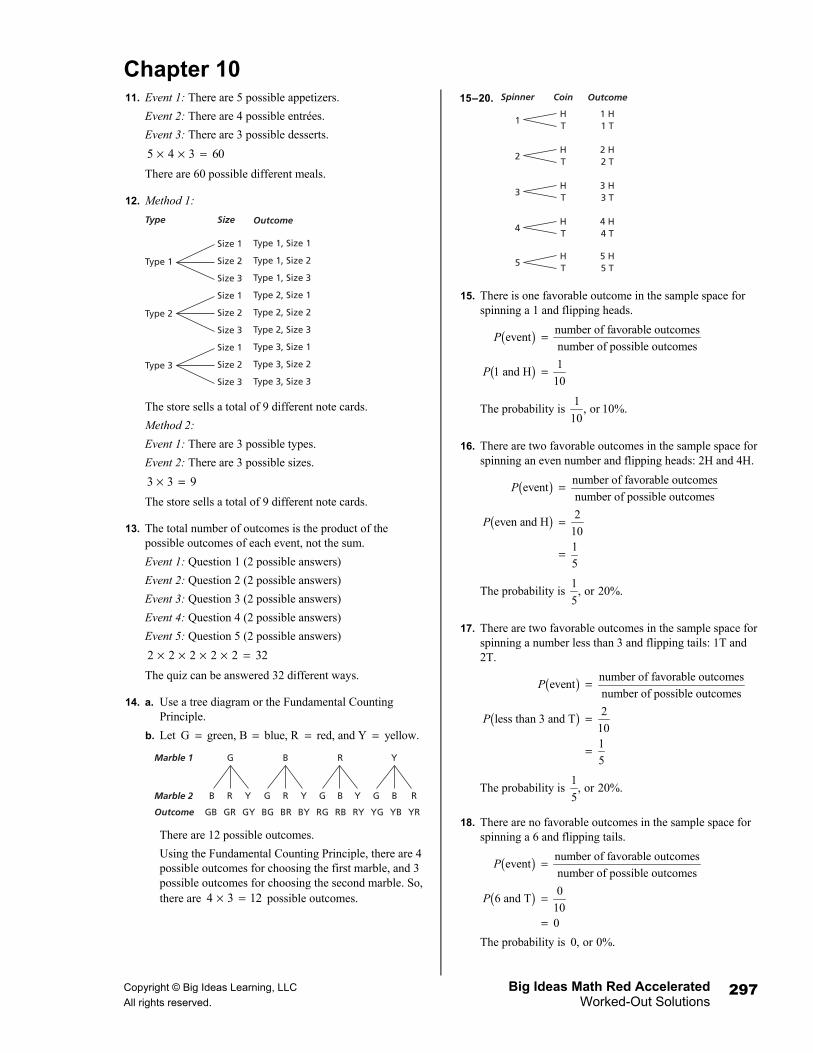
15–20.
15. There is one favorable outcome in the sample space for spinning a 1 and flipping heads.
( )
( )
number of favorable outcomesevent
number of possible outcomes
11 and H
10
P
P
=
=
The probability is 1
, or 10%.10
16. There are two favorable outcomes in the sample space for spinning an even number and flipping heads: 2H and 4H.
( )
( )
number of favorable outcomesevent
number of possible outcomes
2even and H
101
5
P
P
=
=
=
The probability is 1
, or 20%.5
17. There are two favorable outcomes in the sample space for spinning a number less than 3 and flipping tails: 1T and 2T.
( )
( )
number of favorable outcomesevent
number of possible outcomes
2less than 3 and T
101
5
P
P
=
=
=
The probability is 1
, or 20%.5
18. There are no favorable outcomes in the sample space for spinning a 6 and flipping tails.
( )
( )
number of favorable outcomesevent
number of possible outcomes
06 and T
100
P
P
=
=
=
The probability is 0, or 0%.
Type 1
Type 1, Size 1
Type 1, Size 2
Type 1, Size 3
Type 2, Size 1
Type 2, Size 2
Type 2, Size 3
Type 3, Size 1
Type 3, Size 2
Type 3, Size 3
Type Size Outcome
Size 1
Size 2
Size 3
Size 1
Size 2
Size 3
Size 1
Size 2
Size 3
Type 2
Type 3
GMarble 1
Marble 2
Outcome
R
BR BY
G
BG
Y
B
R
GR GY
B
GB
Y
R
G
RG RY
B
RB
Y
Y
G
YG YR
B
YB
R
11 H1 T
Spinner Coin Outcome
HT
2 H2 T
HT
3 H3 T
HT
4 H4 T
HT
2
3
4
5 H5 T
HT5

Chapter 10
Big Ideas Math Red Accelerated Copyright © Big Ideas Learning, LLC Worked-Out Solutions All rights reserved. 298
19. There are four favorable outcomes in the sample space for not spinning a 5 and flipping heads: 1H, 2H, 3H, and 4H.
( )
( )
number of favorable outcomesevent
number of possible outcomes
4not spinning 5 and H
102
5
P
P
=
=
=
The probability is 2
, or 40%.5
20. There are three favorable outcomes in the sample space for spinning a prime number and not flipping heads: 2T, 3T, and 5T.
( )
( )
number of favorable outcomesevent
number of possible outcomes
3prime and not H
10
P
P
=
=
The probability is 3
, or 30%.10
21–24.
21. There is one favorable outcome in the sample space for spinning blue, flipping heads, then spinning a 1.
( )
( )
number of favorable outcomesevent
number of possible outcomes
1blue then H then 1
18
P
P
=
=
The probability is 1 5
, or 5 %.18 9
22. There are two favorable outcomes in the sample space for spinning an odd number, flipping heads, then spinning yellow: 1H-yellow, and 3H-yellow.
( )
( )
number of favorable outcomesevent
number of possible outcomes
2odd then H then yellow
181
9
P
P
=
=
=
The probability is 1 1
, or 11 %.9 9
23. There are two favorable outcomes in the sample space for spinning an even number, flipping tails, then spinning an odd number: 2T1 and 2T3.
( )
( )
number of favorable outcomesevent
number of possible outcomes
2odd then H then yellow
181
9
P
P
=
=
=
The probability is 1 1
, or 11 %.9 9
24. There are four favorable outcomes in the sample space for not spinning red, flipping tails, then not spinning an even number: blue-T1, blue-T3, yellow-T1, and yellow-T3.
( )
( )
number of favorable outcomesevent
number of possible outcomes
4not red then T then not even
182
9
P
P
=
=
=
The probability is 2 2
, or 22 %.9 9
25. a. Event 1: There are 3 possible choices.
Event 2: There are 3 possible choices.
3 3 9× =
There are 9 possible outcomes, but only one way to guess both answers correctly.
( )
( )
number of favorable outcomesevent
number of possible outcomes
1both correct
9
P
P
=
=
The probability that you guess the correct answers to
both questions is 1
,9
or about 11.1%.
H
1 (red), H, 1 (red)
1 (red), H, 2 (blue)
1 (red), H, 3 (yellow)
1 (red), T, 1 (red)
1 (red), T, 2 (blue)
1 (red), T, 3 (yellow)
CoinSpinner Spinner Outcome
1 (red)
2 (blue)
3 (yellow)
1 (red)
2 (blue)
3 (yellow)
1 (red)
T
H
2 (blue), H, 1 (red)
2 (blue), H, 2 (blue)
2 (blue), H, 3 (yellow)
2 (blue), T, 1 (red)
2 (blue), T, 2 (blue)
2 (blue), T, 3 (yellow)
1 (red)
2 (blue)
3 (yellow)
1 (red)
2 (blue)
3 (yellow)
2 (blue)
T
H
3 (yellow), H, 1 (red)
3 (yellow), H, 2 (blue)
3 (yellow), H, 3 (yellow)
3 (yellow), T, 1 (red)
3 (yellow), T, 2 (blue)
3 (yellow), T, 3 (yellow)
1 (red)
2 (blue)
3 (yellow)
1 (red)
2 (blue)
3 (yellow)
3 (yellow)
T

Chapter 10
Copyright © Big Ideas Learning, LLC Big Ideas Math Red Accelerated All rights reserved. Worked-Out Solutions
299
b. If you can eliminate one of the choices for each question, then you have two choices left to choose from for each question.
Event 1: There are 2 possible choices.
Event 2: There are 2 possible choices.
2 2 4× =
There are 4 possible outcomes, but only one way to guess both answers correctly.
( )
( )
number of favorable outcomesevent
number of possible outcomes
1both correct
4
P
P
=
=
The probability increases to 1
,4
or 25%.
26. a. Event 1: There are 10 possible choices.
Event 2: There are 10 possible choices.
10 10 100× = There are 100 possible outcomes, but only one way to
guess both digits correctly.
( )
( )
number of favorable outcomesevent
number of possible outcomes
1both correct
100
P
P
=
=
The probability that your choice is correct is 1
,100
or 1%.
b. Because you know the digits are even, you have 5 choices for each digit.
Event 1: There are 5 possible choices.
Event 2: There are 5 possible choices.
5 5 25× =
There are 25 possible outcomes, but only one way to guess both digits correctly.
( )
( )
number of favorable outcomesevent
number of possible outcomes
1both digits
25
P
P
=
=
The probability increases to 1
,25
or 4%.
27. a. Event 1: There are 10 possible choices.
Event 2: There are 10 possible choices.
Event 3: There are 10 possible choices.
10 10 10 1000× × =
There are 1000 possible outcomes, but only one way to guess all three digits correctly.
( )
( )
number of favorable outcomesevent
number of possible outcomes
1correctly guessed
1000
P
P
=
=
The probability that your choice is correct is 1
,1000
or 0.1%.
b. There are 1000 possible combinations. With 5 tries, you would guess 5 out of the 1000 possibilities. So, the probability of getting the correct combination is 5/1000, or 0.5%.
28. Event 1: 1 possible engine in the first position
Event 2: 8 possible train cars in the second position
Event 3: 7 possible train cars in the third position
Event 4: 6 possible train cars in the fourth position
Event 5: 5 possible train cars in the fifth position
Event 6: 4 possible train cars in the sixth position
Event 7: 3 possible train cars in the seventh position
Event 8: 2 possible train cars in the eighth position
Event 9: 1 possible train car in the ninth position
1 8 7 6 5 4 3 2 1 40,320× × × × × × × × =
The train can be arranged 40,320 ways.
29. a. There are 9 events, and each event has 10 possible outcomes, so a tree diagram would be too large.
b. 10 10 10 10 10 10 10 10 10
1,000,000,000
× × × × × × × ×=
There are 1 billion identification numbers possible.
c. Answer should include, but is not limited to: Students will explain that certain number combinations are not valid for Social Security numbers. For example, the first three digits cannot be a number in the 800’s or 900’s. Also, the first three digits cannot all be zeros, the fourth and fifth digits cannot both be zeros, and the sixth through the ninth digits cannot all be zeros.
30. 10; Let the 5 candidates be represented by A, B, C, D, and E. Then, a committee of 3 people could be one of the 10 following ways: ABC, ABD, ABE, ACD, ACE, ADE, BCD, BCE, BDE, and CDE. Order does not matter.

Chapter 10
Big Ideas Math Red Accelerated Copyright © Big Ideas Learning, LLC Worked-Out Solutions All rights reserved. 300
Fair Game Review
31. Sample answers: adjacent: and , and XWY ZWY XWY XWV∠ ∠ ∠ ∠vertical: and , and VWX YWZ YWX VWZ∠ ∠ ∠ ∠
32. Sample answers: adjacent: and , and LJM LJK LJM NJM∠ ∠ ∠ ∠
vertical: and , and KJL PJN PJQ MJL∠ ∠ ∠ ∠
33. B; 1 cm 1 cm
1 cm : 1 m1 m
= =100 cm
1 : 100=
Section 10.5 10.5 Activity (pp. 428–429)
1. a.
( ) number of favorable outcomesgreen, green
number of possible outcomes
4
9
P =
=
The probability that both marbles are green is 4
.9
b. no; The probability of getting a green marble on the second draw does not depend on the color of the first marble because the probability of getting a green marble is the same for both draws.
2. a.
( ) number of favorable outcomesgreen, green
number of possible outcomes
2
6
1
3
P =
=
=
The probability that both marbles are green is 1
.3
This event is not more likely than the event in
Activity 1 because the probability of 1
3 is not
greater than the probability of 4
.9
b. yes; The probability of getting a green marble on the second draw depends on the color of the first marble because if a green marble is drawn first, then there is a 50% chance of drawing a green marble on the second draw. If a purple marble is drawn first, then there is a 100% chance of drawing a green marble on the second draw.
3. a. Answer should include, but is not limited to: Students will perform an experiment by drawing a marble from a bag, putting it back, and drawing a second marble. The experiment should be performed 36 times. Students will record their results in a table and then draw a bar graph representing the results. Bar graphs should be neatly drawn and clearly labeled.
b. Answer should include, but is not limited to: Students will perform a second experiment by drawing 2 marbles from a bag 36 times. Students will record their results in a table and then draw a bar graph representing the results. Bar graphs should be neatly drawn and clearly labeled.
c. Answer should include, but is not limited to: Students will use the results of the experiments in parts (a) and (b) to determine the experimental probability of drawing two green marbles.
d. The second experiment represents dependent events because the probability of the second marble being green or purple depends on the color of the first marble. The first experiment represents independent events because the color of the second marble does not depend on the color of the first marble.
4. Two events are dependent if the occurrence of one event does affect the likelihood that the other event will occur. Two events are independent if the occurrence of one event does not affect the likelihood that the other event will occur.
Sample answer: An example of dependent events is drawing two names out of a basket without replacing the first name. An example of independent events is flipping a coin twice.
5. The outcome of rolling a number cube does not affect the outcome of spinning a spinner. So, the events are independent.
6. The outcome of selecting the first group leader does affect the outcome of selecting the second group leader because there are fewer students to choose from when picking the second group leader. So, the events are dependent.
7. The outcome of spinning red on one spinner does not affect the outcome of spinning green on the other spinner. So, the events are independent.
First draw:
Second draw:
GG GPGG GG GPGG PG PPPG
First draw:
Second draw:
GG GP GG PG PGGP
Chapter 10
Copyright © Big Ideas Learning, LLC Big Ideas Math Red Accelerated All rights reserved. Worked-Out Solutions
301
8. For Activity 1: 2 2
; ;3 3
Find the product of the
probabilities, which is 2 2 4
.3 3 9
• =
So, the probability of drawing two green marbles in
Activity 1 is 4
.9
For Activity 2: 2 1
; ;3 2
Sample answer: Find the product
of the probabilities, which is 2 1 2 1
.3 2 6 3
• = =
So, the probability of drawing two green marbles
in Activity 2 is 1
.3
10.5 On Your Own (pp. 430–432)
1. ( ) 2multiple of 2
5P =
( ) 1heads
2P =
( ) ( ) ( )( ) ( ) ( )
and
multiple of 2 and heads multiple of 2 heads
2 1
5 21
5
P A B P A P B
P P P
= •
= •
= •
=
The probability of spinning a multiple of 2 and flipping
heads is 1
, or 20%.5
2. There are 88 other audience members who are not you, your relatives, or your friends. Choosing an audience member changes the number of audience members left. So, the events are dependent.
( )
( )
88 22first other audience member
100 25
87 29second other audience member
99 33
P
P
= =
= =
( ) ( ) ( ) and after P A B P A P B A= •
( )2 other audience membersP
( ) ( )1st other 2nd other after 1st
22 29
25 3358
75
P P= •
= •
=
The probability that you, your relatives, and your friends are not chosen to be either of the first two contestants
is 58
, or about 77.3%.75
3. ( )( ) ( ) ( )
#1 correct and #2 correct and #3 correct
#1 correct #2 correct #3 correct
1 1 1
4 4 41
64
P
P P P= • •
= • •
=
The probability of answering all three questions correctly
is 1
, or about 1.56%.64
This is greater than the probability
in Example 3. So, the probability of answering all three questions correctly increases when one choice is eliminated.
10.5 Exercises (pp. 433–435)
1. All four questions have first events that are the same, because “choosing a 1” is the same as “choosing a green chip” and “choosing a number less than 2.” However, the second event of question #1 does not match the others. Of the chips remaining, the even numbers are also the chips that are not red, and these chips are blue and yellow, not just blue.
( ) ( ) ( )1 and blue 1 blue after 1
1 2
6 51
15
P P P= •
= •
=
( ) ( ) ( )1 and even 1 even after 1
1 3
6 51
10
P P P= •
= •
=
2. When events A and B are independent, the probability of both events is the probability of event A times the probability of event B. When events A and B are dependent, the probability of both events is the probability of event A times the probability of event B after event A occurs.
Practice and Problem Solving
3. The outcome of the first roll does not affect the outcome of the second roll. So, the events are independent.
4. After you draw your lane number, there is one less lane number available for your friend. So, the events are dependent.
Chapter 10
Big Ideas Math Red Accelerated Copyright © Big Ideas Learning, LLC Worked-Out Solutions All rights reserved. 302
5. ( ) ( ) ( )( ) ( ) ( )
and
3 and heads 3 heads
1 1
4 21
8
P A B P A P B
P P P
= •
= •
= •
=
The probability of spinning a 3 and flipping heads is 1
, or 12.5%.8
6. ( ) ( ) ( )( ) ( ) ( )
and
even and tails even tails
2 1
4 21
4
P A B P A P B
P P P
= •
= •
= •
=
The probability of spinning an even number and flipping
tails is 1
,4
or 25%.
7. ( ) ( ) ( )( ) ( ) ( )
and
greater than 1 and tails greater than 1 tails
3 1
4 23
8
P A B P A P B
P P P
= •
= •
= •
=
The probability of spinning a number greater than 1 and
flipping tails is 3
, or 37.5%.8
8. ( ) ( ) ( )( ) ( ) ( )
and
not 2 and heads not 2 heads
3 1
4 23
8
P A B P A P B
P P P
= •
= •
= •
=
The probability of not spinning a 2 and flipping heads is 3
, or 37.5%.8
9. ( )
( )
1first is 5
71
second is 66
P
P
=
=
( ) ( ) ( )
( ) ( ) ( )and after
5 and 6 5 6 after 5
1 1
7 61
42
P A B P A P B A
P P P
= •
= •
= •
=
The probability of choosing a 5 and then a 6 is 1
,42
or
about 2.4%.
10. ( )
( )
3first is odd
71
second is 206
P
P
=
=
( ) ( ) ( )
( ) ( ) ( ) and after
odd and 20 odd 20 after odd
3 1
7 61
14
P A B P A P B A
P P P
= •
= •
= •
=
The probability of choosing an odd number and then 20 is 1
, or about 7.1%.14
11. ( )
( )
2first is less than 7
72 1
second is multiple of 46 3
P
P
=
= =
( ) ( ) ( )
( ) ( ) and after
less than 7 and multiple of 4 less than 7
multiple of 4
after less than 7
2 1
7 32
21
P A B P A P B A
P P
P
= •
=
•
= •
=
The probability of choosing a number less than 7 and
then a multiple of 4 is 2
, or about 9.5%.21
Chapter 10
Copyright © Big Ideas Learning, LLC Big Ideas Math Red Accelerated All rights reserved. Worked-Out Solutions
303
12. ( )
( )
4first is even
73 1
second is even6 2
P
P
=
= =
( ) ( ) ( )
( ) ( ) ( ) and after
both even even even after even
4 1
7 22
7
P A B P A P B A
P P P
= •
= •
= •
=
The probability of choosing two even numbers is 2
,7
or
about 28.6%.
13. The events are dependent, not independent.
( )
( )
1first is red
41
second is green3
P
P
=
=
( ) ( ) ( )
( ) ( ) ( ) and after
red and green red green after red
1 1
4 31
12
P A B P A P B A
P P P
= •
= •
= •
=
14. The tree diagram shows that three marbles are available for the first draw and only two marbles are available for the second draw. So, the events are dependent.
15. ( )
( )
2 1first is silver
4 21
second is silver3
P
P
= =
=
( ) ( ) ( )
( ) ( ) ( )
and after
1 1 1both silver silver silver
2 3 6
P A B P A P B A
P P P
= •
= • = • =
The probability that both are silver hoop earnings is 1
,6
or about 16.7%.
16. ( )
( )
1choose correct path at first fork
21
choose correct path at second fork2
P
P
=
=
( ) ( ) ( )( ) ( ) ( )
and after
both correct paths correct 1st path correct 2nd path
1 1
2 21
4
P A B P A P B A
P P P
= •
= •
= •
=
The probability that you are still on the correct path is 1
,4
or 25%.
17. ( )
( )
4first is purple
153
second is purple14
P
P
=
=
( ) ( ) ( )
( ) ( ) ( ) and after
both purple purple purple after purple
4 3
15 142
35
P A B P A P B A
P P P
= •
= •
= •
=
The probability that both balloons are purple is 2
, or35
about 5.7%.
18. ( ) ( ) ( ) ( )( ) ( ) ( ) ( )
and and
4 and heads and 7 4 heads 7
1 1 1
9 2 91
162
P A B C P A P B P C
P P P P
= • •
= • •
= • •
=
The probability is 1
,162
or about 0.6%.
19. ( ) ( ) ( ) ( )( ) ( ) ( ) ( )
and and
odd and heads and 3 odd heads 3
5 1 1
9 2 95
162
P A B C P A P B P C
P P P P
= • •
= • •
= • •
=
The probability is 5
,162
or about 3.1%.
Chapter 10
Big Ideas Math Red Accelerated Copyright © Big Ideas Learning, LLC Worked-Out Solutions All rights reserved. 304
20. ( ) ( ) ( ) ( )
( ) ( ) ( )
and and
even and tailseven tails odd
and odd
4 1 5
9 2 910
81
P A B C P A P B P C
P P P P
= • •
= • •
= • •
=
The probability is 10
,81
or about 12.3%.
21. ( ) ( ) ( ) ( )( ) ( ) ( ) ( )
and and
not 5 and heads and 1 not 5 heads 1
8 1 1
9 2 94
81
P A B C P A P B P C
P P P P
= • •
= • •
= • •
=
The probability is 4
,81
or about 4.9%.
22. ( ) ( ) ( ) ( )
( ) ( )
and and
odd and not heads notodd not 6
and not 6 heads
5 1 8
9 2 920
81
P A B C P A P B P C
P P P P
= • •
= • •
= • •
=
The probability is 20
,81
or about 24.7%.
23. ( )
( )
( )
( )
15not chosen first
1614
not chosen second15
13not chosen third
1412
not chosen fourth13
P
P
P
P
=
=
=
=
( )( ) ( ) ( ) ( )
not one of first four students chosen
not 1st not 2nd not 3rd not 4th
15 14 13 12
16 15 14 1312
163
4
P
P P P P= • • •
= • • •
=
=
The probability that you are not one of the first four
students chosen is 3
, or4
75%.
24. If 20% of the shoes are black, then 80% are not black.
( ) ( ) ( ) ( )( ) ( ) ( )
( )
and and
black black black
black
0.80 0.80 0.80
0.512
P A B C P A P B P C
P none P not P not
P not
= • •
= •
•
= • •=
The probability that none of the shoes are black is 0.512, or 51.2%.
25. a. no; If you and your best friend were in the same group, then the probability that you both are chosen would be 0 because only one leader is chosen from each group. Because the probability that both you and
your best friend are chosen is 1
,132
you and your best
friend are not in the same group.
b. ( ) ( )( )
both are chosen you are chosen
friend is chosen
1 1
132 1212
1321
11
P P
P
x
x
x
=
•
= •
=
=
The probability that your best friend is chosen as a
group leader is 1
, or about 9.1%.11
c. The probability that you are chosen to be a leader
is 1
,12
so there are 12 students in your group. The
probability that your best friend is chosen to be a leader
is 1
,11
so there are 11 students in that group. The total
number of students in the class is 12 11 23.+ =
26. 25 1
25%100 4
= =
Eliminate all but 2 of the choices in each question.
a. ( ) ( )( )
both correct one question correct
the other question correct
1 1 1
4 2 2
P P
P
=
•
= •
b. 1 25 25 1 1
8 % %3 3 3 100 12
= = • =
Eliminate one of the choices in one of the questions and eliminate two of the choices in the other question.
( ) ( )( )
both correct one question correct
the other question correct
1 1 1
12 4 3
P P
P
=
•
= •
Chapter 10
Copyright © Big Ideas Learning, LLC Big Ideas Math Red Accelerated All rights reserved. Worked-Out Solutions
305
Fair Game Review
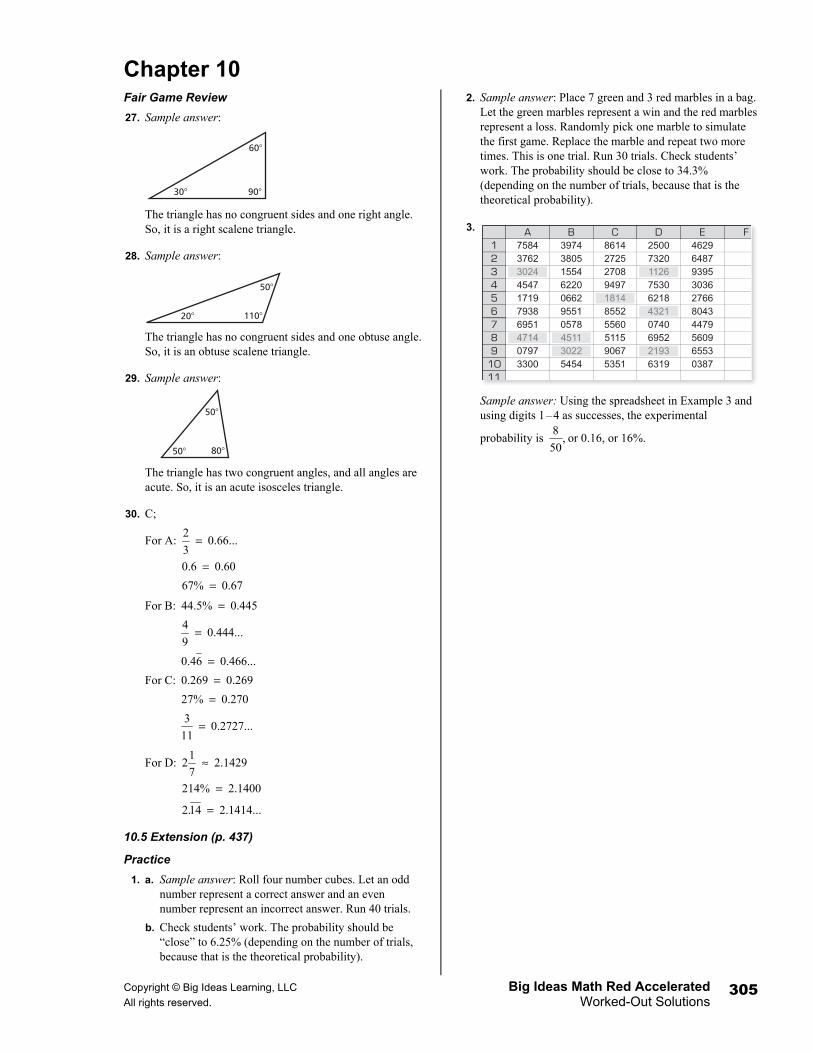
27. Sample answer:
The triangle has no congruent sides and one right angle. So, it is a right scalene triangle.
28. Sample answer:
The triangle has no congruent sides and one obtuse angle. So, it is an obtuse scalene triangle.
29. Sample answer:
The triangle has two congruent angles, and all angles are acute. So, it is an acute isosceles triangle.
30. C;
For A: 2
0.66...30.6 0.60
67% 0.67
=
==
For B: 44.5% 0.445
40.444...
9
0.46 0.466...
=
=
=
For C: 0.269 0.269
27% 0.270
30.2727...
11
==
=
For D: 1
2 2.14297
214% 2.1400
2.14 2.1414...
≈
=
=
10.5 Extension (p. 437)
Practice
1. a. Sample answer: Roll four number cubes. Let an odd number represent a correct answer and an even number represent an incorrect answer. Run 40 trials.
b. Check students’ work. The probability should be “close” to 6.25% (depending on the number of trials, because that is the theoretical probability).
2. Sample answer: Place 7 green and 3 red marbles in a bag. Let the green marbles represent a win and the red marbles represent a loss. Randomly pick one marble to simulate the first game. Replace the marble and repeat two more times. This is one trial. Run 30 trials. Check students’ work. The probability should be close to 34.3% (depending on the number of trials, because that is the theoretical probability).
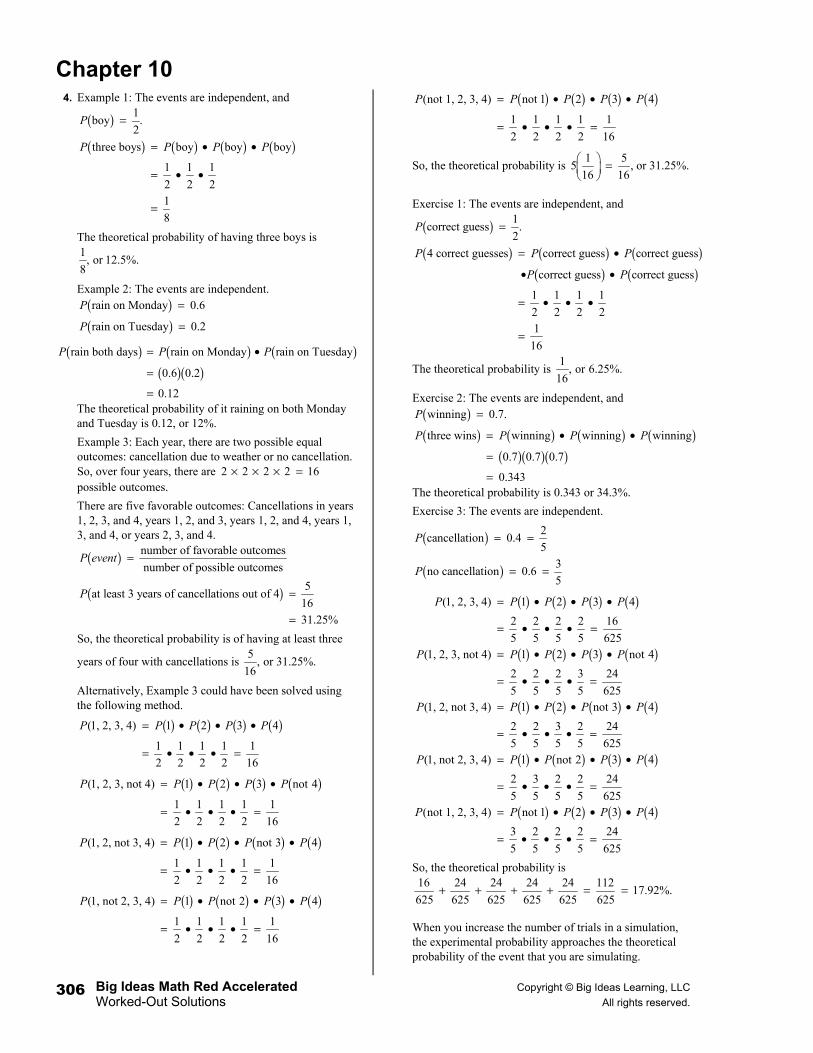
3.
Sample answer: Using the spreadsheet in Example 3 and using digits 1–4 as successes, the experimental
probability is 8
,50
or 0.16, or 16%.
308 908
608
208 1108
508
508
808508
1A B C D E F
2345678910 3300
0797471469517938171945473024
7584
5454302245110578955106626220155438053974
5351906751155560855218149497270827258614
6319219369520740432162187530112673202500
0387655356094479804327663036939564874629
11
3762
Chapter 10
Big Ideas Math Red Accelerated Copyright © Big Ideas Learning, LLC Worked-Out Solutions All rights reserved. 306
4. Example 1: The events are independent, and
( ) 1boy .
2P =
( ) ( ) ( ) ( )three boys boy boy boy
1 1 1
2 2 21
8
P P P P= • •
= • •
=
The theoretical probability of having three boys is 1
, or 12.5%.8
Example 2: The events are independent.
( )( )rain on Monday 0.6
rain on Tuesday 0.2
P
P
=
=
( ) ( ) ( )( )( )
rain both days rain on Monday rain on Tuesday
0.6 0.2
0.12
P P P= •
=
=The theoretical probability of it raining on both Monday and Tuesday is 0.12, or 12%.
Example 3: Each year, there are two possible equal outcomes: cancellation due to weather or no cancellation. So, over four years, there are 2 2 2 2 16× × × = possible outcomes.
There are five favorable outcomes: Cancellations in years 1, 2, 3, and 4, years 1, 2, and 3, years 1, 2, and 4, years 1, 3, and 4, or years 2, 3, and 4.
( ) number of favorable outcomes
number of possible outcomesP event =
( ) 5at least 3 years of cancellations out of 4
1631.25%
P =
=
So, the theoretical probability is of having at least three
years of four with cancellations is 5
,16
or 31.25%.
Alternatively, Example 3 could have been solved using the following method.
( ) ( ) ( ) ( )(1, 2, 3, 4) 1 2 3 4
1 1 1 1 1
2 2 2 2 16
P P P P P= • • •
= • • • =
( ) ( ) ( ) ( )(1, 2, 3, not 4) 1 2 3 not 4
1 1 1 1 1
2 2 2 2 16
P P P P P= • • •
= • • • =
( ) ( ) ( ) ( )(1, 2, not 3, 4) 1 2 not 3 4
1 1 1 1 1
2 2 2 2 16
P P P P P= • • •
= • • • =
( ) ( ) ( ) ( )(1, not 2, 3, 4) 1 not 2 3 4
1 1 1 1 1
2 2 2 2 16
P P P P P= • • •
= • • • =
( ) ( ) ( ) ( )(not 1, 2, 3, 4) not 1 2 3 4
1 1 1 1 1
2 2 2 2 16
P P P P P= • • •
= • • • =
So, the theoretical probability is 1 5
5 ,16 16 =
or 31.25%.
Exercise 1: The events are independent, and
( ) 1correct guess .
2P =
( ) ( ) ( )( ) ( )
4 correct guesses correct guess correct guess
correct guess correct guess
1 1 1 1
2 2 2 21
16
P P P
P P
= •
• •
= • • •
=
The theoretical probability is 1
, or 6.25%.16
Exercise 2: The events are independent, and
( )winning 0.7.P =
( ) ( ) ( ) ( )( )( )( )
three wins winning winning winning
0.7 0.7 0.7
0.343
P P P P= • •
=
=The theoretical probability is 0.343 or 34.3%.
Exercise 3: The events are independent.
( )
( )
2cancellation 0.4
53
no cancellation 0.65
P
P
= =
= =
( ) ( ) ( ) ( )
( ) ( ) ( ) ( )
( ) ( ) ( ) ( )
( ) ( ) ( ) ( )
(1, 2, 3, 4) 1 2 3 4
2 2 2 2 16
5 5 5 5 625(1, 2, 3, not 4) 1 2 3 not 4
2 2 2 3 24
5 5 5 5 625(1, 2, not 3, 4) 1 2 not 3 4
2 2 3 2 24
5 5 5 5 625(1, not 2, 3, 4) 1 not 2 3 4
2 3 2 2 24
5 5 5 5 625(no
P P P P P
P P P P P
P P P P P
P P P P P
P
= • • •
= • • • =
= • • •
= • • • =
= • • •
= • • • =
= • • •
= • • • =
( ) ( ) ( ) ( )t 1, 2, 3, 4) not 1 2 3 4
3 2 2 2 24
5 5 5 5 625
P P P P= • • •
= • • • =
So, the theoretical probability is 16 24 24 24 24 112
17.92%.625 625 625 625 625 625
+ + + + = =
When you increase the number of trials in a simulation, the experimental probability approaches the theoretical probability of the event that you are simulating.

Chapter 10
Copyright © Big Ideas Learning, LLC Big Ideas Math Red Accelerated All rights reserved. Worked-Out Solutions
307
Study Help Available at BigIdeasMath.com.
Quiz 10.1–10.5 1. There are 2 red butterflies. So, choosing a red butterfly
can occur in 2 ways.
2. There are no brown butterflies. So, choosing a brown butterfly can occur in 0 ways.
3. There are 4 butterflies that are not blue. So, choosing a not blue butterfly can occur in 4 ways.
4. ( ) number of green paper clipsgreen
total number of paper clips
6 6 3
6 3 4 2 5 20 10
P =
= = =+ + + +
The probability of choosing a green paper clip is 3
,10
or 30%.
5. ( ) number of yellow paper clipsyellow
total number of paper clips
5 5 1
6 3 4 2 5 20 4
P =
= = =+ + + +
The probability of choosing a yellow paper clip is 1
,4
or 25%.
6. ( ) number of yellow paper clips yellow
total number of paper clips
6 3 4 2 15 3
6 3 4 2 5 20 4
notP not =
+ + += = =+ + + +
The probability of choosing a paper clip that is not yellow
is 3
,4
or 75%.
7. ( ) number of purple paper clipspurple
total number of paper clips
00
6 3 4 2 5
P =
= =+ + + +
The probability of choosing a purple paper clip is 0, or 0%.
8. The total number of rolls is
18 22 21 16 20 23 120.+ + + + + =
( ) number of times 4 rolled 16 24
total number of rolls 120 15P = = =
The probability of rolling a 4 is 2
,15
or about 13.3%.
9. A multiple of 3 was rolled 21 23 44+ = times.
( ) number of timesmultiple of 3 rolled 44 11
multiple of 3total number of rolls 120 30
P = = =
The probability of rolling a multiple of 3 is 11
,30
or about
36.7%.
10. A 2 or a 3 was rolled 22 21 43+ = times.
( ) number of times a 2 or a 3 rolled 432 or 3
total number of rolls 120P = =
The probability of rolling a 2 or a 3 is 43
,120
or about
35.8%.
11. The number of times a number less than 7 was rolled is 120.
( ) number of times less than 7 rolledless than 7
total number of rolls120
1201
P =
=
=
The probability of rolling a number less than 7 is 1, or 100%.
12. Event 1: There are 4 possible types.
Event 2: There are 3 possible colors.
4 3 12× =
There are 12 possible kinds of calculators.
13. Event 1: There are 4 possible destinations.
Event 2: There are 2 possible lengths.
4 2 8× =
There are 8 possible vacations.
14. ( ) number of black ink pens 2black ink
total number of pens 5P = =
The probability of randomly choosing a black pen is 2
,5
or 40%.

Chapter 10
Big Ideas Math Red Accelerated Copyright © Big Ideas Learning, LLC Worked-Out Solutions All rights reserved. 308
15. ( )
( )
2first is blue
51
second is blue4
P
P
=
=
( ) ( ) ( )( ) ( ) ( )
and after
both blue blue blue after blue
2 1
5 41
10
P A B P A P B A
P P P
= •
= •
= •
=
The probability that you and your friend both choose a
blue pen is 1
, or 10%.10
Section 10.6 10.6 Activity (pp. 440–441)
1. a. Population: The students in a school; Sample: The students in a math class
b. Population: The grizzly bears in a park; Sample: The grizzly bears with GPS collars in a park
c. Population: All quarters in circulation; Sample: 150 quarters
d. Population: All books in a library; Sample: 10 fiction books in a library
2. a. no; Not every student in your school is equally likely of being selected. Most of the responses may be playing or listening to music.
b. no; Not every student in your school is equally likely of being selected. Not all students may read the school newspaper.
c. yes; Every student in your school is equally likely of being selected.
d. no; Not every student in your school is equally likely of being selected. You are only surveying students from a certain grade.
3. a. not valid; Residents that call into the radio show most likely have very strong opinions and not everyone may listen to the radio.
b. not valid; The reporter only talked to 2 residents. The size of the sample is not large enough to draw any valid conclusions.
c. valid; You talked to a good amount of residents that are randomly selected and your conclusion is reasonable based on your results.
4. Sample answer: A sample accurately represents a population when the sample is large enough, random, and not just a certain portion of the population.
5. Check students’ work.
6. no; You can have a large sample that is not representative of a population. Sample answer: You survey residents about a new power plant being built but you only survey residents who will live close to the power plant. This could result in a large sample that is not representative of residents in a town.
10.6 On Your Own (pp. 442–443)
1. C; The sample is representative of the population.
2. The sample that surveys every 5th student on an alphabetical list of eighth graders is unbiased because every eighth grader is equally likely of being selected. Sampling 15 band members is biased because it does not represent the entire eighth grade, and band members are more likely to listen to music.
3. No, firefighters are more likely to support the new sign.
4.
students in survey students in school (two or more movies) (two or more movies)
total surveyed students in school
24
75 1200384
n
n
=
=
=
So, about 384 students in the school watch two or more movies each week.
10.6 Exercises (pp. 444–445)
Vocabulary and Concept Check
1. You would survey a sample instead of a population because samples are easier to obtain.
2. You should make sure the people surveyed are selected at random and are representative of the population, as well as making sure your sample is large enough.
Practice and Problem Solving
3. The population is the residents of New Jersey. The sample consists of the residents of Ocean County.
4. The population is all the cards in a deck. The sample consists of the 4 cards drawn from the deck.
5. biased; The sample is not selected at random and is not representative of the population because students in a band class play a musical instrument.
6. unbiased; The sample is representative of the population, selected at random, and large enough to provide accurate data.
7. biased; The sample is not representative of the population because people who go to the park are more likely to think that the park needs to be remodeled.
8. The sample is representative of the population, selected at random, and large enough to provide accurate data. So, the sample is unbiased and the conclusion is valid.
Chapter 10
Copyright © Big Ideas Learning, LLC Big Ideas Math Red Accelerated All rights reserved. Worked-Out Solutions
309
9. The sample is not representative of the population because people going to the baseball stadium are more likely to support building a new baseball stadium. So, the sample is biased and the conclusion is not valid.
10. Sample A is not large enough to provide accurate data. Sample B is a large sample, so Sample B is better for making a prediction.
11. Sample B is not representative of the population because the population consists of pencils from all the machines. Sample A is representative of the population, so Sample A is better for making a prediction.
12.
( )students in school pizzastudents in survey (pizza)
number of students in survey number of students in school
58
125 1500696
n
n
=
=
=So, there are about 696 students in the school whose favorite food is pizza.
13. Because the population size is very large, you would survey a sample.
14. Because the population size is very small, you would survey the population.
15. Because the population size is very large, you would survey a sample.
16.
Number surveyed who said yes Student tickets bought
Total surveyed Students in school
12 210
721260
nn
=
=
=
There are about 1260 students in the school.
17. Not everyone has an email address, so the sample may not be representative of the entire population. Sample answer: When the survey question is about technology or which email service you use, the sample may be representative of the entire population.
18. a. Sample answer: The person could ask “Do you agree with the town’s unfair ban on skateboarding on public property?”
b. Sample answer: The person could ask “Do you agree that the town’s ban on skateboarding on public property has made the town quieter and safer?”
19. Sample answer: no; 75% of the students in the sample said that they plan to attend college. Because 75% of 900 is 675, the counselor’s prediction was too high. The counselor included students that replied “maybe,” increasing the number to 80% of 900, or 720 students.
Fair Game Review
20. 100
18
60 1003
10 1003
100 10010 10030
a pw
p
p
p
p
=
=
=
• = •
=
So, 30% of 60 is 18.
21. 100
98 70
10098 7
10980 7
140
a pw
w
ww
w
=
=
=
==
So, 70% of 140 is 98.
22. 100
30 15
10030 3
20600 3
200
a pw
w
ww
w
=
=
=
==
So, 30 is 15% of 200.
23. 1000.6
500 1006
500 10001000 3000
3
a pw
a
a
aa
=
=
=
==
So, 3 is 0.6% of 500.
24. A;
( )( )( )
1
31
4 6 5340
V Bh=
=
=
So, the volume of the pyramid is 40 cm3.
Chapter 10
Big Ideas Math Red Accelerated Copyright © Big Ideas Learning, LLC Worked-Out Solutions All rights reserved. 310
10.6 Extension (pp. 446–447)
Activity 1
Step 1: Number you surveyed Students in school who prefer pop who prefer pop
Total surveyed Students in school
10
20 840420
n
n
=
=
=
So, there are 420 students who prefer pop music.
Step 2: Number Kevin surveyed Students in school who prefer pop who prefer pop
Total surveyed Students in school
13
20 840546
n
n
=
=
=
So, there are 546 students who prefer pop music. Using Kevin’s results, this inference is more than the inference in Step 1.
Step 3: Number Steve surveyed Students in school who prefer pop who prefer pop
Total surveyed Students in school
8
20 840336
n
n
=
=
=
Number Laura surveyed Students in school who prefer pop who prefer pop
Total surveyed Students in school
10
20 840420
n
n
=
=
=
Number Ming surveyed Students in school who prefer pop who prefer pop
Total surveyed Students in school
9
20 840378
n
n
=
=
=
Steve: 336 students prefer pop music.
Laura: 420 students prefer pop music.
Ming: 378 students prefer pop music.
Step 4: Sample answer: The greatest is 546 students. The least is 336 students. 420 is the median and the mode of the data. So, use the inference of 420 students.
Step 5: Number of students who prefer pop music: 10 13 8 10 9 50+ + + + =
Number of students surveyed: 20 20 20 20 20 100+ + + + =
Number surveyed Students in school who prefer pop who prefer pop
Total surveyed Students in school
50
100 840420
n
n
=
=
=
So, there are 420 students who prefer pop music when all five samples are combined.
Practice
1. a. Check students’ work. b. Check students’ work.
c. Check students’ work. Sample answer: Yes, you can make a more accurate prediction by increasing the number of random samples.
Activity 2
Step 1:
6 8 6 6 74 10 70
Mean 1: 8 7
710 10
8+ + + + ++ + =+ =+
10 4 4 6 873
M6 7
ean 2: 7.312 8
10 10
8+ + + +
+ + = =+ + +
10 9 8 6 577
M8 6
ean 3: 7.76 9 1
10 10
0+ + + +
+ + = =+ + +
4 8 4 4 54 50
M4
ean 4: 51
6
0 0
6
1
5+ + + +
+ + + =+ =+
6 8 8 6 124 801
M0 8 6 1
ean 5: 810 1
2
0
+ + + ++ + + =+ =+
10 10 8 9 168 7 110
Mean 6: 1110 10
12 16 14+ + + +
+ + =+ =+ +
4 5 6 6 45 50
M6
ean 7: 51
4
0 0
6
1
4+ + + +
+ + + =+ =+
16 20 8 12 108 8 14 120
Mean 8: 16 8
1210 10
+ + + ++ + + + = =+
Step 2:
Step 3: Sample answers: The actual mean number of hours probably lies within the interval 6 to 9.5 hours (the box). So, about 7.5 hours is a good estimate. The mean of the entire data set is 7.875. So, the estimate is close.
3 4 5 6 7 8 9 10 11 12 13
Mean hoursworked each
week

Chapter 10
Copyright © Big Ideas Learning, LLC Big Ideas Math Red Accelerated All rights reserved. Worked-Out Solutions
311
Activity 3
Step 1: Check students’ work.
Step 2: Check students’ work. Sample answer: Because the actual percent of students is 70%, students can say that they expect the number of red peanuts in their samples to be between 60%–80%, or 55%–85%, or 65%–75%, etc.
Step 3: Check students’ work.
Practice
2. a.
b. Sample answer: The actual percent of student-athletes that prefer water over a sports drink probably lies within the interval 50% to 70% (the box). So, about 60% is a good estimate.
60 70 60 50 8070 3 610
Mean: 610 70 80 40
10 10
+ + + ++ + =+ =+ +
The mean of the data is 61%. So, the estimate is close.
3. First order all the data to find the median of each sample.
Step 1: Medians are: 7, 7.5, 8, 4.5, 8, 10, 5, and 11.
Step 2:
Step 3: Sample answers: The actual median number of hours probably lies within the interval 6 to 9 hours (the box). So, about 7.5 is a good estimate. The median of the data is 8. So, the estimate is close.
4. Check students’ work.
5. The more samples you have, the more accurate your inferences will be. By taking multiple random samples, you can find an interval where the actual measurement of a population may lie.
Section 10.7 10.7 Activity (pp. 448–449)
1. a. Sample answer:
b. Both distributions are approximately symmetric.
c. For Male Students in Grade 8:
1 17 9 8 7 8
2 21
10 6 6 8 82
1 1 18 9 11 7 8
2 123Mean: 2 8.2
15 12
5
+ + + +
+ + + + +
=+ +
=+ + +
From part (a):
Median: 8
Mode: 1
8, 82
Range: 11 6 5− =
Interquartile range (IQR): 9 7.5 1.5− =
Mean Absolute Deviation (MAD): Find the mean of how far each data point deviates from the mean of 8.2.
1.2 0.8 0.2 0.7 0.31.8 2.2 1.7 0.2 0.20.3 0.8 2.8 14.2
MAD: 0.950.7 0.
15
3
15
+ + + ++ + + + ++ + + = ≈+ +
For Male Students in Grade 6:
1 1 16 5 6 6 7
2 2 21 1 1
8 7 5 5 52 2 2
93Mean: 6.
1 16 7 4
26
1
62
152
5
+ + + +
+ + + +
=+ + +
=
+
+ +
From part (a):
Median: 6
Mode: 6
1 1
Range: 8 4 42 2
− =
Interquartile range (IQR): 7 5.5 1.5− =
Mean Absolute Deviation (MAD): Find the mean of how far each data point deviates from the mean of 6.2.
0.2 0.7 0.2 0.3 1.32.3 0.8 0.7 1.2 0.70.3 0.8 1.7 11.6
MAD: 0.770.2 0.
15
2
15
+ + + ++ + + + ++ + + = ≈+ +
0 10 20 30 40 50 60 70 80 90 100
Percent thatprefer water
3 4 5 6 7 8 9 10 11 12 13
Median hoursworked each
week
Shoe sizes
Male students (8th Grade)
Male students (6th Grade)
4 5 6 7 8 9 10 11 12
Shoe Size
4 5 6 7 8
Male students(6th grade)
9 10 11 12 13
4 5 6 7 8
Male students(8th grade)
9 10 11 12 13
Male Students inEighth-Grade Class
Mean
8.2 8 8, 8 5 1.5 0.95
6.2 6 6 4 1.5 0.77
Median Mode Range InterquartileRange (IQR)
MeanAbsoluteDeviation
(MAD)
Male Students inEighth-Grade Class
12
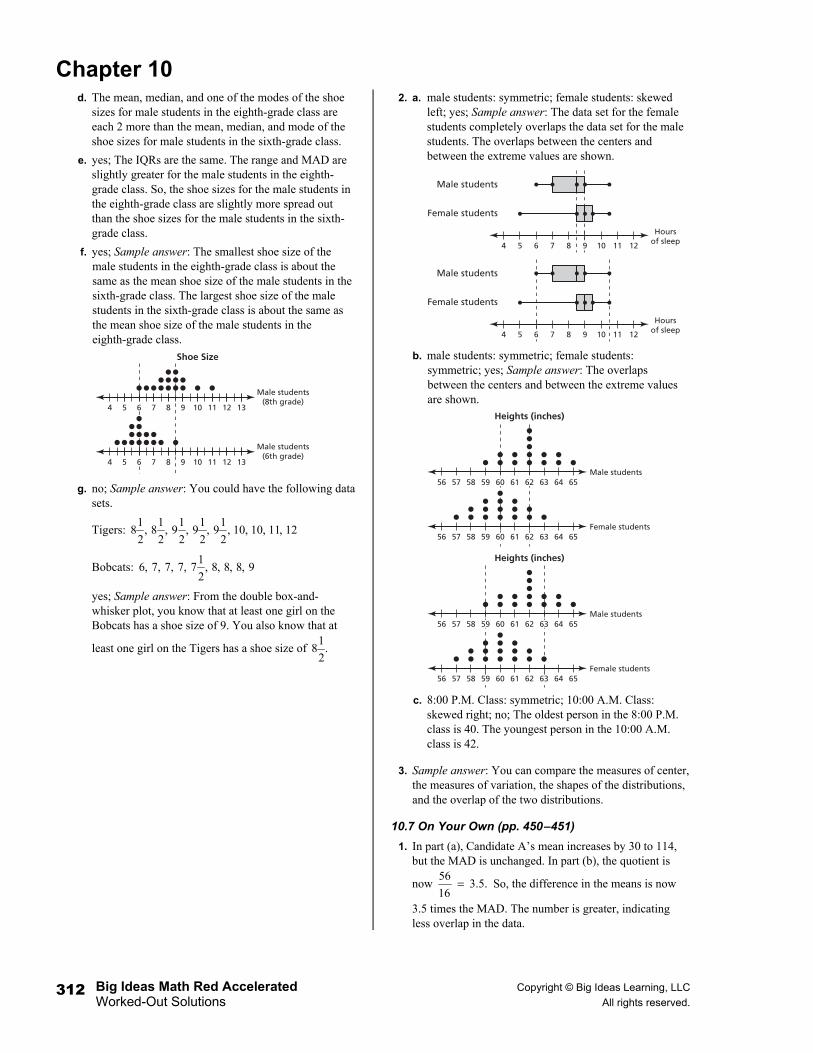
Chapter 10
Big Ideas Math Red Accelerated Copyright © Big Ideas Learning, LLC Worked-Out Solutions All rights reserved. 312
d. The mean, median, and one of the modes of the shoe sizes for male students in the eighth-grade class are each 2 more than the mean, median, and mode of the shoe sizes for male students in the sixth-grade class.
e. yes; The IQRs are the same. The range and MAD are slightly greater for the male students in the eighth-grade class. So, the shoe sizes for the male students in the eighth-grade class are slightly more spread out than the shoe sizes for the male students in the sixth-grade class.
f. yes; Sample answer: The smallest shoe size of the male students in the eighth-grade class is about the same as the mean shoe size of the male students in the sixth-grade class. The largest shoe size of the male students in the sixth-grade class is about the same as the mean shoe size of the male students in the eighth-grade class.
g. no; Sample answer: You could have the following data sets.
Tigers: 1 1 1 1 1
8 , 8 , 9 , 9 , 9 , 10, 10, 11, 122 2 2 2 2
Bobcats: 1
6, 7, 7, 7, 7 , 8, 8, 8, 92
yes; Sample answer: From the double box-and-whisker plot, you know that at least one girl on the Bobcats has a shoe size of 9. You also know that at
least one girl on the Tigers has a shoe size of 1
8 .2
2. a. male students: symmetric; female students: skewed left; yes; Sample answer: The data set for the female students completely overlaps the data set for the male students. The overlaps between the centers and between the extreme values are shown.
b. male students: symmetric; female students: symmetric; yes; Sample answer: The overlaps between the centers and between the extreme values are shown.
c. 8:00 P.M. Class: symmetric; 10:00 A.M. Class: skewed right; no; The oldest person in the 8:00 P.M. class is 40. The youngest person in the 10:00 A.M. class is 42.
3. Sample answer: You can compare the measures of center, the measures of variation, the shapes of the distributions, and the overlap of the two distributions.
10.7 On Your Own (pp. 450–451)
1. In part (a), Candidate A’s mean increases by 30 to 114, but the MAD is unchanged. In part (b), the quotient is
now 56
3.5.16
= So, the difference in the means is now
3.5 times the MAD. The number is greater, indicating less overlap in the data.
Shoe Size
4 5 6 7 8
Male students(6th grade)
9 10 11 12 13
4 5 6 7 8
Male students(8th grade)
9 10 11 12 13
Hoursof sleep
Male students
Female students
4 5 6 7 8 10 11 129
Hoursof sleep
Male students
Female students
4 5 7 8 10 11 1296
Heights (inches)
56 57 58 59Female students
61 63 64 65
56 57 58 59Male students
61 63 64 6560 62
60 62
Heights (inches)
56 57 58Female students
61 64 65
56 57 58Male students
61 64 6560 62
60 6259 63
59 63

Chapter 10
Copyright © Big Ideas Learning, LLC Big Ideas Math Red Accelerated All rights reserved. Worked-Out Solutions
313
2. No, the sample size is too small to make a conclusion about the population.
10.7 Exercises (pp. 452–453)
Vocabulary and Concept Check
1. When comparing two populations, use the mean and the MAD when each distribution is symmetric. Use the median and the IQR when either one or both distributions are skewed.
2. There will probably be little or no visual overlap of the data. The core (center) portions of the data are too far apart.
Practice and Problem Solving
3. a. Garter snake lengths ordered:
15, 18, 21, 22, 24, 24, 25, 26, 28, 30, 32, 35
Measures of center:
15 18 21 2224 24 25 2628 30 32 35 300
Mean 25 in.12 12
+
= = =
+ ++ + + ++ + + +
Median 24.5 in.=
Mode 24 in.=
Measures of variation:
Range 35 15 20 in.= − =
3 1IQR 29 21.5 7.5 in.Q Q= − = − =
10 7 4 31 1 0 1
52MAD 4.33 in.
12
3 5
2
10
1
7
+ + ++ + + ++ + = ≈+ +=
Water snake lengths ordered:
21, 24, 25, 27, 30, 32, 32, 34, 35, 37, 40, 41
Measures of center:
21 24 25 2730 32 32
378Mean 31.5 in
3435 37 40 4
.1
1
12 2
+ + ++ + + ++ = =+ + +=
Median 32 in.=
Mode 32 in.=
Measures of variation:
Range 41 21 20 in.= − =
3 1IQR 36 26 10 in.Q Q= − = − =
10.5 7.5 6.5 4.51.5 0.5 0.5 2.53.5 5.5 8.5 9. 61
MAD 5.08 in.1 1
5
2 2= = ≈
+ + ++ + + ++ + + +
b. The water snakes have greater measures of center because the mean, median, and mode are greater. The water snakes also have greater measures of variation because the interquartile range and mean absolute deviation are greater.
4. a. Team A: median = 3, IQR 4 2 2= − =
Team B: median = 7, IQR 8 6 2= − =
The variation in the goals scored is the same, but Team B usually scores about 4 more goals per game.
b. median for Team B median for Team A 4
2IQR for Team A 2
− = =
median for Team B median for Team A 42
IQR for Team B 2
− = =
The difference in the medians is 2 times the IQR.
5. a. Class A: median = 90,
3 1IQR 95 82.5 12.5Q Q= − = − =
Class B: median = 80,
3 1IQR 85 75 10Q Q= − = − =
The variation in the test scores is about the same, but Class A has greater test scores.
b.
median for Class A median for Class B 100.8
IQR for Class A 12.5
− = =
median for Class A median for Class B 101
IQR for Class B 10
− = =
The difference in the medians is 0.8 to 1 times the IQR.
6. a. Volleyball Game Attendance:
112 75 49 95 8854 84 93 85 106127 74 62
1720Mean 86
20 2
98 8868 117 132 53 60
0
+ + + ++ + + + ++ + + + ++ + + + += = =
26 11 37 9 232 2 7 1 2041 12 24 12 218 392
MAD 19.620 2
31 46 33 26
0
+ + + ++ + + + ++ + + + ++ + = =+ + +=
Basketball Game Attendance:
202 176 163 190 141186 173 152 184 155181 207 169 198 21
3700Mean 185
20 2
9188 214 228 1
0
95 179
+ + + ++ + + + ++ + + + ++ + =+ =+ +=
17 9 22 5 441 12 33 1 304 22 16 13 343 29 43 354
MAD 17.720 2
10
0
6
+ + + ++ + + + ++ + +
= = =
+ ++ + + + +
The variation in the attendances is about the same, but basketball has a greater attendance.
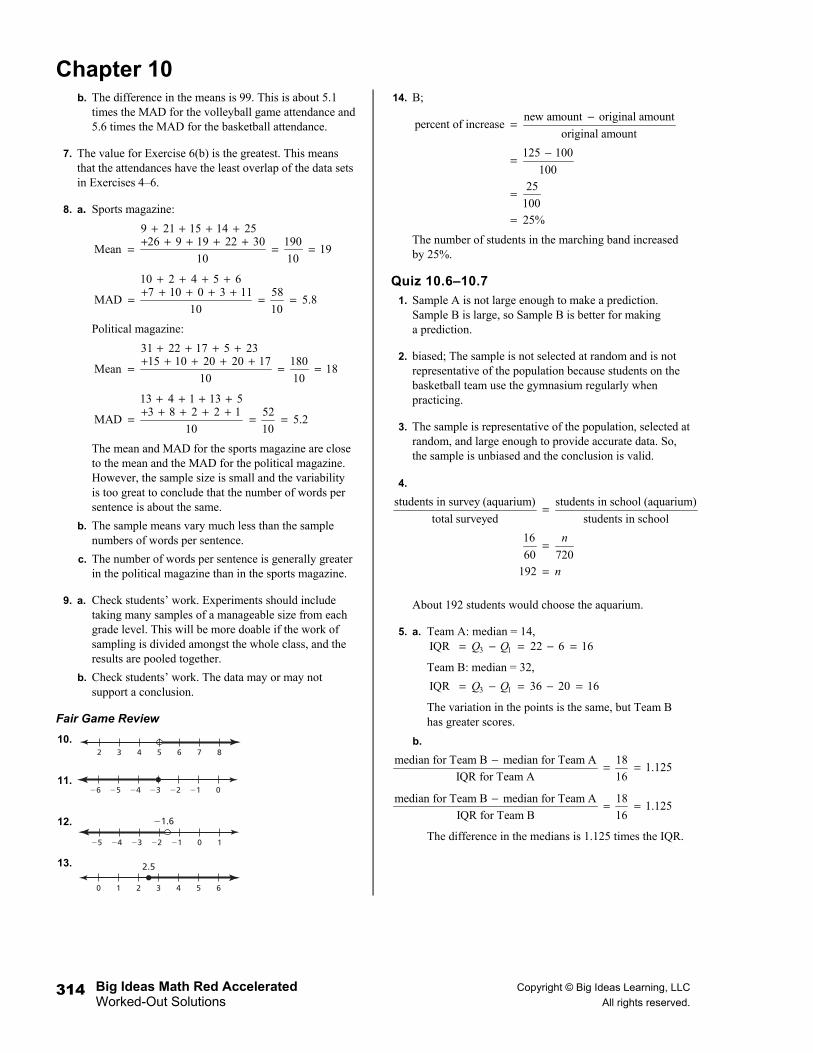
Chapter 10
Big Ideas Math Red Accelerated Copyright © Big Ideas Learning, LLC Worked-Out Solutions All rights reserved. 314
b. The difference in the means is 99. This is about 5.1 times the MAD for the volleyball game attendance and 5.6 times the MAD for the basketball attendance.
7. The value for Exercise 6(b) is the greatest. This means that the attendances have the least overlap of the data sets in Exercises 4–6.
8. a. Sports magazine:
9 21 15 14 2526 9 190
Mean 119 2
910 1
2 0
0
3+ + + +
+ + =+ + =+=
10 2 4 5 67 10 0 58
MAD 53 11
.810 10
+ + + ++ + + + += = =
Political magazine:
31 22 17 5 2315 10 20 2 180
Mean 181
7
0 0
0
1
1+ + + +
+ + + + += = =
13 4 1 13 53 8 2 2 52
MAD 51
.210 10
+ + + ++ + + + += = =
The mean and MAD for the sports magazine are close to the mean and the MAD for the political magazine. However, the sample size is small and the variability is too great to conclude that the number of words per sentence is about the same.
b. The sample means vary much less than the sample numbers of words per sentence.
c. The number of words per sentence is generally greater in the political magazine than in the sports magazine.
9. a. Check students’ work. Experiments should include taking many samples of a manageable size from each grade level. This will be more doable if the work of sampling is divided amongst the whole class, and the results are pooled together.
b. Check students’ work. The data may or may not support a conclusion.
Fair Game Review
10.
11.
12.
13.
14. B;
new amount original amount
percent of increaseoriginal amount
125 100
10025
10025%
−=
−=
=
=
The number of students in the marching band increased by 25%.
Quiz 10.6–10.7 1. Sample A is not large enough to make a prediction.
Sample B is large, so Sample B is better for making a prediction.
2. biased; The sample is not selected at random and is not representative of the population because students on the basketball team use the gymnasium regularly when practicing.
3. The sample is representative of the population, selected at random, and large enough to provide accurate data. So, the sample is unbiased and the conclusion is valid.
4.
students in survey (aquarium) students in school (aquarium)
total surveyed students in school
16
60 720192
n
n
=
=
=
About 192 students would choose the aquarium.
5. a. Team A: median = 14,
3 1IQR 22 6 16Q Q= − = − =
Team B: median = 32,
3 1IQR 36 20 16Q Q= − = − =
The variation in the points is the same, but Team B has greater scores.
b.
median for Team B median for Team A 181.125
IQR for Team A 16
− = =
median for Team B median for Team A 181.125
IQR for Team B 16
− = =
The difference in the medians is 1.125 times the IQR.
3 4 5 82 6 7
−3 −2 −1−5 −4 0−6
−2 −1 0−4 −3
−1.6
1−5
1 2
2.5
3 60 4 5

Chapter 10
Copyright © Big Ideas Learning, LLC Big Ideas Math Red Accelerated All rights reserved. Worked-Out Solutions
315
6. a. Camp A: mean = 15,
20
MAD 120
= =
Camp B: mean = 13,
20
MAD 120
= =
The variation in the ages is the same, but Camp A has a greater age.
b. mean for Camp A mean for Camp B 22
MAD for Camp A 1
− = =
mean for Camp A mean for Camp B 2
2MAD for Camp B 1
− = =
The difference in the means is 2 times the MAD.
Chapter 10 Review 1. a. There are 2 sections with a 1. So, spinning a 1 can
occur in 2 ways.
b.
The favorable outcomes of the event are spinning 1 green and 1 purple.
2. a. There are 3 sections with a 3. So, spinning a 3 can occur in 3 ways.
b.
The favorable outcomes of the event are spinning 3 purple, 3 blue, and 3 orange.
3. a. There are 5 sections with an odd number. So, spinning an odd number can occur in 5 ways.
b.
The favorable outcomes of the event are spinning 1 green, 1 purple, 3 orange, 3 blue, and 3 purple.
4. a. There are 3 sections with an even number. So, spinning an even number can occur in 3 ways.
b.
The favorable outcomes of the event are spinning 2 blue, 2 orange, and 2 green.
5. a. There are 8 sections with a number greater than 0. So, spinning a number greater than 0 can occur in 8 ways.
b.
The favorable outcomes of the event are spinning 1 green, 1 purple, 2 blue, 2 orange, 2 green, 3 orange, 3 blue, and 3 purple.
6. a. There are 5 sections with a number less than 3. So, spinning a number less than 3 can occur in 5 ways.
b.
The favorable outcomes of spinning a number less than 3 are 1 green, 1 purple, 2 blue, 2 orange, and 2 green.
7. ( ) number of even numberseven
total number of numbers3
61
2
P =
=
=
The experimental probability of rolling an even number is 1
,2
or 50%.
8. ( ) number of times 3 spun 16 83
total number of spins 70 35P = = =
The experimental probability of spinning a 3 is 8
,35
or
about 22.9%.
9. The total number of times an odd number was spun is 14 16 13 43.+ + =
( ) number of timesan odd number spun 43
oddtotal number of spins 70
P = =
The experimental probability of spinning an odd number
is 43
,70
or about 61.4%.
10. The number of times not 5 was spun is
14 12 16 15 57.+ + + =
( ) number of times 5 spun 57 5
total number of spins 70
notP not = =
The experimental probability of not spinning a 5 is 57
,70
or about 81.4%.
1 not 1
1 green, 1 purple
2 blue, 2 orange, 2 green, 3 purple, 3 blue, 3 orange
3 not 3
3 purple, 3 blue, 3 orange
1 green, 1 purple, 2 blue,2 orange, 2 green
odd not odd
1 green, 1 purple, 3 orange, 3 blue, 3 purple
2 blue, 2 orange,2 green
even not even
2 blue, 2 orange, 2 green
1 green, 1 purple, 3 orange,3 blue, 3 purple
greater than 0 not greater than 0
1 green, 1 purple, 2 blue, 2 orange, 2 green, 3 orange,
3 blue, 3 purple none
less than 3 not less than 3
1 green, 1 purple, 2 blue, 2 orange, 2 green
3 orange, 3 blue, 3 purple

Chapter 10
Big Ideas Math Red Accelerated Copyright © Big Ideas Learning, LLC Worked-Out Solutions All rights reserved. 316
11. The number of times a number greater than 3 was spun is 15 13 28.+ =
( ) number of timesgreater than 3 spun 28 2
greater than 3total number of spins 70 5
P = = =
The experimental probability of spinning a number
greater than 3 is 2
,5
or 40%.
12. ( ) number of blue sections 2 1blue
total number of sections 8 4P = = =
The theoretical probability of spinning blue is 1
,4
or 25%.
13. ( ) number of "1" sections 31
total number of sections 8P = =
The theoretical probability of spinning a 1 is 3
,8
or
37.5%.
14. ( ) number of even sections 5even
total number of sections 8P = =
The theoretical probability of spinning an even number
is 5
,8
or 62.5%.
15. ( ) number of "4" sections 14
total number of sections 8P = =
The theoretical probability of spinning a 4 is 1
,8
or
12.5%.
16. ( ) number of even sectionseven
total number of sections2 8
312
P
nn
=
=
=
There are 12 sections on the spinner.
17. Event 1: Choosing a bracelet (6 possible)
Event 2: Choosing a necklace (15 possible)
6 15 90× =
There are 90 ways you can wear one bracelet and one necklace.
18.
( ) number of favorable outcomes
number of possible outcomesP event =
( ) 3 1T, T, even
24 8P = =
So, the probability of flipping two tails and rolling an
even number is 1
,8
or 12.5%.
19. ( ) ( ) ( )( ) ( ) ( )
and
blue and tails blue tails
4 1
7 22
7
P A B P A P B
P P P
= •
= •
= •
=
The probability of choosing a blue tile and flipping tails
is 2
, or about 28.6%.7
20. ( ) ( ) ( )( ) ( ) ( )
and
G and tails G tails
1 1
7 21
14
P A B P A P B
P P P
= •
= •
= •
=
The probability of choosing the letter G and flipping tails
is 1
, or about 7.1%.14
H
H H 1H H 2H H 3H H 4H H 5H H 6
Coin Cube Outcome
123456
T
H T 1H T 2H T 3H T 4H T 5H T 6
123456
H
Coin
H
T H 1T H 2T H 3T H 4T H 5T H 6
123456
T
T T 1T T 2T T 3T T 4T T 5T T 6
123456
T
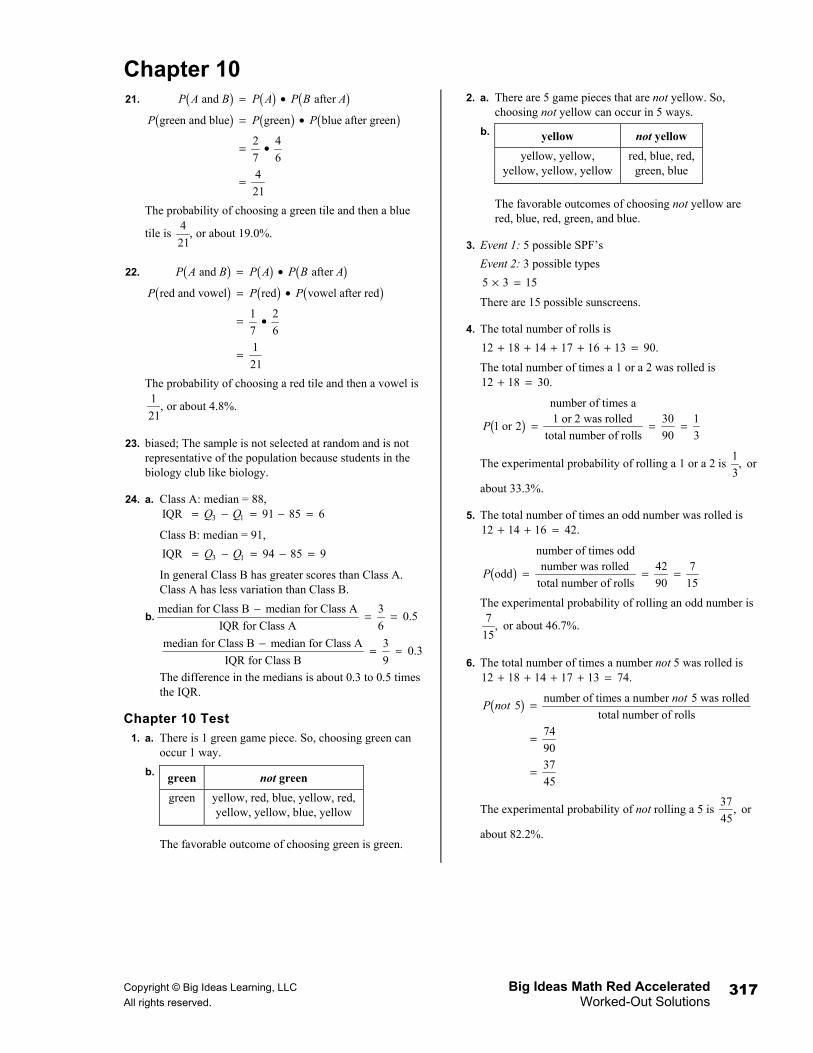
Chapter 10
Copyright © Big Ideas Learning, LLC Big Ideas Math Red Accelerated All rights reserved. Worked-Out Solutions
317
21. ( ) ( ) ( )( ) ( ) ( )
and after
green and blue green blue after green
2 4
7 64
21
P A B P A P B A
P P P
= •
= •
= •
=
The probability of choosing a green tile and then a blue
tile is 4
, or about 19.0%.21
22. ( ) ( ) ( )( ) ( ) ( )
and after
red and vowel red vowel after red
1 2
7 61
21
P A B P A P B A
P P P
= •
= •
= •
=
The probability of choosing a red tile and then a vowel is 1
, or about 4.8%.21
23. biased; The sample is not selected at random and is not representative of the population because students in the biology club like biology.
24. a. Class A: median = 88,
3 1IQR 91 85 6Q Q= − = − =
Class B: median = 91,
3 1IQR 94 85 9Q Q= − = − =
In general Class B has greater scores than Class A. Class A has less variation than Class B.
b.median for Class B median for Class A 3
0.5IQR for Class A 6
− = =
median for Class B median for Class A 30.3
IQR for Class B 9
− = ≈
The difference in the medians is about 0.3 to 0.5 times the IQR.
Chapter 10 Test 1. a. There is 1 green game piece. So, choosing green can
occur 1 way.
b.
The favorable outcome of choosing green is green.
2. a. There are 5 game pieces that are not yellow. So, choosing not yellow can occur in 5 ways.
b.
The favorable outcomes of choosing not yellow are red, blue, red, green, and blue.
3. Event 1: 5 possible SPF’s
Event 2: 3 possible types
5 3 15× =
There are 15 possible sunscreens.
4. The total number of rolls is
12 18 14 17 16 13 90.+ + + + + =
The total number of times a 1 or a 2 was rolled is 12 18 30.+ =
( )number of times a1 or 2 was rolled 30 1
1 or 2total number of rolls 90 3
P = = =
The experimental probability of rolling a 1 or a 2 is 1
,3
or
about 33.3%.
5. The total number of times an odd number was rolled is 12 14 16 42.+ + =
( )number of times oddnumber was rolled 42 7
oddtotal number of rolls 90 15
P = = =
The experimental probability of rolling an odd number is 7
,15
or about 46.7%.
6. The total number of times a number not 5 was rolled is 12 18 14 17 13 74.+ + + + =
( ) number of times a number 5 was rolled 5
total number of rolls74
9037
45
notP not =
=
=
The experimental probability of not rolling a 5 is 37
,45
or
about 82.2%.
green not green green yellow, red, blue, yellow, red,
yellow, yellow, blue, yellow
yellow not yellow yellow, yellow,
yellow, yellow, yellow
red, blue, red,green, blue

Chapter 10
Big Ideas Math Red Accelerated Copyright © Big Ideas Learning, LLC Worked-Out Solutions All rights reserved. 318
7. ( ) number of even-numbered sectionseven
number of sections4
9
P =
=
The probability of spinning an even number is 4
,9
or
about 44.4%.
8. ( ) ( ) ( )
( )
and
1 1 11 and 2
9 9 81
P A B P A P B
P
= •
= • =
The probability of spinning a 1 and then a 2 is 1
,81
or about 1.2%.
9. ( )
( )
2 1first is bishop
16 81
second is bishop15
P
P
= =
=
( ) ( ) ( )( ) ( ) ( )
and after
both bishop bishop bishop after bishop
1 1
8 151
120
P A B P A P B A
P P P
= •
= •
= •
=
The probability of choosing a bishop first and then
another bishop is 1
,120
or about 0.8%.
10. ( )
( )
1first is king
161
second is queen15
P
P
=
=
( ) ( ) ( )( ) ( ) ( )
and after
king and queen king queen after king
1 1
16 151
240
P A B P A P B A
P P P
= •
= •
= •
=
The probability of choosing a king first and then a queen
is 1
,240
or about 0.4%.
11. biased; The sample size is too small and students standing in line are more likely to say they prefer to buy their lunches at school.
12. a. Show A: median = 45,
3 1IQR 50 40 10Q Q= − = − =
Show B: median = 35,
3 1IQR 40 25 15Q Q= − = − =
Show B generally has a younger audience and more variation in ages than Show A.
b.median for Show A median for Show B 10
1IQR for Show A 10
− = =
median for Show A median for Show B 100.7
IQR for Show B 15
− = ≈
The difference in the medians is about 0.7 to 1 times the IQR.
Chapter 10 Standards Assessment 1. C; Only D.C. United with 3 votes, the Minnesota Lynx
with 4 votes, the New York Knicks with 5 votes, and possibly the other 6 votes are non-Florida teams. So, it is unlikely, but not impossible that this team member’s favorite professional sports team is not located in Florida.
2. 1
5or 0.2; ( )
students thatvoted Sunday 6 1
Sundaytotal number 30 5 of students
P = = =
3. G; In 2 hours, the hour hand travels 2 1
12 6= of the way
around the circle (the circumference).
The circumference of the circle is
( )222 2 84 528 mm.
7C rπ = ≈ =
So, the hour hand travels ( )1528 88 mm.
6=
4. C; 16
40 2716 27 40
432 40
432 40
40 4010.8
p
ppp
p
=
• = •=
=
=
5. H; The area of one face-off circle is
( )22 2(3.14) 15 706.5 ft .A rπ= ≈ =
So, the total area of the 5 face-off circles is
( ) 25 706.5 3532.5 ft .=
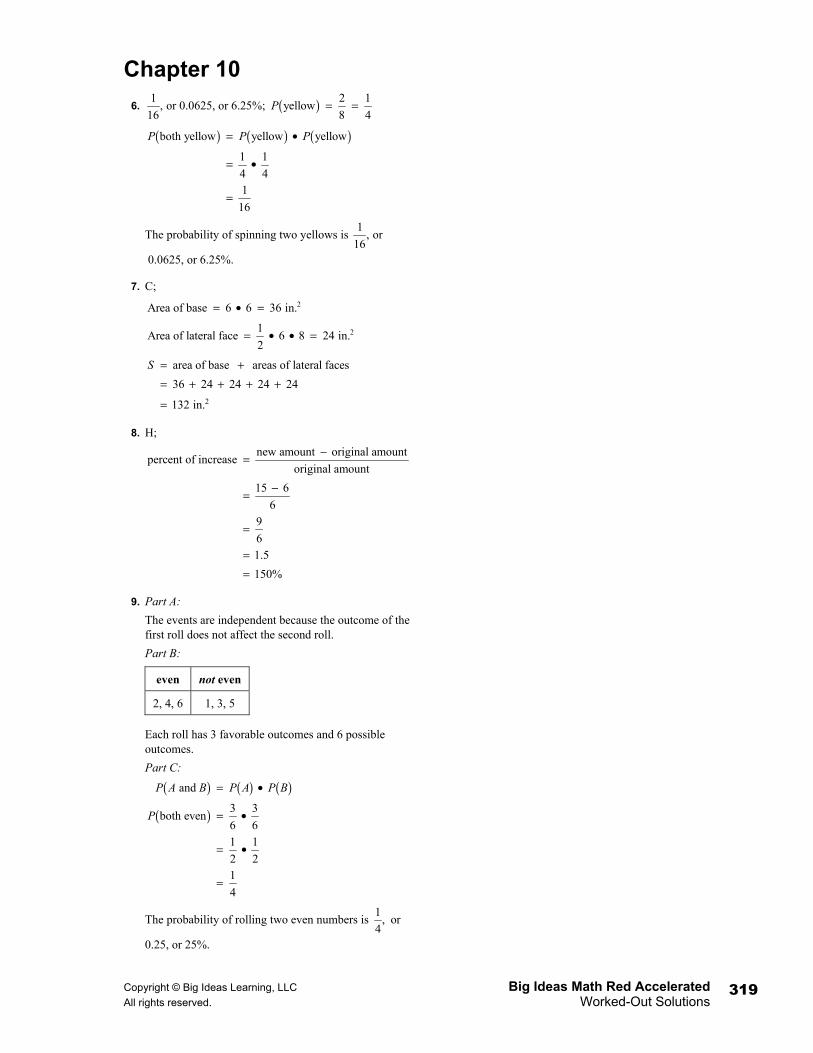
Chapter 10
Copyright © Big Ideas Learning, LLC Big Ideas Math Red Accelerated All rights reserved. Worked-Out Solutions
319
6. 1
,16
or 0.0625, or 6.25%; ( ) 2 1yellow
8 4P = =
( ) ( ) ( )both yellow yellow yellow
1 1
4 41
16
P P P= •
= •
=
The probability of spinning two yellows is 1
,16
or
0.0625, or 6.25%.
7. C;
2Area of base 6 6 36 in.= • =
21Area of lateral face 6 8 24 in.
2= • • =
2
area of base areas of lateral faces
36 24 24 24 24
132 in.
S = += + + + +
=
8. H;
new amount original amount
percent of increaseoriginal amount
15 6
69
61.5
150%
−=
−=
=
==
9. Part A: The events are independent because the outcome of the
first roll does not affect the second roll.
Part B:
Each roll has 3 favorable outcomes and 6 possible outcomes.
Part C:
( ) ( ) ( )
( )
and
3 3both even
6 61 1
2 21
4
P A B P A P B
P
= •
= •
= •
=
The probability of rolling two even numbers is 1
,4
or
0.25, or 25%.
even not even
2, 4, 6 1, 3, 5