Chapter 1: Stats Starts Here with a collection of tools...
22
Page 1 of 22 Chapter 1: Stats Starts Here What is statistics? A way of reasoning, along with a collection of tools and methods designed to help us understand the world. P2 Statistics is about variation p3 Things vary - people are different - can't see everything or measure it all - what we can measure might be inaccurate. How do we make sense of an imperfect picture of an imperfect world?
Transcript of Chapter 1: Stats Starts Here with a collection of tools...
Page 1 of 22
Chapter 1: Stats Starts Here
What is statistics? A way of reasoning, along
with a collection of tools and methods designed
to help us understand the world. P2
Statistics is about variation p3
Things vary
− people are different
− can't see everything or measure it all
− what we can measure might be inaccurate.
How do we make sense of an imperfect picture
of an imperfect world?
Page 2 of 22
When you plan a statistical study or explore
data from someone else’s work, ask your self
Why, Who, What and How (and if possible
When and Where)
Who
Individual Cases (Individuals) are the objects
described by a set of data. Cases can be people,
animals, things.
What
•A variable is any characteristic of an individual
case (or an individual.) A variable can take
different values on different cases.
Page 3 of 22
• Example: A college’s student data base.
–Individuals: students of the college.
– variables: date of birth, gender (female or
male), choice of major, GPA etc.
Think about how many variables do the data
contain? Exact definitions of these variables? In
what units of measurement is each variable
recorded? Weights for example, might be
recorded in pounds, in thousands of pounds or
in kg.
•Some variables like gender, college major
simply place individuals into categories. Others
like height, gpa take numerical values with
which we can do arithmetic.
Page 4 of 22
–Why? What purpose do the data have? Do we
hope to answer some specific questions? Do we
want to draw conclusions about individuals
other than the ones actually have data for?
Page 5 of 22
•Categorical and Quantitative variables
–A categorical variable (or qualitative
variables) places an individual into one of
several groups or categories. These categories
are sometimes called the levels.
The set of categories for a categorical variable
is called a nominal scale.
Example: For the categorical variable, the mode
of transportation to work we might use the
nominal scale {Bus, subway, car, bicycle, walk}
Page 6 of 22
–A quantitative variable takes numerical values
for which arithmetic operations are defined.
A set of numerical values for a quantitative
variable is sometimes called an interval scale.
For such variables we can answer questions like
how much larger.
Example: Annual income of Canadians
Ordinal scale: This scale falls between nominal
and interval scales. They have a natural
ordering of values but undefined interval
distances between the values.
Example: Social class – upper, middle or lower
Page 7 of 22
Because their scale consists of a set of
categories, the variables with an ordinal scale
are often treated as qualitative and analyzed
using methods for qualitative variables
However, in some respects, ordinal scale
closely resembles interval scales.
Thus in some situations, quantitative treatment
of ordinal data has benefits in some statistical
methods for data analysis.

Page 8 of 22
Example
Airlines monitored for safety and customer
service. For each flight, carriers must report:
• flight number
• type of aircraft
• number of passengers
• how late the flight was (0=on time)
• any mechanical problems
Page 9 of 22
Who, what, why, where, when, how?
− who: the individual cases (flights)
− what: the variables (as above):
− categorical: flight number, type of aircraft,
mechanical problems
− quantitative: number of passengers,
lateness (minutes).
− why: why these variables (help to assess
safety and customer service)
− when: don't know
− where: worldwide
− how: from pilot's log
Identifier variables:
− identify individual cases
− flight number

Page 10 of 22
Chapter 2: Displaying and describing
categorical data
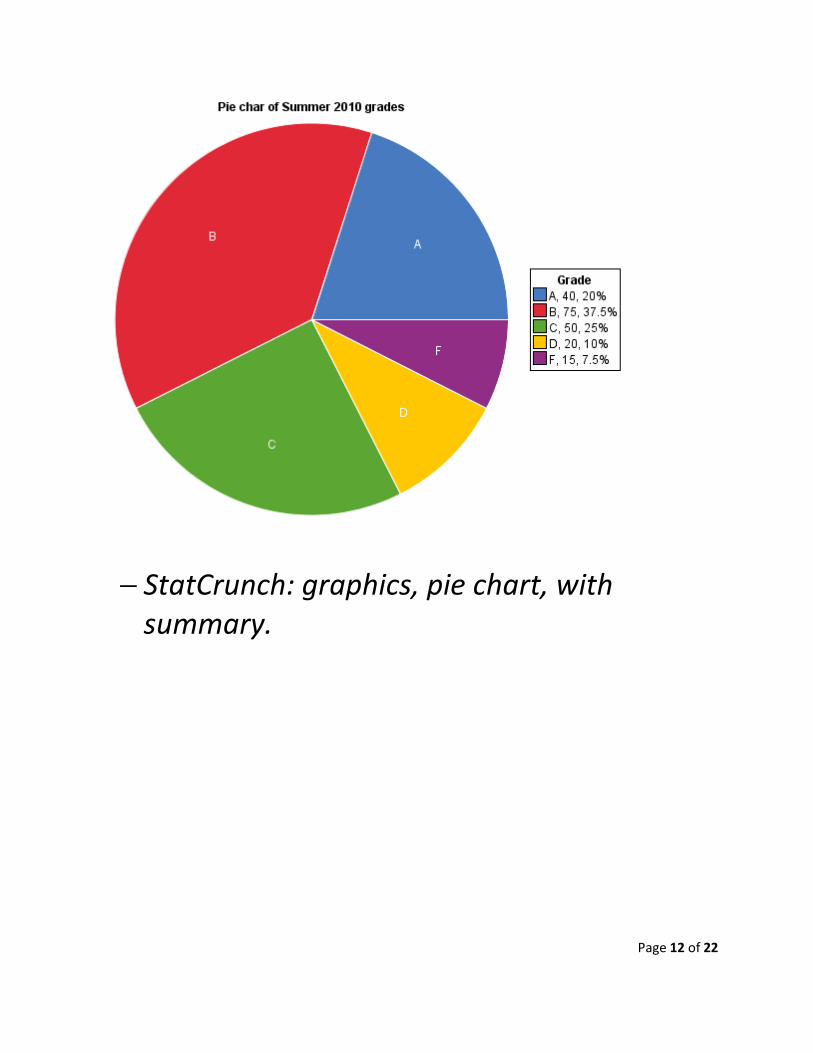
Distribution of STAB22 grades
Note: These are hypothetical values.
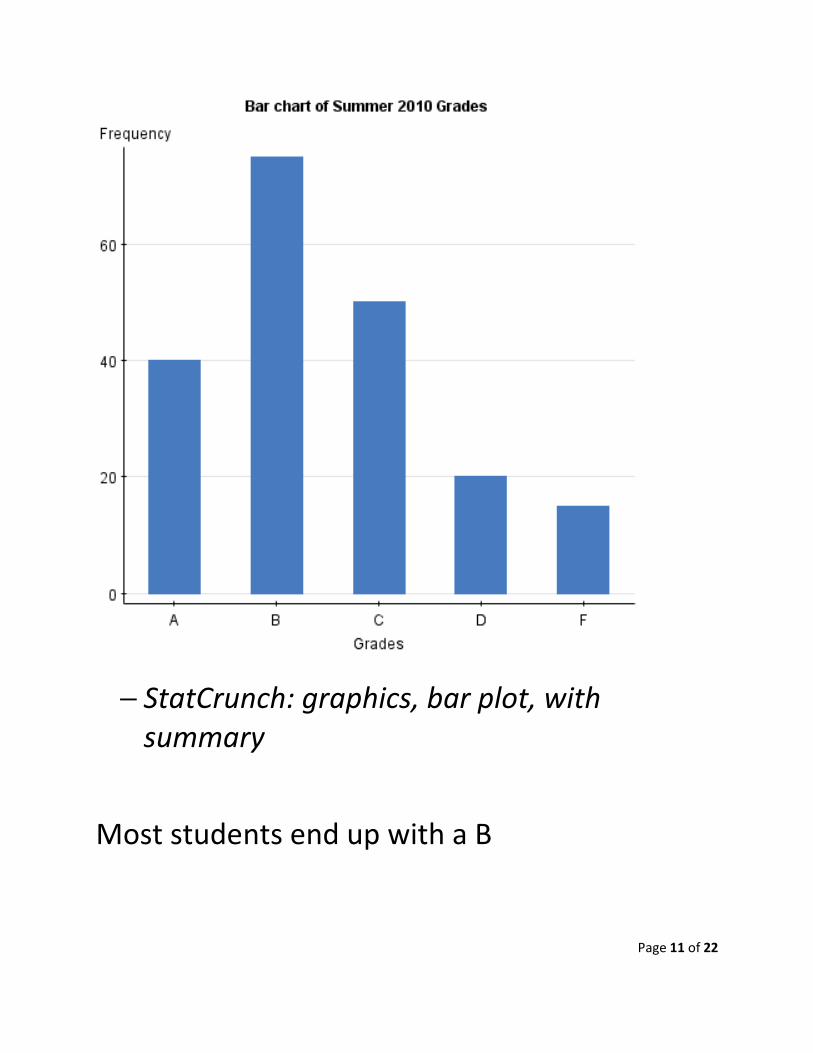
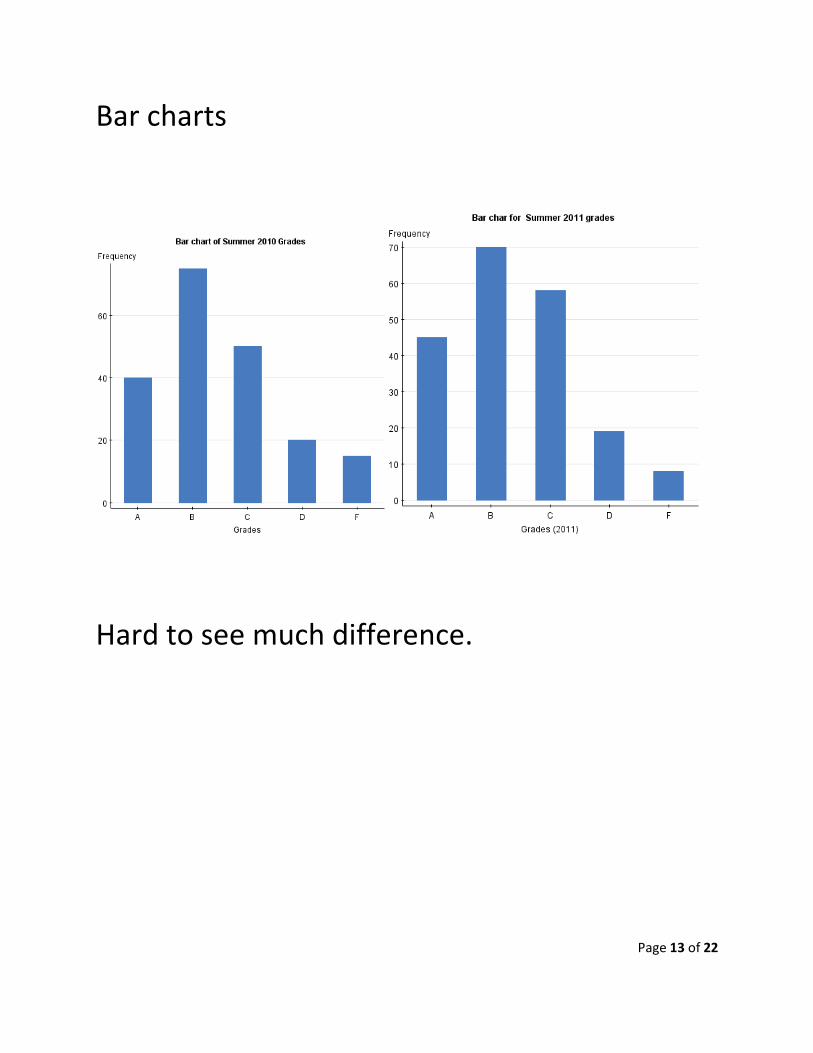
Grade Summer 2010 Summer 2011
A 40 45
B 75 70
C 50 58
D 20 19
F 15 8
Total 200 200
Page 11 of 22
− StatCrunch: graphics, bar plot, with
summary
Most students end up with a B
Page 12 of 22
− StatCrunch: graphics, pie chart, with
summary.
Page 13 of 22
Bar charts
Hard to see much difference.
Page 14 of 22
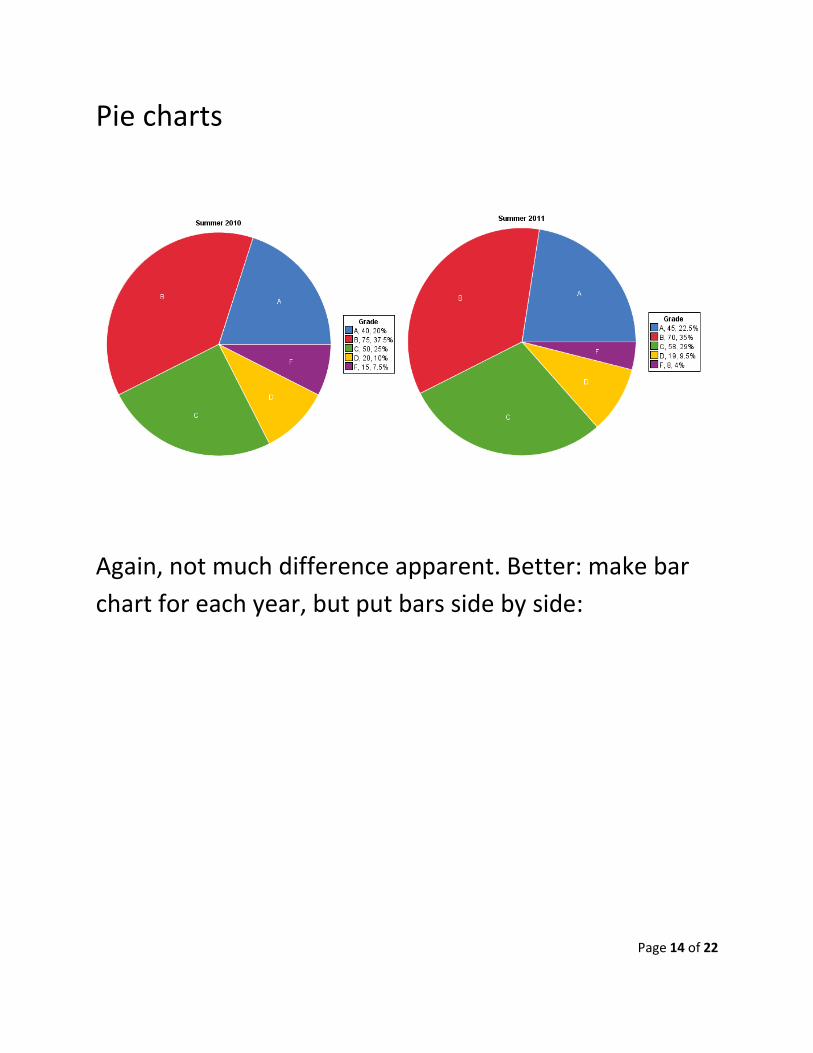
Pie charts
Again, not much difference apparent. Better: make bar
chart for each year, but put bars side by side:

Page 15 of 22
− StatCrunch: Graphics, Chart, Columns.
Page 16 of 22
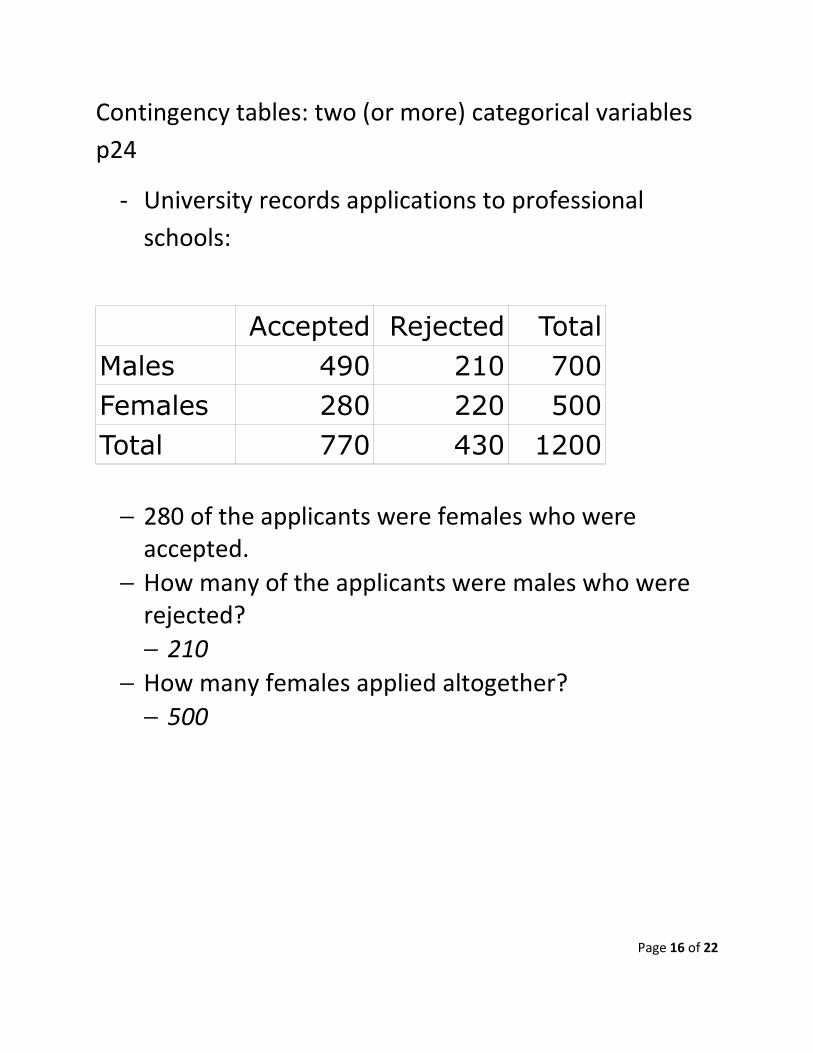
Contingency tables: two (or more) categorical variables
p24
- University records applications to professional
schools:
Accepted Rejected Total
Males 490 210 700
Females 280 220 500
Total 770 430 1200
− 280 of the applicants were females who were
accepted.
− How many of the applicants were males who were
rejected?
− 210
− How many females applied altogether?
− 500
Page 17 of 22
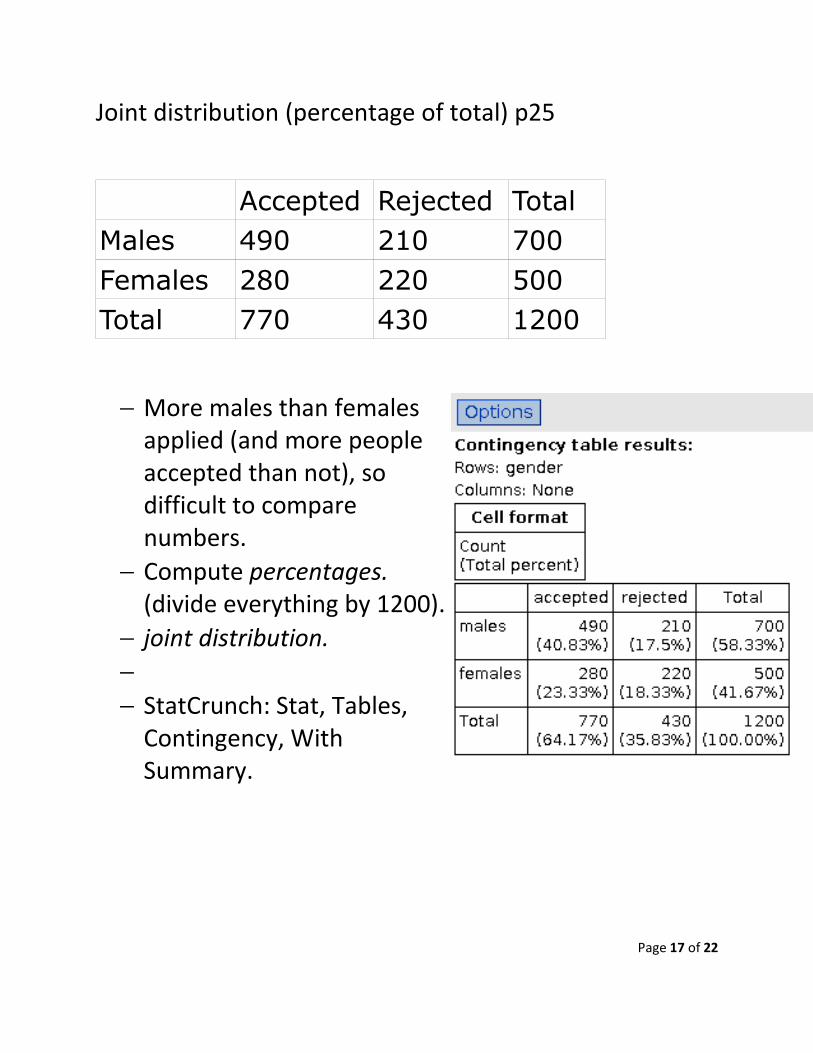
Joint distribution (percentage of total) p25
Accepted Rejected Total
Males 490 210 700
Females 280 220 500
Total 770 430 1200
− More males than females
applied (and more people
accepted than not), so
difficult to compare
numbers.
− Compute percentages.
(divide everything by 1200).
− joint distribution.
−
− StatCrunch: Stat, Tables,
Contingency, With
Summary.
Page 18 of 22
Marginal distributions p25
(a) Find the marginal distribution of gender.
(a) Find the marginal distribution for admission decision (i.e.
whether accepted or rejected)
Page 19 of 22
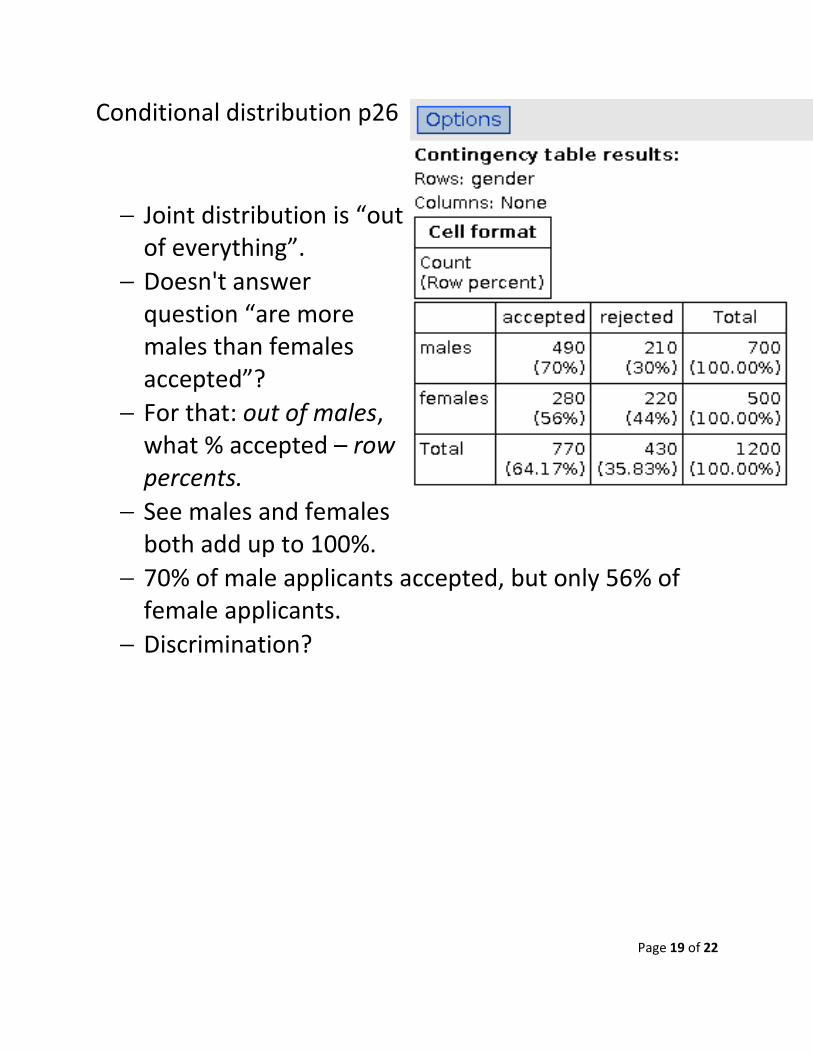
Conditional distribution p26
− Joint distribution is “out
of everything”.
− Doesn't answer
question “are more
males than females
accepted”?
− For that: out of males,
what % accepted – row
percents.
− See males and females
both add up to 100%.
− 70% of male applicants accepted, but only 56% of
female applicants.
− Discrimination?

Page 20 of 22
Column percents
− 63% of people accepted
were males.
− 51% of people rejected
were females.
- Deciding between row and column percents
Page 21 of 22
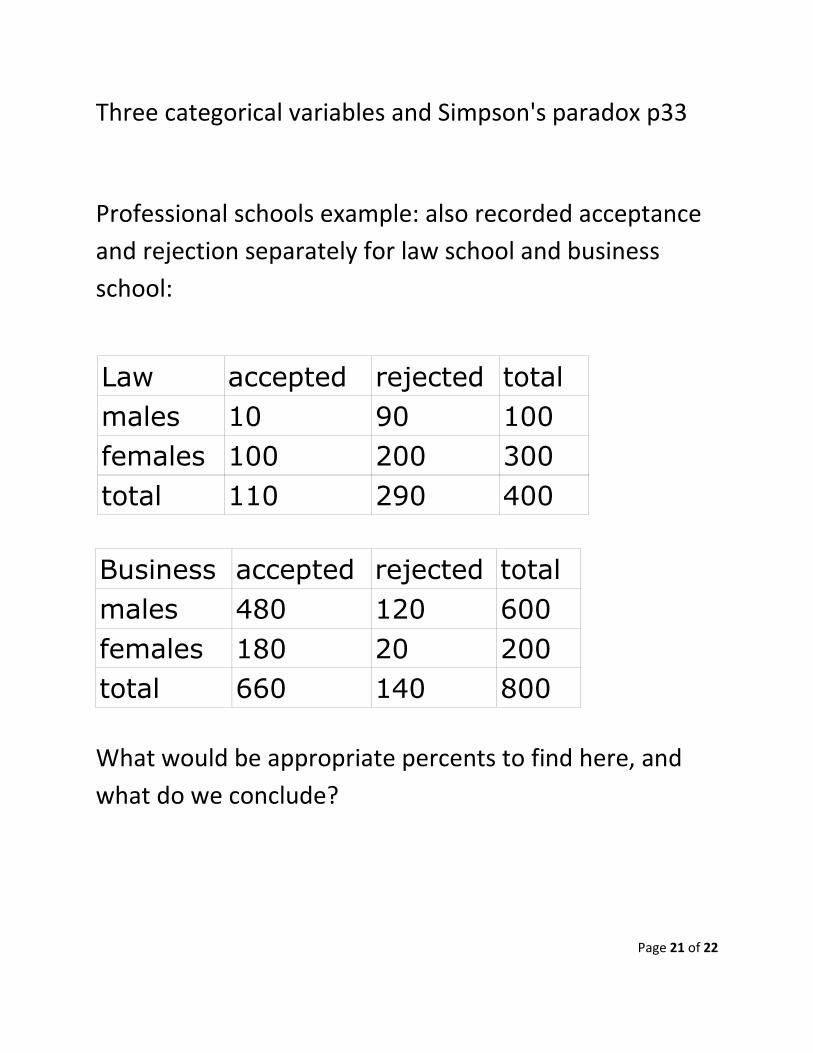
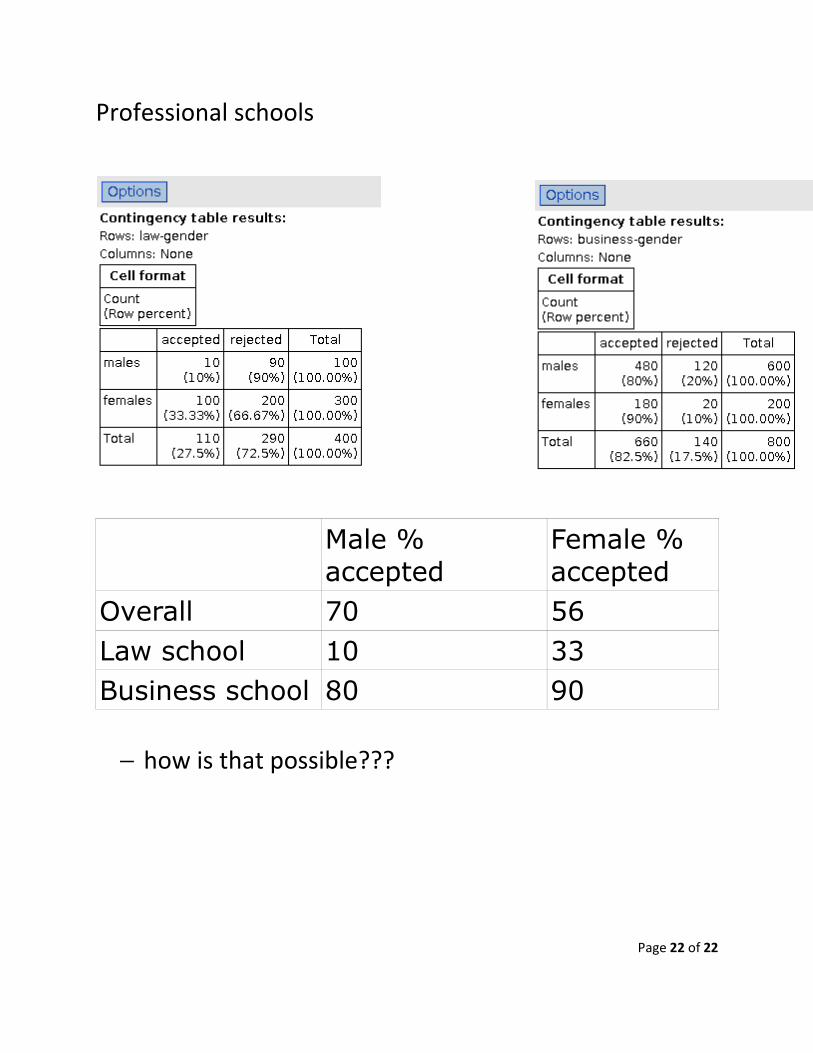
Three categorical variables and Simpson's paradox p33
Professional schools example: also recorded acceptance
and rejection separately for law school and business
school:
Law accepted rejected total
males 10 90 100
females 100 200 300
total 110 290 400
Business accepted rejected total
males 480 120 600
females 180 20 200
total 660 140 800
What would be appropriate percents to find here, and
what do we conclude?
Page 22 of 22
Professional schools
Male %
accepted
Female %
accepted
Overall 70 56
Law school 10 33
Business school 80 90
− how is that possible???