
4350.1 REV-1 CHAPTER 12. ENERGY CONSERVATION SECTION 1: CHAPTER
description

1
CHAPTER 1CHAPTER 1(INTRODUCTION TO SPECTROSCOPIC (INTRODUCTION TO SPECTROSCOPIC METHOD OF ANALYSIS)METHOD OF ANALYSIS)

2
1.1 ANALYTICAL CHEMISTRY1.1.1 Definition of Analytical Chemistry•
What is Analytical Chemistry ? »
Is the science of obtaining,processing
and communicating information about the composition and structure matter. In other words, it is the art and science of determining what matter is and how much of it exists.
1.2.1 Classification of Analytical Method•
Qualitative instrumental analysis
»
that measured property indicates presence of analyte in matrix.
•
Quantitative instrumental analysis
»
the magnitude of measured property is proportional to concentration of analyte in matrix.

3
1.2.1 (a) Classical•
Qualitative
»
identification by colour indicators, boiling points, and odors.
•
Quantitative
»
identification by mass or volume
(e.g. gravimetric, volumetric)
1.2.1 (b) Instrumental •
Qualitative
»
chromatography, electrophoresis and identification by measuring physical property
(e.g. spectroscopy, electrode potential, gas chromatography).
•
Quantitative
»
measuring property and determining relationship of concentration
(e.g. spectrophotometry, mass spectrometry).•
Often, same instrumental method can be used for both analysis.

4
1.2 PROPERTIES OF ELECTROMAGNETIC SPECTRUM1.2.1 Electromagnetic Radiation•
Electromagnetic radiation (EM) »
a form of energy
that is transmitted through space at enormous velocity.
•
It could be described as a wave
with properties of wavelength (w/l), frequency, velocity and amplitude.
•
In contrast to sound waves, light requires no supporting medium for its transmission.
Thus it easily passes through a vacuum.•
Light also travels nearly million times faster than sound.•
In order to understand the phenomena of absorption and emission of radiant energy, let treat EM (light) as or particles
called photon or quanta.
•
Each photon
carries a specific amount of energy (associated with photo’s w/l or frequency).

5
•
Photons emitted from a source will spread out in all directions at the speed of light.
•
Since the amount of area surrounding of a source increases as the distance squared, the density of photons will decrease.
Figure 1.1 : Emitted photons from a source

6
1.2.2 Wave Properties•
EM radiation (light)
is modeled as wave consisting of perpendicularly oscillating electric & magnetic fields.
•
This wave can be describe with properties of wavelength (w/l), frequency, velocity and amplitude.
•
In Figure 1.2, a plane polarized wave is shown propagating along
the x-axis.
Figure 1.2 : A plane polarized wave

7
1.2.3 Wave Characteristics
Figure 1.3 : The electric field oscillates in a plane perpendicular to the magnetic field
•
Amplitude (A) »
length of electric field at the wave maximum.
•
Wavelength (λ) »
linear distance between successive maxima/
minima
[ distance between waves ].

8
•
Period (p)
»
time in seconds required for the passage of successive
maxima/minima through a fixed point in a space or [ time for 1 λ
to
pass fixed point ].
•
Frequency, (υ)
»
number of oscillations of the electric field vector
per unit time or [ no of λ
passing per second (s) ].
Note : the units of υ
are Hz (Hertz) = # per sec (s-1)•
Wavenumber ( )
»
number of waves per cm
or
[ no of λ
per cm ].
1p
υ =
υ
1υλ
=

9
•
Velocity (v)
»
wave front through as a medium depends on both
medium and frequency or distance point on wave travels per second.
1.2.4 Speed of Light•
In a vacuum, lights travels at its maximum velocity.•
The velocity of light in air is only about 0.03% less than its velocity in a vacuum. Thus, for a vacuum or for air, the velocity of light :
ν υ λ= ⋅
8 1
10 1
3.00 10
3.00 10
vacuum c
ms
cms
ν υ λ−
−
= = ×
= ×
= ×

10
Figure 1.4 : Motion at the speed of light
c = 300,000 kms-1
= 3 x 10⁸
ms-1

11
1.2.5 The Particle Nature of Light : Photon•
In many radiation or matter interaction, light is considered as consisting of photon or quanta.
•
Photon
is a particle of electromagnetic radiation having zero mass and energy
of hυ.•
The relation btw the energy of photon to its w/l, frequency & w/n by :
where h is Plank’s constant (6.63 x 10⁻³⁴
Js).
•
Thus, photons of light have energy proportional to frequency.
hcE h hcυ υλ
= = =

12
1.3 THE ELECTROMAGNETIC SPECTRUM•
The EM spectrum covers an enormous range of energies (υ) and
w/l as shown in Figure 1.5. •
The major division of the visible light is shown in Figure 1.6.
The visible portion to which our eyes are respond is only a minute portion of the entire spectrum.
•
The types of atomic and molecular transitions that result from interactions of the radiation
with a sample for the spectroscopic analysis in the regions of the EM spectrum is displayed in Figure 1.7.
•
The spectrochemical methods not only the visible (Vis) but also ultraviolet (UV) and infrared (IR) radiations are often called optical method.

13Figure 1.5 : Electromagnetic spectrum

14
Figure 1.6 : Prism is used to find that (Visible) white light contains a rainbow of colors
(ROYGBV)

15Figure 1.7 : The region of electromagnetic spectrum

16
1.4 ATOMIC AND MOLECULAR ENERGY •
Molecules undergo three different types of quantized transitions
when excited by UV, Vis and IR.
•
For UV and Vis radiations, excitation involves promotion of an electron (e-) residing in a low energy molecular or atomic orbital to a
higher energy orbital.
•
Energy level for atoms, ions or molecules different.
•
The energy (hυ) of the photon = the energy difference btw 2 orbital energies which are Eo
and En :Eo = ground state (min energy states of species)E1, E2, E3… = excited states
as can be shown in Figure 1.8.
•
Measuring energy levels gives means of identification for spectroscopic analysis.
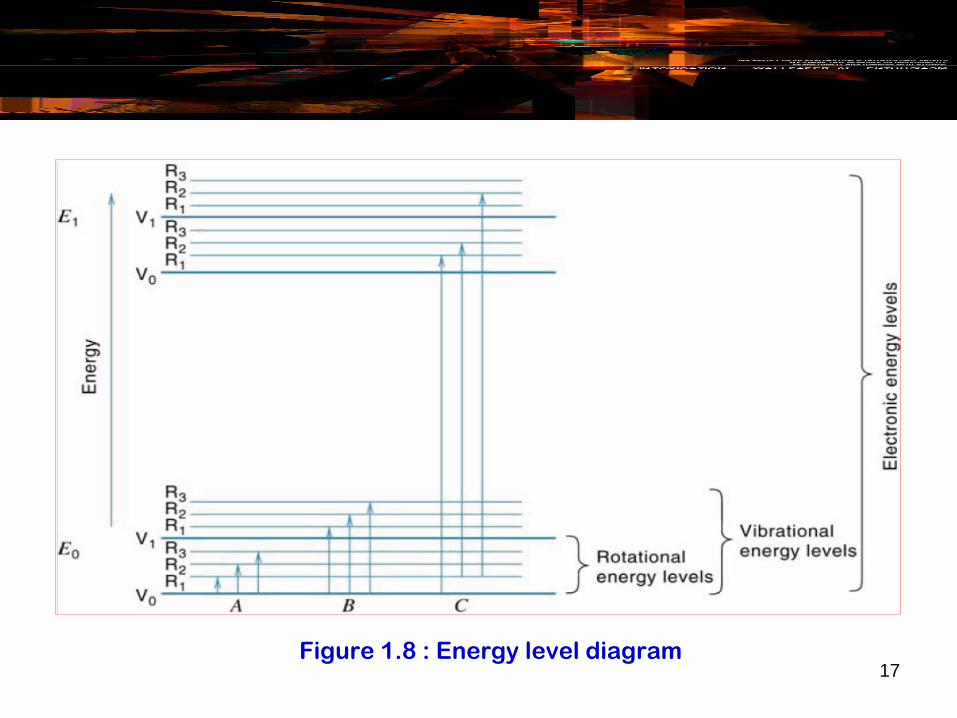
17Figure 1.8 : Energy level diagram

18
•
e-
transfer from one orbital to another (an atom, ions or molecules changes their energy state). Since each orbital has a very specific level, ET btw the orbitals absorb and emit
for a specific amounts of energy which this energy equal to the
energy difference.
λυ hchEEE o ==−=Δ 1 λυ hchEEE o ==−=Δ 1 λυ hchEEE o ==−=Δ 1 λυ hchEEE o ==−=Δ 1
Figure 1.9 : Model of atom for 3 orbitals
19
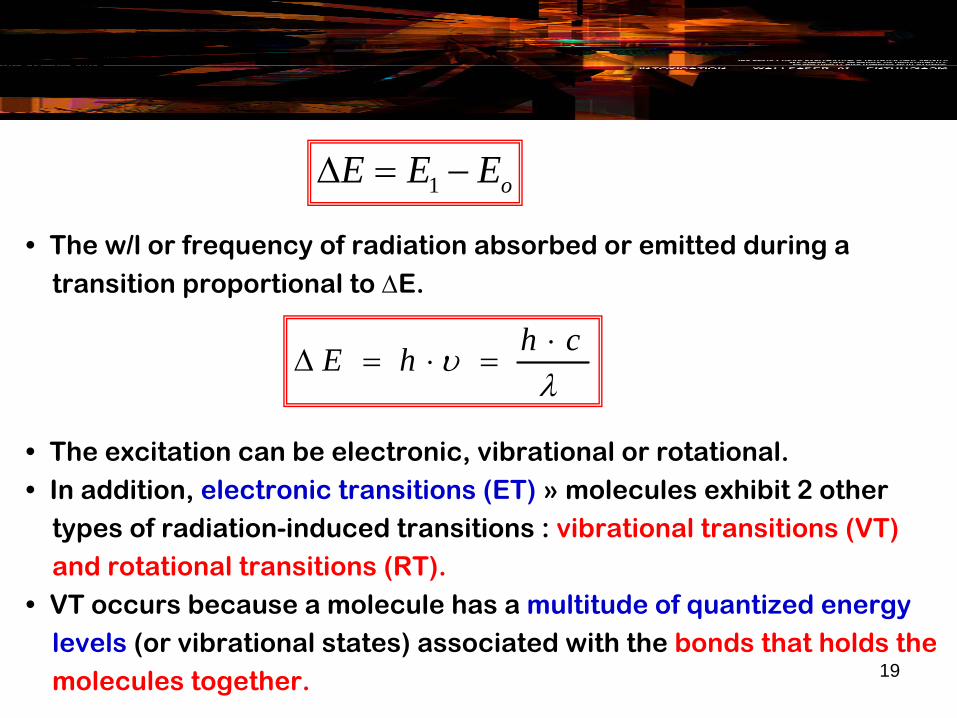
•
The w/l or frequency of radiation absorbed or emitted during a
transition proportional to ΔE.
•
The excitation can be electronic, vibrational or rotational.•
In addition, electronic transitions (ET) »
molecules exhibit 2 other types of radiation-induced transitions : vibrational transitions (VT) and rotational transitions (RT).
•
VT occurs because a molecule has a multitude of quantized energy levels (or vibrational states) associated with the bonds that holds the molecules together.
h cE h υλ⋅
Δ = ⋅ =
λυ hchEEE o ==−=Δ 1 λυ hchEEE o ==−=Δ 1 λυ hchEEE o ==−=Δ 1 λυ hchEEE o ==−=Δ 1
1 oE E EΔ = −

20
•
The total energy, E, associated with molecule is then given by :
where ;Eelectronic
= energy associated with the e-
in the various outer orbitals of molecules.Erotational = energy of the molecules as a whole due to interatomic vibrations.Erotational
= energy associated with rotation of the molecule about it center gravity.
•
For atoms, no vibrational or rotational energy level »
sharp line spectra with few features.
•
For molecules, there are electronic, vibrational and rotational energy levels »
broad band spectra with many features.
λυ hchEEE o ==−=Δ 1 λυ hchEEE o ==−=Δ 1 λυ hchEEE o ==−=Δ 1 λυ hchEEE o ==−=Δ 1
total rotational vibrational electronicE E E E= + +

21
•
Photons interact quite strongly with e-
in atomsi. Absorbing Energy :
e- jumps up » photon absorbed A photon interacts with an atom’s orbital electron and raises it to a higher energy state.The electron absorbs the photon’s energy.
ii. Emitting Energy :e- jumps down » photon emitted After a short time the electron falls back to its lower energy state emitting a photon with the energy of the difference btw the 2 energy states.
Figure 1.10 : Model of atom for e-
absorbs (top) and emits (bottom) the photon’s energy
22
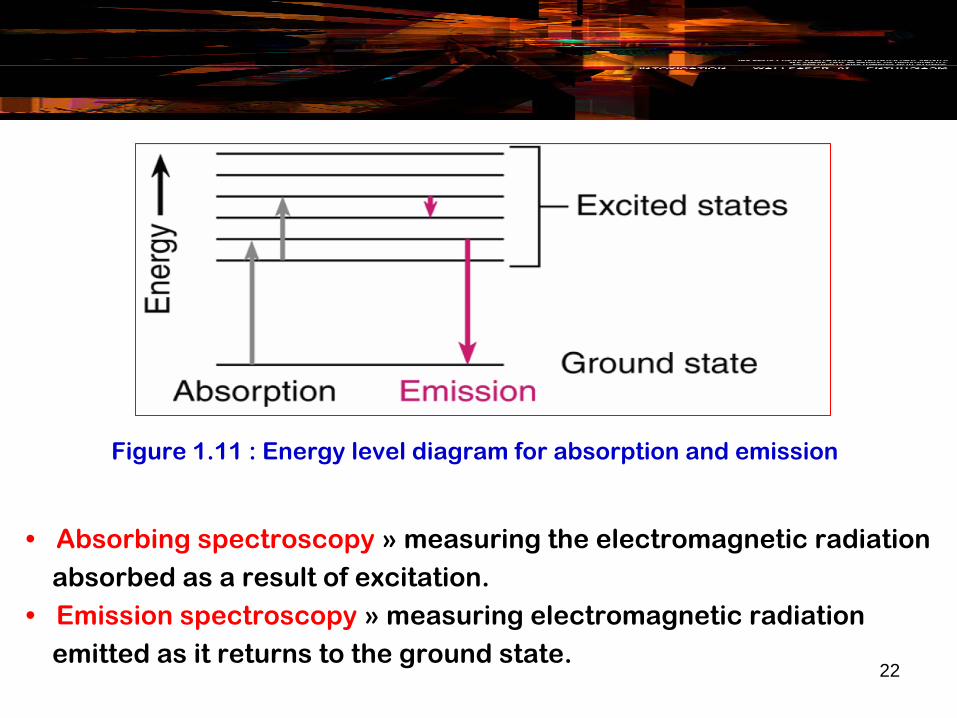
•
Absorbing spectroscopy
»
measuring the electromagnetic radiation absorbed as a result of excitation.
•
Emission spectroscopy
»
measuring electromagnetic radiation emitted as it returns to the ground state.
Figure 1.11 : Energy level diagram for absorption and emission
23
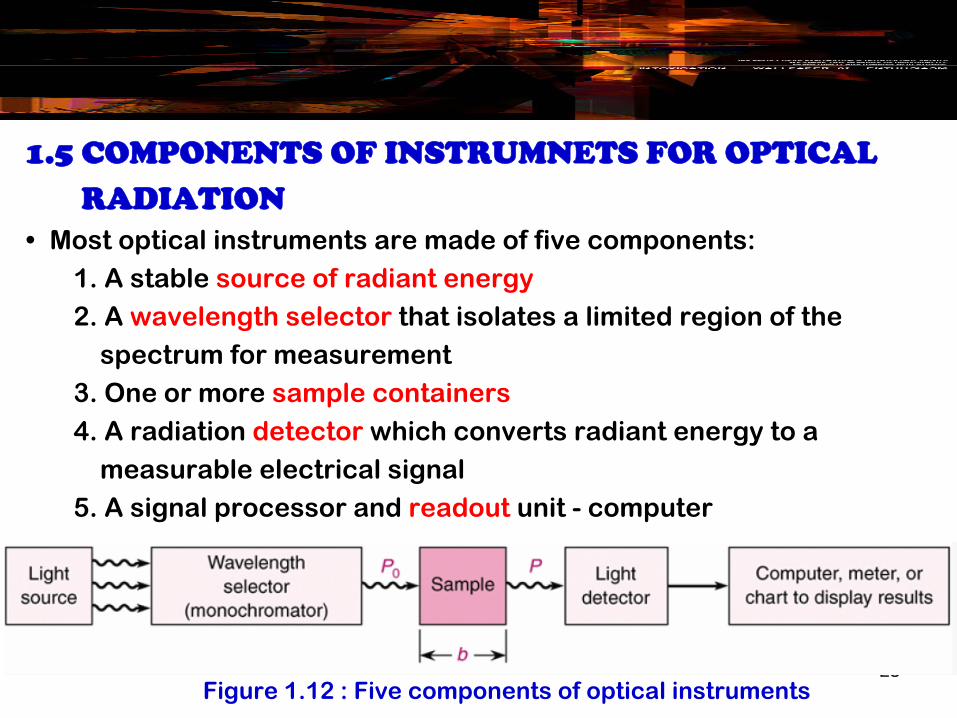
1.5 COMPONENTS OF INSTRUMNETS FOR OPTICAL RADIATION
•
Most optical instruments are made of five components:1. A stable source of radiant energy2. A wavelength selector
that isolates a limited region of the spectrum for measurement
3. One or more sample containers4. A radiation detector
which converts radiant energy to a measurable electrical signal
5. A signal processor and readout
unit -
computer
Figure 1.12 : Five components of optical instruments

24Figure 1.13 : Common components for optical instruments

25
1.4.1 The Transmittance of Optical Radiation •
The cells, windows, lenses, mirrors and wavelength-selecting elements in an optical spectroscopic instrument must transmit radiation in the w/l region which being investigated.
Figure 1.14 : Transmittance range for various optical materials

26
1.5.2 Radiation Sources•
A source must generate a beam of radiation
that is sufficiently powerful to allow easy detection and measurement.
•
Its output power should be stable
for reasonable periods of time.
1.5.2 (a) Continuum Source for UV-Vis•
Spectroscopic sources can be divided into two :i. Continuum source
Emit radiation that changes in intensity slowly as a function of w/l.Example : Xenon arc lamps, H2 & D2 lamp, Tungsten/halogen lamp, Nernst glower.

27
ii. Line sourceEmit a limited number of spectral lines » spans a very limited w/l range.Example : low pressure mercury arc lamp, hollow cathode lamp and laser.
•
Widely use in UV range :a. Hydrogen/deuterium lamps, w/l : 160 –
380 nmb. Tungsten/ halogen lamp, w/l : 240 –
2500 nm
Figure 1.15 : Types of spectra (a) continuum source (b) line source i. absorption spectrum ii. emission spectrum
(a)
(b) i.
(b) ii.

28
a. Tungsten/halogen•
Have a small amount of iodine within quartz envelop that houses the filament.
•
Allows to operate at 3500K –
give higher intensity.
•
Lifetime is double that ordinary tungsten.
b. Deuterium•
Is often used.•
Consists of a cylindrical tube containing deuterium at low pressure.
•
Involves the formation of an excited molecules D2
* / H2
* by absorption of electrical energy.
Figure 1.16 : Tungsten lamp (top) Deuterium lamp (bottom)

29Figure 1.17 : Light intensity vs w/l for deuterium and tungsten lamps

30
1.5.2 (b) Continuum Source for Infrared Radiation•
Types of source:a.
Tungsten/halogen lampb.
Nernst glowerc.
Nichrome wired.
Globar
i. Globar Made of silicon carbide rod.IR radiation is emitted when the Globar is heated to about 1500°C by electricity.Wavelength range : 1200 – 40,000 nm.

31
ii. Nernst glowerA cylinder of zirconium and yttrium oxides.Emits IR radiation when heated to high temperature by an electric current.Wavelength range : 400 – 20,000 nm.
1.5.3 Wavelength Selectors • Spectroscopic instruments in the UV and Vis regions are usually
equipped with one or more devices
to restrict the radiation
being measured to a narrow band that is absorbed or emitted by the analyte.
• These devices enhance
selectivity and sensitivity
of instruments.• Many instruments use a monochromator
or filter
to isolated the desired w/l band of interest »
is detected and measured.

32
•
Other use a spectrograph to spread out the or disperse a w/l
» can be detected with a multichannel detector.
1.5.3 (a) Monochromotors•
There are basically 2 methods to produce a spectrum in manochromator :a. a glass prismb. a diffraction grating
a. Prism•
Prisms » is a triangular pieces of glass, were first used to produce a spectrum.
•
A sliver of light
enters the prism and is delayed (refracted) atdifferent w/l
causing the light to emerge at different positions producing a rainbow of colors.

33
b. Diffracting Grating• A reflective diffraction grating
is a reflective surface with closely spaced groves and will produce a spectrum
similar to that of a prism.
• High quality gratings can produce much finer resolution than aprism.
Figure 1.18 : Prism spectrum

34
• In general, monochromator have a diffraction grating
to disperse the radiation
into its component w/l.• By rotating the grating, different w/l
can be made to pass through an exit slit.
• Slit : Light must be passed through to produce a good spectrum.
Figure 1.19 : Grating Spectrum

35
•
These system are widely used for spectral scanning applications
as well as applications requiring a fixed w/l.
•
5 common components
in monochromator system :a.
Entrance slitb.
Collimating lens or mirrorc.
Dispersion element (prism or grating)d.
Focusing lens or mirrore.
Exit slit
Figure 1.20 : Slit

36
Figure 1.21 : Grating monochromator (right)
prism monochromator (bottom)

37
1.5.3 (b) Polychromotors•
Have multiple exit slits and multiple detectors.•
This allows many discrete wavelength to be measured simultaneously.
1.5.4 Radiation Detectors and Transducer•
Detector
»
a device that indicates the existence of some physical phenomenon.
•
Example of detector are photographic film, the pointer of a balance, mercury level in thermometer and human eye.
•
Transducer »
type of detector that converts quantities
such as light intensity, pH, mass and temperature, into electrical signal
that can be amplified, manipulated and converted
into numbers proportional to the magnitude of the original quantity.

38
1.5.4 (a) Properties of Radiation Transducer•
Responds rapidly to low levels of radiant energy
over a broad w/l range.
•
Produces an electrical signal
that is easily amplified and has a low electrical noise level.
•
Electrical signal produced by transducer be directly proportional to the radiant power P of the beam.
1.5.4 (b) Types of Transducer•
Photon detectors »
a. phototubes(response to photon) b. photomultiplier tubes
c. silicon photodiodesd. photoconductive cells

39
•
Thermal Detectors »
a. thermocouples(responses to heat) b. balometers
c. pneumatic cellsd. pyroelectric cells
1.5.4 (c) Photon Detectors (UV/Vis)i. Phototubes•
Consists of a semicylindrical photocathode & a wire anode sealedinside an evacuated quartz envelope.
•
The concave surface of cathode emits e-
when radiated with light.•
When voltage is applied across the electrodes, the emitted photoelectrons are attracted to the positively charge wire anode.
•
In complete circuit, photocurrent is easily amplified and measured.

40
•
The number of photoelectrons ejected from the photocathode per unit time is directly proportional to the radiant power of the beam striking to the surface.
Figure 1.22 : A phototube and accompanying circuit

41
ii. Photomultiplier Tube•
Irradiation of cathodes produces e-, series of anodes (dynodes) increases gain to 105 to 107 per photon.
Figure 1.23 : A photomultiplier tube

42
iii. Silicon Photodiodes and Photodiode Arrays•
(Multichannel transducer) photon striking n-type Si creates free e-
which travel to p-type Si. •
Many junctions in a row »
spatially sensitive.
Figure 1.24 : Photodiode

43
1.5.4 (d) Thermal Detectors (IR)•
Thermal detectors
»
sensitive to IR (λ
> 250 nm).
•
Example of thermal detector :Thermocouples » junction thermometerBolometer » resistance thermometerPyroelectric devices » piezoelectric effect
•
In many cases, dark current reduced by cooling transducer (250 K
to 1.5 K) »
reduces thermal excitation of e-.
1.5.5 Sample Containers•
Sample containers usually called cells or cuvettes.•
Must have window that are transparent in the spectral region of interest.
•
Refer Figure 1.14, materials required for UV, Vis and IR regions.

44
•
The most common or suitable window material forGlass » 400 – 3000 nm (Vis-near IR)Silica/ quartz » 200 – 3000 nm (UV-near IR)NaCl » 200 – 15000 nm (UV-far IR)
Figure 1.25 : Sample cell


![[Download] rev chapter-1-july3rd](https://static.fdocuments.us/doc/165x107/554dd89ab4c905c70e8b4de9/download-rev-chapter-1-july3rd.jpg)


![[Download] Rev-Chapter-3](https://static.fdocuments.us/doc/165x107/55808c1dd8b42a08768b46a7/download-rev-chapter-3.jpg)


