CHAPTER 1 Introducing GIS · 4 CHAPTER 1: INTRODUCING GIS Oblique view of Petra. Blue lines...
20
CHAPTER 1 Introducing GIS Exercise objectives 1a: Explore ArcGIS Online • Explore a public map • Sign in and join an organization • Configure the map symbology • Configure map pop-up windows • Save a map What is a GIS? Probably the most commonly asked question to those working in the geographic information system (GIS) field is also one of the most difficult to answer in just a few brief paragraphs: What is a GIS? A GIS is composed of five interacting parts that include hardware, software, data, procedures, and people. You are likely already familiar with the hardware—computers, smart- phones, and tablets. e software consists of applications that help make maps. e data is information in the form of points, lines, and polygons that you see on a map. People, users like you, learn how to collect data using mobile devices and then make maps using the software and data on computers. As your knowledge of GIS grows, you will learn more about proce- dures and workflows to make maps for yourself or your organization. Decision-makers and others in an organization rely on GIS staff to maintain data and create insightful map products. GTKAGPro2ed.indb 1 11/27/18 6:53 PM
Transcript of CHAPTER 1 Introducing GIS · 4 CHAPTER 1: INTRODUCING GIS Oblique view of Petra. Blue lines...

CHAPTER 1
Introducing GISExercise objectives
1a: Explore ArcGIS Online
• Explore a public map
• Sign in and join an organization
• Configure the map symbology
• Configure map pop-up windows
• Save a map
What is a GIS?Probably the most commonly asked question to those working in the geographic information
system (GIS) field is also one of the most difficult to answer in just a few brief paragraphs:
What is a GIS? A GIS is composed of five interacting parts that include hardware, software, data,
procedures, and people. You are likely already familiar with the hardware—computers, smart-
phones, and tablets. The software consists of applications that help make maps. The data is
information in the form of points, lines, and polygons that you see on a map. People, users like
you, learn how to collect data using mobile devices and then make maps using the software
and data on computers. As your knowledge of GIS grows, you will learn more about proce-
dures and workflows to make maps for yourself or your organization. Decision-makers and
others in an organization rely on GIS staff to maintain data and create insightful map products.
GTKAGPro2ed.indb 1 11/27/18 6:53 PM

CHAPTER 1: INTRODUCING GIS2
GIS has many facets. It captures, stores, and manages data. It allows you to visualize,
question, analyze, and interpret the data to understand relationships, patterns, and trends.
GIS can be used simply for mapping and cartography. You can use it on the web to view maps
and collections of data. You can also use it to perform spatial analysis to derive information
from multiple data sources. In any capacity, the results from a GIS can influence decisions.
Organizations in almost every industry, no matter what size, benefit from GIS and realize
its value.
Collecting spatial data—that is, information that represents real-world locations and the
shapes of geographic features and the relationships between them—involves using coordinates
and a suitable map projection to reference this data to the earth. For example, the distance that
separates a conservation area and a neighborhood of a city is an example of a spatial relationship.
How is wildlife in the conservation area affected by the increasing pressures of a growing urban
setting? The spatial relationship between geographic features allows the comparison of different
types of data.
When paired with attribute data—information about spatial data—a GIS becomes a power-
ful tool. For example, the location of a hospital is considered the spatial data (referenced to the
earth). Information about the hospital, such as its name, number of rooms available, emergency
rooms, specialization in medical procedures, patient capacity, and number of staff, is all con-
sidered attribute data. You can use this attribute information to maintain records in a hospital
network. It allows people who have that information to perform spatial analysis—a technique
that reveals patterns and trends—to answer the following types of questions: What are the aver-
age wait times for emergency visits to the hospital? Does the patient capacity efficiently serve
the demographics of a given city area? Do certain medical conditions happen more frequently
in the area, and is the hospital equipped to handle them? To answer these questions fully, you
must compare the data and attempt to explain the patterns. A children’s hospital can integrate
spatial analysis with population-based resource planning to plan children’s health-care initia-
tives. This integration can greatly increase the hospital’s ability to identify and allocate resources
to better meet local health-care needs, providing timely access to care for children across a city
or region.
GTKAGPro2ed.indb 2 11/27/18 6:53 PM
INTRODUCTION 3
GIS IN THE WORLD: CULTURAL HERITAGE AND GISCultural Site Research and Management and the University of Arkansas Department
of Geosciences began a project more than 20 years ago to understand the accumu-
lating effects of nature and foot traffic in the ancient city of Petra, Jordan, a stone city
famously used as a backdrop in the movie Indiana Jones and the Last Crusade. GIS
was used to create a database and model for use in archaeological research and land
management and is currently used to automatically monitor and detect changes in the
condition of historical sites in Petra. Read more about the project, “Cultural Heritage
Management and GIS in Petra, Jordan,” at: www.esri.com/news/arcnews/summer12
articles/cultural-heritage-management-and-gis-in-petra-jordan.html.
Ad-Deir (the Monastery) high above the valley—one of the largest hewn structures in Petra. Photo courtesy of Thomas Paradise.
GTKAGPro2ed.indb 3 11/27/18 6:53 PM

CHAPTER 1: INTRODUCING GIS4
Oblique view of Petra. Blue lines represent ephemeral watercourses (wadis), and red cubes represent GPS markers at primary tomb facades. The map was created by Christopher C. Angel in ArcGIS (2012).
GIS today
GIS has been helping people better understand their world since the 1960s. It provides a frame-
work of practical means for transforming the world with all kinds of activities, from improving
emergency response to understanding bird migration patterns. People are integrating GIS into
how they work with data because it is a visual, quantitative, and analytic tool. It provides people
with the structures and concepts to handle data systematically.
People today have unprecedented access to data and information. A growing system of con-
nected networks allows people to easily access data, collaborate with others, and produce and
share results from desktops, laptops, and mobile devices—essentially from anywhere. The current
trend of connecting people who work in the office and in the field allows for real-time analysis.
Decision-makers use operations dashboards to monitor real-time data feeds and other sources of
information. For example, a GIS coordinator for a local government can track real-time emergen-
cies and respond by coordinating fire, police, and ambulance resources.
GTKAGPro2ed.indb 4 11/27/18 6:53 PM

INTRODUCTION 5
GIS is pervasive, interactive, and social. Dynamic and interactive maps on the internet,
known simply as web maps, are ideal for allowing many users to access and quickly locate fea-
tures and visualize data. In the past, it took a team of GIS professionals to put together an online
map. Now anyone can connect to ArcGIS Online, make a map with a few layers and a basemap,
and then share it with friends, coworkers, or anyone. The latest generation of web maps has sim-
plified that process and now forms a platform that anyone can use.
Governments are opening access to data at an unprecedented rate. The open data
movement provides agencies and the public with authoritative data and enables all levels of
government to develop new tools and applications. Typically, only highly sensitive data is safe-
guarded or copyrighted anymore. Open data provides a way for people to extract information
when they need it. It allows citizens, organizations, and governments to get right to problem solv-
ing, rather than spending a great deal of valuable time searching for and requesting data. ArcGIS®
Open Data, an ArcGIS Online solution, allows an organization to host the data it collects so that
the public can freely view interactive maps and search for and download data.
Governments and organizations share open data through online portals. Michigan Open Data Portal
(http://data.michigan.gov).
GTKAGPro2ed.indb 5 11/27/18 6:53 PM
CHAPTER 1: INTRODUCING GIS6
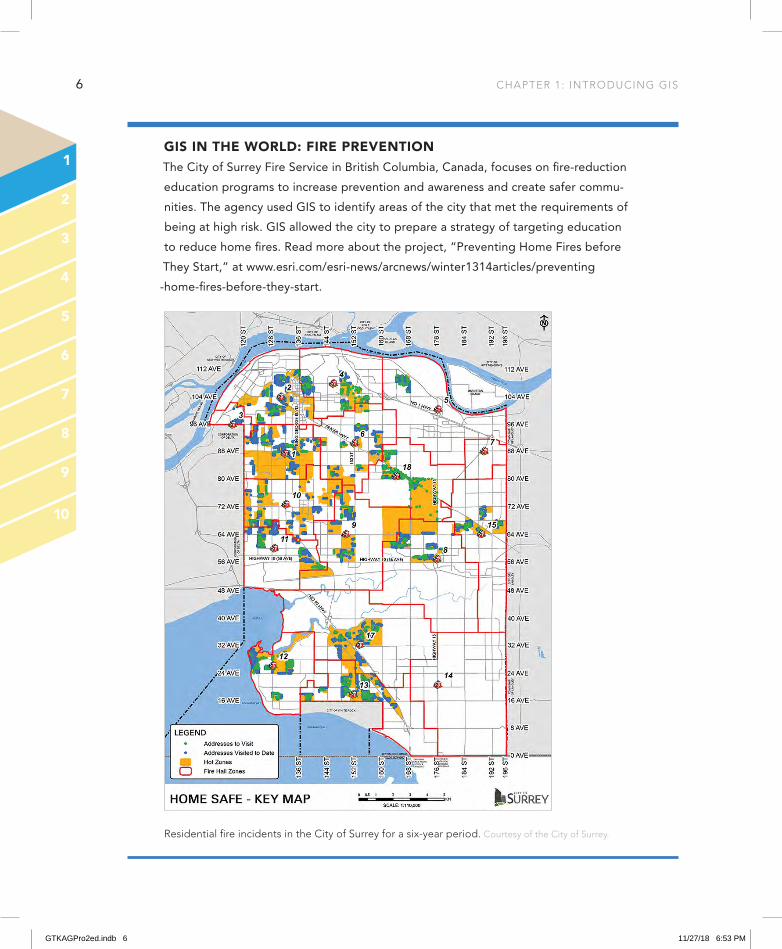
GIS IN THE WORLD: FIRE PREVENTIONThe City of Surrey Fire Service in British Columbia, Canada, focuses on fire-reduction
education programs to increase prevention and awareness and create safer commu-
nities. The agency used GIS to identify areas of the city that met the requirements of
being at high risk. GIS allowed the city to prepare a strategy of targeting education
to reduce home fires. Read more about the project, “Preventing Home Fires before
They Start,” at www.esri.com/esri-news/arcnews/winter1314articles/preventing
-home-fires-before-they-start.
Residential fire incidents in the City of Surrey for a six-year period. Courtesy of the City of Surrey.
GTKAGPro2ed.indb 6 11/27/18 6:53 PM
INTRODUCTION 7
Basic GIS principles and concepts
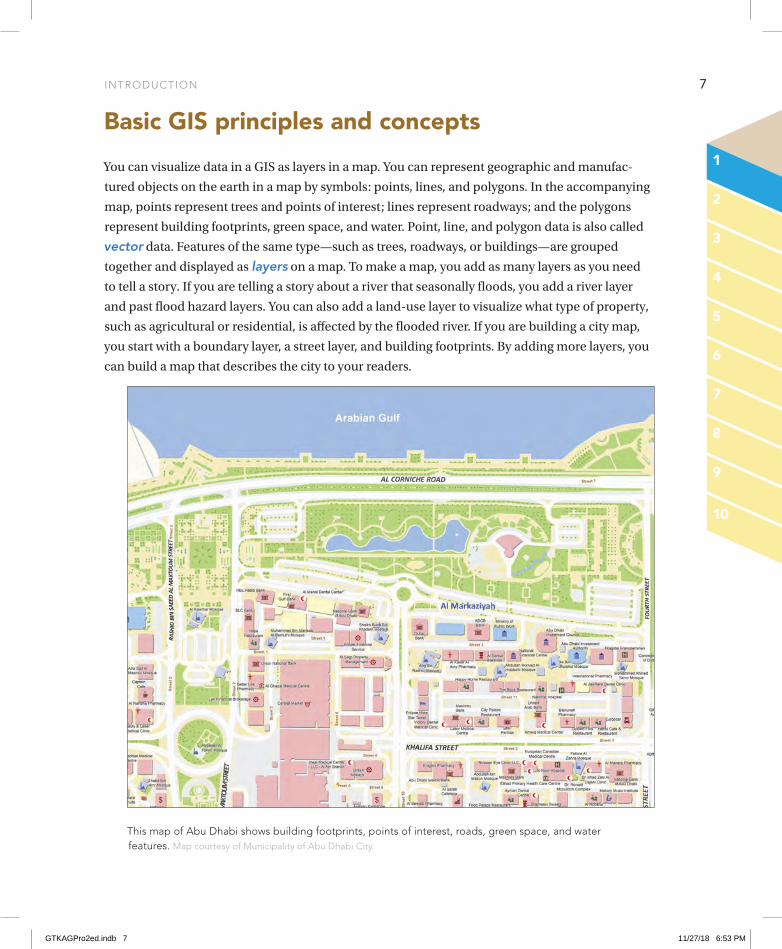
You can visualize data in a GIS as layers in a map. You can represent geographic and manufac-
tured objects on the earth in a map by symbols: points, lines, and polygons. In the accompanying
map, points represent trees and points of interest; lines represent roadways; and the polygons
represent building footprints, green space, and water. Point, line, and polygon data is also called
vector data. Features of the same type—such as trees, roadways, or buildings—are grouped
together and displayed as layers on a map. To make a map, you add as many layers as you need
to tell a story. If you are telling a story about a river that seasonally floods, you add a river layer
and past flood hazard layers. You can also add a land-use layer to visualize what type of property,
such as agricultural or residential, is affected by the flooded river. If you are building a city map,
you start with a boundary layer, a street layer, and building footprints. By adding more layers, you
can build a map that describes the city to your readers.
This map of Abu Dhabi shows building footprints, points of interest, roads, green space, and water features. Map courtesy of Municipality of Abu Dhabi City.
GTKAGPro2ed.indb 7 11/27/18 6:53 PM

CHAPTER 1: INTRODUCING GIS8
If you make a map of your house, a lake, or a city park, you might draw an outline to repre-
sent the outer boundary. But what about natural phenomena—such as temperature, elevation,
precipitation, ocean currents, and wind speed—that have no real boundaries? Weather maps
show blue areas for cold and red areas for hot. You can represent wind speed using a range of
colors. You can instead record and collect measured values for any location on the earth’s surface
to form a digital surface, also known as a raster. Captured location data is recorded in a matrix
of identically sized square cells at a specific resolution—for example, 15 square meters. In the
accompanying example, an analysis of an aquifer uses different rasters to calculate a result show-
ing saturated thickness and usable lifetime.
This map of the Ogallala Aquifer shows a surface that represents the saturated thickness, water-level change, and projected usable lifetime of the aquifer. Map courtesy of Center for Geospatial Technology.
GTKAGPro2ed.indb 8 11/27/18 6:53 PM
INTRODUCTION 9
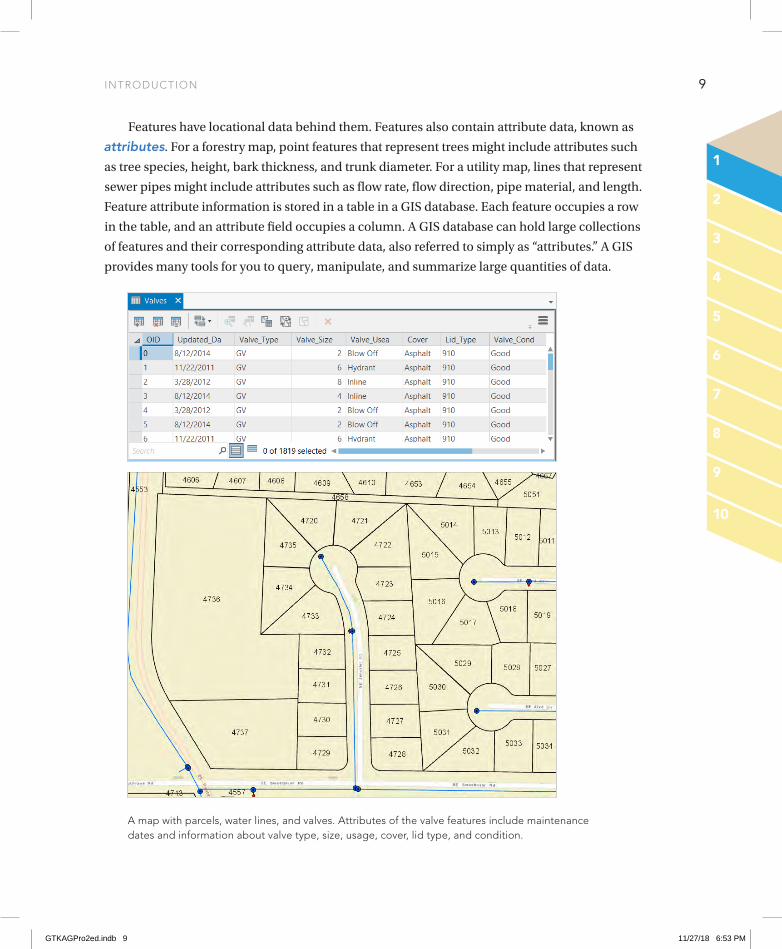
Features have locational data behind them. Features also contain attribute data, known as
attributes. For a forestry map, point features that represent trees might include attributes such
as tree species, height, bark thickness, and trunk diameter. For a utility map, lines that represent
sewer pipes might include attributes such as flow rate, flow direction, pipe material, and length.
Feature attribute information is stored in a table in a GIS database. Each feature occupies a row
in the table, and an attribute field occupies a column. A GIS database can hold large collections
of features and their corresponding attribute data, also referred to simply as “attributes.” A GIS
provides many tools for you to query, manipulate, and summarize large quantities of data.
A map with parcels, water lines, and valves. Attributes of the valve features include maintenance dates and information about valve type, size, usage, cover, lid type, and condition.
GTKAGPro2ed.indb 9 11/27/18 6:53 PM

CHAPTER 1: INTRODUCING GIS10
Data can be queried and analyzed. In a GIS, you can perform a query on all the data that
relates to phrases, terms, or features that you choose. For example, you might be looking for clus-
ters of low-income neighborhoods to analyze poverty levels per square mile. Querying data from
a database allows you to display only the data that relates to a certain theme. Additionally, a GIS
enables you to identify spatial patterns in the data through the use of geospatial processing tools.
What is the problem you are trying to solve, and where is it located? The accompanying map
shows analysis and a complex pattern of senior citizen out-migration. Depending on your project,
you can choose from among hundreds of analysis tools.
This map of Portland, Oregon, shows net migration or deaths per acre because of “senior shedding” or out-migration. The red isolines identify concentrated areas in which mothers age 30 and over gave birth. Map courtesy of Portland State University.
GTKAGPro2ed.indb 10 11/27/18 6:53 PM

INTRODUCTION 11
The ArcGIS platform
ArcGIS Pro, part of the ArcGIS Desktop suite, is designed for GIS professionals to analyze, visual-
ize, edit, and share maps in both 2D and 3D.
ArcGIS Desktop is part of the much larger ArcGIS platform, which also includes ArcGIS
Online and ArcGIS® Enterprise. Organizations can leverage the entire platform to share maps and
apps with their end users.
ArcGIS includes ready-to-use spatial data and related GIS services, such as global basemaps,
high-resolution imagery, demographic reports, lifestyle data, geocoding and routing, hosting, and
much more.
Finally, the ArcGIS platform includes essential tools for developers to build web, mobile, and
desktop apps.
The ArcGIS platform is composed of apps on desktop, web, and mobile devices, which access data controlled by servers and through online content and services.
GTKAGPro2ed.indb 11 11/27/18 6:53 PM

CHAPTER 1: INTRODUCING GIS12
ArcGIS Pro
In this book you will learn how to use ArcGIS Pro and ArcGIS Online. Your work in ArcGIS Pro
is organized into projects. These projects contain maps, layouts, layers, tables, tasks, tools, and
connections to servers, databases, folders, and styles. Essentially, all of the resources needed for a
project are in one place. ArcGIS Pro can also connect to ArcGIS Online public content. And if you
belong to an organization, you can share the content among your team. Projects are designed to
be collaborative so that others can share and open them.
Maps and layouts display a project’s spatial data in either 2D maps or 3D scenes, or both
simultaneously. You can create, view, and edit multiple maps, layouts, and scenes side by side
and even link them so that they can be panned and zoomed together. ArcGIS Pro uses ArcGIS
Online basemaps, which provide a backdrop or frame of reference as you add your own layers.
A collection of geoprocessing tools allows you to perform spatial analysis and manage GIS
data. Geoprocessing involves an operation that manipulates spatial data such as in creating a new
dataset or adding a field to a table. You can combine tools in ModelBuilder™ to create a diagram
or model of your spatial analysis or data management process. For advanced users, Python, the
scripting language of ArcGIS, provides a way to write custom scripting functions to help automate
ArcGIS workflows. And tasks can be created and defined for people of an organization who are
required to follow specific workflow steps.
The ability to share your work is a central part of the ArcGIS platform. In ArcGIS Pro, you can
share maps, layers, or entire projects. Sharing involves packaging components into a compressed
file, which you can distribute to others within your organization or externally. You can store your
package on a shared network drive, or serve it across a website or mobile device.
To work through the exercises in this book requires that you have ArcGIS Pro loaded on a
desktop or laptop computer that is running the Windows operating system, an internet con-
nection, and an up-to-date web browser to access ArcGIS Online. Optionally, you might use a
smartphone or tablet to access some of the ArcGIS apps that run on these devices.
GTKAGPro2ed.indb 12 11/27/18 6:53 PM
EXERCISE 1A
Explore ArcGIS OnlineEstimated time to complete: 45 minutes
You will begin your ArcGIS journey by exploring an ArcGIS Online map of geological units in the
United States and then configure a new map of bicycle accident data.
Exercise workflow
• Explore ArcGIS Online to find a public map that shows geological units.• Open a map that shows pedestrian and bicycle accidents.• Configure symbology for accidents and municipal boundaries.• Configure map pop-up windows for readability.• Save the map to your My Content page.
TIP Because of the dynamic nature of websites, you should be aware that the
appearance or options of ArcGIS Online may change at any time.
GTKAGPro2ed.indb 13 11/27/18 6:53 PM

CHAPTER 1: INTRODUCING GIS14
Explore a public map
1. In a web browser, go to ArcGIS Online at https://www.arcgis.com.
The ArcGIS Online home page is your starting point for learning more about the ArcGIS
platform. It has access to information about how ArcGIS Online is used, resources, and
help documentation. Even without signing in, you can view and interact with a plethora of
community-created public maps and shared data.
ON YOUR OWNClick the Features tab to learn more about how developers and professionals use
ArcGIS Online as well as how you can get maps, apps, and other services.
GTKAGPro2ed.indb 14 11/27/18 6:53 PM
ExERCISE 1A: ExPLORE ARCGIS ONLINE 15
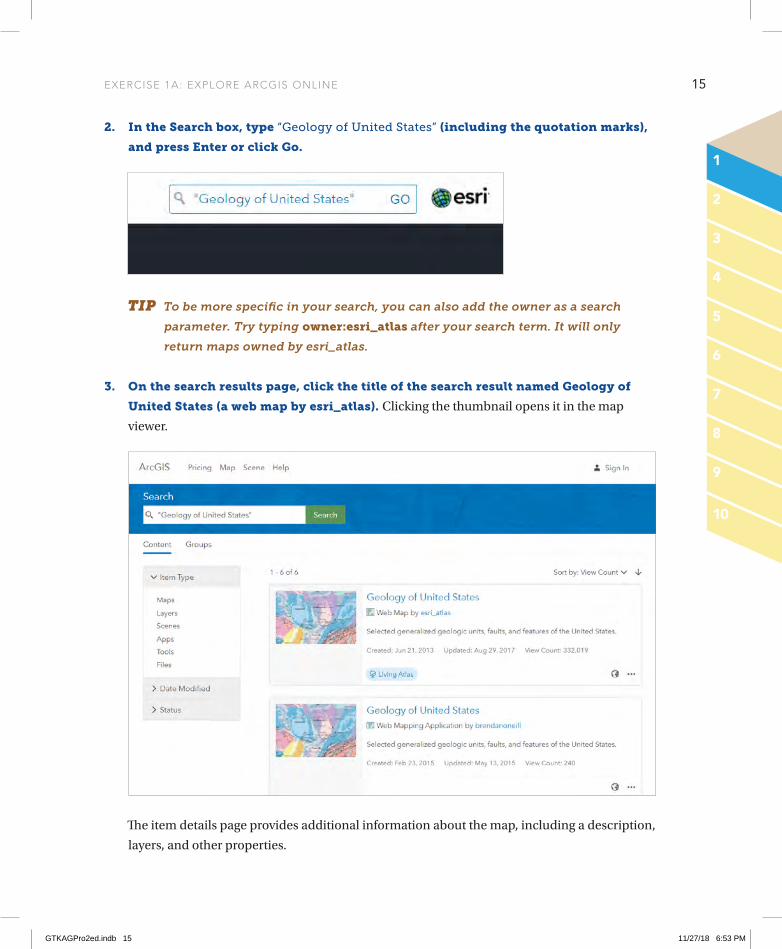
2. In the Search box, type “Geology of United States” (including the quotation marks),
and press Enter or click Go.
TIP To be more specific in your search, you can also add the owner as a search
parameter. Try typing owner:esri_atlas after your search term. It will only
return maps owned by esri_atlas.
3. On the search results page, click the title of the search result named Geology of
United States (a web map by esri_atlas). Clicking the thumbnail opens it in the map
viewer.
The item details page provides additional information about the map, including a description,
layers, and other properties.
GTKAGPro2ed.indb 15 11/27/18 6:53 PM
CHAPTER 1: INTRODUCING GIS16
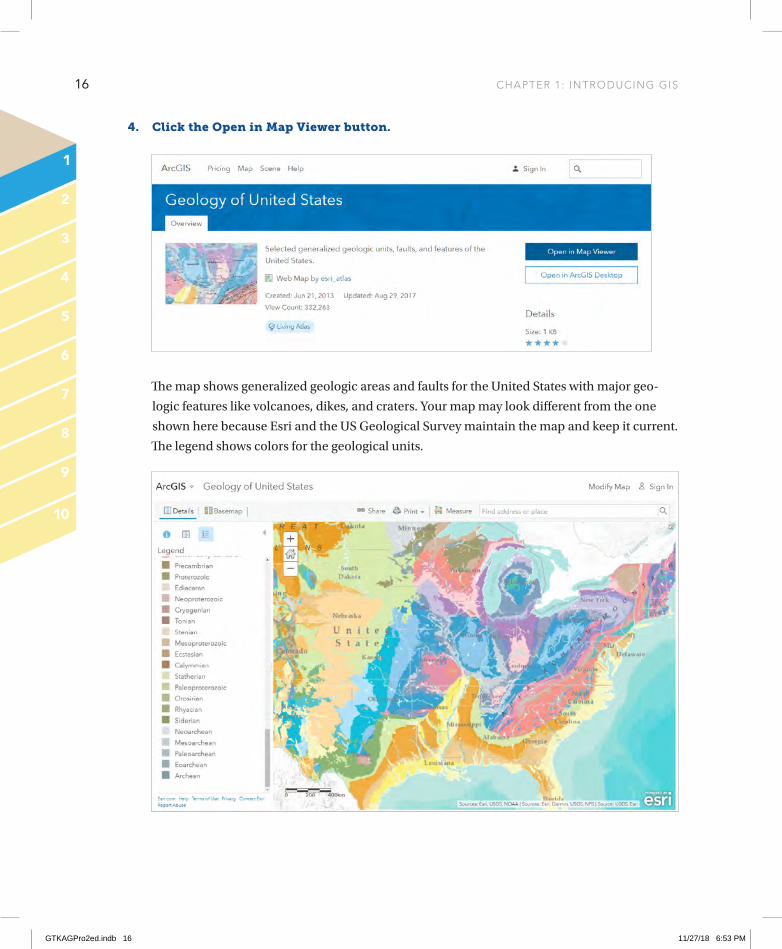
4. Click the Open in Map Viewer button.
The map shows generalized geologic areas and faults for the United States with major geo-
logic features like volcanoes, dikes, and craters. Your map may look different from the one
shown here because Esri and the US Geological Survey maintain the map and keep it current.
The legend shows colors for the geological units.
GTKAGPro2ed.indb 16 11/27/18 6:53 PM
ExERCISE 1A: ExPLORE ARCGIS ONLINE 17
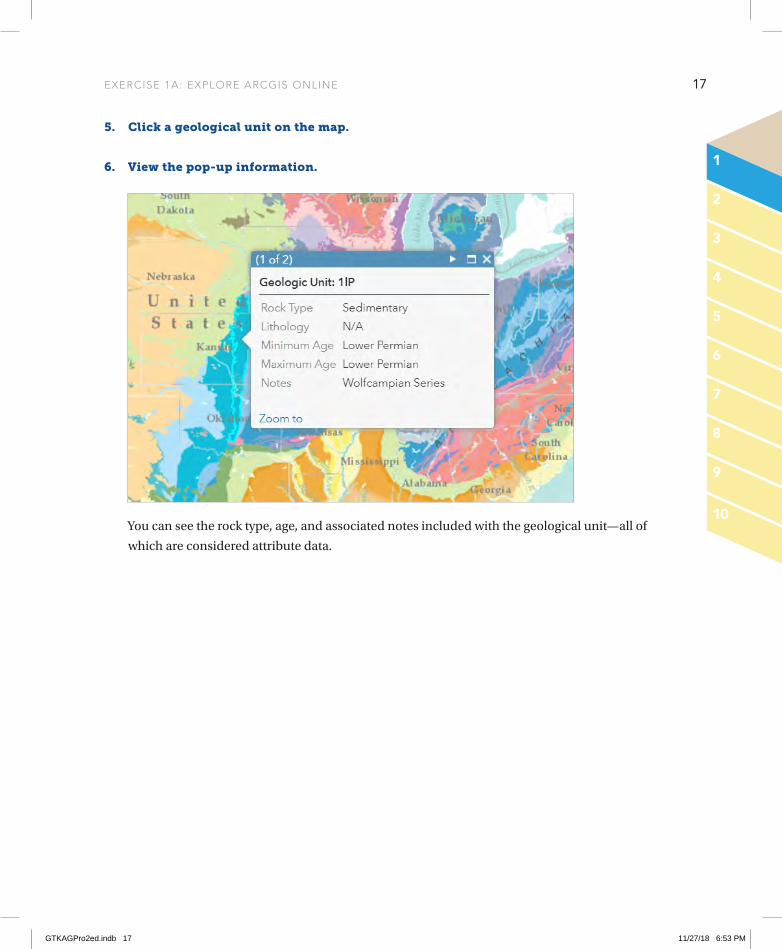
5. Click a geological unit on the map.
6. View the pop-up information.
You can see the rock type, age, and associated notes included with the geological unit—all of
which are considered attribute data.
GTKAGPro2ed.indb 17 11/27/18 6:53 PM
CHAPTER 1: INTRODUCING GIS18
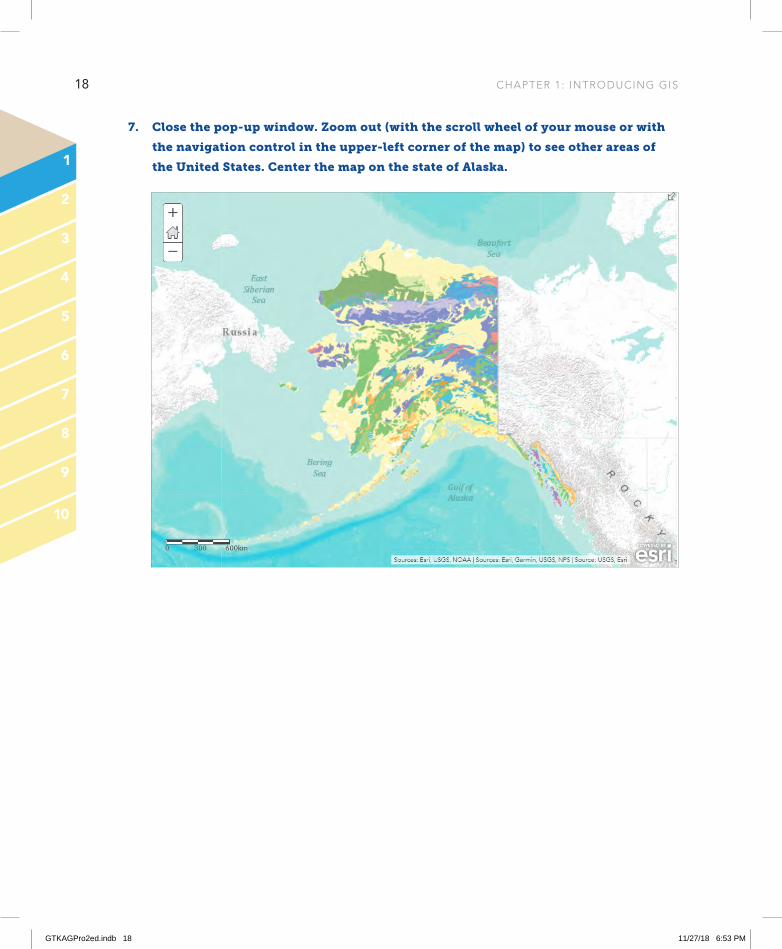
7. Close the pop-up window. Zoom out (with the scroll wheel of your mouse or with
the navigation control in the upper-left corner of the map) to see other areas of
the United States. Center the map on the state of Alaska.
GTKAGPro2ed.indb 18 11/27/18 6:53 PM

ExERCISE 1A: ExPLORE ARCGIS ONLINE 19
8. Click Basemap to see available basemaps, and then click Oceans.
Basemaps provide a backdrop and frame of reference for operational layers such as earth-
quakes. Now you can see the earthquakes in relation to the ocean floor. As you zoom in, with
each zoom level the basemap provides more detail. In this case, you see more details about
the ocean floor. In other basemaps, you might see city streets and eventually building out-
lines. In the satellite basemap, you can see your house, school, work, park, lake, and more.
The side pane to the left of the map contains three tabs: About, Content, and Legend. You can
hide the side pane or adjust its width.
GTKAGPro2ed.indb 19 11/27/18 6:53 PM

CHAPTER 1: INTRODUCING GIS20
9. Click the Contents button.
The contents include the USA Geology layer and the Oceans basemap. Layers have a check
box so you can turn them on and off. The basemap is always on and has no check box. You
can expand the USA Geology layer to see the symbology and other options to show a legend,
show a table, change style, and filter data.
10. In the upper-right corner of the page, click Modify Map.
You can modify public maps, such as this one, without affecting the author’s original map.
You can add more layers from ArcGIS Online, the web, or your own computer.
GTKAGPro2ed.indb 20 11/27/18 6:53 PM