Baumol (1990) Eship - Productive, Unproductive, And Destructive
Upload
vuonghuongCategory
view
219download
2
21
C H A P T E R 1
INCLUSIVE GROWTH IN THE UNITED STATES
The U.S. economic recovery entered its seventh year in 2015. Our businesses created 2.6 million jobs in 2015 and the unemployment
rate fell to 5.0 percent, half its level in fall 2009, far faster than forecasters expected. Private domestic final purchases—the most stable and persistent components of economic output—rose 2.7 percent over the four quarters of the year, bolstered by solid personal consumption, strong residential invest-ment, and record-setting investment in research and development. Health care price growth remained at low levels not seen in nearly five decades as the Nation’s uninsured rate fell below 10 percent for the first time ever. Overall, consumers were more confident about the economy than in any year since 2004. Nominal wage growth remained too low, but still grew faster in 2015 than at any time since the recovery began. While more work remains to be done on each of these fronts—especially in terms of wage growth—the U.S. economy exhibited substantial strength throughout the year.
At the same time, slowing foreign demand has weighed on exports and impacted the manufacturing sector, low oil prices—while boosting household balance sheets—have constrained investment and job growth in the drilling industry, and financial market volatility is also impacting the economy. The divergence between strong domestic demand and these global factors will remain an important macroeconomic dynamic in 2016.
But we must not lose sight of the longer-term challenges that the U.S. economy has faced for decades, most notably the insufficient growth of middle-class incomes. Last year’s Economic Report of the President focused on the three factors that drive middle-class incomes: productivity growth, inequality, and participation in our economy. This year’s Report examines the economics and policies that can strengthen productivity without exacer-bating inequality, promoting robust and inclusive growth that can be shared by a broad group of households. Many of these policies increase economic

22 | Chapter 1
efficiency as well as equity, unleashing productivity growth that benefits families across the income distribution.
Despite progress during the recovery and promising economic trends, inequality remains a defining challenge of the 21st century economy. This is a global issue, but one that is particularly salient in the United States. While rising income and wealth inequality tend to attract the most atten-tion, the last few decades have seen an especially unequal distribution of something more fundamental—the opportunity to succeed in our economy. Too many Americans’ ability to innovate and participate in the labor force is constrained by their circumstances. For example, children of low-income families face broad disadvantages that limit their ability to get ahead in school and later in life; our criminal justice system fosters inequities and inefficiencies that limit opportunity; and persistent biases against women and minorities limit their full economic participation. Unequal outcomes often reward hard work and innovation, and may promote the efficient use of our resources and raise overall living standards. But unequal outcomes that arise from unequal opportunities—barriers that keep some individuals from realizing their full potential—are a detriment to growth and fairness. The President supports a wide range of policies to promote equality of opportunity for all Americans, detailed extensively later in this chapter.
The overall increase in income inequality in recent decades is large enough to accommodate many partial explanations. The traditional view is that inequality arises from competitive markets, paying workers, inves-tors, and innovators according to their productivity—with divergences in productivity stemming from changes in technology, globalization, and education. Such a mechanism promotes productivity growth by encouraging productive labor, wise investments, and innovation.
But many economists have recently emphasized another contribu-tor to rising income inequality: “economic rents.” Rents are unproductive income paid to labor or capital above what is necessary to keep that labor at work or that capital invested. Rents arise when markets are not perfectly competitive, such as when uncompetitive markets yield monopoly profits or preferential regulation protects entities from competition. For example, a firm might be willing to sell a piece of software for $20 based on costs and a reasonable return to capital. But if the firm has no competition, it may be able to sell the same product for $50—the $30 difference reflects an economic rent. Rents can serve a productive purpose in encouraging innovation. Some rents are inevitable, but the critical question is how they are divided—for example, between profits and wages. And in many cases the evidence suggests that the pursuit of such rents (“rent-seeking behavior”) exacerbates inequality and can actually impair growth.
Inclusive Growth in the United States | 23
To promote inclusive growth, both channels of inequality—com-petitive markets and economic rents—must be addressed from a pro-growth perspective. Since the competitive channel most effectively promotes growth when competition is open to the widest set of economic actors, promoting equality of opportunity helps the competitive channel work better. And because the abuse of market power in pursuit of economic rents results in inherently unproductive inequality, strategies to reduce such unfair advan-tages can promote equality and opportunity. Both of these broad goals would reduce inequality while unleashing productivity growth, raising living standards across the income distribution.
Forms of Economic Inequality: Income, Wealth, and Opportunity
Unequal outcomes may provide incentives for individual effort and therefore play a productive role in the economy. Large rewards can motivate innovators, entrepreneurs, and workers and compensate them for taking large personal risks—choices that, in some cases, can benefit households more broadly across the economy. Hard work and personal capital devel-oped the first personal computer; its developer reaped great rewards, but so too did aggregate productivity. Inequality can also simply reflect the choices of two otherwise identical people who make different decisions about how to balance work versus leisure, or an undesirable job versus a desirable job. But excessive inequality may also reflect substantially more than “just deserts,” ranging from pure luck to economic rents. Moreover, while inequality can play an important role in economic growth, excessive inequality is not nec-essarily essential to growth and may even impede growth. This is especially true to the degree that inequality derives from interfering with the com-petitive market or protecting high returns to capital or labor with barriers, natural or otherwise.
To understand how to promote widely shared growth, it is critical to distinguish among various forms of economic inequality to better under-stand their sources. This Report considers three broad forms: inequality of income, inequality of wealth, and inequality of opportunity. All are closely related and can influence one another.
Income InequalityAlthough a global issue, income inequality is particularly important
in the United States in terms of both its level and in recent changes. Large advanced economies have seen a persistent trend of rising inequality for decades, as the very highest earners capture a larger share of aggregate
24 | Chapter 1
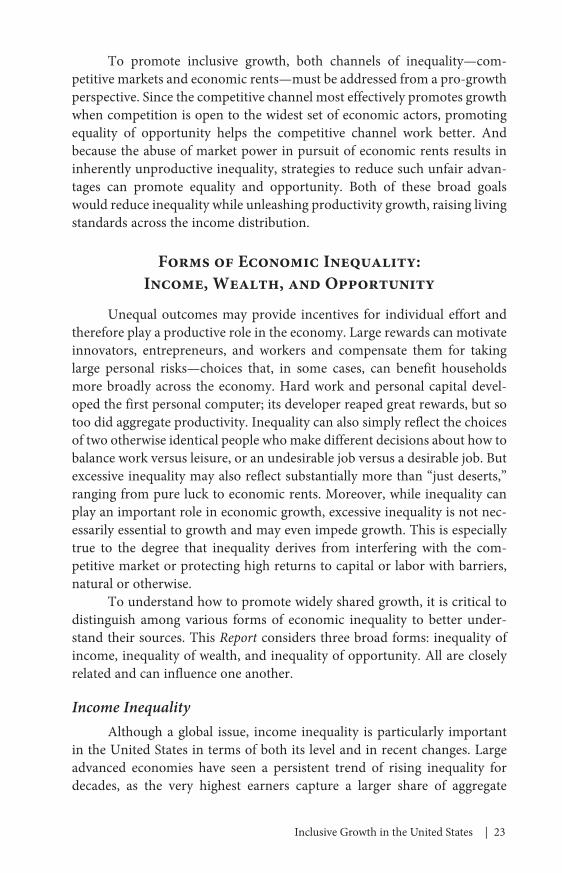
income. Until the 1980s, the United States experience was similar to other countries; as recently as 1975, the top 1 percent garnered a similar share of the income in the United States as in other G-7 countries, as shown in Figure 1-1. But since 1987 the share of income going to the top 1 percent in the United States has exceeded every other G-7 country in each year that data are available. Moreover, the United States has continued to diverge further from other advanced economies, with the top 1 percent’s income share ris-ing 0.2 percentage point a year on average in the United States from 1990 to 2010, well above the 0.1 percentage point average increase in the United Kingdom. While comparable international data are scarce after 2010, the gains of the top 1 percent have continued in the United States. In 2014, the top 1 percent captured 18 percent of income, up from 8 percent in 1975 (World Top Incomes Database 2015).
In contrast to rising inequality within countries, inequality across the globe as a whole has been largely stable and possibly even decreasing. Fast growth in many poorer and emerging countries has lifted hundreds of millions of people out of poverty in recent decades, moderating the trends observed in the advanced world. In fact, when measured at a global level, the biggest income gains from 1988 to 2008 went to households between the 15th percentile and the 65th percentile of global income (Milanovic 2012).
The dynamics of income inequality across many countries have gained considerable attention in recent years, perhaps most notably in Thomas Piketty’s 2014 work Capital in the Twenty-First Century. Following Piketty, previous Council of Economic Advisers (CEA) analysis has decom-posed inequality into three components:
• Inequality within labor income (wages, salaries, and benefits);• Inequality within capital income (capital gains, dividends, and
interest); and• The division of aggregate income between labor and capital.
All three of these have different causes, dynamics, and policy implications.
CEA has decomposed the changes in inequality in the United States into the three sources using a combination of data from Piketty and his col-league Emmanuel Saez, the U.S. Congressional Budget Office (CBO), and the U.S. National Income and Product Accounts (NIPA). Figures 1-2a and 1-2b shows the top 1 percent shares of labor and capital income according to various datasets.
The data present several issues with volatility, systematic measure-ment error that results from using administrative tax data in an environment of changing tax policies, and definitional nuances around what should be

Inclusive Growth in the United States | 25
classified as labor or capital income. Nonetheless, this decomposition exer-cise illustrates a few broad points.
In the United States, the top 1 percent’s share of total income rose from 8 percent in 1970 to 17 percent in 2010, according to the Piketty-Saez data. Throughout this period, the top 1 percent’s share of labor income rose steadily while its share of capital income only began a sustained rise around 1990, as shown in Figure 1-2a. Overall, the 9-percentage-point increase in the share of income that Piketty and Saez find going to the top 1 percent from 1970 to 2010 is attributable to the three factors discussed above in the following dimensions: 68 percent due to increased inequality within labor income; 32 percent due to increased inequality within capital income; and 0 percent due to a shift in income from labor to capital. This finding is broadly consistent with the recent emphasis on labor income inequality, though it tells us that capital income is also a reasonably important driver of income inequality. Other data discussed below show a bigger share for the shift from labor to capital income.
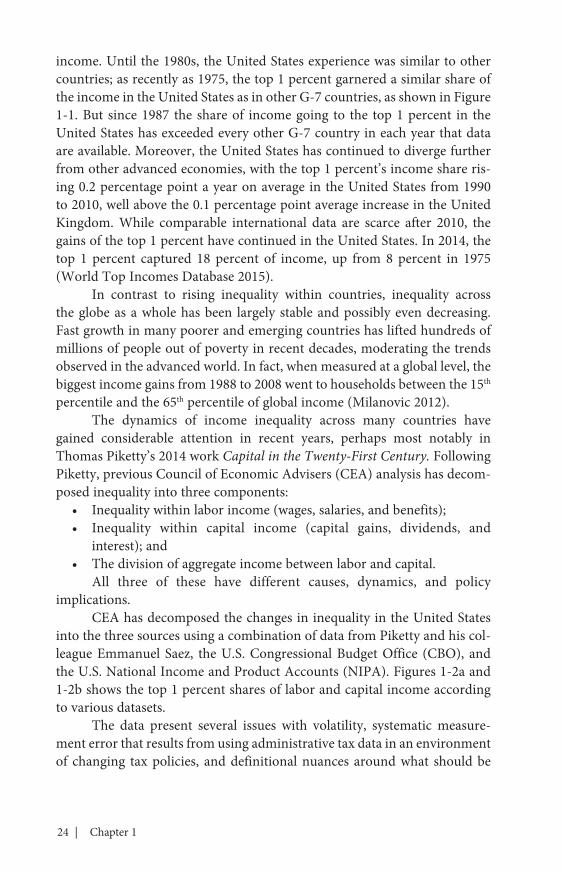
However, when looking at the extreme upper end of the income distribution in more recent periods, capital income becomes much more important. Table 1-1 shows the relative importance of the distribution of income within labor in explaining the increased share of income going to the top in different data sets and different periods.
2014
5
10
15
20
1975 1980 1985 1990 1995 2000 2005 2010 2015
United States United KingdomCanada FranceItaly JapanGermany
Figure 1-1Share of Income Earned by Top 1 Percent, 1975–2014
Note: Data for all countries exclude capital gains. Source: World Top Incomes Database (Alvaredo et al. 2015).
Percent

26 | Chapter 1
0
50
100
150
200
250
300
1979 1984 1989 1994 1999 2004 2009
Share of Labor Income
Share of Capital Income
Figure 1-2bShare of Total, Labor, Capital Income Accruing to Top 1 Percent
Based on Congressional Budget Office DataIndex, 1979 = 100
Share of Total Income
2010
Source: Congressional Budget Office (2013).
Share of Total Income
2012
0
50
100
150
200
250
300
350
1970 1975 1980 1985 1990 1995 2000 2005 2010
Share of Labor Income
Share of Capital Income
Figure 1-2aShare of Total, Labor, Capital Income Accruing to Top 1 Percent
Based on Piketty-Saez DataIndex, 1970 = 100
Source: Piketty and Saez (2015).
Inclusive Growth in the United States | 27
The higher up the income scale, the less important inequality within labor income is in explaining the overall increase in inequality, and the com-mensurately more important the degree of inequality within capital income. There is a strong temporal pattern as well, with inequality within capital income becoming increasingly important over time. The relevant CBO data only go back to 1979 and do not show any finer measurements than the top 1 percent, but they tell a similar story both in terms of the overall magnitudes and in terms of within-capital inequality being more important higher up the income scale.
Inequality within Labor IncomeThe topic of inequality within labor income has been studied exten-
sively. As a factual matter, those at the very top of the income distribution (top 0.1 percent) are about 40 percent managers in non-financial indus-tries and about 20 percent financial professionals, with the remaining 40 percent spread across law, medicine, real estate, entrepreneurship, arts, media, sports, and other occupations (Bakija, Cole, and Heim 2010). A variety of explanations have been put forward for the overall rise in labor income inequality, including the increased return to skills, especially given technological change, the increased national and global reach of corpora-tions, the slowdown in increases in educational attainment (weakening the skill base and earning power of the lower part of the income distribution), and changes in norms and corporate governance (such that a wider gap between CEO and worker pay is now acceptable). The rising importance of unproductive economic rents is likely also contributing to the broad increase in inequality. Workers and managers at firms earning supernormal
Top 10% Top 1% Top 0.1%Income Excluding Capital Gains 1970-2010 (Piketty-Saez) 83% 68% 53% 1980-2010 (Piketty-Saez) 71% 54% 59% 1990-2010 (Piketty-Saez) 64% 51% 53%Income Including Capital Gains 1970-2010 (Piketty-Saez) 80% 63% 47% 1980-2010 (Piketty-Saez) 67% 50% 52% 1990-2010 (Piketty-Saez) 61% 45% 44%
Table 1-1Increase in Income Share Accounted for by
Inequality Within Labor Income
Note: Values for any given year calculated as a centered three-year moving average.Source: CEA calculations based on Piketty-Saez (2015) and Congressional Budget Office (2013).
28 | Chapter 1
return—likely reflecting increased aggregate rents—are paid progressively more than their counterparts at other firms. Moreover, as union member-ship declines, inequality can rise further as workers at the bottom of the income distribution lose market power.
Inequality within Capital IncomeA second source of increased inequality is the distribution of capital
income. As the distribution of wealth becomes increasingly unequal, the returns to that wealth—like interest, dividends, and capital gains—will gen-erate more inequality. In addition, the fact that those at higher wealth levels seem to receive higher returns to capital, when coupled with reductions in tax rates on capital income in recent decades, has increased the contribution of capital income to overall inequality. Further, if some firms earn monopoly profits, owners of those firms may benefit more than others. These issues have been studied much less than labor income inequality, though they clearly merit much more attention given their increasing importance over time.
Division of Income between Labor and CapitalWealth is much more unequally distributed than labor income. As a
result, the extent to which aggregate income is divided between returns to labor and returns to wealth (capital income) matters for aggregate inequal-ity. When the labor share of income falls, the offsetting increase in capital income (returns to wealth) is distributed especially unequally, increasing overall inequality. In Europe, the share of income going to labor has been falling since about 1970. In contrast, a marked decline in the labor share of income occurred only after 2000 in the United States, though there is some volatility in the data. The relative importance of this factor in the overall increase in inequality is harder to consistently quantify, although the impor-tance of labor and capital income inequality in recent decades suggests that it plays only a supporting role.
Wealth InequalityWhen unequally distributed income is saved, it results in unequally
distributed wealth. Growing wealth inequality in the United States reflects many of the trends and many of the same causes as rising income inequality. Wealth inequality is particularly difficult to measure accurately because we do not track wealth in the way we do income and trends in wealth inequal-ity are concentrated among a small number of households. One perspective on wealth inequality comes from the Federal Reserve’s Survey of Consumer Finances (SCF) which, as shown in Figure 1-3, shows that the top 3 percent

Inclusive Growth in the United States | 29
of households have held more than 50 percent of aggregate wealth since 2007 (Bricker et al., 2014). This share has been on a consistent uptrend since the late 1980s. The next 7 percent of households in the wealth distribution hold roughly 25 percent of aggregate wealth, a share that been fairly stable time during this period. Notably, the loss in wealth share experienced by the bottom 90 percent of households, which in 2013 held only 25 percent of all wealth is accounted for by the rise in share captured by the top 3 percent. This is not a uniform spreading of the wealth distribution; it is a rising con-centration of wealth at the very top.
An alternative analysis by Emmanuel Saez and Gabriel Zucman finds that the rise in wealth inequality is due to the very top of the wealth distri-bution. Using capital income reported on tax returns, they estimate that the share of wealth held by the top 0.1 percent of households has more than tripled, from 7 percent of total household wealth in 1979 to 22 percent in 2012—reversing a decline over the prior decades.1 As shown in Figure 1-4, the wealth share of these households (approximately 160,000 families with average net wealth per family above $20.6 million) is now nearly as large as it was in 1929 (Saez and Zucman 2015).
1 Any method to measure wealth is imperfect and unlike income, individuals are not required to report the value of their wealth each year, so there is no administrative data to use as a benchmark for the distribution, the two methods discussed here each have their advantages and disadvantages. (Bricker et al 2015, Saez and Zucman 2015).
Top 3 Percent
2013
Top 4th-10th Percentiles
Bottom 90 Percent
10
20
30
40
50
60
1989 1992 1995 1998 2001 2004 2007 2010 2013
Figure 1-3Distribution of Household Wealth (Survey of Consumer Finances),
1989-2013Percent of Total Household Wealth
Source: Federal Reserve Board of Governors, Survey of Consumer Finances.

30 | Chapter 1
Saez and Zucman argue that this increase in wealth concentration is compounded by an increase in differences in saving rates across wealth classes (for instance, wealthier individuals save a larger percentage of their income). More generally, they hypothesize that income inequality has a “snowballing effect” on the wealth distribution: a larger share of income is earned by top wealth holders, who then save at higher rates, which pushes wealth concentration up; this dynamic leads to rising capital-income con-centration and contributes to even greater top income and wealth shares.
Rising wealth inequality is perhaps best understood as the ultimate outcome of economic growth that leaves the middle class behind. But it is also an important cause of income inequality. In part, it directly reinforces itself because concentrated wealth leads to concentrated capital income. But more importantly, it helps entrench a broader inequality of opportunity that blocks the path to full economic participation for wide swaths of the poten-tial U.S. labor force and innovation force.
Inequality of OpportunityThe traditional argument that inequality results from normal eco-
nomic competition rests on the notion that competition for unequally dis-tributed rewards encourages production. But when inequality has become so entrenched that it passes across generations and limits opportunity, it
Bottom 90 Percent
Top 1 Percent to Top 0.1 Percent
Top 0.1 Percent
0
5
10
15
20
25
30
35
40
1913 1923 1933 1943 1953 1963 1973 1983 1993 2003 2013
Figure 1-4Distribution of Household Wealth (Saez-Zucman), 1913–2012
Percent of Total Household Wealth
Source: Saez and Zucman (2015).
2012

Inclusive Growth in the United States | 31
narrows the pool of human capital that can compete. Such throttling of opportunity is unambiguously bad for growth, preventing potential innova-tors from full economic participation and weighing on productivity growth. Further, if entrenched interests are able to limit future competition either by influencing the policymaking process or by abusing their market power, dynamism in labor markets or firm entry can decrease. While some level of income and wealth inequality can play a constructive role, the implications of unevenly distributed opportunity are simpler—working the wrong way for both equity and efficiency.
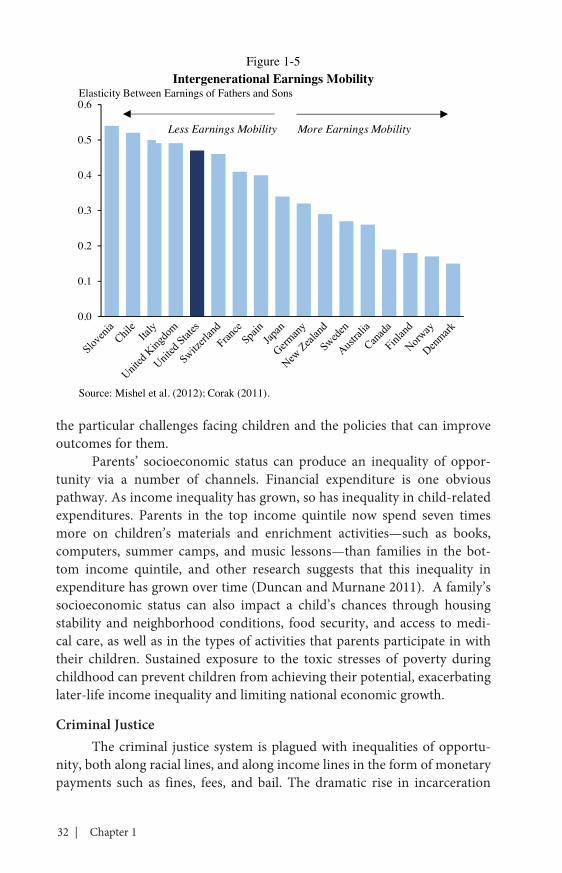
While inequality of opportunity is an international phenomenon, it is especially important in the United States. Mishel et al. (2012), based on data from Corak (2011), assembles a set of intergenerational earnings elasticities across large advanced economies with similar incomes to the United States. The intergenerational earnings elasticity reflects the extent to which the earnings of parents and children are correlated—the higher the elasticity, the less mobile the society. Such mobility can be understood as a measure of the inequality of opportunity. If children at all income levels faced the same set of opportunities, one might expect a lower elasticity. Among the 17 peer countries identified by Mishel, the United States ranks in the top half, as shown in Figure 1-5. Other measures of mobility support the observa-tion: Raj Chetty has found that a child born in the 1980s to parents in the bottom 20 percent of the income distribution has only a 7.5 percent chance of moving to the top 20 percent. A similar child has a 12 percent chance in Denmark and a 13 percent chance in Canada (Chetty 2014).
It is important to understand the forms that this inequality of oppor-tunity takes and to explore the institutional structures that entrench the pattern. Three particular examples that the Council of Economic Advisers has recently explored in a series of reports include the experience of children in low-income families, inequities in the criminal justice system, and the systemic challenges faced by women in the U.S. economy. The President has a robust agenda to promote equality of opportunity for all Americans, detailed extensively later in this chapter.
Children in Low-Income FamiliesBarriers to opportunity take many forms, but those that appear early
in life for children and youth are particularly costly to society, as their impacts accumulate over many years, shaping adolescents and young adults during their critical transition to adulthood beyond. Moreover, there is evidence that in recent decades, family income has become more impor-tant in shaping children’s outcomes. Chapter 4 of this Report focuses on
32 | Chapter 1
the particular challenges facing children and the policies that can improve outcomes for them.
Parents’ socioeconomic status can produce an inequality of oppor-tunity via a number of channels. Financial expenditure is one obvious pathway. As income inequality has grown, so has inequality in child-related expenditures. Parents in the top income quintile now spend seven times more on children’s materials and enrichment activities—such as books, computers, summer camps, and music lessons—than families in the bot-tom income quintile, and other research suggests that this inequality in expenditure has grown over time (Duncan and Murnane 2011). A family’s socioeconomic status can also impact a child’s chances through housing stability and neighborhood conditions, food security, and access to medi-cal care, as well as in the types of activities that parents participate in with their children. Sustained exposure to the toxic stresses of poverty during childhood can prevent children from achieving their potential, exacerbating later-life income inequality and limiting national economic growth.
Criminal JusticeThe criminal justice system is plagued with inequalities of opportu-
nity, both along racial lines, and along income lines in the form of monetary payments such as fines, fees, and bail. The dramatic rise in incarceration
0.0
0.1
0.2
0.3
0.4
0.5
0.6
Intergenerational Earnings MobilityElasticity Between Earnings of Fathers and Sons
Figure 1-5
More Earnings MobilityLess Earnings Mobility
Source: Mishel et al. (2012); Corak (2011).
Inclusive Growth in the United States | 33
over the past several decades has been distributed unequally, disproportion-ately impacting low-income households and minorities. In 1984, the major-ity of State and Federal prisoners were White; but by 2014, over 65 percent of sentenced prisoners were minorities (Minor-Harper 1986; Carson 2015). Even when there is little difference in the likelihood of committing a crime, individuals of color are much more likely to be arrested. For example, an African-American individual is nearly four times as likely as a White indi-vidual to be arrested for marijuana possession, even though individuals of both races reported using marijuana at similar rates in 2010 (ACLU 2013). Different rates of interaction with the criminal justice system by income and race can create substantial barriers to economic success, limiting opportu-nity for many.
The expanding use of monetary penalties—fines, fees, and bails—also disproportionately impact poor defendants and offenders who have fewer resources available to manage criminal justice debt. Financial penalties also serve as a regressive form of punishment as the same level of debt presents an increasingly larger burden as one moves down the income scale. Such systemic challenges limit the opportunities available to low-income families, preventing them from full participation in our economy (CEA 2015a).
Women in the EconomyOver the last five decades, women have made enormous strides in the
U.S. labor market. Our economy is $2.0 trillion, or 13.5 percent, larger than it would have been without women’s increased participation in the labor force and hours worked since 1970 (CEA 2014).
Although the United States was initially a leader in bringing women into the labor force, our progress has stalled somewhat over the past 20 or 30 years. In 1990, the United States ranked seventh in female prime-age (25-54) labor force participation out of 24 advanced economies for which data is available—but in 2014, the United States fell to 20th place (OECD 2015). Part of the explanation may be that the United States lags behind many of its peer countries in terms of pro-family policies like paid leave requirements that ease the burden on working families.
Moreover, women in the labor force face a persistent wage gap. The typical woman working full-time full-year earns 21 percent less than the typical man. In addition, while the pay gap closed by 17 percentage points between 1981 and 2001, it has remained flat since 2001. In the past two years, some modest progress has been made, with the gap closing by 1.8 percentage point from 2012 to 2013 and by an additional percentage point between 2013 and 2014. The wage gap has many causes and contributors, including gender
34 | Chapter 1
gaps in education and experience; differences in choices of occupation and industry; decisions about family responsibilities; and discrimination.
The Interplay of the Forms of InequalityThese three forms of inequality discussed above are not conceptually
distinct phenomena—they closely affect one another. Wealth inequality is, in some respects, an outcome of income inequality, as the saving of unequally distributed income produces unequally distributed wealth. But inequality of opportunity is in many ways both a cause and a result of income and wealth inequality. Therefore, unequally distributed opportunities entrench an unequal income distribution, and an unequal income distribution leads to many of the inequities faced by low-income and low-wealth children.
The “Great Gatsby” curve, a term introduced by former CEA Chair Alan Krueger, illustrates the relationship between income inequality and inequality of opportunity. When plotted across counties or across countries, Figures 1-6a and 1-6b shows that areas with more income inequality also tend to have less mobility for children from low-income families. This rela-tionship also holds across large advanced economies.
The Great Gatsby curve shows that inequality is correlated with lower mobility, and one important transmission mechanism is the distribution of opportunity. When disparities in education, training, social connection, and the criminal justice system are distributed as unequally as overall wealth, poorer families have a much harder time succeeding in the economy.
Sources of Inequality: Competitive Markets and Economic Rents
Classical economics suggests that income inequality is a product of competitive markets, with income differences reflecting pure productivity differences. Under this view, inequality encourages growth by rewarding the most productive labor and the highest-returning capital. But recently, economists and commentators have suggested that much of the rise in inequality can be explained by the rising importance of economic rents. Recent work by the Council of Economic Advisers has focused on the influ-ence of economic rents or their division in the labor market (CEA 2015c), in the housing sector (Furman 2015a), in occupational licensing (Furman 2015b), and in the broader capital markets (Furman and Orszag 2015).
The long-term trend of rising inequality is sufficiently large that mul-tiple forces are likely playing a part. While there is truth to the “competitive markets” view that an unequal distribution of income compensation for

Inclusive Growth in the United States | 35
35
40
45
50
55
0.2 0.3 0.4 0.5 0.6Inequality (Gini Coefficient for Parent Family Income, 1996-2000)
The "Great Gatsby Curve" Within the United StatesUpward Mobility
Figure 1-6a
Note: U.S. commuting zones were ordered by Gini coefficient and divided into 20 equally sized bins. Each blue dot represents a single bin. Upward mobility reflects the mean percentile in the 2011-2012 national income distribution for those individuals in each bin whose parents were at the 25th percentile of the national income distribution between 1996 and 2000.Source: CEA calculations based on Chetty (2014).
More Inequality
Less Upward Mobility
DenmarkFinland
France
GermanyJapan
New Zealand
Norway
Sweden
United KingdomUnited States
0.0
0.1
0.2
0.3
0.4
0.5
0.60.15 0.20 0.25 0.30 0.35 0.40
Inequality(1985 Gini Coefficient)
The "Great Gatsby Curve" Across CountriesUpward Mobility (Inverted Intergenerational Earnings Elasticity)
Figure 1-6b
Note: Intergenerational earnings elasticity is measured as the elasticity between a father's earnings and their son’s adult earnings. The children studied were born during the early to mid 1960s and their adult income was measured in the mid to late 1990s. Source: Corak (2011); OECD.
More Inequality
Less Upward Mobility
36 | Chapter 1
differences in productivity, there is also evidence of rents complicating the income-productivity link. This Report considers each channel in turn.
The Competitive ChannelThe traditional economic explanation of inequality is grounded in
competitive markets, wherein workers receive wages commensurate with their productivity. According to this explanation, a combination of skill-biased technological change, a slowdown in the increase in educational attainment, and globalization have increased the demand for highly skilled workers at the same time that their relative supply has not kept pace—resulting in higher wages for these high-productivity workers and greater inequality.
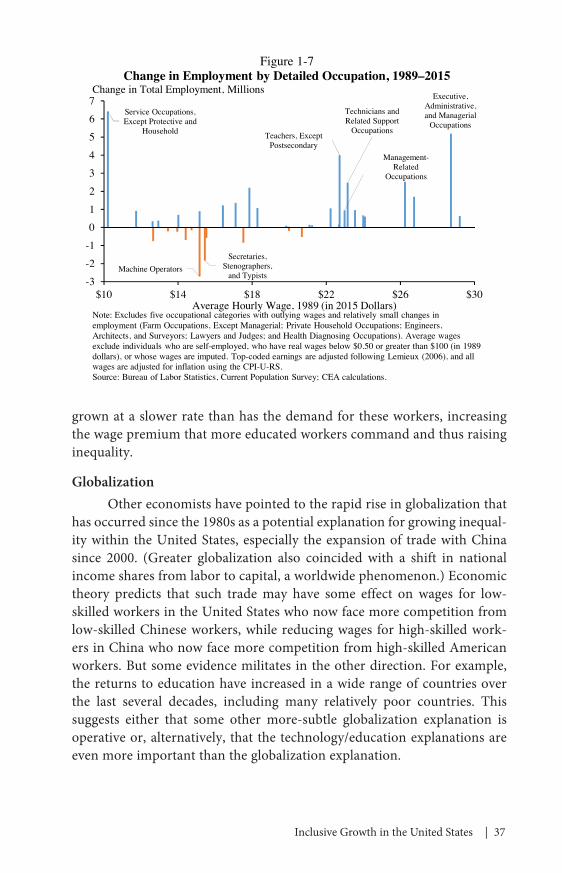
Skill-Biased Technological ChangeMany economists have pointed to the role of technology in increas-
ing inequality (Autor 2010). This argument asserts that technology can most readily replace labor in tasks that are easily automated, which tend to involve routine tasks that place them in the middle of the skill and wage distributions. Over time, employment moves to both the lower and higher ends of the occupational skill ranking, as shown in Figure 1-7, where occu-pations are ranked by average wage as a proxy for skill. While technology is a better replacement for tasks that are easy to routinize, it complements the abilities of highly skilled workers and improves their productivity, thereby increasing their earnings and employment opportunities. Lower-skilled workers are not necessarily made more productive, but neither are they easily replaced, as their jobs often include interpersonal interactions and variable situations that are difficult to automate. Taken together, this view of the role of technology points to both rising inequality and rising job polarization.
Educational AttainmentThe increase in skill-biased technological change has been com-
pounded by a slowdown in the rate of increase in educational attainment. Schooling attainment rose for much of the 20th century, in part due to measures like the G.I. Bill, the expansion of high schools and community colleges, and greater educational attainment by women. However, growth in years of schooling slowed substantially around 1980. The rate of growth in the college-educated population fell by almost 60 percent, from 3.9 per-cent a year between 1960 and 1980 to 2.3 percent per year between 1980 and 2005, according to estimates by Lawrence Katz and Claudia Goldin. While the pool of skilled workers is still growing, in recent decades it has
Inclusive Growth in the United States | 37
grown at a slower rate than has the demand for these workers, increasing the wage premium that more educated workers command and thus raising inequality.
GlobalizationOther economists have pointed to the rapid rise in globalization that
has occurred since the 1980s as a potential explanation for growing inequal-ity within the United States, especially the expansion of trade with China since 2000. (Greater globalization also coincided with a shift in national income shares from labor to capital, a worldwide phenomenon.) Economic theory predicts that such trade may have some effect on wages for low-skilled workers in the United States who now face more competition from low-skilled Chinese workers, while reducing wages for high-skilled work-ers in China who now face more competition from high-skilled American workers. But some evidence militates in the other direction. For example, the returns to education have increased in a wide range of countries over the last several decades, including many relatively poor countries. This suggests either that some other more-subtle globalization explanation is operative or, alternatively, that the technology/education explanations are even more important than the globalization explanation.
Machine OperatorsSecretaries,
Stenographers, and Typists
Service Occupations, Except Protective and
Household Teachers, Except Postsecondary
Technicians and Related Support
Occupations
Management-Related
Occupations
Executive, Administrative, and Managerial
Occupations
-3-2-101234567
$10 $14 $18 $22 $26 $30Average Hourly Wage, 1989 (in 2015 Dollars)
Figure 1-7Change in Employment by Detailed Occupation, 1989–2015
Change in Total Employment, Millions
Note: Excludes five occupational categories with outlying wages and relatively small changes in employment (Farm Occupations, Except Managerial; Private Household Occupations; Engineers, Architects, and Surveyors; Lawyers and Judges; and Health Diagnosing Occupations). Average wages exclude individuals who are self-employed, who have real wages below $0.50 or greater than $100 (in 1989 dollars), or whose wages are imputed. Top-coded earnings are adjusted following Lemieux (2006), and all wages are adjusted for inflation using the CPI-U-RS.Source: Bureau of Labor Statistics, Current Population Survey; CEA calculations.

38 | Chapter 1
To some extent, some of these forces—like skill-biased technological change and globalization—reflect the type of desirable economic progress that promotes productivity growth. But that competitive channel works best when the competition is open to the broadest pool of potential labor and investable capital. Public policy is therefore critical to ensuring that the competitive channel works well, in part by providing a cushion for those dis-advantaged by the system—such as providing job retraining, unemployment insurance, robust Social Security, access to health care, and other policies for which the President has advocated. But government also has an important role in reducing the inequality of opportunity that creates barriers to success for some groups and thus limits the pool of workers who can successfully compete in the labor market.
As important as these forces are, the competitive channel does not appear to explain the full rise in income inequality in recent decades. Indeed, as mentioned earlier, there is evidence that an especially unproduc-tive element is at work—the rising influence of economic rents and their distribution.
The Rents ChannelMany economists have recently advanced an explanation of inequality
grounded in the importance of economic rents—the notion that investors or highly compensated workers are receiving more income than they would require to undertake their production or work. Classic examples of such rents include monopoly profits and the unearned benefits of preferential government regulation. Rents can result from abuses of market power and tend to encourage “rent-seeking behavior,” the unproductive use of resources to capture such rewards.
According to this view, the unequal distribution of these rents—rather than the conventional explanation that inequality reflects only actual differ-ences in worker productivity or the allocation of capital—is an important cause of rising income inequality. To the degree that this interpretation is correct, it suggests that it is possible to reduce inequality without hurting efficiency by changing how the rents are divided or even while increasing efficiency by acting to reduce these rents. There is relatively little academic literature on this question and data are scarce since rents cannot be directly observed, but considerable evidence appears to support the notion that rents are exacerbating inequality.
It is important to note that not all economic rents are undesirable. For example, in a perfectly competitive market, the price settles at a level below that which some buyers would be willing to pay and above that which some sellers would be willing to accept. The rents collected by these buyers
Inclusive Growth in the United States | 39
and sellers—consumer and producer surplus—are widely considered one of the chief benefits of market competition. In addition, temporary monopoly power that guarantees rents for a firm can be an incentive for additional innovation—one of the goals of our patent system. Nevertheless, growing rents, the increasingly unequal division of rents between workers and firms, and rent-seeking behavior are often highly problematic and appear to have become more so in recent decades (Furman and Orszag 2015).
The Division of Rents in Wage Negotiations: Declining Unionization and the Minimum Wage
Whenever a firm hires a worker, the difference between the highest wage the firm would pay and the lowest wage the worker would accept is the surplus created by the job match—an economic rent. The division of that rent between firm and work depends on their relative bargaining power. As markets grow concentrated and certain forms of labor are commoditized, the balance of bargaining power leans toward the firm. Unionization and collective bargaining—along with policies like the minimum wage—help level the playing field, concentrating labor and encouraging the firm to share those rents with labor. This process traditionally helped bolster the wages of lower- and middle-wage workers, thereby reducing inequality.
But union membership has declined consistently since the 1970s, as shown in Figure 1-8. Approximately a quarter of all U.S. workers belonged to a union in 1955 but, by 2014, union membership had dropped to just below 10 percent of total employment, roughly the same level as the mid-1930s. In some states, just 3 percent of workers belong to unions (CEA 2015c).
Research suggests that declining unionization accounts for between a fifth and a third of the increase in inequality since the 1970s (Western and Rosenfeld 2011). Other research shows that union workers have higher wages than their nonunion counterparts, with unions raising wages by up to 25 percent for their workers compared with similar nonunion workers (Boskin 1972). Unions also increase the likelihood workers have access to benefits and work under safe conditions.
Of course, other specific policies can help promote wage growth by affecting the division of economic rents. The minimum wage is one such policy, geared to those workers with the very-least bargaining power. A minimum wage protects some workers from having their lack of bargaining power exploited by firms in the wage negotiation, helping direct some of the rents from their job match to the workers themselves. But the real value of the minimum wage has declined [20] percent over the past three decades, losing its ability to protect workers in parallel with declining unionization.

40 | Chapter 1
Greater support for collective bargaining and the minimum wage are both policies that can help address the increasingly unequal division of eco-nomic rents, promoting stronger wage growth and reduced inequality—and to the degree that such policies are about changing the divisions of rents, they need not reduce efficiency. In some respects, like improving worker’s voice and motivation, such policies can actually boost efficiency.
Some Evidence for the Growth of Aggregate RentsThe challenge is not just that the division of rents is changing based on
comparative bargaining power. Moreover, the economic structure appears to be generating greater rents and tilting these toward profits and profitable firms.
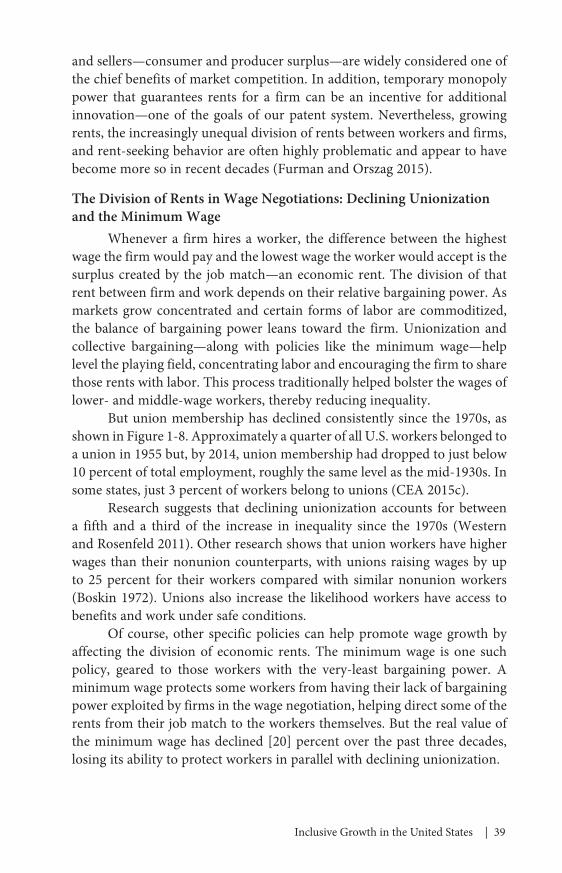
Corporate Profits and Interest RatesOne important piece of evidence that rents are on the rise is the
divergence of rising corporate profits and declining real interest rates. In the absence of economic rents, corporate profits should generally follow the path of interest rates, which reflect the prevailing return to capital in the economy. But over the past three decades, corporate profits have risen as interest rates have fallen, as shown in Figure 1-9. This suggests that some corporate profits could reflect an increase in the economic rents collected by corporations, not a “pure” return to capital. Of course, this divergence can
Troy and Sheflin (1985)
CPS: Membership
2014
Top 10 Percent Share of Income
0
10
20
30
40
50
60
1915 1935 1955 1975 1995 2015
U.S. Union Membership & Top 10 Percent Income Share, 1917– 2015Percent
Note: Union membersahip is expressed as a percent of total employment. Total employment from1901 to 1947 is derived from estimates in Weir (1992). For 1948 to 2014, employment data are annual averages from the monthly Current Population Survey.Source: Troy and Sheflin (1985); Bureau of Labor Statistics, Current Population Survey; Weir (1992); World Wealth and Income Database; CEA calculations.
2015
Figure 1-8
Inclusive Growth in the United States | 41
Median
90th Percentile
2014
75th Percentile
25th Percentile
0
20
40
60
80
100
120
1965 1975 1985 1995 2005 2015
Return on Invested Capital Excluding Goodwill, U.S. Publicly-Traded Nonfinancial Firms, 1965–2014
Percent
Figure 1-10
Source: Koller et al. (2015); McKinsey & Company; Furman and Orszag (2015).
Note: The return on invested capital definition is based on Koller et al (2015), and the data presented here are updated and augmented versions of the figures presented in Chapter 6 of that volume. The McKinsey data includes McKinsey analysis of Standard & Poor’s data and exclude financial firms from the analysis because of the practical complexities of computing returns on invested capital for such firms.
Corporate Profits as Share of Gross Domestic Income
2015
1-Year Real U.S. Treasury Rate
-5
0
5
10
15
1985 1990 1995 2000 2005 2010 2015
Figure 1-9Corporate Profits and Real Interest Rates, 1985–2015
Percent
Source: Bureau of Economic Analysis; Bureau of Labor Statistics; Federal Reserve.
Note: Corporate profits for 2015 are an average of the first three quarters of the year. The real U.S. Treasury rate is defined as the nominal constant-maturity rate estimated by the Federal Reserve, less realized inflation defined by the Consumer Price Index.
42 | Chapter 1
be affected by other factors such as credit risk, but such factors are unlikely to explain the full gap.
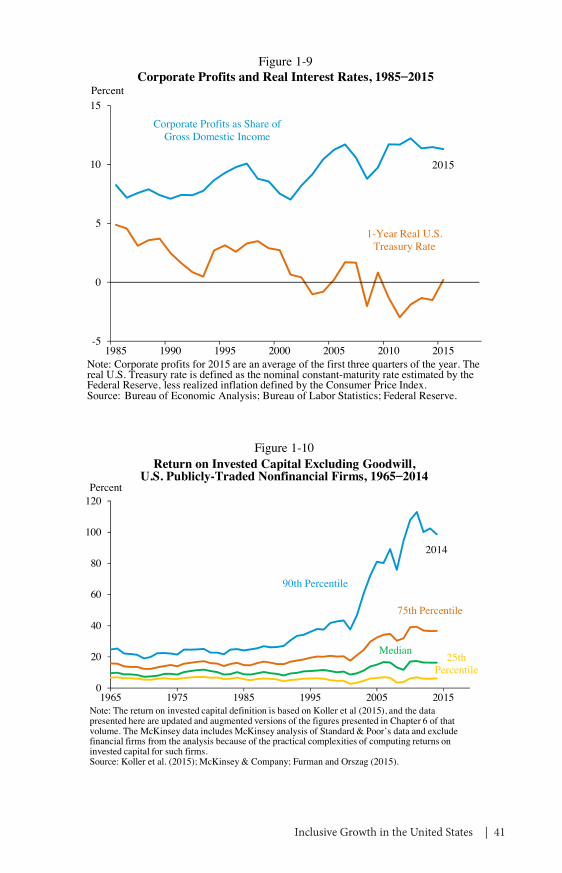
Market Concentration and the Distribution of ProfitsAnother piece of evidence for the rising importance of rents is
increased market concentration across a number of industries. Table 1-2 shows that the share of revenue earned by the largest firms increased across most industries between 1997 and 2007. This observation complements a range of studies that find increasing concentration in air travel, telecom-munications, banking, food-processing, and other sectors of the economy.
Increased concentration may play a role in the strikingly large and growing disparity in return to invested capital across major corporations (Furman and Orszag 2015). As shown in Figure 1-10, the returns earned by firms at the 90th percentile are now more than six times larger than those of the median firm, up from less than three times larger in 1990.
Occupational LicensingThere is also evidence of increased rent-seeking in the requirement of
a government-issued license to be employed in certain professions (“occupa-tional licensing”). As documented in Kleiner and Krueger (2013), the share of the U.S. workforce covered by state licensing laws grew five-fold in the
Industry Percentage Point Change in Revenue Share Earned by 50 Largest Firms, 1997‐2007
Transportation and Warehousing 12.0
Retail Trade 7.6
Finance and Insurance 7.4
Real Estate Rental and Leasing 6.6
Utilities 5.6
Wholesale Trade 4.6
Educational Services 2.7
Accommodation and Food Services 2.6
Professional, Scientific and Technical Services 2.1
Administrative/ Support 0.9
Other Services, Non-Public Admin -1.5
Arts, Entertainment and Recreation -2.3
Health Care and Assistance -3.7
Change in Market Concentration by Sector, 1997-2007Table 1-2
Note: Concentration ratio data is displayed for all North American Industry ClassificationSystem (NAICS) sectors for which data is available from 1997 to 2007.Source: Census Bureau.
Inclusive Growth in the United States | 43
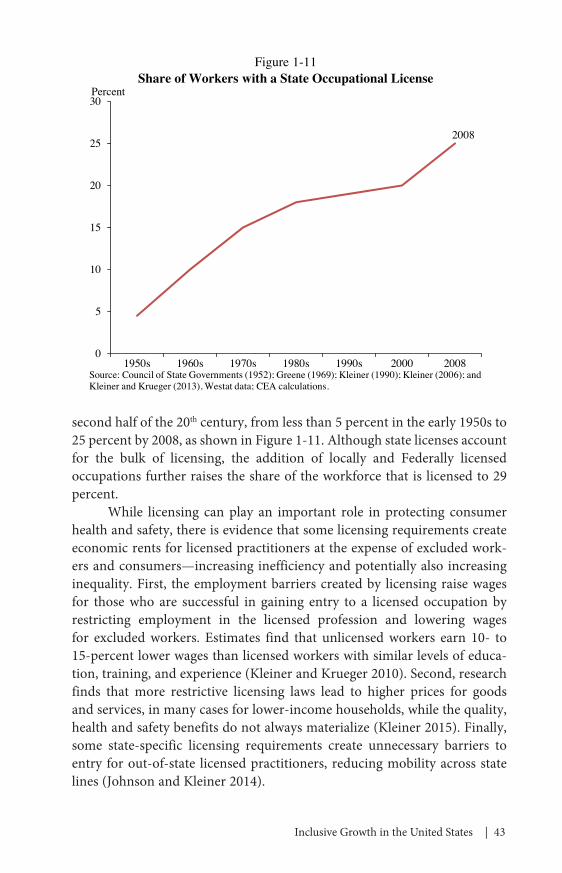
second half of the 20th century, from less than 5 percent in the early 1950s to 25 percent by 2008, as shown in Figure 1-11. Although state licenses account for the bulk of licensing, the addition of locally and Federally licensed occupations further raises the share of the workforce that is licensed to 29 percent.
While licensing can play an important role in protecting consumer health and safety, there is evidence that some licensing requirements create economic rents for licensed practitioners at the expense of excluded work-ers and consumers—increasing inefficiency and potentially also increasing inequality. First, the employment barriers created by licensing raise wages for those who are successful in gaining entry to a licensed occupation by restricting employment in the licensed profession and lowering wages for excluded workers. Estimates find that unlicensed workers earn 10- to 15-percent lower wages than licensed workers with similar levels of educa-tion, training, and experience (Kleiner and Krueger 2010). Second, research finds that more restrictive licensing laws lead to higher prices for goods and services, in many cases for lower-income households, while the quality, health and safety benefits do not always materialize (Kleiner 2015). Finally, some state-specific licensing requirements create unnecessary barriers to entry for out-of-state licensed practitioners, reducing mobility across state lines (Johnson and Kleiner 2014).
2008
0
5
10
15
20
25
30
1950s 1960s 1970s 1980s 1990s 2000 2008
Share of Workers with a State Occupational LicensePercent
Source: Council of State Governments (1952); Greene (1969); Kleiner (1990); Kleiner (2006); and Kleiner and Krueger (2013), Westat data; CEA calculations.
Figure 1-11
44 | Chapter 1
Housing and Land-Use RestrictionsThere is evidence that land-use regulation may also play a role in the
presence of increased economic rents. Such regulation in the housing market can serve legitimate, welfare-enhancing purposes, such as restrictions that prohibit industrial activities from occurring alongside or within residential neighborhoods or limitations on the size of a dwelling due to a fragile local water supply. But when excessive and primarily geared toward protecting the interests of current landowners—including their property values—land-use regulations decrease housing affordability and reduce nationwide pro-ductivity and growth. These are impacts detailed in Chapters 2 and 6 of this Report, respectively. The presence of rents in the housing market, moreover, may also restrict labor mobility and exacerbate inequality.
One main indication that land-use regulation gives rise to economic rents is that, in the aggregate, real house prices are higher than real construc-tion costs, and this differential has increased since at least the early 1980s, as shown in Figure 1-12. In fact, Glaeser, Gyourko, and Saks (2005) find that more stringent land-use regulations have driven house price apprecia-tion in excess of construction costs since 1970, before which time quality improvements actually drove much of the price increases. Further, in a large and growing set of U.S. cities—including major population centers such as New York and Los Angeles and high-productivity cities like San Francisco—home prices are usually at least 40 percent above construction costs. (Glaeser and Gyourko 2003). In addition, rental payments in the housing market in these areas often rise faster than wages.
The Interplay of Inequality and Growth
The relationship between inequality and growth continues to be the subject of much debate in the economics literature. The traditional find-ing for canonical policy responses to inequality, like progressive taxation and income support for low-income households, is that there is a tradeoff between equity and efficiency, the famous “leaky bucket” coined by Arthur Okun (1975). There has also been a long-standing macroeconomic debate about the consequences of inequality, with one traditional view being that more inequality leads to more savings by high-income households and thus a higher level of output (Duesenberry 1949).
The current theory and evidence at both a micro and macro level is considerably more ambiguous than these traditional views and suggests a number of mechanisms by which inequality can be harmful to growth. As discussed above, one clear-cut example is that to the degree that inequality is

Inclusive Growth in the United States | 45
generated by anti-competitive rents, then fostering greater competition has the potential to improve both equity and efficiency simultaneously.
But even with respect to inequality that stems from competitive mar-kets, the relationship between such inequality and output is unclear. While there are no doubt respects in which such inequality can help motivate addi-tional innovation and growth, a range of new research has also emphasized that there are a number of ways through which inequality may in fact con-strain economic growth. This literature starts from the observation that the traditional emphasis on the quantity of capital, even if true, is dwarfed by the importance of the quality of capital, technology, and entrepreneurship. In particular, this approach emphasizes a number of ways by which inequality could harm growth: (1) by reducing access to the education necessary for the full population to reach its full potential; (2) by reducing entrepreneurship and risk-taking; (3) by undermining the trust necessary for a decentralized market economy and by increasing monitoring costs; and (4) by leading to increased political instability, growth-reducing policies, and uncertainty (Ostry, Berg, and Tsangarides 2014).
In keeping with this, much recent microeconomic evidence finds important exceptions to the “leaky bucket.” For example, as discussed in Chapter 4, a number of anti-poverty programs focused on children have
Real House Prices2013
Real Construction Costs
0
40
80
120
160
200
240
280
1980 1985 1990 1995 2000 2005 2010
Real Construction Costs and House Prices, 1980–2013Index, 1980=100
Figure 1-12
Source: Gyourko and Molloy (2015).

46 | Chapter 1
been shown to increase incomes in later life, illustrating the importance of the educational channel between inequality and growth.
It is impossible to have the same degree of confidence about causation at the macroeconomic level as at the microeconomic level. There are no comparable natural experiments and the causality between inequality and growth clearly runs in both directions. Nevertheless, the fact that several recent papers have found that inequality is harmful to growth suggests—at a minimum—that it is unlikely that there is a substantial tradeoff between equality and growth.
For example, cross-country analysis from Jonathan Ostry, Andrew Berg and Charalambos Tsangarides at the International Monetary Fund (IMF) provides better evidence of the harm done by inequality and the lack of harm done by progressive policies. The IMF study finds that inequal-ity decreases both the magnitude and sustainability of growth and that progressive redistributive policies alone are neutral for the magnitude and sustainability of growth (with a small caveat that very large amounts of redistribution—those policies that redistribute above the 75th percentile of income—could have a small negative effect on growth).
The Organisation for Economic Co-operation and Development (OECD) also found associations between higher inequality and reduced growth across OECD member countries (Cingano 2014). The OECD focused on inequality of opportunity, particularly disparities in education, as the chief transmission mechanism of inequality’s restraint on growth.
Ultimately, the link between growth and inequality at an aggregate level is ambiguous, not admitting a single direction for all countries at all times and all types of inequality. Rather, the most important question is the one that policymakers face when they have the opportunity to address these trends on the margins: What are the policies that address inequality in a relatively efficient manner?
Policies to Promote Inclusive Growth
As economists’ understanding of the relationship between growth and inequality evolves, it is critical to choose economic policies that can unleash growth in an inclusive manner along with those policies that can reduce inequality in an efficient manner. Analysis of the various forms and sources of inequality in the United States can help to elucidate the mechanisms by which certain pro-growth policies can reduce inequality through either the competitive channel or the rents channel. Policies that promote inclusive growth can be grouped in four categories: those that strengthen aggregate demand in general; those that make the competitive channel work better by
Inclusive Growth in the United States | 47
promoting equality of opportunity; those that reduce unproductive inequal-ity by reducing inefficient rents and rent-seeking behavior; and those that help better protect workers and their families from the consequences of inequality—while in many cases also serving as a springboard for upward mobility. The President’s agenda for middle-class economics includes a range of policies along each of these dimensions.
Strengthening Aggregate DemandWhen an economy operates below its full potential, pro-growth poli-
cies that help to close the output gap naturally combat inequality. Indeed, unemployment or sub-optimal employment is a form of inequality itself, resulting in zero or insufficient labor earnings for a subset of workers. The same macroeconomic policies usually employed to boost growth and return the economy to full employment can unambiguously reduce this cyclical form of income inequality.
Aggressive demand management strategies implemented by the United States can, in this context, also be seen as distributional policies. Part of the U.S. response to the global financial crisis involved massive support to low-income households via the fiscal expansion in the American Recovery and Reinvestment Act of 2009 and extended unemployment insurance, among other programs. While fiscal expansion and accommodative mon-etary policy worked to boost aggregate incomes, their principal goal was the restoration of income to those who found themselves out of work during the crisis.
Additionally, a lower unemployment rate—one important effect of boosting aggregate demand—can help increase wages and draw marginal-ized workers back into the labor force. Rising labor demand and higher wages can also encourage workers to upgrade their skills and education. Therefore, a tight labor market can have substantial advantages for work-ers—particularly those at the bottom of the economic ladder—making a strong economy an important tool for fighting inequality.
Moreover, weak aggregate demand can have long-lasting effects. Many unemployed workers receive lower incomes for years to come, even after finding a job; the other side of these potentially long-lasting reductions in earnings is the possibility of long-run scarring in the economy and persis-tently lower output in the years after a recession ends. That is why continu-ing to support stronger growth, a low unemployment rate, and expanded labor force participation remains a critical goal of Administration policy.
The need for such policies was closely aligned across countries in the immediate wake of the recent crisis. Today, many advanced economies find themselves at different stages of the business cycle. However, as sub-par
48 | Chapter 1
wage growth manifests itself as a global phenomenon, it is clear that most of the industrialized world remains below full employment, underscoring the continued need for appropriate demand-management strategies.
Promoting Equality of OpportunityThe competitive channel of inequality works best when that competi-
tion is open to the largest pool of potential labor and investable capital—so it depends upon equality of opportunity that allows all Americans to partici-pate in the economy to their full potential. Education and training are criti-cal in this respect. To that end, the President put forward a plan to increase access to child care for working families while investing billions of dollars in quality early learning and preschool programs to help our youngest learners succeed—especially those from low-income families. The Administration has provided unprecedented resources and worked with business leaders, state and local governments, and others to align job training programs with labor market demand—and the President signed the bipartisan Workforce Innovation and Opportunity Act (WIOA), the first legislative reform of Federal job training programs in nearly 15 years, which will improve busi-ness engagement, accountability, access, and alignment across job train-ing, employment service, and adult education programs. Moreover, the President continues to lead a movement to make community college free for responsible students. All of these steps help increase the supply of skilled workers, allowing more people to take advantage of the returns to skills while also increasing the relative demand for unskilled workers, driving up their wages and reducing the dispersion of incomes.
In addition, an important element of opportunity is giving everyone the opportunity to participate in the workforce if they choose to and it makes sense given their family situation. The President supports a range of policies to boost labor force participation, including promoting access to paid leave and paid sick days to help encourage Americans to join the labor force; promoting greater access to high-quality child care; reforming taxes to make work more attractive for secondary earners; and helping provide training programs and other assistance finding jobs.
Reducing Market Power Concentration and Rent-Seeking BehaviorTo the degree that rising aggregate rents stemming from growing
market power are contributing to increased inequality, then changing the balance of that power or fostering more competitive markets will increase efficiency while reducing inequality. Policies like a minimum wage and greater support for collective bargaining can help level the playing field for workers in negotiations with employers. Because such policies only change
Inclusive Growth in the United States | 49
the division of rents, they can reduce inequality without necessarily reduc-ing overall welfare. In fact, when appropriately tailored, they can foster the previously discussed growth benefits of a better-paid workforce like greater access to education and increased entrepreneurship.
Heightened antitrust enforcement, rationalizing licensing require-ments for employment, reducing zoning and other land use restrictions, and appropriately balancing intellectual property regimes, all can help reduce excessive rents. Firms with extensive market power can take many anti-competitive actions that generate inefficient rents. Often, there are existing regulations prohibiting such behavior. A robust enforcement regime for the regulations that fight rent-seeking can therefore improve efficiency and inequality at the same time.
Finally, to the degree that rent-seeking warps regulations, policymak-ers should reduce the ability of people or corporations to seek rents success-fully through political reforms and other steps to reduce the influence of regulatory lobbying. Much like the first two channels, policies that reduce these rents can also increase efficiency while reducing inequality.
Protecting Families Against the Consequences of Inequality While Fostering Mobility
A progressive tax system combined with important benefits that exist today—like unemployment insurance and the Affordable Care Act—and new proposals the President has made, like wage insurance, can help both reduce inequality and protect the people who get an unlucky draw in a given year or over time. In many cases, such policies do not just affect after-tax incomes, but also help increase before-tax incomes over time. The Earned Income Tax Credit (EITC), for example, has been shown to increase labor force participation by single mothers, raising their earnings and their after-tax income (Liebman 1998).
Moreover, a growing body of economic research has helped confirm that programs to support low-income families can not only strengthen the position of the families themselves, but also have important benefits for long-term productivity (Brown, Kowalski, and Lurie, 2015; Hoynes, Schanzenbach, and Almond, 2012; Chetty, Friedman, and Rockoff, 2011). Indeed, the link between growth and equality is especially apparent at the lower end of the income distribution where the unequal distribution of opportunity is most important.
Economists have evaluated the long-term benefits of historical government programs targeted toward low-income families in the United States. Compared with similar children who received no support, children from families who received temporary income support at the start of the

50 | Chapter 1
20th century saw higher wages, more education, and lower mortality—with benefits from a few years of income support lasting for 80 years or more (Aizer, Eli, and Ferrie, 2014). The U.S. Supplemental Nutrition Assistance Program—formerly known as the Food Stamp Program; the EITC, one of the government’s largest tools to reduce child poverty; and Medicaid, the health program for low-income Americans, have all been shown to have similar benefits (CEA 2015b).
Greater education, lower mortality, and lower crime rates do not just benefit the affected individual, but also support productivity and potential growth in the aggregate. Many of these policies would also strengthen labor force participation. When the public sector makes important investments in supporting the most disadvantaged families, there are clear benefits to aggregate growth.
Conclusion: The 2016 Economic Report of the President
Middle-class incomes are driven by productivity growth, labor force participation, and the equality of outcomes. As the U.S. economy moves beyond the recovery from the financial crisis, our policy stance should focus on promoting each of those factors to foster inclusive growth. This year’s Economic Report of the President considers several elements of the inclusive growth agenda. Chapter 2 begins by reviewing the United States’ macroeco-nomic progress in 2015 and considering the outlook for the years to come, and Chapter 3 focuses on the United States’ progress in a global context. Chapter 4 focuses on one especially important element of the inequality of opportunity discussed in this chapter—the particular economic challenges low-income children face. Chapters 5 and 6 consider two key elements of productivity growth on which American businesses and policymakers should focus even more closely: technological innovation and infrastructure investment. Finally, Chapter 7 concludes with a retrospective look at the institutional structure and history of the President’s Council of Economic Advisers on its 70th anniversary.