Chapter 1 - Gene- · PDF fileuse of the real-time quantitative polymerase chain reaction ......
16
Mark Wilks (ed.), PCR Detection of Microbial Pathogens: Second Edition, Methods in Molecular Biology, vol. 943, DOI 10.1007/978-1-60327-353-4_1, © Springer Science+Business Media, LLC 2013 Chapter 1 Real-Time Quantitative PCR, Pathogen Detection and MIQE Jamie Murphy, Tania Nolan, and Stephen A. Bustin Abstract Keywords The last few years have witnessed a prodigious proliferation in the use of the real-time quantitative polymerase chain reaction (qPCR) for diagnostic applications designed to detect and quantify micro- bial pathogens (1). Key reasons are the characteristic sensitivity, specificity, and wide linear dynamic range of qPCR assays; this development is being accelerated by qPCR integration with nano- technology, which has resulted in its emergence in novel areas such as high throughput, nanoliter qPCR (2), and microfluidic digital PCR (3). These innovations have extended the scope of qPCR technology by holding out additional advantages such as short assay times, low reagent usage, and exceptionally rapid heating/ cooling rates. Importantly, integration of multiple processing mod- ules allows further size reduction and power consumption, making qPCR technology viable for point-of-care diagnostics. Clearly, the combination of nanotechnology and qPCR has huge potential in clinical diagnostics, assuming the availability of adequate and appropriate sample material, the need for the technology to accom- modate fairly crude biological samples as analytical targets, optimal sampling timing regarding the course of disease and standardiza- tion of pre-assay and assay protocols (4, 5). The contribution qPCR can make to improve the diagnosis of life-threatening dis- eases is clearly illustrated by its application to the detection of invasive ] 1. Introduction
Transcript of Chapter 1 - Gene- · PDF fileuse of the real-time quantitative polymerase chain reaction ......
Mark Wilks (ed.), PCR Detection of Microbial Pathogens: Second Edition, Methods in Molecular Biology, vol. 943,DOI 10.1007/978-1-60327-353-4_1, © Springer Science+Business Media, LLC 2013
Chapter 1
Real-Time Quantitative PCR, Pathogen Detection and MIQE
Jamie Murphy, Tania Nolan, and Stephen A. Bustin
Abstract
Keywords
The last few years have witnessed a prodigious proliferation in the use of the real-time quantitative polymerase chain reaction (qPCR) for diagnostic applications designed to detect and quantify micro-bial pathogens (1). Key reasons are the characteristic sensitivity, specificity, and wide linear dynamic range of qPCR assays; this development is being accelerated by qPCR integration with nano-technology, which has resulted in its emergence in novel areas such as high throughput, nanoliter qPCR (2), and microfluidic digital PCR (3). These innovations have extended the scope of qPCR technology by holding out additional advantages such as short assay times, low reagent usage, and exceptionally rapid heating/cooling rates. Importantly, integration of multiple processing mod-ules allows further size reduction and power consumption, making qPCR technology viable for point-of-care diagnostics. Clearly, the combination of nanotechnology and qPCR has huge potential in clinical diagnostics, assuming the availability of adequate and appropriate sample material, the need for the technology to accom-modate fairly crude biological samples as analytical targets, optimal sampling timing regarding the course of disease and standardiza-tion of pre-assay and assay protocols (4, 5). The contribution qPCR can make to improve the diagnosis of life-threatening dis-eases is clearly illustrated by its application to the detection of invasive
[AU1]
1. Introduction
1
2
3
4
5
6
7
8
9
10
11
12
13
14
15
16
17
18
19
20
21
22
23
24
25
26
27
28
29
sabustin
sabustin
Gemma Johnson, Tania Nolan and Stephen A. Bustin
J. Murphy, T. Nolan, and S.A. Bustin
aspergillosis (IA), caused by pathogenic Aspergillus fungi, where early diagnosis and treatment are essential for adequate therapeutic management. There is an increasing incidence of systemic fungal infections in patients immunocompromised as a result of HIV infection or organ transplantation, patients from intensive care units, and those with prolonged neutropenia after intensified che-motherapy. These include patients with acute leukemia during induction therapy or after transplantation of allogeneic hemato-logic stem cells. IA has a high mortality rate and, in surviving patients, leads to considerable complications often limiting further anti-neoplastic therapies. The reliability of current diagnostic tools in early detection of fungal infections in neutropenic patients is limited; hence the definitive diagnosis of IA remains a challenge.
The committee of the European Organization for Research and Treatment of Cancer⁄Mycosis (EORTC) and Mycoses Study Group of National Institute of Allergy and Infectious Diseases (NIAID) has thus far not recommended the routine use of PCR in the diag-nosis of IA (6), mainly because of the absence of standardized pro-tocols (7). However, the feasibility of using qPCR in these patients as a potentially more accurate alternative to conventional diagnos-tic procedures has been evaluated extensively (8–10). There are a number of compelling reasons for utilizing qPCR as a diagnostic assay for IA:
A qPCR assay can be completed in minutes. This immediacy allows virtually instantaneous reporting of results.Judicious targeting of amplified genomic regions, e.g., the rRNA gene region, maximizes the reliability of the assay. It substitutes the uncertainty of having to identify a single copy of a gene on an infectious fungal particle or single genome with the consistency and reliability of being able to target tens of copies specified within that single genome.Primer and probe design is extremely flexible and assays can be tailored to be specific for most fungal genera or species.The quantitative potential of qPCR allows determination of fungal load, which can distinguish between colonization and infection.Multiplexing capacity allows qPCR assays to detect multiple targets and/or include appropriate controls in a single reaction.
2. qPCR and Pathogen Detection
30
31
32
33
34
35
36
37
38
39
40
41
42
43
44
45
46
47
48
49
50
51
52
53
54
55
56
57
58
59
60
61
62
63
64
65
66
67
68
69
sabustin
G. Johnson, T. Nolan and S.A. Bustin
Real-Time Quantitative PCR, Pathogen Detection and MIQE
In principle, the only requirements for obtaining quantitative data are a set of reagents (target-specific primers and optional probes, a source of DNA and an enzyme/buffer/dNTP mix), a qPCR instrument that detects the fluorescence emitted by the PCR reaction and software that calculates DNA copy numbers or relative abundance from the quantification cycles recorded by the instrument. In practice, the development and successful application of an optimal qPCR diagnostic assay depends on understanding and addressing several challenges and shortcom-ings. A systematic review and meta-analysis on the use of PCR tests for the diagnosis of IA highlights the lack of homogeneity of the PCR methods used (11) and another recent study shows that lack of rigorous experimental controls, together with a prevalence of false-positive and -negative results hinders the interpretation of diagnostic performance, thus impeding widespread acceptance of qPCR-based technology (12). False negatives can occur due to suboptimal DNA extraction, for example low recovery of DNA and the presence of PCR inhibitors. Since all fungi produce small, hydrophobic conidia that are difficult to disrupt, it is not surpris-ing that sample preparation is a source of heterogeneity and a critical parameter for obtaining reliable qPCR results (10). Other causes are the presence of large amounts of human genomic DNA competing with the microbial target for amplification and of course suboptimal analytical sensitivity of the qPCR reaction itself. False positives can occur either due to contamination at any time during the pre-assay stage, i.e. during sample collection, DNA extraction, and qPCR set-up, or be the result of poor assay design, resulting from cross-reactivity of the target qPCR assay with other DNA. Hence any serious qPCR assay must incorpo-rate controls to assess for these factors contributing to false-posi-tive and false-negative results, something sadly lacking from many published studies.
It is remarkably difficult to make a reaction fail completely but alarmingly simple to produce poor quality data (13). When prop-erly executed, qPCR assays can be highly reproducible; however, since pathogen abundance is frequently low, assay reproducibility is influenced by parameters such as distribution statistics (14), with stochastic sampling effects affecting the reliability of the qPCR data (15). This emphasizes the importance of repetitive testing in clinical samples and one of the strengths of qPCR assays is the ease with which it is possible to obtain quantitative data for every sample, which encourages the use of biological replicates and permits the
3. Quality Control Issues
[AU1]
70
71
72
73
74
75
76
77
78
79
80
81
82
83
84
85
86
87
88
89
90
91
92
93
94
95
96
97
98
99
100
101
102
103
104
105
106
107
108
109
110
111
112
J. Murphy, T. Nolan, and S.A. Bustin
application of powerful statistical analyses to the quantification procedure.
Like any clinical diagnostic assay, qPCR assays must be properly validated (16) and meet the criteria expected of any laboratory test applied in clinical medicine: (1) standardization of the test across different laboratories, (2) reproducibility of positive and negative predictive values, and (3) reliable sensitivity and specificity. This involves the establishment of a set of quality standards dealing with experimental protocols, the use of appropriate positive and negative control samples, and suitable analysis and reporting guidelines. Standardization, in particular, is all-important (11, 17, 18) as it provides the foundation for robust, reliable, and comparable results that are of critical importance for the consistent management of patients (19).
Specifically, a successful diagnostic qPCR assay requires careful consideration of these issues.
1. Optimal sample quality is a prerequisite for the generation of valid quantitative data (20). Hence sample collection, prepara-tion, and transport and nucleic acid extraction methods are critical parameters in test performance and must be optimized and, ideally, standardized. In principle, extraction of fungal nucleic acids, especially if present in a cell-free state, from bronchoalveolar lavages, blood, and serum is relatively straight-forward; however, it is easy to co-purify inhibitors of the PCR that will generate inconsistent and unreliable results. This must be assessed for every sample prior to carrying out any qPCR assay aimed at pathogen detection. Amongst the numerous methods for Aspergillus DNA extraction the bead-beating methods appear to be the most successful (21), although no single extraction method is optimal for all fungal species (22). However, extraction of DNA from conidia, combined with the presence of a complex, sturdy cell wall, can require extensive and harsh extraction methods that can damage DNA and RNA to the extent that amplification becomes unreliable.
2. Primer selection is critical since it affects the sensitivity of the qPCR assay. The structure of the nucleic acid target at the primer-binding site must be taken into account, as this affects the accessibility of the target to the primers and extensive sec-ondary structure at a primer-binding site will result in a less efficient and sensitive assay.
3. Regular calibration of the real-time instrument is crucial for obtaining consistent and accurate results. The quantification cycle (Cq) is neither absolute nor invariant, but varies between assays carried out on different days with different reagents or on different instruments. This is because the Cq depends on the instrument’s threshold setting, which in turn depends on background fluorescence, which varies with different probes,
113
114
115
116
117
118
119
120
121
122
123
124
125
126
127
128
129
130
131
132
133
134
135
136
137
138
139
140
141
142
143
144
145
146
147
148
149
150
151
152
153
154
155
156
157
158
159
sabustin
G. Johnson, T. Nolan and S.A. Bustin
Real-Time Quantitative PCR, Pathogen Detection and MIQE
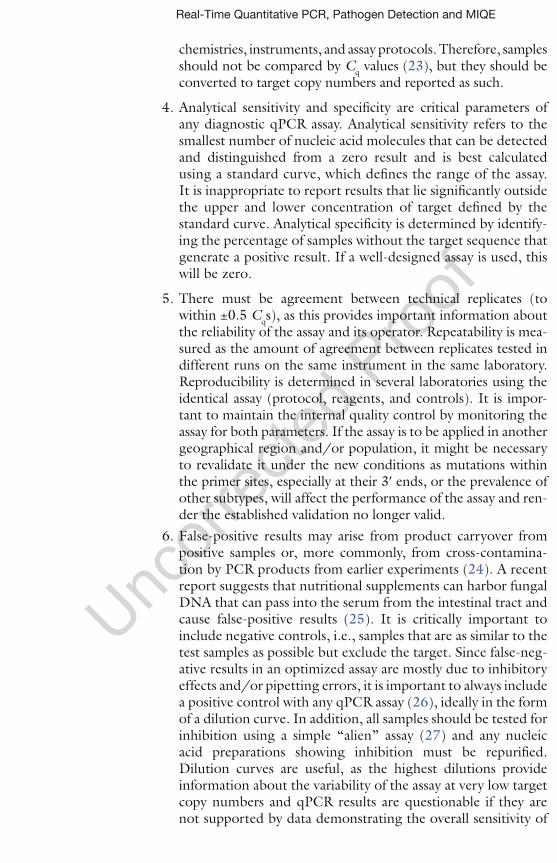
chemistries, instruments, and assay protocols. Therefore, samples should not be compared by Cq values (23), but they should be converted to target copy numbers and reported as such.
4. Analytical sensitivity and specificity are critical parameters of any diagnostic qPCR assay. Analytical sensitivity refers to the smallest number of nucleic acid molecules that can be detected and distinguished from a zero result and is best calculated using a standard curve, which defines the range of the assay. It is inappropriate to report results that lie significantly outside the upper and lower concentration of target defined by the standard curve. Analytical specificity is determined by identify-ing the percentage of samples without the target sequence that generate a positive result. If a well-designed assay is used, this will be zero.
5. There must be agreement between technical replicates (to within ±0.5 Cqs), as this provides important information about the reliability of the assay and its operator. Repeatability is mea-sured as the amount of agreement between replicates tested in different runs on the same instrument in the same laboratory. Reproducibility is determined in several laboratories using the identical assay (protocol, reagents, and controls). It is impor-tant to maintain the internal quality control by monitoring the assay for both parameters. If the assay is to be applied in another geographical region and/or population, it might be necessary to revalidate it under the new conditions as mutations within the primer sites, especially at their 3 ends, or the prevalence of other subtypes, will affect the performance of the assay and ren-der the established validation no longer valid.
6. False-positive results may arise from product carryover from positive samples or, more commonly, from cross-contamina-tion by PCR products from earlier experiments (24). A recent report suggests that nutritional supplements can harbor fungal DNA that can pass into the serum from the intestinal tract and cause false-positive results (25). It is critically important to include negative controls, i.e., samples that are as similar to the test samples as possible but exclude the target. Since false-neg-ative results in an optimized assay are mostly due to inhibitory effects and/or pipetting errors, it is important to always include a positive control with any qPCR assay (26), ideally in the form of a dilution curve. In addition, all samples should be tested for inhibition using a simple “alien” assay (27) and any nucleic acid preparations showing inhibition must be repurified. Dilution curves are useful, as the highest dilutions provide information about the variability of the assay at very low target copy numbers and qPCR results are questionable if they are not supported by data demonstrating the overall sensitivity of
160
161
162
163
164
165
166
167
168
169
170
171
172
173
174
175
176
177
178
179
180
181
182
183
184
185
186
187
188
189
190
191
192
193
194
195
196
197
198
199
200
201
202
203
204
205

J. Murphy, T. Nolan, and S.A. Bustin
the assay applied (16). Furthermore, running a dilution curve with each assay immediately reveals any problem with that par-ticular run and increases confidence when reporting negative results. The same argument applies to running samples in duplicate or, preferably, in triplicate and in this qPCR is no dif-ferent from any clinical diagnostic assay.
Robust and precise qPCR usually correlates with high PCR efficiency; consequently the primary aim of assay optimization is to achieve the most efficient qPCR assay optimized at the sensitivity and specificity appropriate for pathogen detection. Detailed optimiza-tion requires the consideration of a range of parameters that include the concentration of reaction components, such as salts and oligo-nucleotides, as well as reaction conditions such as primer annealing temperatures, incubation periods, and even ramp rates. In addi-tion, qPCR results are affected by the fluorescent signal, an impor-tant concern when designing multiplex assays. Since variations in experimental protocols lead to highly variable data, it is essential that all relevant experimental conditions and assay characteristics are reported when publishing qPCR results (28).
A dilution curve, generated by performing qPCR with a serial dilution of template, is a convenient tool to test assay efficiency. A well-optimized assay should be linear over a range of at least nine logs of template concentration, with efficiency close to 100% and high reproducibility between technical replicates. Amplification efficiency can be determined from the slope of the linear regression of a plot of Cq (y-axis) vs. log [quantity]. The template may be any suitable material such as cDNA, genomic DNA, PCR product, or synthetic DNA oligonucleotides that match the sequence of the target amplicons. The advantages of using synthetic oligonucle-otides are that (1) one synthesis is sufficient for several million reactions, thus providing a consistent positive control and (2) they can be accurately quantified, thus making it possible to obtain a fairly accurate pathogen copy number value, making comparison of different assays more reliable. However, artificial templates must be handled with extreme caution since they constitute highly con-centrated targets that could potentially contaminate all oligonucle-otides and reagents if handled carelessly.
Amplification efficiency, E, is calculated from the slope of the stan-dard curve using the formula: E = 10(!1/slope), which is usually con-verted into a percentage efficiency (% Efficiency = (E ! 1) " 100%). A combination of a good assay and accurate pipetting will generate
4. Optimization Parameters
4.1. Dilution Curves
4.2. Amplification Efficiency
206
207
208
209
210
211
212
213
214
215
216
217
218
219
220
221
222
223
224
225
226
227
228
229
230
231
232
233
234
235
236
237
238
239
240
241
242
243
244
245
246
247
sabustin
G. Johnson, T. Nolan and S.A. Bustin

Real-Time Quantitative PCR, Pathogen Detection and MIQE
dilution curves that demonstrate near-perfect doubling (or consistent amplification) with each amplification cycle. Thus, the spacing of the fluorescence curves will be determined by the equa-tion 2n = dilution factor, where n is the number of cycles between curves. For example, with a tenfold serial dilution of DNA, 2n = 10. Therefore, n = 3.32 and the Cq values should be separated by approximately 3.32 cycles. If doubling occurs at each cycle, E = 10!(1/!3.32) = 2 and the % Efficiency = (2 ! 1) " 100% = 100%. In practice, amplification efficiency will be around 90–105% and result in gradients of between !3.2 and !3.5. Note that the presence of inhibitors can result in an apparent increase in efficiency. This is because samples with the highest concentration of template also have the highest level of inhibitors, and therefore display a greater lag between Cq values than samples with lower template concentra-tions and lower levels of inhibitors. As a result, the absolute value of the slope decreases and the calculated efficiency appears to increase. Similarly inaccurate pipetting can lead to data suggestive of higher or lower efficiency and so it is important to assess the correlation coefficient of the line to determine the linearity and reproducibility of the assay. It provides a measure of how well the data fit on a straight line and is influenced by pipetting accuracy and by the range of the assay. During assay evaluation and optimi-zation, three technical replicates of each template dilution should be processed in parallel in order to establish that the assay is repro-ducible. A stable assay will demonstrate an R2 > 0.98 over at least six logs and with three replicates.
Finally, DNA templates themselves can affect the efficiency and quality of a qPCR assay. A qPCR template may be present at any concentration from a single copy to approximately 1011 copies. High concentration of template will inhibit the reaction resulting in reduced yield and inaccurate Cq differences between amplification plots, so inaccurate quantification. Low initial concentration can result in lack of detection of amplified product if the final yield is extremely low.
Reliable pathogen detection requires absolute assay specificity. In a qPCR experiment all detectable products, be they specific or nonspecific, contribute to the final amplification plot and hence any qualitative or quantitative result. This can be a problem when using a generic detection system such as SYBR Green I dye, but can also affect the quality of a probe-based assay designed to detect only a single target sequence. Although nonspecific amplification may not affect the shape of the amplification plot and is not detected by a probe-based assay, it nonetheless affects amplification efficiency and assay sensitivity. Performing a post-reaction melt analysis using SYBR Green I dye during the assay optimization stage can validate the specificity of amplification. An assay with high specificity will produce a single peak at a high temperature with nothing in the
4.3. Assay Specificity
248
249
250
251
252
253
254
255
256
257
258
259
260
261
262
263
264
265
266
267
268
269
270
271
272
273
274
275
276
277
278
279
280
281
282
283
284
285
286
287
288
289
290
291
292
293
294

J. Murphy, T. Nolan, and S.A. Bustin
no-template controls. If the melting curve has more than one major peak, agarose gel electrophoresis and DNA sequencing should determine the identities of the products. Lowering the primer concentrations and increasing the annealing temperatures will often reduce the amount of nonspecific products.
The composition of the reaction buffer has a significant influence on assay specificity, as it influences binding of primer to template. Reaction buffers contain variations on a basic composition consist-ing of ammonium sulfate, Tris, EDTA, BSA, -mercaptoethanol, dNTPs, MgCl2, KCl, NaCl, and DNA polymerase. Optimum buf-fer composition is dependent upon the DNA polymerase used: dif-ferent enzymes can influence PCR efficiency and therefore product yield. It is generally accepted that Taq DNA polymerase performs optimally in a basic buffer of 50 mM KCl and 10 mM Tris–HCl, pH 8.3 (measured at room temperature). Some enzymes have a requirement for added protein (BSA is usually added, when required). Although dNTPs are the standard substrate for DNA polymerases, dUTP may be incorporated into qPCR reactions to provide target for subsequence contamination control steps using Uracil–N-Glycosylase to remove UTP containing templates from reaction mixes prior to amplification. In a standard reaction, the concentration of dNTPs is included in equimolar ratios, usually 200 M (or up to 500 M) of each dNTP. Many commercially available buffers may also contain PCR enhancers such as single-stranded binding protein (SSBP), betaine, formamide, or DMSO. The presence of detergent improves the activity of some enzymes, presumably by reducing aggregation.
The salt concentration within the buffer affects the Tm of the primer–template duplex and is required for primer annealing. Concentrations of KCl or NaCl above 50 mM can be inhibitory, while MgCl2 is required as a cofactor for DNA polymerase. The most influential factor effecting free magnesium ions is the concen-tration of dNTPs in the reaction and so the magnesium ion con-centration must exceed the dNTP concentration. Typical reactions contain 1.5 mM MgCl2 in the presence of 0.8 mM dNTPs result-ing in approximately 0.7 mM free magnesium. Optimal MgCl2 concentrations can differ for every primer/template combination and this leads to problems if the reactions are to be multiplexed, as there will be significant differences in the efficiency of the individ-ual reaction and, hence, in the yield of the different PCR products. Hence primer optimization is an essential step in multiplex assay development.
Primer optimization serves to drive the kinetics of binding of the primers to the specific template sequence. Annealing is a kinetic result of the annealing temperature of the reaction and also the concentration of the primers. Optimization is a two stage process and should proceed as follows.
4.4. Buffer and Sample Considerations
4.5. Primer Optimization
295
296
297
298
299
300
301
302
303
304
305
306
307
308
309
310
311
312
313
314
315
316
317
318
319
320
321
322
323
324
325
326
327
328
329
330
331
332
333
334
335
336
337
338
339
340
341
sabustin
G. Johnson, T. Nolan and S.A. Bustin

Real-Time Quantitative PCR, Pathogen Detection and MIQE
1. Optimal annealing temperature Ta is approximately 5°C lower than the Tm (melting temperature) of the primer with the low-est Tm. The Tm for a short oligonucleotide can easily be calcu-lated by the approximation: Tm = 4(number G + number C residues) + 2(number A + number T residues). Taking this tem-perature as a starting point, different temperatures (±5°C) should be tested in steps of 0.5°C; alternatively, a simpler option is to use a temperature gradient PCR block (as for example is standard on the BioRad CFX). Whilst unexciting, applying the optimal Ta will result in higher specificity and yield, since using too low a Ta results in nonspecific priming, whereas too high a Ta results in inefficient priming and elongation.
2. Primer concentration should be optimized using a primer con-centration matrix in which all primer concentrations from 50 to 300 nM are tested against each other and the conditions producing the highest concentration of specific template are selected. When optimizing a multiplex reaction it is essential that each single reaction is of high quality (as defined above) before attempting to combine them. The single most impor-tant factor for multiplex success is the primer design and it is recommended that a program such as Beacon Designer is used since this will compare the compatibility of assays in silico. A serial dilution containing each of the targets is then interro-gated with the assays in pairs. Any deviation from the original single assay indicates that the oligonucleotides are interfering. Optimization may then include reassessment of oligonucle-otide concentration, change in MgCl2 concentration and potentially in the amount of DNA polymerase in the reaction.
The Minimum Information for the Publication of Quantitative PCR Experiments (MIQE; (http://www.rdml.org/miqe) guide-lines have two aims: first, to provide a standardized template for good assay design and second, to encourage transparency of proto-cols, data analysis, and conclusions. MIQE is part of a drive that promotes minimum guidelines for the reporting of biological experiments (29) and is modeled on similar guidelines such as MIAME (Minimal Information about a Microarray Experiment), developed several years ago (30) and MIAPE (Minimal Information about a Proteomics Experiment) (31). All of these are initiatives developed under the umbrella of the MIBBI (Minimum Information for Biological and Biomedical Investigations) standardization body, which has the goal of unifying all of the standardization guidelines for biological and biomedical research. In addition, the Real-Time PCR Data Markup Language (RDML; http://www.rdml.org) has
5. The MIQE Guidelines
342
343
344
345
346
347
348
349
350
351
352
353
354
355
356
357
358
359
360
361
362
363
364
365
366
367
368
369
370
371
372
373
374
375
376
377
378
379
380
381
382
383
384
385

J. Murphy, T. Nolan, and S.A. Bustin
been developed by a consortium, upon the request of MIBBI, to enable the straightforward exchange of qPCR data and related information between qPCR instruments and third party data anal-ysis software, between colleagues, and with journals or public data repositories (32).
The four key areas of standardization that define any qPCR experiment are (1) study design, (2) technical detail, (3) analysis methods, and (4) statistics. MIQE defines the minimum informa-tion required for evaluation of qPCR results and addresses these under a set of nine captions that describe a large number of indi-vidual elements. There is a clear hierarchy with some parameters, labeled E (essential) in the published guidelines, indispensable for attaining the ambition of the main aims, whereas other compo-nents, labeled D (desirable) more peripheral, yet constituting an effective foundation for the realization of best practice protocols. It is essential to report as much information about sample acquisi-tion, storage, and handling as possible; it is also important to pro-vide details of sample processing procedures, since any sample has to pass through a number of preparative steps prior to the qPCR assay, every one of which can introduce additional variability (33, 34). For pathogen detection, it is critical that the sequences of primers and probes are reported, since an experiment cannot be reproduced if information on one of the principal reagents is lack-ing. The most commonly used models for the analysis of qPCR data use either the Cq (35) or the more generalized efficiency calibrated model (36) and updates or variations continue to be introduced (37, 38). However, confidence interval and statistical significance considerations are still not accorded a high enough priority (39) and there is a tremendous reluctance to use dilution curves to test the amplification efficiencies of individual assays, even though, as discussed above, this method remains by far the easiest, most transparent and informative method for determining amplification efficiency. Furthermore, dilution curves also provide convenient positive controls, can act as inhibition controls, and help define the dynamic range and the limits of detection all at the same time. Ideally such a dilution curve should be run with each sample, as all these parameters could (and probably do) vary between samples.
Below are some basic recommendations for troubleshooting qPCR experiments.
No amplification is characterized by no significant increase in fluorescence above background. Poor amplification is typified by a very low Rn value (<0.05) or by a slope that varies significantly between samples amplifying the same target. Late amplification is anything that generates a Cq > 35.
First check qPCR reaction conditions.
5.1. Brief Troubleshooting Guide
5.1.1. No/Poor/Late Amplification
386
387
388
389
390
391
392
393
394
395
396
397
398
399
400
401
402
403
404
405
406
407
408
409
410
411
412
413
414
415
416
417
418
419
420
421
422
423
424
425
426
427
428
429
430
431
sabustin
G. Johnson, T. Nolan and S.A. Bustin
Real-Time Quantitative PCR, Pathogen Detection and MIQE
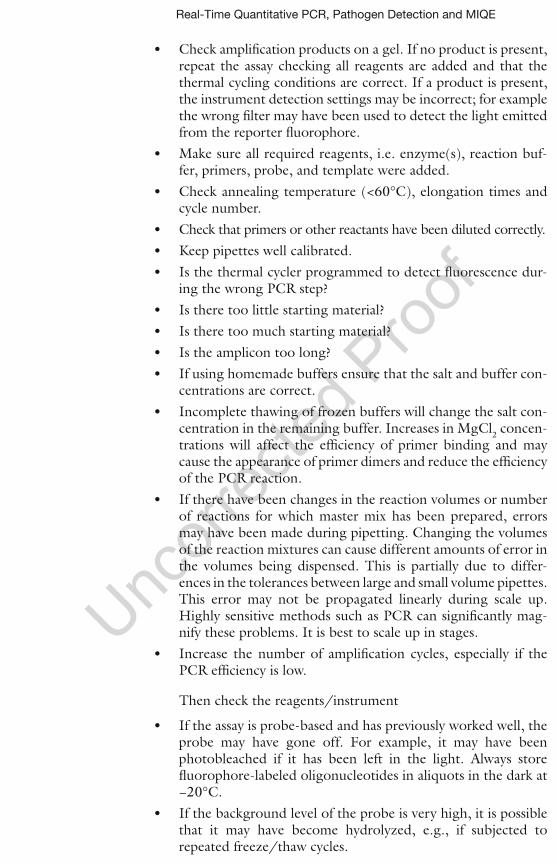
Check amplification products on a gel. If no product is present, repeat the assay checking all reagents are added and that the thermal cycling conditions are correct. If a product is present, the instrument detection settings may be incorrect; for example the wrong filter may have been used to detect the light emitted from the reporter fluorophore.Make sure all required reagents, i.e. enzyme(s), reaction buf-fer, primers, probe, and template were added.Check annealing temperature (<60°C), elongation times and cycle number.Check that primers or other reactants have been diluted correctly.Keep pipettes well calibrated.Is the thermal cycler programmed to detect fluorescence dur-ing the wrong PCR step?Is there too little starting material?Is there too much starting material?Is the amplicon too long?If using homemade buffers ensure that the salt and buffer con-centrations are correct.Incomplete thawing of frozen buffers will change the salt con-centration in the remaining buffer. Increases in MgCl2 concen-trations will affect the efficiency of primer binding and may cause the appearance of primer dimers and reduce the efficiency of the PCR reaction.If there have been changes in the reaction volumes or number of reactions for which master mix has been prepared, errors may have been made during pipetting. Changing the volumes of the reaction mixtures can cause different amounts of error in the volumes being dispensed. This is partially due to differ-ences in the tolerances between large and small volume pipettes. This error may not be propagated linearly during scale up. Highly sensitive methods such as PCR can significantly mag-nify these problems. It is best to scale up in stages.Increase the number of amplification cycles, especially if the PCR efficiency is low.
Then check the reagents/instrument
If the assay is probe-based and has previously worked well, the probe may have gone off. For example, it may have been photobleached if it has been left in the light. Always store fluorophore-labeled oligonucleotides in aliquots in the dark at !20°C.If the background level of the probe is very high, it is possible that it may have become hydrolyzed, e.g., if subjected to repeated freeze/thaw cycles.
432
433
434
435
436
437
438
439
440
441
442
443
444
445
446
447
448
449
450
451
452
453
454
455
456
457
458
459
460
461
462
463
464
465
466
467
468
469
470
471
472
473
474
475
J. Murphy, T. Nolan, and S.A. Bustin
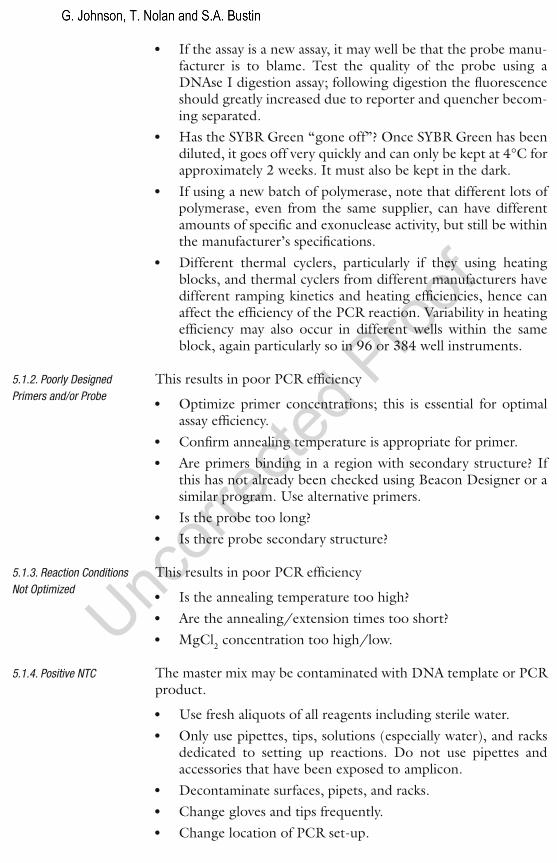
If the assay is a new assay, it may well be that the probe manu-facturer is to blame. Test the quality of the probe using a DNAse I digestion assay; following digestion the fluorescence should greatly increased due to reporter and quencher becom-ing separated.Has the SYBR Green “gone off”? Once SYBR Green has been diluted, it goes off very quickly and can only be kept at 4°C for approximately 2 weeks. It must also be kept in the dark.If using a new batch of polymerase, note that different lots of polymerase, even from the same supplier, can have different amounts of specific and exonuclease activity, but still be within the manufacturer’s specifications.Different thermal cyclers, particularly if they using heating blocks, and thermal cyclers from different manufacturers have different ramping kinetics and heating efficiencies, hence can affect the efficiency of the PCR reaction. Variability in heating efficiency may also occur in different wells within the same block, again particularly so in 96 or 384 well instruments.
This results in poor PCR efficiency
Optimize primer concentrations; this is essential for optimal assay efficiency.Confirm annealing temperature is appropriate for primer.Are primers binding in a region with secondary structure? If this has not already been checked using Beacon Designer or a similar program. Use alternative primers.Is the probe too long?Is there probe secondary structure?
This results in poor PCR efficiency
Is the annealing temperature too high?Are the annealing/extension times too short?MgCl2 concentration too high/low.
The master mix may be contaminated with DNA template or PCR product.
Use fresh aliquots of all reagents including sterile water.Only use pipettes, tips, solutions (especially water), and racks dedicated to setting up reactions. Do not use pipettes and accessories that have been exposed to amplicon.Decontaminate surfaces, pipets, and racks.Change gloves and tips frequently.Change location of PCR set-up.
5.1.2. Poorly Designed Primers and/or Probe
5.1.3. Reaction Conditions Not Optimized
5.1.4. Positive NTC
476
477
478
479
480
481
482
483
484
485
486
487
488
489
490
491
492
493
494
495
496
497
498
499
500
501
502
503
504
505
506
507
508
509
510
511
512
513
514
515
sabustin
G. Johnson, T. Nolan and S.A. Bustin
Real-Time Quantitative PCR, Pathogen Detection and MIQE
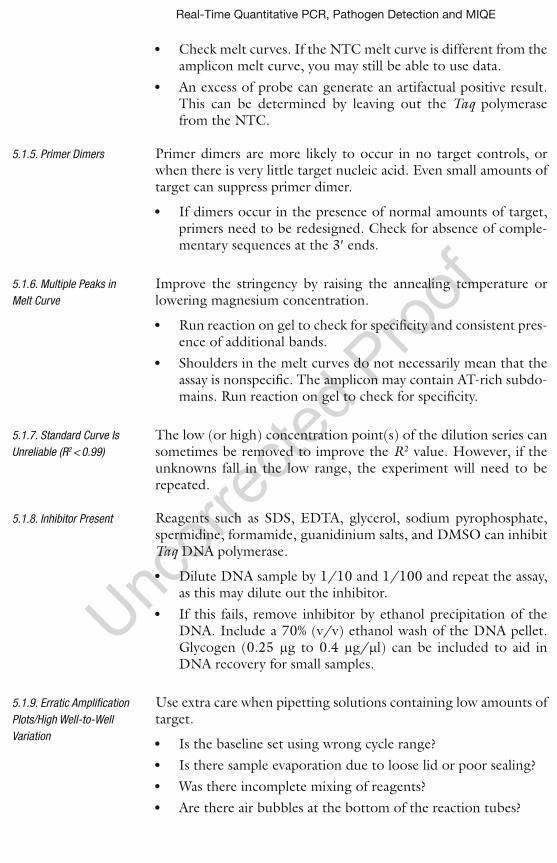
Check melt curves. If the NTC melt curve is different from the amplicon melt curve, you may still be able to use data.An excess of probe can generate an artifactual positive result. This can be determined by leaving out the Taq polymerase from the NTC.
Primer dimers are more likely to occur in no target controls, or when there is very little target nucleic acid. Even small amounts of target can suppress primer dimer.
If dimers occur in the presence of normal amounts of target, primers need to be redesigned. Check for absence of comple-mentary sequences at the 3 ends.
Improve the stringency by raising the annealing temperature or lowering magnesium concentration.
Run reaction on gel to check for specificity and consistent pres-ence of additional bands.Shoulders in the melt curves do not necessarily mean that the assay is nonspecific. The amplicon may contain AT-rich subdo-mains. Run reaction on gel to check for specificity.
The low (or high) concentration point(s) of the dilution series can sometimes be removed to improve the R2 value. However, if the unknowns fall in the low range, the experiment will need to be repeated.
Reagents such as SDS, EDTA, glycerol, sodium pyrophosphate, spermidine, formamide, guanidinium salts, and DMSO can inhibit Taq DNA polymerase.
Dilute DNA sample by 1/10 and 1/100 and repeat the assay, as this may dilute out the inhibitor.If this fails, remove inhibitor by ethanol precipitation of the DNA. Include a 70% (v/v) ethanol wash of the DNA pellet. Glycogen (0.25 g to 0.4 g/ l) can be included to aid in DNA recovery for small samples.
Use extra care when pipetting solutions containing low amounts of target.
Is the baseline set using wrong cycle range?Is there sample evaporation due to loose lid or poor sealing?Was there incomplete mixing of reagents?Are there air bubbles at the bottom of the reaction tubes?
5.1.5. Primer Dimers
5.1.6. Multiple Peaks in Melt Curve
5.1.7. Standard Curve Is Unreliable (R2 < 0.99)
5.1.8. Inhibitor Present
5.1.9. Erratic Amplification Plots/High Well-to-Well Variation
516
517
518
519
520
521
522
523
524
525
526
527
528
529
530
531
532
533
534
535
536
537
538
539
540
541
542
543
544
545
546
547
548
549
550
551
552
J. Murphy, T. Nolan, and S.A. Bustin
Were the frozen stocks of target, primers or buffer not completely thawed or mixed when used?Spikes in the signal can be caused by problems with the lamp, misaligned optics or other mechanical and/or electronic issues.
qPCR is a powerful enabling technology that has started to play a central role in clinical diagnostics. However, the combination of ease of use and lack of rigorous standards of practice has resulted in widespread publication of poor data, resulting in inappropriate conclusions. In the context of reliable detection of pathogens in general, and Aspergillus in particular, the major limitation of qPCR is the lack of standardization at every stage of the molecular pro-cess from sample type and processing to interpretation of results. Nonetheless, when optimized, it is extremely sensitive and highly specific (40).
Any solution to the challenge of how to make PCR-based assays more reliable requires both an appreciation and an under-standing of numerous attributes that include statistics, mathemati-cal modeling, technical know-how and a willingness to share this intelligence. MIQE constitutes a reference framework for commu-nication within the research community, instrument, and reagent manufacturers and publishers that promises to deliver guidelines that promote transparency of experiments and confidence in results and conclusions that advance, rather than impede our knowledge.
References
6. Conclusions
1. Bustin SA, Benes V, Nolan T, Pfaffl MW (2005) Quantitative real-time RT-PCR—a perspective. J Mol Endocrinol 34:597–601
2. Morrison T, Hurley J, Garcia J, Yoder K, Katz A, Roberts D, Cho J, Kanigan T, Ilyin SE, Horowitz D, Dixon JM, Brenan CJ (2006) Nanoliter high throughput quantitative PCR. Nucleic Acids Res 34:e123
3. Zhang C, Xing D (2007) Miniaturized PCR chips for nucleic acid amplification and analy-sis: latest advances and future trends. Nucleic Acids Res 35:4223–4237
4. Cho YK, Kim J, Lee Y, Kim YA, Namkoong K, Lim H, Oh KW, Kim S, Han J, Park C, Pak YE, Ki CS, Choi JR, Myeong HK, Ko C (2006) Clinical evaluation of micro-scale chip-based PCR system for rapid detection of hepatitis B virus. Biosens Bioelectron 21: 2161–2169
5. Kaigala GV, Huskins RJ, Preiksaitis J, Pang XL, Pilarski LM, Backhouse CJ (2006) Automated screening using microfluidic chip-based PCR and product detection to assess risk of BK virus-associated nephropathy in renal transplant recipients. Electrophoresis 27:3753–3763
6. Ascioglu S, Rex JH, de Pauw B, Bennett JE, Bille J, Crokaert F, Denning DW, Donnelly JP, Edwards JE, Erjavec Z, Fiere D, Lortholary O, Maertens J, Meis JF, Patterson TF, Ritter J, Selleslag D, Shah PM, Stevens DA, Walsh TJ (2002) Defining opportunistic invasive fungal infections in immunocompromised patients with cancer and hematopoietic stem cell trans-plants: an international consensus. Clin Infect Dis 34:7–14
7. Klingspor L, Loeffler J (2009) Aspergillus PCR formidable challenges and progress. Med Mycol 47(Suppl 1):S241–S247
553
554
555
556
557
558
559
560
561
562
563
564
565
566
567
568
569
570
571
572
573
574
575
576
577
578
579
580
581
582
583
584
585
586
587
588
589
590
591
592
593
594
595
596
597
598
599
600
601
602
603
604
605
606
607
608
609
610
611
612
613
614
615
sabustin
G. Johnson, T. Nolan and S.A. Bustin
Real-Time Quantitative PCR, Pathogen Detection and MIQE
8. Duval SM, Donnelly JP, Barnes R, Löffler J (2008) PCR-based methods with aspergillosis as a model. J Invasive Fungal Infect 2:46–51
9. Perlin DS, Zhao Y (2009) Molecular diagnos-tic platforms for detecting Aspergillus. Med Mycol 47(Suppl 1):S223–S232
10. White PL, Bretagne S, Klingspor L, Melchers WJ, McCulloch E, Schulz B, Finnstrom N, Mengoli C, Barnes RA, Donnelly JP, Loeffler J (2010) Aspergillus PCR: one step closer to stan-dardization. J Clin Microbiol 48:1231–1240
11. Mengoli C, Cruciani M, Barnes RA, Loeffler J, Donnelly JP (2009) Use of PCR for diagnosis of invasive aspergillosis: systematic review and meta-analysis. Lancet Infect Dis 9:89–96
12. Khot PD, Fredricks DN (2009) PCR-based diagnosis of human fungal infections. Expert Rev Anti Infect Ther 7:1201–1221
13. Garson JA, Huggett JF, Bustin SA, Pfaffl MW, Benes V, Vandesompele J, Shipley GL (2009) Unreliable real-time PCR analysis of human endogenous retrovirus-W (HERV-W) RNA expression and DNA copy number in multiple sclerosis. AIDS Res Hum Retroviruses 25:377–378
14. de Vries TJ, Fourkour A, Punt CJ, van de Locht LT, Wobbes T, van den BS, de Rooji MJ, Mensink EJ, Ruiter DJ, van Muijen GN (1999) Reproducibility of detection of tyrosi-nase and MART-1 transcripts in the peripheral blood of melanoma patients: a quality control study using real-time quantitative RT-PCR. Br J Cancer 80:883–891
15. Peccoud J, Jacob C (1996) Theoretical uncer-tainty of measurements using quantitative poly-merase chain reaction. Biophys J 71:101–108
16. Afzal MA, Osterhaus AD, Cosby SL, Jin L, Beeler J, Takeuchi K, Kawashima H (2003) Comparative evaluation of measles virus-specific RT-PCR methods through an interna-tional collaborative study. J Med Virol 70:171–176
17. Niesters HG (2001) Quantitation of viral load using real-time amplification techniques. Methods 25:419–429
18. Niesters HG (2004) Molecular and diagnostic clinical virology in real time. Clin Microbiol Infect 10:5–11
19. Gabert J, Beillard E, van der Velden VH, Bi W, Grimwade D, Pallisgaard N, Barbany G, Cazzaniga G, Cayuela JM, Cave H, Pane F, Aerts JL, De Micheli D, Thirion X, Pradel V, Gonzalez M, Viehmann S, Malec M, Saglio G, van Dongen JJ (2003) Standardization and quality control studies of ‘real-time’ quantita-tive reverse transcriptase polymerase chain reac-tion of fusion gene transcripts for residual
disease detection in leukemia - a Europe Against Cancer program. Leukemia 17:2318–2357
20. Muller MC, Hordt T, Paschka P, Merx K, La Rosee P, Hehlmann R, Hochhaus A (2004) Standardization of preanalytical factors for min-imal residual disease analysis in chronic myelog-enous leukemia. Acta Haematol 112:30–33
21. Griffiths LJ, Anyim M, Doffman SR, Wilks M, Millar MR, Agrawal SG (2006) Comparison of DNA extraction methods for Aspergillus fumigatus using real-time PCR. J Med Microbiol 55:1187–1191
22. Fredricks DN, Smith C, Meier A (2005) Comparison of six DNA extraction methods for recovery of fungal DNA as assessed by quantitative PCR. J Clin Microbiol 43:5122–5128
23. Bustin SA, Nolan T (2004) Pitfalls of quantita-tive real-time reverse-transcription polymerase chain reaction. J Biomol Tech 15:155–166
24. Kwok S, Higuchi R (1989) Avoiding false pos-itives with PCR. Nature 339:237–238
25. Millon L, Grenouillet F, Crouzet J, Larosa F, Loewert S, Bellanger AP, Deconinck E, Legrand F (2010) False-positive Aspergillus real-time PCR assay due to a nutritional sup-plement in a bone marrow transplant recipient with GVH disease. Med Mycol 48:661–664
26. Monpoeho S, Coste-Burel M, Costa-Mattioli M, Besse B, Chomel JJ, Billaudel S, Ferre V (2002) Application of a real-time polymerase chain reaction with internal positive control for detection and quantification of enterovirus in cerebrospinal fluid. Eur J Clin Microbiol Infect Dis 21:532–536
27. Nolan T, Hands RE, Ogunkolade BW, Bustin SA (2006) SPUD: a qPCR assay for the detec-tion of inhibitors in nucleic acid preparations. Anal Biochem 351:308–310
28. Bustin SA, Benes V, Garson JA, Hellemans J, Huggett J, Kubista M, Mueller R, Nolan T, Pfaffl MW, Shipley GL, Vandesompele J, Wittwer CT (2009) The MIQE guidelines: minimum information for publication of quan-titative real-time PCR experiments. Clin Chem 55:611–622
29. Taylor CF, Field D, Sansone SA, Aerts J, Apweiler R, Ashburner M, Ball CA, Binz PA, Bogue M, Booth T, Brazma A, Brinkman RR, Michael Clark A, Deutsch EW, Fiehn O, Fostel J, Ghazal P, Gibson F, Gray T, Grimes G, Hancock JM, Hardy NW, Hermjakob H, Julian RK Jr, Kane M, Kettner C, Kinsinger C, Kolker E, Kuiper M, Novere NL, Leebens-Mack J, Lewis SE, Lord P, Mallon AM, Marthandan N, Masuya H, McNally R, Mehrle A, Morrison N, Orchard S, Quackenbush J,
616
617
618
619
620
621
622
623
624
625
626
627
628
629
630
631
632
633
634
635
636
637
638
639
640
641
642
643
644
645
646
647
648
649
650
651
652
653
654
655
656
657
658
659
660
661
662
663
664
665
666
667
668
669
670
671
672
673
674
675
676
677
678
679
680
681
682
683
684
685
686
687
688
689
690
691
692
693
694
695
696
697
698
699
700
701
702
703
704
705
706
707
708
709
710
711
712
713
714
715
716
717
718
719
720
721
722
723
724
725
726
727
728
729
J. Murphy, T. Nolan, and S.A. Bustin
Reecy JM, Robertson DG, Rocca-Serra P, Rodriguez H, Rosenfelder H, Santoyo-Lopez J, Scheuermann RH, Schober D, Smith B, Snape J, Stoeckert CJ Jr, Tipton K, Sterk P, Untergasser A, Vandesompele J, Wiemann S (2008) Promoting coherent minimum report-ing guidelines for biological and biomedical investigations: the MIBBI project. Nat Biotechnol 26:889–896
30. Brazma A, Hingamp P, Quackenbush J, Sherlock G, Spellman P, Stoeckert C, Aach J, Ansorge W, Ball CA, Causton HC, Gaasterland T, Glenisson P, Holstege FC, Kim IF, Markowitz V, Matese JC, Parkinson H, Robinson A, Sarkans U, Schulze-Kremer S, Stewart J, Taylor R, Vilo J, Vingron M (2001) Minimum information about a microarray experiment (MIAME)-toward standards for microarray data. Nat Genet 29:365–371
31. Taylor CF, Paton NW, Lilley KS, Binz PA, Julian RK Jr, Jones AR, Zhu W, Apweiler R, Aebersold R, Deutsch EW, Dunn MJ, Heck AJ, Leitner A, Macht M, Mann M, Martens L, Neubert TA, Patterson SD, Ping P, Seymour SL, Souda P, Tsugita A, Vandekerckhove J, Vondriska TM, Whitelegge JP, Wilkins MR, Xenarios I, Yates JR III, Hermjakob H (2007) The minimum infor-mation about a proteomics experiment (MIAPE). Nat Biotechnol 25:887–893
32. Lefever S, Hellemans J, Pattyn F, Przybylski DR, Taylor C, Geurts R, Untergasser A, Vandesompele J (2009) RDML: structured language and reporting guidelines for real-time quantitative PCR data. Nucleic Acids Res 37:2066–2069
33. Hammerle-Fickinger A, Riedmaier I, Becker C, Meyer HH, Pfaffl MW, Ulbrich SE (2010) Validation of extraction methods for total RNA and miRNA from bovine blood prior to quan-titative gene expression analyses. Biotechnol Lett 32(1):35–44
34. Tichopad A, Kitchen R, Riedmaier I, Becker C, Stahlberg A, Kubista M (2009) Design and optimization of reverse-transcription quantita-tive PCR experiments. Clin Chem 55:1816–1823
35. Livak KJ, Schmittgen TD (2001) Analysis of relative gene expression data using real-time quantitative PCR and the 2(-Delta Delta C(T)) Method. Methods 25:402–408
36. Pfaffl MW (2001) A new mathematical model for relative quantification in real-time RT-PCR. Nucleic Acids Res 29:E45
37. Schmittgen TD, Livak KJ (2008) Analyzing real-time PCR data by the comparative C(T) method. Nat Protoc 3:1101–1108
38. Yuan JS, Wang D, Stewart CN Jr (2008) Statistical methods for efficiency adjusted real-time PCR quantification. Biotechnol J 3:112–123
39. Yuan JS, Reed A, Chen F, Stewart CN Jr (2006) Statistical analysis of real-time PCR data. BMC Bioinformatics 7:85
40. Ramirez M, Castro C, Palomares JC, Torres MJ, Aller AI, Ruiz M, Aznar J, Martin-Mazuelos E (2009) Molecular detection and identification of Aspergillus spp. from clinical samples using real-time PCR. Mycoses 52:129–134
730
731
732
733
734
735
736
737
738
739
740
741
742
743
744
745
746
747
748
749
750
751
752
753
754
755
756
757
758
759
760
761
762
763
764
765
766
767
768
769
770
771
772
773
774
775
776
777
778
779
780
781
782
783
784
785
786
787
788
789
790
791
792
793
794
795
796
797
798
sabustin
G. Johnson, T. Nolan and S.A. Bustin