Chapter 1 An Introduction to Economicsfscj-sirius.s3.amazonaws.com/6762/eco2013-e2-ch1.pdf · 2 3...
18
1 CHAPTER 1 An Introduction to Economics
Transcript of Chapter 1 An Introduction to Economicsfscj-sirius.s3.amazonaws.com/6762/eco2013-e2-ch1.pdf · 2 3...

1
Chapter 1
An Introduction to Economics

2
Chapter 1: An Introduction to Economics
3
Assignment Checklist
WhAt you should do: Where? When?
Read the introduction and objectives.
Complete the Economics Vocabulary Tutorial warm-up activity. Use the warm-up activity to complete the definitions.
Use the concept map as a guide while you read the chapter.
Complete the interactive activities.
Complete the chapter quiz.
Participate in the discussion.
Other assignments:
Notes:

2 3
An IntroductIon to economIcs
What types of problems do economists try to solve?Types of Problems
• What is the scientific method?• What is bias ? Give an example.• What are fallacies in logic? Give an example.
Methodology
Explore the six steps in solving a problemProbleM Solving
In economics,• Price is generally graphed on the y-axis• Quantity is generally graphed on the x-axis
graPhing baSicS
Concept Map
Directions: Use the following concept map as a guide while you complete the Economics Vocabulary Tutorial and read the chapter.

4
Chapter 1: An Introduction to Economics
5
Key terms defInItIon
Benefit
Economic Costs
Economics
Goods and Services
Hypothesis
Incentives
Law
Macroeconomics
Margin/Marginal
Marginal Benefit
Marginal Cost
Microeconomics
Model
Normative Statements
Opportunity Cost
Positive Statement(s)
Principle
Rational Choices
Scarcity
Scientific Method
Theory
Key Terms
Directions: Have a copy of this page handy so you can fill in the definitions while completing the Economics Vocabulary Tutorial activity and reading the chapter. Note that not all of the words are in the chapter, so you must complete the tutorial.

4 5
Introduction
You might be a student who delayed taking economics until you absolutely had to. Maybe you heard it’s “really hard” or “really boring”! Both can be true! Much of it depends on the way the material is presented. Hopefully, you’ll find this approach to be interesting and relatively easy to understand.
Economics is the study of how people make decisions that impact their economic well-being. Generally, economics is divided into two main areas: macroeconomics (the focus of this course) and microeconomics.
The prefix macro means “large.” Macroeconomics deals with a broad range of ‘“big picture” topics. These topics range from business cycles to government intervention in an economy to the role of a country’s central bank to the overall economic picture of the country. A course in macroeconomics concentrates on the overall picture of a country’s economy.
Consider the prefix micro and the measurement called a micron (one-millionth, 10 6- ). You’ve probably used a microscope, so you may have already guessed that microeconomics would be about small pieces of the economy. You’re right! Microeconomics generally deals with topics ranging from individual actions to the behavior of various types of firms.
You have many, many years of experience in buying, selling, trading, and making economic decisions. Plus, you’ve probably already had some experience with government interaction in the marketplace–through payroll taxes.
When you were younger, did you ever trade• Food during your lunch at school?• Baseball or football cards? • Household chores?
As an adult, have you ever had to decide• Which make or model of car to purchase/lease? • Whether to rent or buy a home? • Where to go on vacation?
You probably answered positively to one of the questions in the lists above, so you already have some experience in the world of economics. At this point, you simply don’t speak in the same vocabulary as an economist. Economics, like science or psychology or music, has a rather unique language and vocabulary.
For years, you’ve been making small incremental decisions (marginal decisions) about the extent to which you will participate in any given activity. Your decision might be as simple as deciding whether or not to get up and go to class tomorrow. You mentally weigh the benefits of attending class (learning, scholarship, higher future earnings) against the costs of attending (waking up early, not being able to party tonight). Economists say you weigh the marginal costs against the marginal benefits when making decisions. The marginal benefit is the value derived from doing one more activity or buying one more item. The marginal cost is the cost of doing one more activity or buying one more item.
6
Chapter 1: An Introduction to Economics
7
Objectives
After you complete this chapter, you should be able to
• Define key terms• Identify the types of questions/problems economists try to solve• Identify and explain the various components of the methodology of economics, including
identifying bias, fallacies in logic, and the scientific method• Apply, using two variables, basic standard graphing techniques• Construct, using standard economic conventions, a graph with price and quantity data
What Is Economics?
Welcome to your journey into the language and land of economics, Econland. In this land of economics, we study and observe how members of a society interact and behave in buying and selling situations–the marketplace. We’ll also look at how the government sometimes steps into the marketplace.
Economics Vocabulary Tutorial ActivityThe first stop on your journey into Econland is a gym! “A gym?!” Yes, on the first day of training
at a gym, you don’t dive head first into lifting 500 pounds or run on the treadmill for three hours. You start slowly and steadily.
The vocabulary warm-up, located online, is just that type of slow and steady activity. The warm-up activity is a short tutorial that introduces you to economic vocabulary. Any time you see blue underlined text in the tutorial, you will be able to view the definition if you place your cursor over the text. Complete the warm-up activity now, and then return to this chapter.
what tyPes of Problems do economIsts try to solve? Welcome back! Were you surprised to find that you know more about economics than you
thought you did? You just don’t have the vocabulary of an economist–yet! In the warm-up activity, you learned about scarcity–you don’t have everything you’ve
ever wanted because resources are not found in an unlimited amount. Some of the problems economists attempt to solve relate to the question of scarcity. They try to answer the questions who, what, and how.
Who
• Does the producing? • Receives the output of that production? • Receives government assistance/help?

6 7
What
• Should be produced?• Is the appropriate role of government?
How
• Should growth be handled?• Should we deal with poverty and inequality of ability?• Should production be accomplished?
The following are everyday examples of the questions economists try to solve:• Should farmers be paid to idle their fields? • Should the minimum wage be increased? • Should the income tax rates be increased to cover rising Social Security and Medicare outlays? • Should our firm increase production? Should we add another shift? Should our employees
work overtime, or should we hire more staff?
what method do economIsts use to solve Problems?Economists attempt to answer the who, what, and how questions by using the standard
scientific method. The scientific method involves these steps.
1. Ask questions. These questions can be simple or complex; for example, does domestic violence decrease a country’s GDP? Does the budget deficit warrant an increase in the state gas sales tax?
2. Conduct research. The research should be logical and objective. Good research gathers the facts, whether they seem to “fit” or not–it is unbiased.
Biased statements, called normative statements, contain an opinion• This tea is too sweet • The contrast is not sharp enough • The poem is too long
When conducting research, economists avoid normative statements–these may bias the outcome. As you saw in the warm-up activity, positive statements simply announce, without judgment, some data. While normative statements cannot be proven true or false because they reflect personal values, positive statements are those that can be verified or disproved through the scientific method.
A series of positive logical statements don’t always lead to the correct outcome! Consider this series.
A horse has brown eyes. Positive statement
You have brown eyes. Positive statement
Therefore, you are a horse. Positive statement
8
Chapter 1: An Introduction to Economics
9
The first two positive statements are true. However, the last is not. Believing that the last positive statement is true because the first two positive statements in the series are true would be a fallacy in logical thinking.
Are you studying computer programming? If so, you might have recognized the example above as an “and” statement that assigns a value. If both conditions of the “and” statement are met, then the value is assigned.
3. Form a hypothesis. This is simply the researcher’s best guess. A best guess could be right or wrong.
4. Investigate using a method or procedure. The researcher then selects a method to investigate the hypothesis. The investigation should be a methodical process which others can duplicate. The intent of this step is to test the hypothesis.
5. Collect data and make observations. Record the results. What do the results show? What, if anything, went wrong with the experiment?
6. Draw a Conclusion. Why did the experiment turn out the way it did? Was the hypothesis supported? If not, why not? If the hypothesis isn’t supported, the researcher repeats the third step, forming a new hypothesis.
hyPotheses, laws, theorIes, PrIncIPles In the scientific method, the best guess is called a hypothesis. Depending on how the research
turns out, the hypothesis can be supported or shown to be inaccurate. If the data collected during the research step indicates the hypothesis is supported, then it may be true. The next step is for other researchers to attempt to replicate the findings.
If many observations and experiments confirm the hypothesis, it may become a law or a theory. The most significant difference between a law and a theory is degree of complexity.
Laws A law is simple and explains/predicts an event that can be observed and verified. A law often
predicts the consequences of a single act. Examples of laws are the law of gravity, the first law of motion, the law of thermodynamics, and the law of supply and demand.
Theories A theory can contain many different laws. A theory is a large working body of knowledge
that explains verifiable observations. A theory tends to explain inter-related concepts and ideas. A theory never becomes a law, unless it is about a very narrow and concise topic. Examples of theories are music theory, learning theory, the theory of evolution, and the theory of relativity.
Principles A principle is an overarching large body of knowledge composed of hypotheses, laws, and
theories. Examples of principles are the principles of macroeconomics, the principles of general physics, and the principles of democracy.

8 9
Interactive Activities The online portion of your course has several interactive activities that help you practice with
the concepts from this chapter:• Identifying Positive and Normative Statements• Scientific Terms Matching• Scientific Method Matching
Basic Graphing
You may have already browsed through this text and noticed the inclusion of many graphs. Some are fairly simple and straight forward. Others are more complex. A graph is a pictorial representation of data. Graphs are the standard picture that economists use.
Don’t be “scared off” by graphs! The graphs used in this course are fairly simple. You probably have used basic graphing techniques without even realizing you were actually graphing. Have you ever played the Milton Bradley game Battleship or used a spreadsheet? If so, then you know and understand the basic graphing techniques used in this course.
Economists use the standard graphing methods used in mathematics–the Cartesian coordinate system. The y values are plotted on the vertical axis. The x values are plotted on the horizontal axis. Generally, in economics, the “corner” of the graph is the data pair of x = 0 and y = 0.
X
Y
0 1 2 3 4 5 6
6
5
4
3
2
1
10
Chapter 1: An Introduction to Economics
11
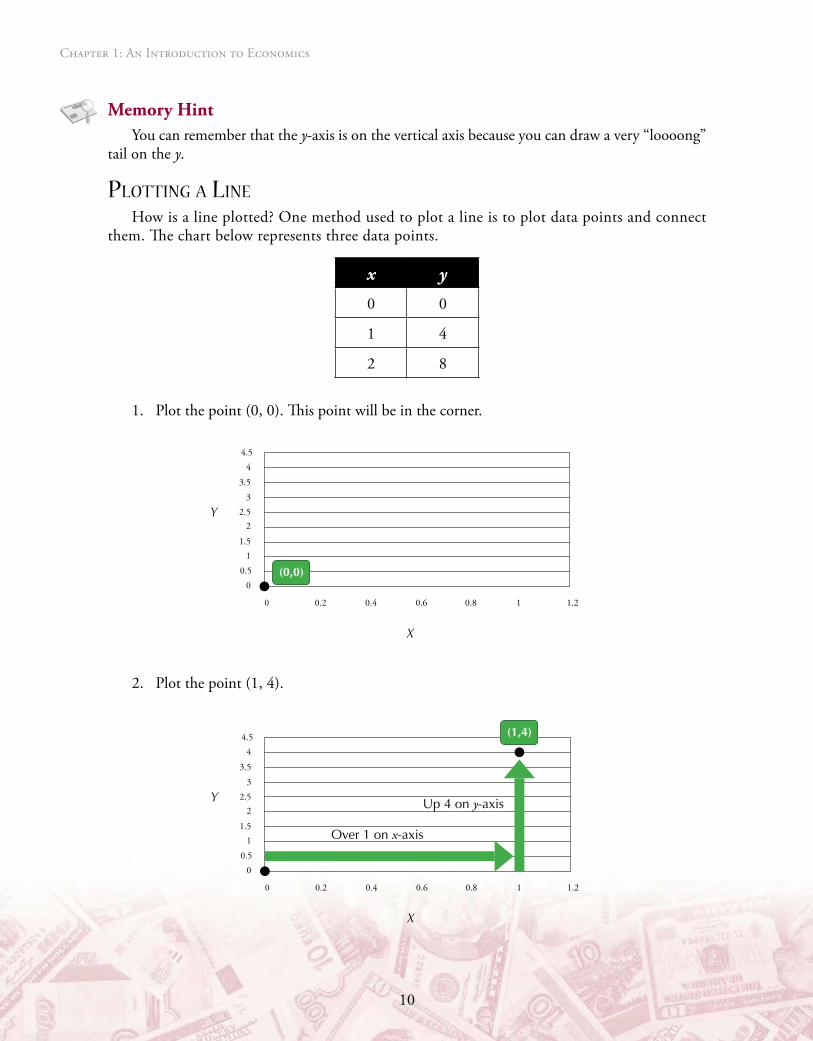
Memory HintYou can remember that the y-axis is on the vertical axis because you can draw a very “loooong”
tail on the y.
PlottIng a lIne
How is a line plotted? One method used to plot a line is to plot data points and connect them. The chart below represents three data points.
x y
0 0
1 4
2 8
1. Plot the point (0, 0). This point will be in the corner.
X
Y
0 0.2 0.4 0.6 0.8 1 1.2
4.54
3.5
3
2.5
1.5
0.5
2
1
0(0,0)
2. Plot the point (1, 4).
X
Y
0 0.2 0.4 0.6 0.8 1 1.2
4.54
3.5
3
2.5
1.5
0.5
2
1
0
Over 1 on x-axis
Up 4 on y-axis
(1,4)
10 11
3. Plot the point (2, 8).
X
Y
0 0.5 1 1.5 2 2.5
98
7
6
5
3
1
4
2
0
(2,8)
Over 2 on x-axis
Up 8 on y-axis
4. Connect the “dots,” or data points.
X
Y
0 0.5 1 1.5 2 2.5
98
7
6
5
3
1
4
2
0
graPhIng economIc data
Graphing economic data uses the standard mathematical conventions shown above. Generally, pricing/cost information is graphed on the vertical axis (y-axis), and quantity information is graphed on the horizontal (x-axis). Graphing economic data in this manner is called standard economic convention.
Memory HintYou can remember that the price data is graphed on the vertical axis because you can draw a
very “loooong” tail on the P.

12
Chapter 1: An Introduction to Economics
13
You can remember that quantity is graphed on the horizontal axis by writing the Q with a “side-ways tail.”
The chart below represents the quantity of pizzas we are willing to buy at various prices.
QuAntIty of pIzzAs We’ll Buy
prIce (In dollArs)
1 $10
3 $8
5 $6
5. Plot the first data point: one pizza at $10.
Quantity
0 0.5 1 1.5 2 2.5 3 3.5
12
10
6
2
8
4
0
(Only 1 pizza purchased if price is $10)
Price ($)
Over 1Up 10
Our Pizza-Buying Habits
6. Plot the next data point: three pizzas desired at $8.
Quantity
0 0.5 1 1.5 2 2.5 3 3.5
12
10
6
2
8
4
0
Price ($)
Over 3
Up 8
Our Pizza-Buying Habits
(3 pizzas purchased if price is $8)
12 13
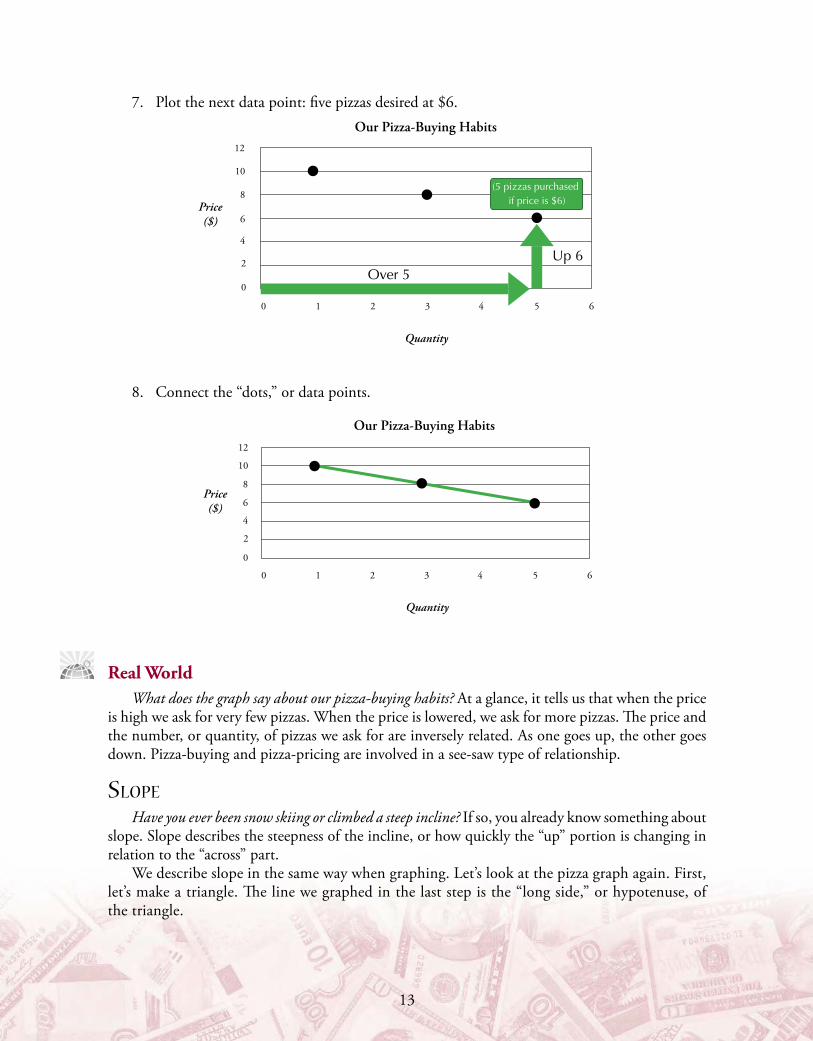
7. Plot the next data point: five pizzas desired at $6.
Quantity
0 1 2 3 4 5 6
12
10
6
2
8
4
0
Price ($)
Over 5Up 6
Our Pizza-Buying Habits
(5 pizzas purchased if price is $6)
8. Connect the “dots,” or data points.
Quantity
0 1 2 3 4 5 6
12
10
8
6
4
0
2
Our Pizza-Buying Habits
Price ($)
Real WorldWhat does the graph say about our pizza-buying habits? At a glance, it tells us that when the price
is high we ask for very few pizzas. When the price is lowered, we ask for more pizzas. The price and the number, or quantity, of pizzas we ask for are inversely related. As one goes up, the other goes down. Pizza-buying and pizza-pricing are involved in a see-saw type of relationship.
sloPe Have you ever been snow skiing or climbed a steep incline? If so, you already know something about
slope. Slope describes the steepness of the incline, or how quickly the “up” portion is changing in relation to the “across” part.
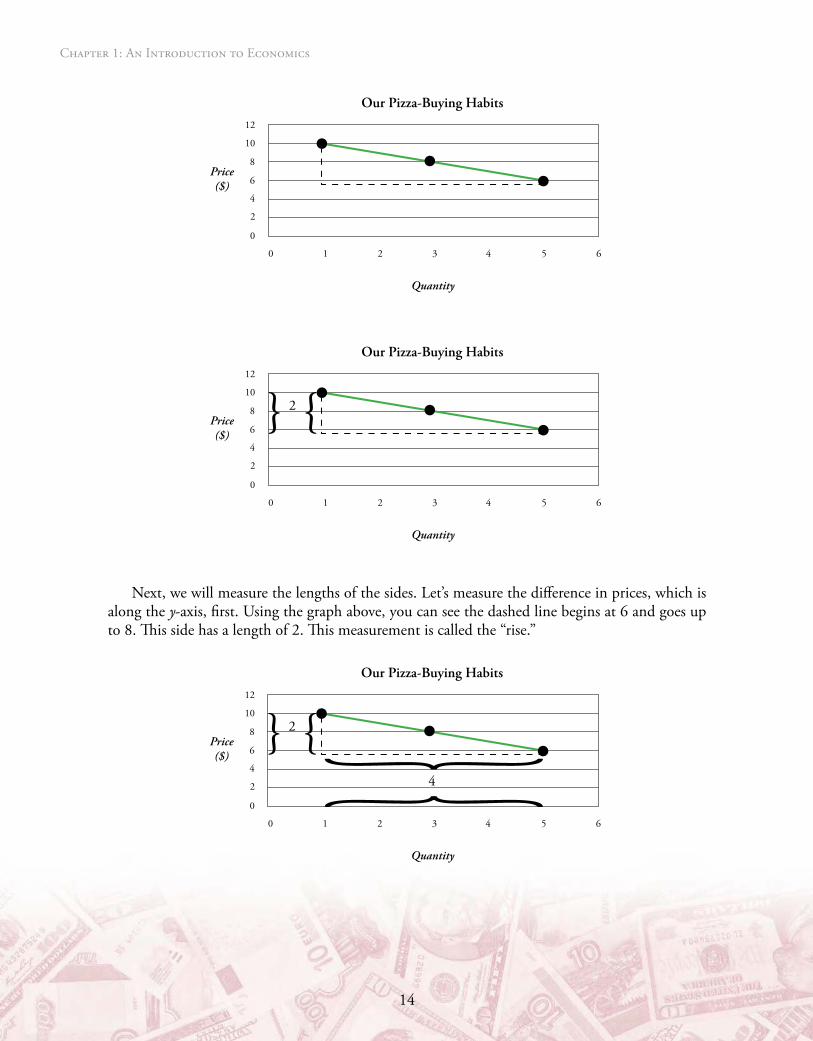
We describe slope in the same way when graphing. Let’s look at the pizza graph again. First, let’s make a triangle. The line we graphed in the last step is the “long side,” or hypotenuse, of the triangle.
14
Chapter 1: An Introduction to Economics
15
Quantity
0 1 2 3 4 5 6
12
10
8
6
4
0
2
Our Pizza-Buying Habits
Price ($)
Quantity
0 1 2 3 4 5 6
12
10
8
6
4
0
2
Our Pizza-Buying Habits
2Price ($)
Next, we will measure the lengths of the sides. Let’s measure the difference in prices, which is along the y-axis, first. Using the graph above, you can see the dashed line begins at 6 and goes up to 8. This side has a length of 2. This measurement is called the “rise.”
Quantity
0 1 2 3 4 5 6
12
10
8
6
4
0
2
Our Pizza-Buying Habits
2
4
Price ($)

14 15
Next, let’s measure the length of the difference in quantities, which is along the x-axis. The line begins at 1 and ends at 5. It has a length of 4. This measurement is called the “run.”
Slope, or steepness, is measured by dividing the rise by the run.
Slope = Rise (Change in y-axis numbers) / Run (Change in x-axis numbers)
In this example,
Slope = Rise / Run = 24
= 12 .
Standard notation would also add a negative sign (-) in front of the 12 . Why? The slope is
“falling,” when viewed from left to right. If the line was “going upward,” when we looked at the slope from left to right, the slope would have a positive sign (+).
Memory HintA tip for remembering the slope formula: rise and run are in alphabetical order in the equation.
Real WorldThe slope of a line tells us how quickly something is changing. Let’s say we were graphing the
price of an imaginary product called Foozles. We will examine how many Foozles people are able and willing to purchase at various prices. This graph is shown below.
Quantity
0 20 40 60 80 100 120
12
10
8
6
4
0
2
Foozles
6
100
Price ($)
Notice how the buyers’ response changed. When the price was $10, people walked away and didn’t want to buy any! Lowering the price to $4 resulted in 100 Foozles being purchased.
Slope = Rise / Run .1006 0 06= - =-

16
Chapter 1: An Introduction to Economics
17
In this example, we graphed the buyers’ response to the change of price of Foozles. In the next example, we’ll graph the producer’s response to the change in price of another imaginary product, Widgets. The graph and the table below show how many Widgets the manufacturer is willing to make at various prices.
Quantity
Price ($)
0 20 40 60 80 100 120
12
10
8
6
4
0
2
Supply of Widgets
2
100
QuAntIty they Are WIllIng to mAKe
prIce (In dollArs)
100 $10
50 $9
0 $8
Slope = Rise / Run .1002 0 02= + =+
Once again, a very strong response, this time by the producer (not the buyer), was caused by a very small change in price. Next, we’ll look at a situation in which the response by consumers to prices changes is not great.
16 17
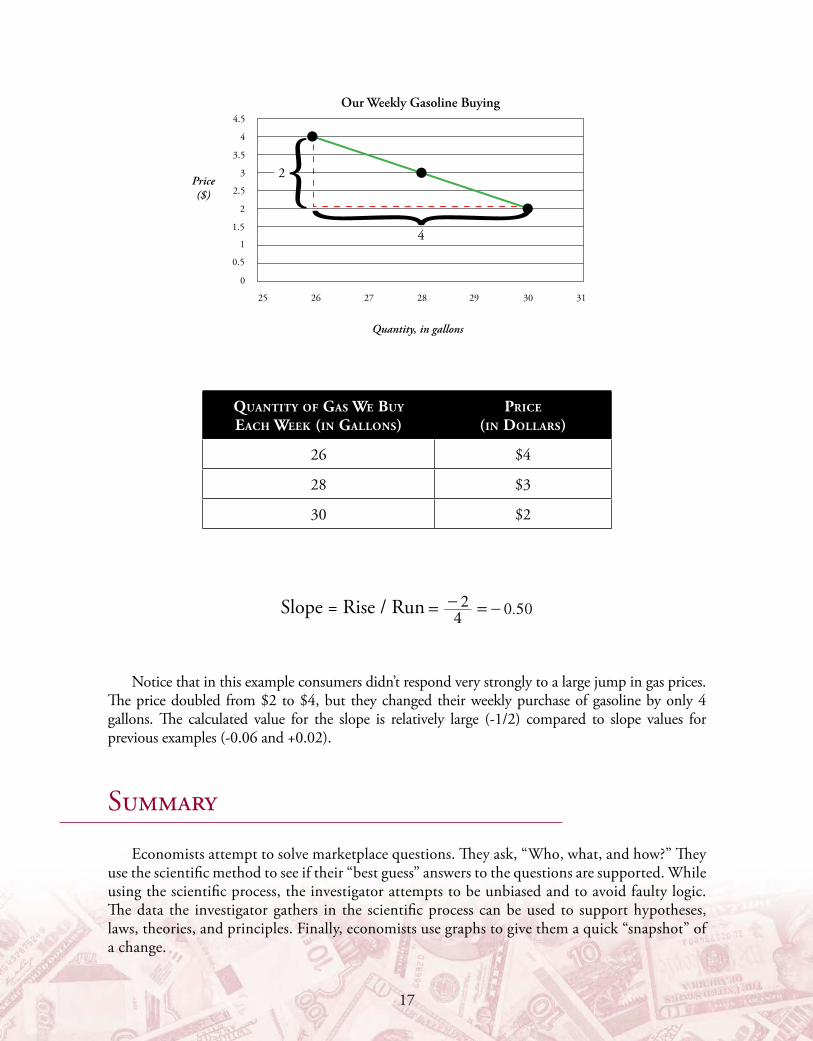
Quantity, in gallons
25 26 27 28 29 30 31
3
3.5
4
4.5
2.5
2
1.5
1
0
0.5
Our Weekly Gasoline Buying
4
2Price ($)
QuAntIty of gAs We Buy eAch WeeK (In gAllons)
prIce (In dollArs)
26 $4
28 $3
30 $2
Slope = Rise / Run .2 0 504
= - =-
Notice that in this example consumers didn’t respond very strongly to a large jump in gas prices. The price doubled from $2 to $4, but they changed their weekly purchase of gasoline by only 4 gallons. The calculated value for the slope is relatively large (-1/2) compared to slope values for previous examples (-0.06 and +0.02).
Summary
Economists attempt to solve marketplace questions. They ask, “Who, what, and how?” They use the scientific method to see if their “best guess” answers to the questions are supported. While using the scientific process, the investigator attempts to be unbiased and to avoid faulty logic. The data the investigator gathers in the scientific process can be used to support hypotheses, laws, theories, and principles. Finally, economists use graphs to give them a quick “snapshot” of a change.

18
Chapter 1: An Introduction to Economics

![PRINCIPLES OF MACROECONOMICSlwoods/ECO2013-82300/ECO2013.… · Web viewA current example is the improving efficiency, and falling prices (costs) of photo-voltaic [PVs] (or ‘solar-’)](https://static.fdocuments.us/doc/165x107/5ec0051de1c67168fc302909/principles-of-macroeconomics-lwoodseco2013-82300eco2013-web-view-a-current.jpg)