CHAPITRE 4. UBIQUITOUS COMPUTING FIELD...
26
CHAPITRE 4. UBIQUITOUS COMPUTING FIELD STUDIES This chapter describes how to plan and conduct a field study, also referred to as an in situ study. Contents 4.1 Introduction 4.2 Three Common Types of Field Studies 4.2.1 Current Behavior 4.2.2 Proof of Concept 4.2.3 Experience Using a Prototype 4.3 Study Design 4.3.1 What Will Participants Do? 4.3.1.1 Control Condition 4.3.2 What Data Will You Collect? 4.3.2.1 Logging 4.3.2.2 Surveys 4.3.2.3 Experience Sampling Methodology 4.3.2.4 Diaries 4.3.2.5 Interviews 4.3.2.6 Unstructured Observation 4.3.3 How Long Is Your Study? 4.4 Participants 4.4.1 Ethical Treatment of Participants 4.4.2 Participant Profile 4.4.3 Number of Participants 4.4.4 Compensation 4.5 Data Analysis 4.5.1 Statistics 4.5.1.1 Descriptive Statistics 4.5.1.2 Inferential Statistics: Significance Tests 4.5.2 Unstructured Data 4.5.2.1 Simple Coding Techniques 4.5.2.2 Deriving Themes and Building Theory 4.6 Steps to a Successful Study 4.6.1 Study Design Tips 4.6.1.1 Have a Clear Research Goal 4.6.1.2 Create a Study Design Document 4.6.1.3 Make Scripts for Participant Visits 4.6.1.4 Pilot Your Study 4.6.2 Technology Tips 4.6.2.1 Make Your Technology Robust Enough 4.6.2.2 Consider Other Evaluation Methods 4.6.2.3 Use Existing Technology 4.6.2.4 Get Reassuring Feedback 4.6.2.5 Negative Results 4.6.3 Running the Study 4.6.3.1 Have a Research Team 4.6.3.2 Make Participants Comfortable 4.6.3.3 Safety 4.6.3.4 Be Flexible 4.6.4 Data Collection and Analysis 4.6.4.1 Be Objective 4.6.4.2 The Participant Is Always Right 4.6.4.3 Do Not Make Inappropriate Claims 4.7 Conclusion References
Transcript of CHAPITRE 4. UBIQUITOUS COMPUTING FIELD...

CHAPITRE 4. UBIQUITOUS COMPUTING FIELD STUDIES
This chapter describes how to plan and conduct a field study, also referred to as an in situ study.
Contents 4.1 Introduction 4.2 Three Common Types of Field Studies
4.2.1 Current Behavior 4.2.2 Proof of Concept
4.2.3 Experience Using a Prototype 4.3 Study Design
4.3.1 What Will Participants Do?
4.3.1.1 Control Condition 4.3.2 What Data Will You Collect?
4.3.2.1 Logging 4.3.2.2 Surveys
4.3.2.3 Experience Sampling Methodology 4.3.2.4 Diaries 4.3.2.5 Interviews
4.3.2.6 Unstructured Observation 4.3.3 How Long Is Your Study? 4.4 Participants 4.4.1 Ethical Treatment of Participants
4.4.2 Participant Profile 4.4.3 Number of Participants 4.4.4 Compensation 4.5 Data Analysis
4.5.1 Statistics 4.5.1.1 Descriptive Statistics 4.5.1.2 Inferential Statistics: Significance Tests
4.5.2 Unstructured Data 4.5.2.1 Simple Coding Techniques 4.5.2.2 Deriving Themes and Building Theory 4.6 Steps to a Successful Study
4.6.1 Study Design Tips 4.6.1.1 Have a Clear Research Goal 4.6.1.2 Create a Study Design Document 4.6.1.3 Make Scripts for Participant Visits
4.6.1.4 Pilot Your Study 4.6.2 Technology Tips 4.6.2.1 Make Your Technology Robust Enough
4.6.2.2 Consider Other Evaluation Methods 4.6.2.3 Use Existing Technology 4.6.2.4 Get Reassuring Feedback 4.6.2.5 Negative Results
4.6.3 Running the Study 4.6.3.1 Have a Research Team 4.6.3.2 Make Participants Comfortable
4.6.3.3 Safety 4.6.3.4 Be Flexible 4.6.4 Data Collection and Analysis 4.6.4.1 Be Objective
4.6.4.2 The Participant Is Always Right 4.6.4.3 Do Not Make Inappropriate Claims 4.7 Conclusion References
4.1 INTRODUCTION Ubiquitous computing (ubicomp) weaves computing into our everyday environments and devices.
People and their use of technology are at the center of this vision, necessitating an understanding both of people’s needs and their reactions to new ubicomp applications and experiences. The field of
human-computer interaction, drawing from other fields including psychology and anthropology, has developed numerous approaches to understanding how people interact with technology. These
methods include user studies, focus groups, ethnography, and heuristic evaluations. Although using a variety of methods to incorporate user needs and feedback throughout the process
of designing technology is critical, this chapter describes how to plan and conduct a field study, also
referred to as an in situ study. Field studies are a particular type of user study conducted outside a research laboratory or controlled environment (i.e., “in the field”). Field studies offer the opportunity
to observe people and their use of technology in the real world, in contrast to a laboratory user study, where participants come into your controlled environment and complete tasks you specify.
As other researchers have argued (e.g., Consolvo et al., 2007; Rogers et al., 2007), field studies are often the most appropriate method for studying people’s use of ubicomp technologies. Studies
conducted in situ allow researchers to collect abundant data about the use of technologies they have developed, observe the unexpected challenges participants may experience, and better understand
how their technology impacts participants’ lives. The trade-off for increased realism is a loss of control over the participant’s experience, so field studies are not appropriate for all evaluations;
indeed, for many research questions, a laboratory study where you have complete control over the environment may be more appropriate. When considering a field study, it is critical to think carefully
about why you want to conduct a study and what you hope to learn from doing one. Field studies require considerable time and effort and should not be undertaken lightly. You should not undertake
a field study because you think it is a requirement to get a paper accepted to a conference or because you would just like to see how people use your ubicomp application, but rather because
your research questions requires it. Field study can be very valuable and even necessary in order to understand user needs or technology usage in a particular domain (e.g., emergency response, homes, etc.) or to evaluate use of a novel ubicomp application more realistically than can be done in a laboratory environment. Approaches to conducting field research in ubicomp draw from many different disciplines and research traditions, each with its own style. This chapter takes a pragmatic approach to field studies and focuses on helping that meets your needs, and introducing data collection and analysis techniques that are commonly used in field studies. You are highly encouraged to read Chapter (Ethnography in Ubicomp), which describes an alternative approach to conducting research in the field. Section 4.2 describes three common types of field studies and introduces examples of each type. Section 4.3 focuses on study design choices, including what your participants will do during the study, what data you will collect, and the length of the study. Section 4.4 outlines considerations around choosing participants for your study and treating them in an ethical manner, whereas Section 4.5 discusses data analysis methods. Section 4.6 outlines pragmatic steps that will help ensure the success of your study. Section 4.7 concludes by emphasizing the value of field studies.
4.2 THREE COMMON TYPES OF FIELD STUDIES The type of study you are conducting and why you a re conducting a study will help you determine
the research question for your study. Examples of research questions include “Is the mobile phone a suitable proxy for the owner’s location?” and “Does context-aware power management have the
potential to save energy?” When designing your study, you will rely on your research question to inform all of the many decisions you need to make, such as what type of participants to recruit, how long the study should be, and what type of data to collect. To craft your research question, think carefully about what you wish to learn by conducting the field study. What questions do you want to
answer? What will your contribution be that will influence the research community or inform others working in this area?
Three common types of ubicomp field studies are Studies of current behavior: What are people doing now?
Proof-of-concept studies: Does my novel technology function in the real world?
Experience using a prototype: How does using my prototype change people’s behavior or allow them to do new things?
Although other types of field studies exist including those exploring playful interaction or ludic engagement with ubicomp technologies (e.g., Gaver et al., 2006, 2007), these three types of studies will be the focus of this chapter. To demonstrate the different choices researchers make when conducting field studies, examples of each type of study were selected from conferences in the area of ubiquitous computing. The examples highlight a range of different approaches and the types of questions used to frame the research. Interested readers are encouraged to consult the papers describing studies in their entirety for studies that are particularly relevant to them. Throughout the rest of the chapter, more details about these examples will be used to illustrate study design, data collection, and data analysis choices. 4.2.1 Current Behavior Understanding how people are making use of technology in their lives today can provide researchers with insights and inspiration. This type of field study explores how people use existing technology. The contributions of this type of study are an understanding of current behavior and implications for future technology. Research questions for studies of this type typically emphasize how people use
technology and may be very openended. The two examples below focus on studies of current behavior with specific research questions that make use of interviews and logging, in contrast to
more open-ended observations traditionally used in ethnography, described in detail in Chapter 5.
Example 1: Home Technology Sharing and Use (Home Technology) Brush and Inkpen (2007) conducted an interview study of 15 families in the United States that
examined the types of technologies families own, including TV, music players, phones, and computers; where they are situated within the home; and the degree of shared ownership and use.
During the visit, the participants were interviewed, sketched the layout of technology in their homes, and gave the researchers a tour of their homes focusing on where computers were located.
Research Question: How do families use and share technology in their homes?
Example 2: Proximity of Users to Their Mobile Phones (Phone Proximity)
Patel et al. (2002) used logging on cell phones and interviews to study the proximity of 16 people to their cell phones over a 3-week period. During the study, participants wore a small Bluetooth beacon,
used phones with logging software, and participated in weekly interviews.
Research Question: Is the mobile phone a suitable proxy for the owner’s location? What type of
information (e.g., cell ID, date, and time) are the best predictors for how close the owner is to the phone?
Other examples of studies on current behavior are Sohn et al.’s (2008) diary study on mobile
information needs and Woodruff et al.’s (2007) study on the use of laptops in homes.
4.2.2 Proof of Concept Ubiquitous computing projects often develop novel technology or seek to validate new algorithms
and approaches. For this type of study, technological advance is the primary contribution of research rather than field study. However, it may be important to conduct a field study to validate the
feasibility of an approach or prototype in a real-world environment. These field studies may be shorter than the other two types and the research questions generally focus on whether the
prototype or algorithm functions appropriately in a real environment.
Example 3: Context-Aware Power Management (CAPM)
Harris and Cahill (2007) conducted a 5-day field study of 18 participants to investigate the potential for using context information to improve power management on personal computers (PCs). The
computers of participants were augmented with logging software that asked after a minute of idle time if they were using the PC and sensors that included web cameras, microphones, and ultrasonic
object range sensors. Participants also carried a Bluetooth tag on their key chains to provide additional location information.
Research Questions: Does CAPM have the potential to save energy? How accurately can it be inferred
that the user is not using the device or about to use it?
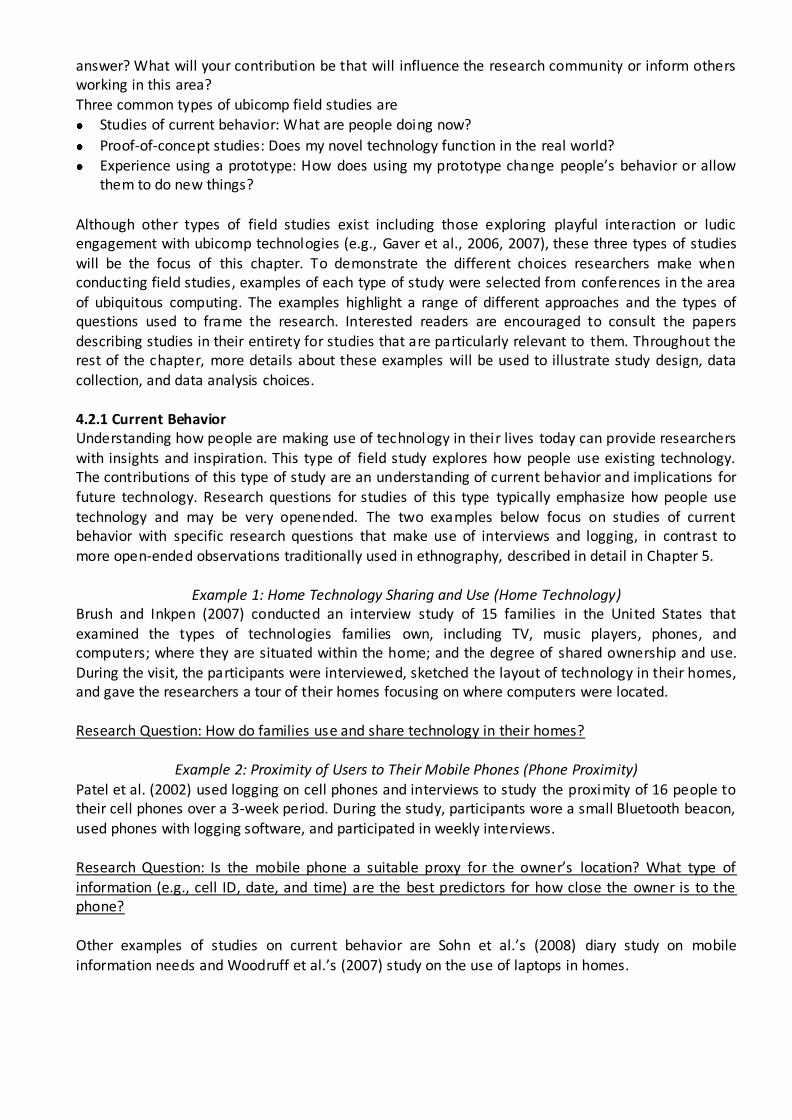
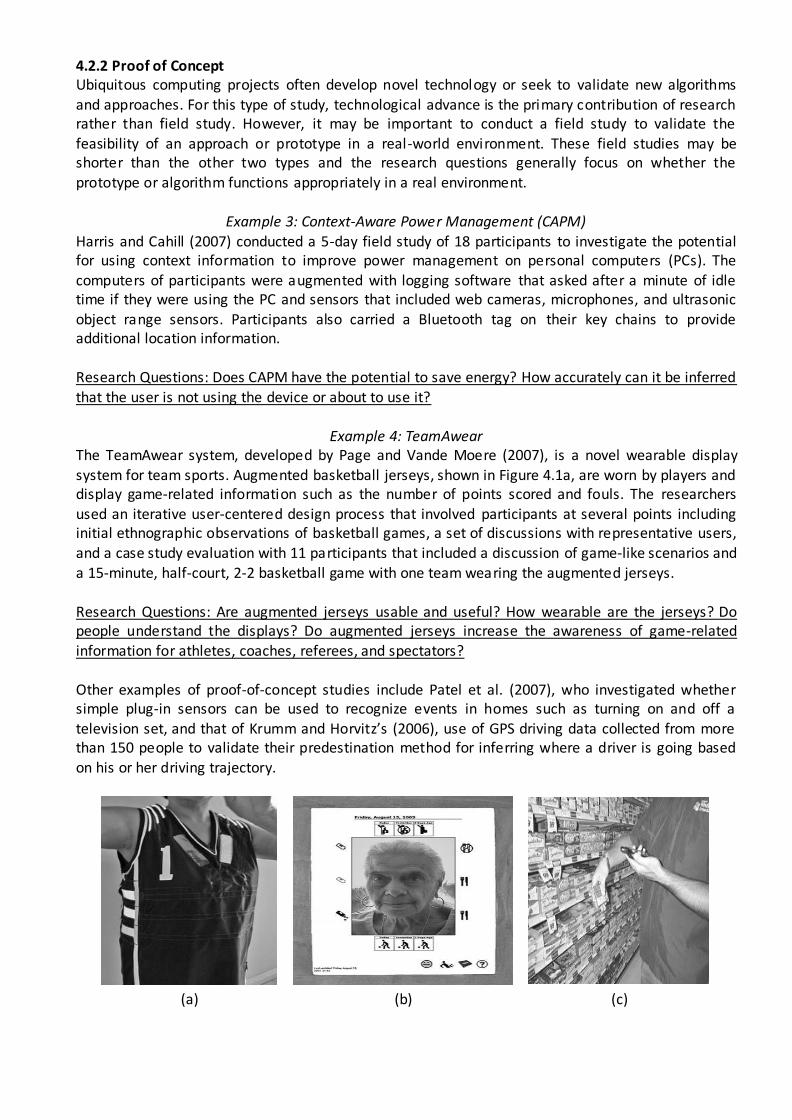
Example 4: TeamAwear The TeamAwear system, developed by Page and Vande Moere (2007), is a novel wearable display
system for team sports. Augmented basketball jerseys, shown in Figure 4.1a, are worn by players and display game-related information such as the number of points scored and fouls. The researchers
used an iterative user-centered design process that involved participants at several points including initial ethnographic observations of basketball games, a set of discussions with representative users,
and a case study evaluation with 11 participants that included a discussion of game-like scenarios and a 15-minute, half-court, 2-2 basketball game with one team wearing the augmented jerseys. Research Questions: Are augmented jerseys usable and useful? How wearable are the jerseys? Do people understand the displays? Do augmented jerseys increase the awareness of game-related information for athletes, coaches, referees, and spectators? Other examples of proof-of-concept studies include Patel et al. (2007), who investigated whether simple plug-in sensors can be used to recognize events in homes such as turning on and off a television set, and that of Krumm and Horvitz’s (2006), use of GPS driving data collected from more than 150 people to validate their predestination method for inferring where a driver is going based on his or her driving trajectory.
(a) (b) (c)
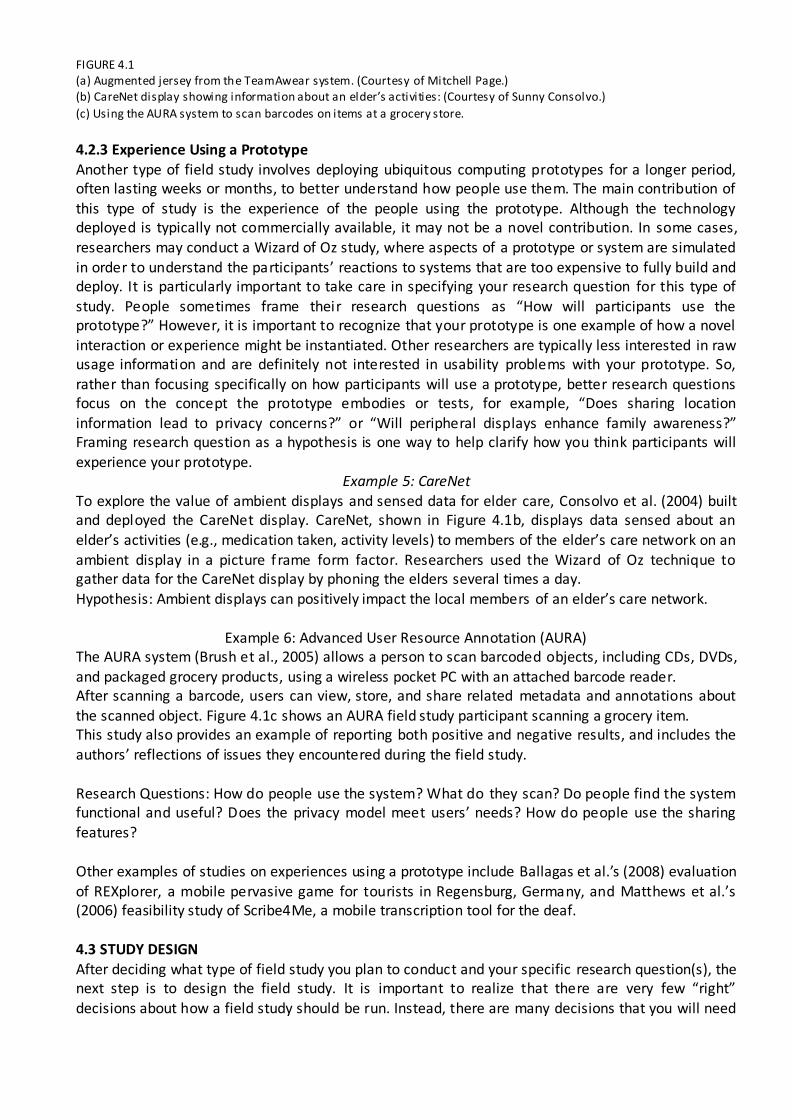
FIGURE 4.1 (a) Augmented jersey from the TeamAwear system. (Courtesy of Mitchell Page.) (b) CareNet display showing information about an elder’s activities: (Courtesy of Sunny Consolvo.)
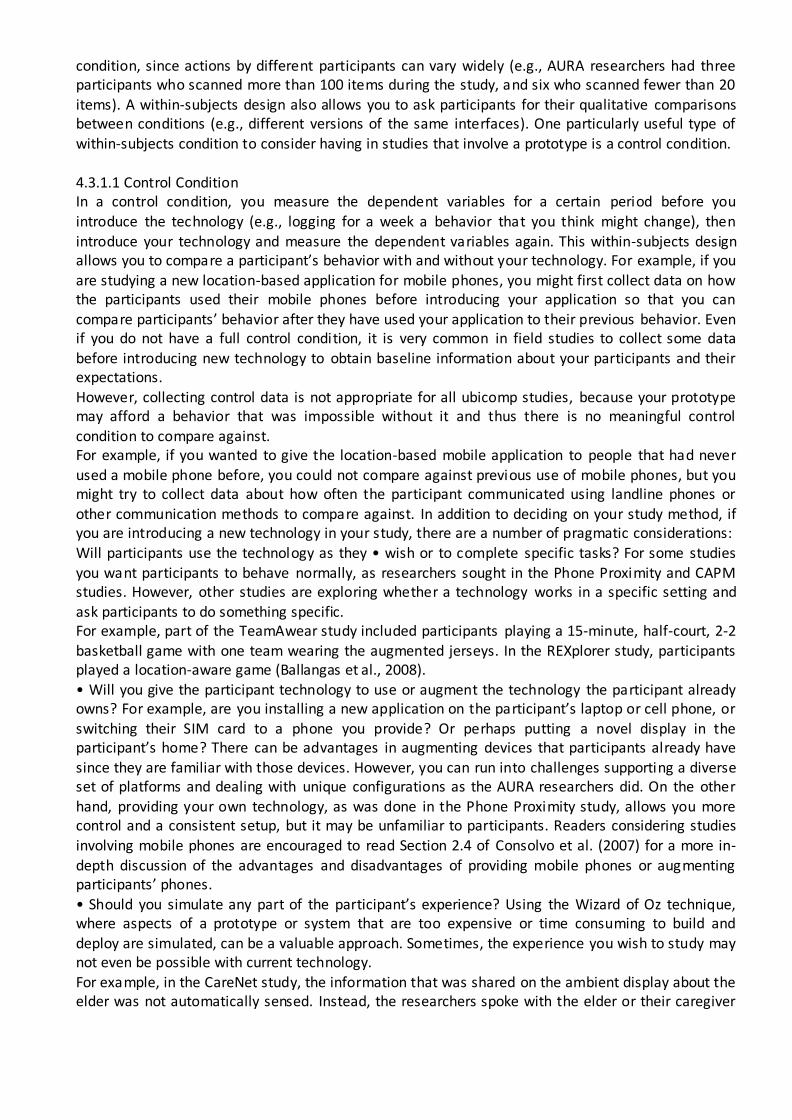
(c) Using the AURA system to scan barcodes on items at a grocery store.
4.2.3 Experience Using a Prototype
Another type of field study involves deploying ubiquitous computing prototypes for a longer period, often lasting weeks or months, to better understand how people use them. The main contribution of
this type of study is the experience of the people using the prototype. Although the technology deployed is typically not commercially available, it may not be a novel contribution. In some cases,
researchers may conduct a Wizard of Oz study, where aspects of a prototype or system are simulated in order to understand the participants’ reactions to systems that are too expensive to fully build and deploy. It is particularly important to take care in specifying your research question for this type of study. People sometimes frame their research questions as “How will participants use the prototype?” However, it is important to recognize that your prototype is one example of how a novel interaction or experience might be instantiated. Other researchers are typically less interested in raw usage information and are definitely not interested in usability problems with your prototype. So, rather than focusing specifically on how participants will use a prototype, better research questions focus on the concept the prototype embodies or tests, for example, “Does sharing location information lead to privacy concerns?” or “Will peripheral displays enhance family awareness?” Framing research question as a hypothesis is one way to help clarify how you think participants will experience your prototype.
Example 5: CareNet To explore the value of ambient displays and sensed data for elder care, Consolvo et al. (2004) built and deployed the CareNet display. CareNet, shown in Figure 4.1b, displays data sensed about an elder’s activities (e.g., medication taken, activity levels) to members of the elder’s care network on an
ambient display in a picture f rame form factor. Researchers used the Wizard of Oz technique to gather data for the CareNet display by phoning the elders several times a day.
Hypothesis: Ambient displays can positively impact the local members of an elder’s care network.
Example 6: Advanced User Resource Annotation (AURA) The AURA system (Brush et al., 2005) allows a person to scan barcoded objects, including CDs, DVDs,
and packaged grocery products, using a wireless pocket PC with an attached barcode reader. After scanning a barcode, users can view, store, and share related metadata and annotations about
the scanned object. Figure 4.1c shows an AURA field study participant scanning a grocery item. This study also provides an example of reporting both positive and negative results, and includes the authors’ reflections of issues they encountered during the field study. Research Questions: How do people use the system? What do they scan? Do people find the system functional and useful? Does the privacy model meet users’ needs? How do people use the sharing features? Other examples of studies on experiences using a prototype include Ballagas et al.’s (2008) evaluation
of REXplorer, a mobile pervasive game for tourists in Regensburg, Germany, and Matthews et al.’s (2006) feasibility study of Scribe4Me, a mobile transcription tool for the deaf.
4.3 STUDY DESIGN
After deciding what type of field study you plan to conduct and your specific research question(s), the next step is to design the field study. It is important to realize that there are very few “right”
decisions about how a field study should be run. Instead, there are many decisions that you will need

to justify to yourself and your audience (e.g., other researchers, reviewers, funding agencies, etc.) as appropriate and sensible in order to gather the data needed to address your research question. In
determining your study design, the three important questions to consider are What will your participants do during the study?
What data will you collect?
How long will the study be?
4.3.1 What Will Participants Do? In planning your field study, you need to decide what you will ask participants to do during the study. What participants do clearly depends on the type of field study and your research question. To study current behavior, you might interview participants or log their behavior, whereas in other studies participants typically use a prototype. Given that field studies are a choice to sacrifice control of the participant’s experience for realism, experimental design techniques used in laboratory studies are typically less appropriate for a field study. However, having a high-level understanding of how experimental laboratory studies are designed can help you think about how your field study should be structured. This is particularly relevant when your study involves giving the participants new technology and understanding their experience. In traditional laboratory studies, researchers specify a hypothesis based on a research question and then gather data through the study to support or reject the hypothesis. To test the hypothesis, researchers identify a variable, called the independent variable, that they will vary between different values, called conditions, during the experiment in order to understand the effect of variation on the dependent variables they are measuring (e.g., task time or user preference). The two main laboratory
study designs are within subjects and between-subjects. In a within-subjects design, also called repeated-measures design, each participant experiences all conditions. So, if your independent
variable was versions of an interface and you have two versions (A and B), in a within-subjects study each participant would use both versions. Within-subject designs offer the advantage that your
dependent variables can include asking participants to directly compare different conditions. For example, you can ask participants whether they preferred version A or version B of your interface.
You can also directly compare any numeric data you collect, such as number of times the participant used the interface, for the same participant across conditions. However, in withinsubject designs you
need to worry about whether there will be any learning effects. For example, participants might favor version B or be faster in using it just because it was the second version they used. Counterbalancing
or varying the order that different participants experience the conditions is used to mitigate any potential learning effects.
In a between-subjects design, you divide your participants into different groups, typically randomly, and each participant experiences only one condition of the independent variable. So half of your
participants would use version A of the interface and the other half would use version B. This approach avoids any potential learning effects, but you generally need to have more participants
because you cannot directly compare the behavior of a single user across the conditions. Finally,
some studies use a mixed design where some independent variables are within-subjects and someare between-subjects. Section 14.4 in the work of Preece et al. (2002) has more information on
experimental design. In choosing to conduct a field study instead of a laboratory study, you are emphasizing studying
people’s behavior or use of your prototype in the real world. This makes it impossible to control the environment to the extent that you can have confidence that any one independent variable (or set of
independent variables) that you choose to vary is the only thing causing changes in the dependent variables. For this reason, using a withinsubject design is preferred for studies with conditions so that
you can compare the participants’ behavior in one condition against their behavior in another
condition, since actions by different participants can vary widely (e.g., AURA researchers had three participants who scanned more than 100 items during the study, and six who scanned fewer than 20
items). A within-subjects design also allows you to ask participants for their qualitative comparisons between conditions (e.g., different versions of the same interfaces). One particularly useful type of
within-subjects condition to consider having in studies that involve a prototype is a control condition.
4.3.1.1 Control Condition In a control condition, you measure the dependent variables for a certain period before you
introduce the technology (e.g., logging for a week a behavior that you think might change), then
introduce your technology and measure the dependent variables again. This within-subjects design allows you to compare a participant’s behavior with and without your technology. For example, if you
are studying a new location-based application for mobile phones, you might first collect data on how the participants used their mobile phones before introducing your application so that you can
compare participants’ behavior after they have used your application to their previous behavior. Even if you do not have a full control condition, it is very common in field studies to collect some data
before introducing new technology to obtain baseline information about your participants and their expectations.
However, collecting control data is not appropriate for all ubicomp studies, because your prototype may afford a behavior that was impossible without it and thus there is no meaningful control
condition to compare against. For example, if you wanted to give the location-based mobile application to people that had never
used a mobile phone before, you could not compare against previous use of mobile phones, but you might try to collect data about how often the participant communicated using landline phones or
other communication methods to compare against. In addition to deciding on your study method, if you are introducing a new technology in your study, there are a number of pragmatic considerations:
Will participants use the technology as they • wish or to complete specific tasks? For some studies you want participants to behave normally, as researchers sought in the Phone Proximity and CAPM studies. However, other studies are exploring whether a technology works in a specific setting and ask participants to do something specific. For example, part of the TeamAwear study included participants playing a 15-minute, half-court, 2-2 basketball game with one team wearing the augmented jerseys. In the REXplorer study, participants played a location-aware game (Ballangas et al., 2008). • Will you give the participant technology to use or augment the technology the participant already owns? For example, are you installing a new application on the participant’s laptop or cell phone, or switching their SIM card to a phone you provide? Or perhaps putting a novel display in the participant’s home? There can be advantages in augmenting devices that participants already have since they are familiar with those devices. However, you can run into challenges supporting a diverse set of platforms and dealing with unique configurations as the AURA researchers did. On the other hand, providing your own technology, as was done in the Phone Proximity study, allows you more control and a consistent setup, but it may be unfamiliar to participants. Readers considering studies involving mobile phones are encouraged to read Section 2.4 of Consolvo et al. (2007) for a more in-
depth discussion of the advantages and disadvantages of providing mobile phones or augmenting participants’ phones.
• Should you simulate any part of the participant’s experience? Using the Wizard of Oz technique, where aspects of a prototype or system that are too expensive or time consuming to build and
deploy are simulated, can be a valuable approach. Sometimes, the experience you wish to study may not even be possible with current technology. For example, in the CareNet study, the information that was shared on the ambient display about the elder was not automatically sensed. Instead, the researchers spoke with the elder or their caregiver

multiple times a day and then manually updated the data shown onthe ambient display. In a feasibility study of the Scribe4Me system (Mathews et al., 2006), human transcribers were used to
transcribe audio recorded on the mobile phone.
4.3.2 What Data Will You Collect? During a field study, you can collect quantitative and qualitative data.
Quantitative data can be objectively observed and represented numerically (e.g., timing, errors, usage) and can help you understand what happened during the study. For example, how many times
a participant used your prototype or how long they used it. On the other hand, qualitative data
include a participant’s unstructured feedback and reactions as well as field observations you make. Qualitative data help you understand what people think and hopefully why people behaved in certain
ways during the study. For field studies, it is valuable to collect both quantitative and qualitative data. If you collect only
quantitative data you have insight into how people behaved, but may have trouble understanding why. If you collect only qualitative data you will have insight into why participants did certain things,
but may have trouble comparing participants or understanding how closely what participants thought they did mapped to what they really did. When considering what specific questions to ask
during data collection, first return to your research question. However, it may also be helpful to look at evaluation metrics used by others doing related research. Scholtz and Consolvo (2004) put forth an
evaluation framework for ubicomp applications that proposes the evaluation areas of attention, adoption, trust, conceptual models, interaction, invisibility, impact and side effects, appeal, and
application robustness. The definitions and metrics they provide in their paper may give you ideas for your study.
It is obviously impossible to include everything you need to know about data collection methods in one short subsection; instead, different data collection techniques will be introduced with a focus on
their use in ubicomp field studies. During your study you will likely use more than one of these methods to gather data. In general, you probably want to collect demographic data about your participants, usage data that tell you about their current behavior or how they use your prototype, and reactions to any technology you have introduced. Finally, no matter what data collection methods you choose for your study, you must pilot them before the study starts to make sure that you are collecting the data you need and that you know how you will analyze the data. For surveys, this means asking colleagues to take them, for logging it means generating logs and checking data generated by yourself or colleagues. If at all possible, conduct a full pilot of your study design with “friendly” participants (e.g., coworkers, friends) before deploying to your participants in order to find as many problems as possible with the study design and prototypes in advance. The rest of this section introduces different methods for collecting data. 4.3.2.1 Logging In field studies, logging is often the main method for collecting quantitative data about usage, either of existing technology or your novel technology. When logging data, your prototype typically writes
information to a data file when things occur that you want to know about. For example, both the Phone Proximity and CAPM studies logged data from many different sensors to collect a data set on
which researchers could do machine learning. The AURA study used logging to determine what objects participants scanned and when they uploaded them to the server to share.
Considerations for logging: How will you use the logged data? Although logging • is an incredibly useful tool, you must have a plan about how you will use the data you are logging. Too often people are tempted to try to log everything with the notion that they will figure out after the study how to analyze it. This is a recipe
for an analysis nightmare as you struggle to abstract out the meaningful information in the log from the noise.
• Have you forgotten to log something important? Make a list of specific questions that you expect to answer from the log data. For each question, identify the events you are logging that you will use to
answer the question and then walk through the analysis using data from your own use or a pilot study. Make sure that the data you are logging will answer the questions you expect it to.
• Will your logging help you know if the study is going smoothly? Another valuable use of logging data is for reassurance that the technology is operating as expected.
If logging data are collected on a central server (e.g., instead of the device), the presence of data can
reassure you that nothing disastrous has happened or warn you that you may need to intervene to avoid the devastating discovery that your field study needs to be rerun because of a technical
problem. This feedback is so valuable that you should consider having your technology “phone home” with an
“I’m ok” message at regular intervals even if logging data are stored locally to a device.
4.3.2.2 Surveys Surveys are often used to gather data before a field study begins (presurvey), after any changes of
condition in a between-subjects study (postcondition), and at the end of the study (postsurvey). In a longer field study, they may also be used at regular intervals (e.g., a weekly survey) to measure how a
participant’s reactions might be changing. The AURA study had pre- and postsurveys, the CareNet study had a midpoint survey and postsurvey, and participants in the TeamAwear study were surveyed
after they played basketball. Common types of survey questions are open-ended questions, multiple choice questions, and Likert questions. Open-ended questions ask participants to enter free text
answers. In a multiple choice question, participants are given several options to choose from, for example, “Did you like A, B, or C better?” or participants might be asked to select all options that
apply. Likert questions are statements that participants are asked to agree or disagree with. For example, “I like chocolate ice cream” with the option to select Strongly Agree, Agree, Neutral, Disagree, or Strongly Disagree. Likert questions with five possible answers are very common; although sometimes a larger scale (e.g., seven or nine answers) is used. The AURA study includes examples of several Likert scale questions participants were asked. See Section 13.3 of Preece et al. (2002) for more information about designing surveys. Below are several factors to consider when creating your survey questions.
Are the questions stated to allow both positive and • negative responses? For example, “How much do you love the prototype: a little, a lot, an immense amount” is a leading question with bad options. Instead, you might ask a Likert question: “The prototype was easy to use” with options ranging from Strongly Agree to Strongly Disagree.
Are the questions clear to others? Pilot your survey with colleagues to make sure the questions are clear to them. Watch out for “and” questions. If you ask “The prototype was fun and easy to use,” you will not know if participants were answering about the prototype being fun or easy to use.
Will the questions obtain the information needed from participants? Review your research
questions and make sure the survey contains all the questions you need. Collecting pilot data and formally writing them up to present to others can help ensure that you are collecting all
the data you need to answer your research questions.
Is the survey appropriate in length? Be careful not to make your survey too long; there can be
a tendency to include every possible question you can think of on a survey. This can cause participants to get tired and frustrated with your survey. Make sure your survey contains only
questions that really matter.
Have you looked for questions that others have used? Although each field study is unique, it is worth looking at papers for projects related to yours to see if there are any survey questions
that you should adopt for your study or if standard surveys such as the Questionnaire for User Interaction Satisfaction (http//lap.umd.edu/ quis) or scales from psychology such as the
National Aeronautics Space Administration Task Load Index [NASA TLX] may be appropriate. Sadly, the text of survey questions is not often included in research papers; however, other
researchers are often willing to share their survey questions if you contact them. This may allow for some comparison between field studies if appropriate.
4.3.2.3 Experience Sampling Methodology Ubicomp researchers have long recognized the value of using experience sampling methodology (ESM), a technique borrowed from psychology, for field studies (e.g., Consolvo and Walker, 2003). In ESM, participants are asked to fill out short questionnaires at various points throughout their day, asking about their experience at that time. ESM allows the researcher to collect qualitative data throughout the study, which has advantages over asking participants later to try to recall what they
were thinking or feeling, or why they took some action. Participants can be asked to complete a survey either randomly throughout the day, at scheduled times, or based on an event.
For example, in the AURA field study, researchers used event-based ESM and asked participants a few questions about the object they had scanned after every fifth item they scanned. In CAPM, the
computer queried the user after 60 seconds of idle time if they were using the device. Although it is most often used to gather qualitative data, you can also use ESM to gather quantitative data based
on events, for example, recording the location of a participant every time he or she answers a call on their mobile phone.
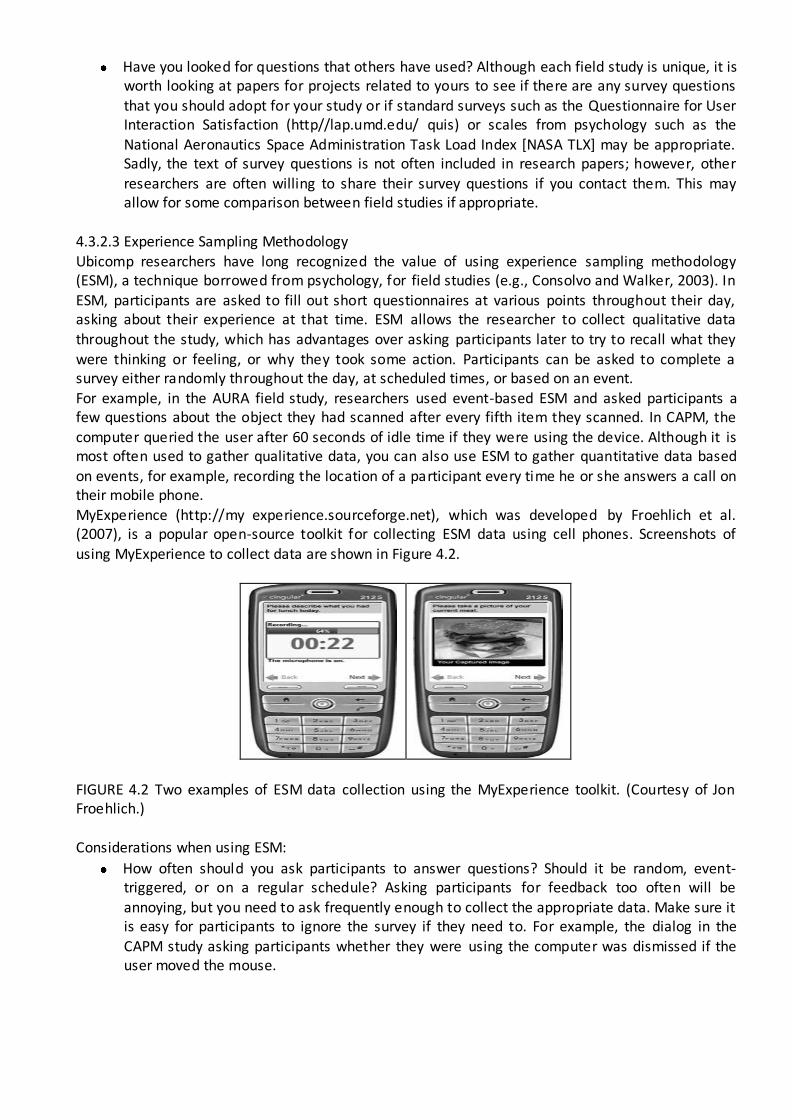
MyExperience (http://my experience.sourceforge.net), which was developed by Froehlich et al. (2007), is a popular open-source toolkit for collecting ESM data using cell phones. Screenshots of
using MyExperience to collect data are shown in Figure 4.2.
FIGURE 4.2 Two examples of ESM data collection using the MyExperience toolkit. (Courtesy of Jon Froehlich.)
Considerations when using ESM:
How often should you ask participants to answer questions? Should it be random, event-triggered, or on a regular schedule? Asking participants for feedback too often will be annoying, but you need to ask frequently enough to collect the appropriate data. Make sure it is easy for participants to ignore the survey if they need to. For example, the dialog in the
CAPM study asking participants whether they were using the computer was dismissed if the user moved the mouse.

How many questions will you ask on each survey? Try to keep the number of questions very small and quick to answer. One way to compensate for each survey being short is to ask
different sets of questions at different times. Do you want to collect sensor data using ESM techniques? Are there quantitative data that
you want to collect randomly throughout the day, at a scheduled time, or based on a particular event?
4.3.2.4 Diaries Similar in spirit to ESM, some studies gather data by asking participants to record information about what they do, typically referred to as a “diary.”This method is frequently used when participants are making diary entries about something that would not be possible to sense using an ESM tool, thereby rendering event-based ESM inappropriate. For example, asking a participant to track when he wants to do something or feels a certain emotion. In some studies, participants are given small paper notebooks to carry around, whereas other researchers have used mobile technology for recording diary entries. In Sohn et al.’s study of mobile information needs, participants used short message service (SMS) to make entries and then added details at a Web site (Sohn et al., 2008). Many of the considerations for diary studies are similar to those for ESM, such as what you will ask your participant to record in each diary entry. However, for diary studies there are typically greater concerns about participation, because participants are typically not carrying a device that interrupts
them as in an ESM study. Another option is asking participant to retrospectively construct a diary, as the Phone Proximity study had participants do at the weekly interview for the previous day using the
Day Reconstruction Method (Kahneman et al., 2004).
Considerations: How will you remind participants to complete • their diary entries? Will you email them daily?
Call them occasionally or send SMSs? How will you incent participants to complete their diary entries? Will you reward them per
entry, which can cause people to generate extra entries to earn money or perhaps with a set amount of money for each day of participation?
4.3.2.5 Interviews
Interviewing your participants can be an excellent way to gather qualitative data. During field studies, researchers frequently conduct “semistructured interviews.” In a semistructured interview you bring
a list of specific questions, but ask follow-up questions about interesting things that participants say in addition to the predefined questions. Interviews were the main method used in the Home
Technology study, and also in Phone Proximity, TeamAwear, AURA, and CareNet studies. Researchers also sometimes bring data collected earlier in the study, perhaps through logging or ESM, to show to
participants in order to help them remember particular events that the researchers want to ask questions about. For example, in the Phone Proximity interviews researchers compared thediary data
generated by the participant with visualizations of the logging data. In the TeamAwear interviews, participants viewed a video recording of the basketball game with the augmented jerseys and were retrospectively interviewed as a group. Retrospective interviews using video can be a valuable method to use for asking participants about situations in which they cannot be interrupted (e.g., playing basketball, performing surgery).
During interviews, it is highly recommended to record the interview and take photos, although make sure to ask for participant’s consent to do so (see Section 4.4.1). Having an audio recording can be
very helpful either to have transcribed or to refer back to later (e.g., for exact quotes). However, you need to recognize that transcribing audio is either a timeconsuming process for you to
do or expensive if you have it done professionally. So, it is usually still valuable to take notes during
the interview if only to identify specific parts of a recording that are interesting. It is also very valuable to take photos that can help you remember the context and be used in presentations of
your work. In the CareNet study, researchers took pictures of where people placed the prototype in their home. Consider taking some photos that do not have people or at least their faces in them;
these can be easier to use since they better protect participants’ privacy. See Section 13.2 of Preece et al. (2002) for more information about conducting interviews.
Considerations for interviews:
Are your questions phrased as neutrally as possible? • Be careful in how you to phrase your questions so that participants feel comfortable telling you about negative experiences as well as positive ones. If participants say something interesting, prompt them for more information with neutral language such “Ummm” (do not underestimate the power of a well-timed ummm), or “Can you tell me more about that?” The word “Why” can sometimes be interpreted as accusatory, so avoid it if possible.
Are you prepared to take negative feedback without becoming defensive? Your job during an interview is to ask questions, record answers, and follow up on interesting information. The participants are telling you about their experience and they are always right about what they experienced. For example, if they tell you the logging software you installed slowed their computer down, tell them you aresorry and that you will look into to it. Do not argue with
them about how it is impossible, even if you believe that to be true. During an interview, you must leave your own opinions at home and collect feedback without judging the participant.
Always remember that they are helping you by participating.
4.3.2.6 Unstructured Observation Although interviews tend to last 2–3 hours and researchers ask specific questions, when collecting
data through observation participants are observed as they engage in their normal lives, possibly while using a novel prototype. In the AURA study, eight participants were observed on shopping trips
while using the system. Chapter 5 discusses in detail the history and use of ethnography in ubicomp field research.
4.3.3 How Long Is Your Study?
People often agonize over how long their study should be. Like most aspects of a field study, there is no definitive answer, only questions to consider based on your research goals and how long the study
needs to be to help answer your research question. The ubicomp research literature has examples of field studies that last hours, weeks, months, and even a year.
Considerations:
What type of study is it? Proof-of-concept • studies may be on the shorter side if less time is needed to prove the feasibility of the prototype. For example, the CAPM study gathered the
data the researchers needed in 5 days. Studies of experience using a prototype are usually
longer (e.g., CareNet study lasted 3 weeks and the AURA study was 5 weeks long) because the study is the contribution, whereas studies of current behavior vary widely. The Home
Technology study used 2-hour interviews to gather data, whereas the Phone Proximity study collected data for 3 weeks.
Do you expect novelty effects to be an issue? Often, when using new technology, people start out very enthusiastically using it and then decrease their usage. Unfortunately, there is no
guarantee about how long novelty effects last. If you are worried about novelty effects, try to make your study as long as possible and be wary of basing too many of your findings on usage
from the beginning of the study. A within-subjects design can help provide metrics for

comparingbetween usage in different conditions. Choosing a within-subjects design would have helped the AURA researchers better understand the novelty effect they observed.
How much work do participants have to do? The more effort your study requires from participants, the shorter you may need to make it. Researchers in the CareNet study chose 3
weeks because of the effort involved for the elders to provide data about their activities each day.
How frequently will participants use your technology or engage in the behavior you are trying to study? If participants use your technology frequently, say multiple times a day, then your study length can typically be shorter than if participants use your technology less frequently, because you will be able to gather more data in a shorter period.
How many times during the study will you interact with participants? How noticeable is your technology or logging to the participant? Consider how intrusive your study will be for your participants. If you need to meet with them every day or week, or your data collection includes ESM that frequently asks participants for feedback, you will probably need to have a shorter study than if you are studying current behavior using logging that is essentially invisible to the participant. The intrusiveness of the CAPM study, which queried the participant after 60 seconds of idle time, probably contributed to the choice of a 5-day-long study period.
4.4 PARTICIPANTS A key part of any field study is the participants. This section outlines important aspects of dealing with participants including treating them in an ethical manner, selecting the type of participants, determining how many are appropriate for your study, and how to compensate participants.
4.4.1 Ethical Treatment of Participants
Researchers must be very careful to treat participants in an ethical manner. It is critical that participants understand what will be required of them if they participate in the study and how you
will report on what they did so they can make an informed decision whether they wish to participate. Participants should also be given the option of discontinuing participation at any time if they choose.
Participants should receive a consent form at the beginning of the study to review and sign to signify that they have consented to participate. The consent form should tell participants what data you are
collecting and have a privacy statement describing how the data will be used and how long they will be kept. Ubicomp studies often collect data that can be considered sensitive (e.g., location of
participants, activities) and thus researchers must take particular care in making clear to participants what data are being collected and who will have access to it. Participant data should be kept as
secure as possible with access limited only to the people who need to see it. Whenever possible, store the data using identifiers (e.g., participant 1) rather than the participant’s name. When you
report your data, you should never use participants’ real names; instead, use participant numbers or pseudonyms.
The exact wording of your consent form will depend on your organization and the country of your study, as different countries have different laws. Your organization should have some review process
to ensure that your study is treating participants in an ethical manner. For example, in the United States many universities have an institutional review board (IRB), which reviews research involving
humans (U.S. Institutional Review Guidebook, http://hhs.gov.ohrp/irb/irb_chapter3.htm). To conduct studies at these institutions, researchers must submit an application to the IRB and obtain its
approval. Companies may have legal teams that can advise on consent forms and privacy statements.
4.4.2 Participant Profile Identifying the participants you would like to recruit for your field study depends on the research
goals of your study. In general, you want to select participants who match the realistic usage of your prototype or the demographic that you are most interested in. For example, having computer science
graduate students pretend to be elders and use the CareNet system for elder care would not have been appropriate. It is also best to have participants who are not involved in any way with your
research. This reduces the chances that they are biased by knowledge they might have of your study or goals. Finally, recruiting different types of participants and comparing between them is a common
type of independent variable. However, you need to be careful that you have enough participants of
each type to be able to make reasonable comparisons. In the Home Technology studies, researchers recruited five families that had one computer, five families that had multiple computers, and five
families that had one or more computers per household member. To come up with your participant proἀle, the description of participants to recruit, consider the following:
Age. Does your research question suggest a particular age range for participants (e.g., teenagers or elders)?
Gender. Often, equal numbers of men and women are recruited so that you can use gender as an independent variable and compare the experiences of male and female participants. However, some studies may benefit from a different balance; in particular, if you need certain types of technology experience or job roles, you may have trouble recruiting and decide to have all women or all men participants to hold this variable constant.
Technology use and experience. Your research question may require recruiting people who use certain types of technology (e.g., have a laptop, use a smart phone) with a particular frequency of use (e.g., send text messages every day). One thing to carefully consider is whether it is most appropriate to recruit people already using cutting-edge technology (sometimes called early adopters) who are already familiar with a device you want them to use (e.g., a smart phone) or people whose usage patterns are more consistent with the general population.
Other characteristics. You may need to recruit people or groups with special characteristics that go beyond their experience with technology. For example, the Home Technology study recruited families with different numbers of computers in their homes, whereas the TeamAwear study recruited athletes, spectators, a referee, and a coach.
Last, recognize that your research question will help you decide how to rank the importance of different aspects of your participant profile. Depending on what is important for your study, you may
be forced to make trade-offs in other criteria. For example, in the AURA study, the researchers recruited participants who owned a Pocket PC with access to the Internet in 2004. However, this
likely explains why the gender balance of their 20 participants was 16 men and 4 women instead of a more equal division. 4.4.3 Number of Participants Determining the exact number of participants you need for your study can be a difficult question. Factors to consider when identifying the number appropriate for your study are
Are there any conditions in your study (e.g., between or within subjects)? Having conditions typically mean you should have more participants, particularly for a between-subjects design,
so that the groups are large enough to justify making comparisons between them.
What claims are you trying to make? Is this a proof-of-concept study? If so, you can typically have fewer people and may want to have many different types of people and/or conditions to show different people can use your prototype in a wide range of environments. For example,
the Phone Proximity study recruited a diverse set of 16 mobile phone users ranging in age from 21 to 66 years with very wide variety of income levels, professions, and phone usage.
The length of your study and amount of data you will collect. A field study needs to collect enough data to convince people its findings are valid. If the study will collect a considerable
amount of data per participant, then you can typically have fewer participants than a study that collects less data per participant. For example, the CareNet and AURA field studies, each
of which lasted multiple weeks, had 13 and 20 participants, respectively, whereas the Home Technology study, where data collection consisted of one interview, had 50 participants in 15
homes.
What is feasible? Although one might ideally like to have a large number of participants, each participant will require a considerable time investment for you and your team. In trying to decide what is feasible, make sure to estimate the time per participant. This time should include the length of any visits, time for travel to the participant’s locations as necessary, preparation time for each visit, and support for participants using prototypes or logging software.
Plan for participants to drop out. Because field studies typically require considerable effort on the part of the participant over a long time, it is practically guaranteed that some participants will drop out of your study. Replacing participants that drop out midway througha study can be quite difficult and cause you problems if you wanted the study to finish by a certain time. Thus, if possible, recruit one or two more participants than you think you need, so that if participants drop out of the study you still have a reasonable number (and maybe you will get lucky and no one will drop out and you will have more participants).
Time to recruit participants. Do not underestimate the time it may take to recruit people to participate in your field study, especially if you have a specific participant profile. In the best case, you work for a company that has a team dedicated to finding people for user studies or you have funding to outsource finding participants to a company that specializes in recruiting, but this is very rare. Most people recruit their own participants using a variety of methods such as advertising on websites (e.g., Craigslist in the United States) or newspapers, or passing out flyers as the TeamAwear researchers did in sports halls and after basketball games.
In the end, there is not one right answer about the number of people you need in your study.
Consider the factors discussed above and then try to include the largest number of participants that is feasible and seems appropriate for your research question.
4.4.4 Compensation
Study participants are typically given a gratuity or compensated in some way for their time and effort. Sometimes if the technology is interesting, it can be possible to entice people to participate for
no compensation as participants did in the TeamAwear field study. However, as researchers in that study noted, when you do not compensate your participants you need to consider bias. Your
participants may have chosen to participate because they were very excited about your technology, which could bias their feedback. In general, it is best to compensate people in some way, and compensating people fairly can help with recruiting. You should always make clear when presenting your study how participants were compensated.
Considerations:
How much effort is required? Study compensation typically varies based on how much effort the study requires and can be anything from food to money to software. To get an idea about what is fair, youcan ask other people in your organization or look at recent papers in your
field. The longer the study, the more compensation is needed. In the Phone Proximity study, participants were compensated with $200 for 3 weeks.
Will the compensation method affect the • data collected? If you would like to have people use a prototype, it might seem like a good idea to compensate people based on their amount
of interaction. But if you are going to make claims about usage, you have to be very careful that your gratuity method does not distort any effects. For example, if you paid participants a
small amount every time they used your prototype, this could lead to distorted usage. One approach is to reward people for any day or week they use your prototype at least once and
then base any analysis on additional usage above the requirement for the gratuity. However, if you are collecting feedback using ESM or other methods, you would want to incent participants to provide as much feedback as possible. In this case, giving participants a small incentive (e.g., entries into a raffle) can be a useful strategy to increase the amount of feedback you receive. For example, in the CareNet study, elders and other people who provided data received between $75 and $300 for a 3-week-long deployment, depending on how often they provided the researchers with updates, whereas participants with the displays
received $150. In the AURA study, participants were compensated with coupons to the company café, and each week they scanned at least one item during the final 3 weeks of the
study they were eligible for a $50 Amazon gift certificate that was raffled each week. Are there other incentives besides money that would also appeal to participants? When
determining your compensation strategy, do not underestimate the power of food. In the Home Technology study, researchers brought a pizza dinner to the families to help break the
ice and entice families to participate, in addition to giving families their choice of two pieces of Microsoft software.
4.5 DATA ANALYSIS
Using appropriate data analysis techniques will help convince people of the validity of your findings. The type of field study and the data you have collected will determine the depth of the analysis that
is appropriateand choice of techniques. For example, in a proof-of-concept study, the analysis may be a very straightforward account of whether the technology worked in the field and participants’
reactions collected through surveys or interviews. Other types of studies may involve a more in-depth analysis of the data you have gathered.
Take care that your analysis section does not become a very dense description of results. It can be helpful to use your research question to frame this section and then tell a story about how the data
address the research question(s) and any themes or surprises that emerged. When presenting your results, also try to support your findings using more than one type of data. For example, having both
logging data and participants’ qualitative feedback makes the findings of the Phone Proximity study more convincing and helped the authors explain logging anomalies. Quotes from participants may also help explain logged data or actions of the participants. This section introduces the most common analysis methods and references where you can learn more as needed, first discussing statistical analysis methods and then ways of analyzing unstructured qualitative data. 4.5.1 Statistics
To analyze numeric data, there are two main types of statistics: descriptive statistics, which describe the data you have collected, and inferential statistics, which are used to draw conclusions from the
data.
4.5.1.1 Descriptive Statistics Common descriptive statistics reported include the frequency of occurrence or count, mean
(averages), and median. The statistics that are appropriate to use depend on how a variable was
measured, referred to as its level of measurement (for more details, see Level of Measurement, http:/en.wikipedia.org/wiki/Level_of_measurement and Chapter 6 in de Vaus, 2002). The three
common levels of measurement for field study variables are described below.
4.5.1.1.1 Nominal Variables where the possible answers represent unorderedcategories are referred to as nominal, or sometimes categorical. For nominal variables, you can only report the frequency
that each category occurred. For example, gender is a nominal variable where the count of responses can be reported (e.g., Phone Proximity study had 10 male and 10 female participants), but there is no
concept of ordering between the response categories.
4.5.1.1.2 Ordinal Variables measured on an ordinal scale represent a rank order preference without a
precise numeric difference between different categories. For example, a survey question with five possible responses of daily, weekly, monthly, and almost never, is measured on an ordinal scale,
because the response options can be ordered from more to less frequent, but not added or subtracted. For ordinal variables, both the frequency that each category occurred and the median
value can be reported. Answers to Likert scale questions on a survey are the most common example of ordinal variables
collected during a field study. You can compare whether different participant’s answers are more positive or less positive than another, but they cannot be added or subtracted. For example, trying to
subtract between an answer of Strongly Agree and Strongly Disagree does not yield meaningful information. Note that you may sometimes see means (averages) reported for Likert scale data
because some people believe Likert variables can be treated as being measured on an interval scale.
4.5.1.1.3 Interval For variables measured on an interval scale, the difference between any two values is numerically meaningful. Interval variables can be added and subtracted—for example, a person’s
age in years, the number of times someone performed a particular action, how long an action took, or the number of ESM surveys a participant answered. Descriptive statistics valid for interval data include sum, mean, and median. It is important to examine interval data for outliers. Outliers affect the mean, so always report the standard deviation if you report the mean value for a variable. The median can sometimes be more appropriate to report. As an illustration, imagine you have five participants in your study and collect how often each participant performs an action resulting in five data values of {1, 2, 3, 5, 40}. If you report the mean you would say on average participants performed the action 10.2 times (standard deviation = 16.7), whereas if you report the median you would report 3 times. However, neither of these values may accurately describe the data, so you might instead discuss how one participant performed the action much more frequently than the other participants. For some variables, it may be best to report the raw values as well as the descriptive statistics if the variations are large and important. Considerations:
Do the descriptive statistics you report give • an accurate picture of your data? Have you checked to see if your data contain outliers?
Are the descriptive statistics reported appropriate for the level of measurement of the variable? Are standard deviations reported with the means?
4.5.1.2 Inferential Statistics: Significance Tests
Once you have computed descriptive statistics for a variable, one type of inferential statistics, significance tests, allow you to determine whether the results found in your sample of participants
are statistically significant or might be due to sampling errors. The use of inferential statistics in

analyzing field study data is rare since the small number of participants typically feasible to have in a field study makes it difficult to collect enough data for many statistical tests to be appropriate.
However, it is sometimes useful to compare descriptive statistics calculated for a variable (e.g., average number of items scanned in the AURA study or average times participants performed an
action with your prototype) between different conditions or groups of participants. This section introduces some common significance tests. Readers interested in more detail about
statistical analysis are encouraged to refer to two books: Analyzing Social Science Data by de Vaus (2002) and Using SPSS for Windows and Macintosh, Analyzing and Understanding Data by Green and
Salkind (2002). The first addresses and clearly explains 50 common problems in data analysis from
preparing data for analysis to determining which statistical tests are appropriate for your data, whereas the second book provides an excellent practical introduction to using SPSS, a common
statistical package, using many examples. To conduct a significance test comparing descriptive statistics, you first determine the variable you wish to compare and the appropriate groups of
participants or different conditions to compare between. In a field study, the most common groups to compare between are either different types of participants (e.g., men vs. women or people who
scanned many objects with AURA and those who did not) or answers from the same participants in different conditions in a within-subjects design (e.g., when participants were asked the same
questions on a prestudy and poststudy survey, and you wishto compare the answers). It is worth noting that even if you did not initially design your study to explicitly have different types of
participants, you may observe—as researchers in the AURA study did—that your participants fall into different groups that you want to compare. Researchers in the AURA study grouped their participants
into high-, mid-, and low-volume scanners based on the number of items the participant scanned during the field study.
They then used the significance tests to verify if the average number of items uploaded by each group were significantly different and compared the number of days participants in each group used
the system. Once you have identified what variable you want to compare across a set of groups or conditions, which statistical test is appropriate is determined by the level of measurement of the variable, number of groups you are comparing, and whether the variable has a normal distribution (when plotted, it follows the normal curve). For example, an independent samples t-test is appropriate to use when comparing the mean of a variable with a normal distribution between two groups, whereas analysis of variance (ANOVA) tests are used for comparing across more than two groups. Chapter 39 in de Vaus (2002) and the detailed description of each test given by Green and Salkind (2005) can help you choose the most appropriate test. You may be most familiar with the independent samples t-test and ANOVA statistical tests, which are most appropriate for interval-level data with normal distributions. However, many of the nonparametric equivalents (e.g., Mann-Whitney U, Kruskal-Wallis) that do not assume a variable has a normal distribution, may be more appropriate for field study data since they make fewer assumptions about the data that have been collected. Regardless of what statistical test you use, significance tests start with the assumption that there is no difference between the groups for the variable being examined (referred to as the null
hypothesis). If a difference is observed (e.g., the means or medians are different), there are two possibilities: there is a difference between the groups or that there is sampling error in the data. The
p value indicates how likely it is that the data might be wrong. Researchers often use a cutoff of either p < 0.01 or p < 0.05 to determine if the test results are statistically significant. If p < 0.01, there
is a 99% chance that the data collected represent a real difference between the groups rather than a sampling error (or a 95% chance for p < 0.05). Chapters 23–26 of de Vaus (2002) are an excellent introduction to significance testing, factors that affect significance levels, choice of sample size, and statistical power analysis.

Considerations:
Are there variables that I want to compare? • Do I have a large enough sample size to run this test? For example, 30 pairs of scores are considered a moderate sample size for a paired-samples t-test. •
Do the data meet the assumptions of the statistical test I am using? All statistical tests make a set of assumptions about your data (e.g., data values are independent,
scores are normally distributed) and the validity of the test depends on how well your data matches the assumptions for the test you choose. Green and Salkind (2005) clearly describe the assumption
for each test in their book.
• Are you using statistical tests to explore theories that you have rather than running every test you can think of? de Vaus (2002, p. 174) strongly cautions against “data dredging or running every test
you can think of in hopes something will turn up as significant.” When conducting multiple related tests, it is often necessary to use a method, such as the Bonferroni technique, to adjust the
significance cutoff (the p value) used based on the number of tests conducted. For more detail, see Appendix B in Green and Salkind (2005).
4.5.2 Unstructured Data
Most qualitative data, with the exception of some survey data, are unstructured. This type of data includes free response questions on surveys, answers to interview questions, and any field notes you
take down while observing participants. Although trying to understand and derive themes from a large amount of unstructured qualitative data may seem daunting, there are methods that you can
apply. This section introduces simple coding techniques and methods for deriving themes from data. Readers should also refer to Chapter 5 for additional insights on analyzing qualitative data.
4.5.2.1 Simple Coding Techniques
Strauss and Corbin (1998, p. 3) broadly define coding as “the analytic processes through which data are fractured, conceptualized and turned into theory.” However, the simplest coding techniques consist of closely examining your data and counting the number of times a concept or theme reoccurs, essentially turning qualitative data into quantitative data. For example, if you asked the open-ended question “Did you have anyproblems using the prototype during the study? If so, what were they?” on a postsurvey, you might want to report common problems. To do this, you would first read over the responses from all the surveys to get a sense of the types of answers. After identifying commonly mentioned problems (e.g., “it crashed,” “was slow,” “too loud”), you would then count the number of times each problem was mentioned. In a write-up or presentation you could report the number of occurrences and might also include some quotes from the survey responses. Depending on your study, it may be appropriate to have one person code the data. However, multiple coders, sometimes referred to as raters, are often used if there is a large amount of data to code. When multiple raters code, it is necessary to check for interrater reliability, agreement between the raters, to make sure different people are coding the data consistently. If there is a relatively small amount of data and all raters code all the data you can identify any places
where there is disagreement, and then discuss and come to an agreement between the raters. More typically, multiple raters each code the same subset of data (in addition to mutually exclusive
subsets), and then a test such as Cohen’s kappa is used to report interrater reliability on the overlapping set of data and show that the raters are coding consistently. In the Phone Proximity
study, researchers present both the exact agreement between the raters and Cohen’s kappa as measures of interrater reliability.

4.5.2.2 Deriving Themes and Building Theory Although simple coding techniques may be appropriate for some qualitative data, organizing field
observations and understanding interview data require other methods. Two common methods used are affinity diagramming and grounded theory.
Based on the affinity process introduced by Kawakita, Beyer and Holtzblatt (1998) created an affinity diagramming process, as part of their Contextual Design process to develop user-centered systems.
Their affinity diagram process is designed to organize a large number of notes captured during observations or interviews into a hierarchy to understand common issues and themes present in the
data.
To construct an affinity diagram, researchers start by putting each note captured on its own small slip of paper. Each note is then placed on a table or wall near other notes that are similar. As groups of
notes emerge they are labeled and then these subgroups are grouped and labeled to identify higher-level themes. This approach works well for teams of researchers whocan discuss where notes belong
and how they should be grouped together to come to a common understanding, which can be especially helpful if all members of a research team were not present at every interview or data
collection opportunity. Beyer and Holtzblatt (1998) encourage building the affinity in one day if possible, and it is also helpful to have a large amount of space (e.g., a conference room with a large
table or wall space) to spread out the notes and move them around as you recognize themes. Ballagas et al. (2008) used affinity diagramming on more than 1000 quotes collected during the
REXplorer study, whereas in the Home Technology study researchers used the process to analyze 650 notes including observations and quotes. In the Phone Proximity study, researchers grouped
selfreported reasons for the phone’s proximity into 15 themes using affinity diagramming. Researchers considering using affinity diagramming are encouraged to read more about the process
in Beyer and Holzblatt (1998) or Preece et al. (2002). The philosophy of affinity diagrams where issues and themes are derived from the data using a
bottom-up approach was influenced by the grounded theory method, developed by Glaser and Strauss (1967). Grounded theory emphasizes building theories from the observed data rather than starting from preconceived hypothesis or theories. Researchers begin by conducting a microscopic examination of a subset of their data to identify concepts and categories in the data and relationships between them. These categories are then used and adjusted as needed while coding the rest of the data. Researchers interested in learning about and using the grounded theory approach are encouraged to read Basics of Qualitative Research by Strauss and Corbin (1998). Considerations: Make sure you leave enough time to do the qualitative analysis. Carefully reading through and immersing yourself in qualitative data takes time. It is also best to schedule a longer period of uninterrupted time (e.g., eight contiguous hours rather than eight 1-hour blocks of time) because starting and stopping the analysis process can be disruptive to your thought process. • Think about flagging interesting points as you are collecting the data because this can help you during the analysis. For example, during interviews and when rereading or listening to interview data, make notes of particularly interesting points or comments made by participants that you want to
return to• transcription of recorded data (e.g., interviews) and whether you will hire someone to do it. For example, if you plan to use affinity diagramming, you may not need to transcribe interviews
completely; you may be able to take notes during the process and use the transcriptions where needed or to get the exact text of quotes that you want to use.
• Makes sure when you report the data you do not become sloppy. Too often when people report qualitative results they use vague words such as “Many participants” or “some.” Whenever possible, be as specific as possible in reporting the number of participants that expressed a particular concern; this gives readers more confidence in your results.
4.6 Steps to a Successful Study
Now that you have been introduced to study design, data collection and analysis methods, and considerations for choosing and managing participants, this section offers practical advice on ways to
make your study more successful. At a high level, preparation is the key to having your study run as smoothly as possible. Given the time and effort involved, the last thing you want to realize at the end
of the study is that you forgot to do or ask something important.
4.6.1 Study Design Tips
4.6.1.1 Have a Clear Research Goal Knowing why you want to conduct a field study and what you hope to learn from the study is
necessary so that your research questions can inform the numerous choices you need to make when designing the study. Without a clear research question, it may be hard to explain your findings and
why they are a contribution to other researchers working in the field. You can also slip into focusing on usability problems, which are typically not interesting to other researchers, if you are studying a
prototype.
4.6.1.2 Create a Study Design Document A study design document should capture the decisions you make when planning your study. Ask your
colleagues to review this document and help you identify any problems. A well-written study design documentcan also be an excellent start on the methodology section of any presentation you need to
make. The Study Design Document should contain: • Your research question
• Participant profile • Compensation plan
• Your methodology including any conditions you might have in the study • Timeline: how often you will visit participants, what will happen at each visit • Types of data you will collect • How you will analyze the data 4.6.1.3 Make Scripts for Participant Visits If you are interacting with participants, create a script document for each visit. The script should roughly outline what you will say to the participants and anything you need to do. For example, a script for the first visit would include telling participants about the study and giving them the consent form to sign. In addition to making sure you remember to do everything during a visit, a script also helps ensure you are giving the participants similar instructions and information. Note that it is typically not necessary to read from your script word for word, but it will keep you on track during the visit. Depending on the complexity of your participant visit, some of your scripts may be simple checklists of things to do (e.g., collect logs, give compensation). 4.6.1.4 Pilot Your Study
In a pilot study, you run a group of people through the entire study from the beginning to end as if they were real participants. This is a dress rehearsal for the real study. The pilot will help you identify
many potential problems from technical challenges (e.g., you did not take the leap year into account) to issues with surveys and interviews (e.g., your initial visit takes 4 hours instead of the 2 hours you
expected). 4.6.2 Technology Tips Below are some specific tips for studies that involve deploying technology.
4.6.2.1 Make Your Technology Robust Enough
The “enough” part of “robust enough” is very important in managing the effort involved in the study. Based on your research question, determine which aspects of the prototype absolutely have to work
and where you can scrimp or cut corners. For example, perhaps it is difficult and confusing to set up your prototype, but since participants will receive the prototype already configured you do not need
to spend time on a nice setup experience.
4.6.2.2 Consider Other Evaluation Methods
Before taking the large step of deploying your technology in the wild, consider other evaluation methods to identifying as many usability problems as possible. In heuristic evaluation, developed by
Nielsen and Molich (1990), a set of evaluators (which could be you and your colleagues) uses a small set of heuristics to critique your technology and identify problems.
Section 13.4 in Preece et al. (2002) further describes the process. Mankoff et al. (2003) have developed additional heuristics for ambient displays that may be relevant to your project. Laboratory
studies before your field study can also be very valuable to ensure that your technology is usable.
4.6.2.3 Use Existing Technology Leverage existing toolkits (e.g., MyExperience) or commercially available prototyping hardware (e.g.,
Phidgets) when appropriate to make developing your technology easier.
4.6.2.4 Get Reassuring Feedback Once your technology has gone into the field, look for means to reassure yourself it is working as you
expect. Do not count on your users to always tell you if things are going wrong. You do not want to get to the end of a deployment and then discover that, for some reason, the data you expected were
not being collected. As mentioned previously, if your technology is not logging data to a central server, consider having it send you periodic “everything’s fine” messages so you can detect problems as soon as possible. 4.6.2.5 Negative Results Deploying a technology that people do not use can be a very painful experience. Decide before the study what you will do if people are not using your technology as much as you expected. Is naturalistic usage a variable you care about? Or will you intervene during the study to encourage people to continuing using your prototype or find out what challenges they are having? Within-subject designs that compare versions of an application can be helpful so that you can get qualitative feedback from participants and also gauge if they used one version more than another, since it can sometimes be hard to figure out how much usage constitutes adoption. Do not plan a study that relies on adoption and usage as the only dependent variable, because you will be in trouble if people do not adopt your technology. If your study results in a negative outcome, as the AURA study did to a certain extent, it can still be very worthwhile to present and publish your results although it is sometimes more difficult, because it is easy for people to dismiss negative results as
due to usability issues. Use pilot studies and laboratory evaluations to detect and fix usability problems before your field study. Also make sure your research question focuses on understanding
the concepts your technology embodies rather than “Do participants like my prototype?”
4.6.3 Running the Study 4.6.3.1 Have a Research Team Recognize that each phase of the study from recruiting, to installation, visiting participants, providing technical support, and analyzing the data will take more time than you expect. If you are not already
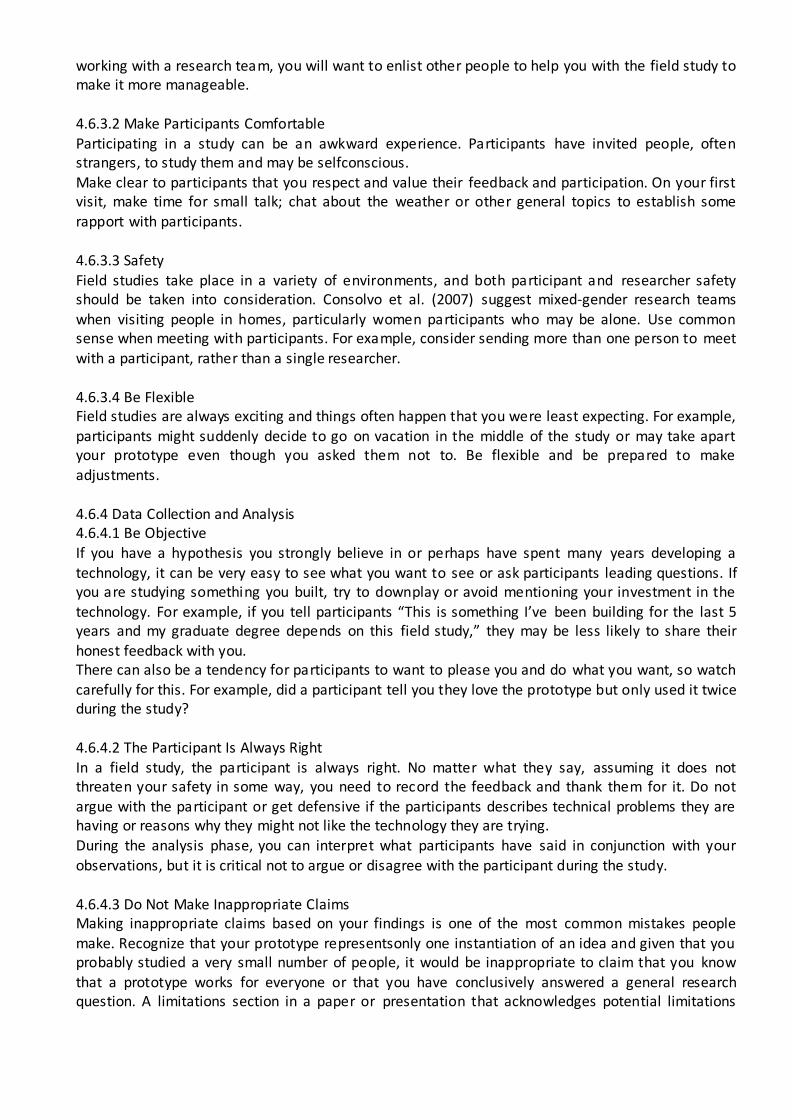
working with a research team, you will want to enlist other people to help you with the field study to make it more manageable.
4.6.3.2 Make Participants Comfortable
Participating in a study can be an awkward experience. Participants have invited people, often strangers, to study them and may be selfconscious.
Make clear to participants that you respect and value their feedback and participation. On your first visit, make time for small talk; chat about the weather or other general topics to establish some
rapport with participants.
4.6.3.3 Safety
Field studies take place in a variety of environments, and both participant and researcher safety should be taken into consideration. Consolvo et al. (2007) suggest mixed-gender research teams
when visiting people in homes, particularly women participants who may be alone. Use common sense when meeting with participants. For example, consider sending more than one person to meet
with a participant, rather than a single researcher.
4.6.3.4 Be Flexible Field studies are always exciting and things often happen that you were least expecting. For example,
participants might suddenly decide to go on vacation in the middle of the study or may take apart your prototype even though you asked them not to. Be flexible and be prepared to make
adjustments.
4.6.4 Data Collection and Analysis 4.6.4.1 Be Objective
If you have a hypothesis you strongly believe in or perhaps have spent many years developing a technology, it can be very easy to see what you want to see or ask participants leading questions. If you are studying something you built, try to downplay or avoid mentioning your investment in the technology. For example, if you tell participants “This is something I’ve been building for the last 5 years and my graduate degree depends on this field study,” they may be less likely to share their honest feedback with you. There can also be a tendency for participants to want to please you and do what you want, so watch carefully for this. For example, did a participant tell you they love the prototype but only used it twice during the study? 4.6.4.2 The Participant Is Always Right In a field study, the participant is always right. No matter what they say, assuming it does not threaten your safety in some way, you need to record the feedback and thank them for it. Do not argue with the participant or get defensive if the participants describes technical problems they are having or reasons why they might not like the technology they are trying. During the analysis phase, you can interpret what participants have said in conjunction with your
observations, but it is critical not to argue or disagree with the participant during the study.
4.6.4.3 Do Not Make Inappropriate Claims Making inappropriate claims based on your findings is one of the most common mistakes people
make. Recognize that your prototype representsonly one instantiation of an idea and given that you probably studied a very small number of people, it would be inappropriate to claim that you know that a prototype works for everyone or that you have conclusively answered a general research question. A limitations section in a paper or presentation that acknowledges potential limitations
(e.g., a small number of participants from a limited geographic region) of the study helps make clear to the audience that you are not making inappropriate claims. Also, pay attention to the language
you use in a written presentation; watch out for words like “prove” and instead use terms such as “suggest” or “support,” which are more appropriate to use.
4.7 Conclusi on
Field studies are a crucial tool for ubicomp research. As part of this research field, we must continue to build and extend tools (e.g., MyExperience (Froehlich et al., 2007), Momento (Carter et al., 2006),
tools built by Intille et al. (2003)) that ease the process of conducting field studies. We must also build
on and continue the work that has been started through papers (e.g., Scholtz and Consolvo, 2004) and workshops (e.g., USE 2007, 2008) to develop best practices and evaluation strategies for
ubicomp systems. By working together, we can reduce the effort required to conduct studies and facilitate comparison between different approaches and applications.
Although the amount of effort involved in conducting a field study may seem a bit daunting, there is really no substitute for the inspiration and understanding you will gain from interacting with
participants in the field. Regardless of whether your field study involves observing people’s current behavior, conducting a proof-of-concept study, or deploying your technology to participants for a
long period, you will learn something that surprises you and helps you to move your research forward. The understanding and insights you gain from a field study can often spark new ideas and
directions for future research.
Acknowledgments The author thanks Ed Cutrell, Sunny Consolvo, and Beverly Harrison for sharing their wisdom and
experience from many studies. Authors of the examples are also acknowledged for allowing the inclusion of their research in this chapter. Finally, Mike Brush is thanked for his support.

References 1. Affinity Diagrams, http://en.wikipedia.org/wiki/Affinity_diagram 2. Ballagas, R., Kuntze, A., and Walz, S. P., Gaming tourism: Lessons from evaluating REXplorer, a pervasive game for
tourists . Pervasive ’08. 3. Beyer, H., and Holtzblatt, K., Contextual Design: Designning Customer-Centered Systems. Morgan Kaufmann, San
Francisco, 1998. 4. Brush, A. J., and Inkpen, K., Yours, mine and ours? Sharing and use of technology in domestic environments, in
Proceedings of the Ubicomp 2007, September 2007.
5. Brush, A. J., Turner, T., Smith, M., and Gupta, N., Scanning objects in the wild: Assessing an object triggered information system, in Proceedings of UbiComp 2005, 2005.
6. Carter, S., Mankoff, J., and Heer, J., Momento: Support for situated ubicomp experimentation, CHI 2007, 2006, pp. 125–134.
7. Consolvo, S., and Walker, M., Using the experience sampling method to evaluate ubicomp applications, IEEE Pervasive Computing Magazine: The Human Experience 2(2), 24–31, 2003.
8. Consolvo, S., Harrison, B., Smith, I., Chen, M. Y., Everitt, K., Froehlich, J., and Landay, J. A., Conducting in situ
evaluations for and with ubiquitous technologies, International Journal of Human-Computer Interaction 22(1–2), 103–118, 2007.
9. Consolvo, S., Roessler, P., and Shelton, B. E., The CareNet display: Lessons learned from an in home evaluation of an ambient display, in Proceedings of the 6th International Conference on Ubiquitous Computing: UbiComp
’04, Nottingham, England, Sep. 2004, pp. 1–17. 10. de Vaus, D., Analyzing Social Science Data 50 Key Problems in Data Analysis. Sage Publications, London, 2002. 11. Froehlich, J., Chen, M., Consolvo, S., Harrison, B., and Landay, J., MyExperience: A system for in situ tracing and
capturing of user feedback on mobile phones, in Proceedings of MobiSys 2007, San Juan, Puerto Rico, June 11–
14, 2007. 12. Gaver, W., Bowers, J., Boucher, A., Law, A., Pennington, S., and Villar, N., The History Tablecloth: Illuminating
domestic activity, in Proceedings of DIS ’06: Designing Interactive Systems: Processes, Practices, Methods, and
Techniques, 2006, pp. 199–208. 13. Gaver, W., Sengers, P., Kerridge, T., Kaye, J., and Bowers, J., Enhancing ubiquitous computing with user
interpretation: Field testing the Home Health Horoscope, in Proceedings of the SIGCHI Conference on Human Factors in Computing Systems, CHI ’07, San Jose, CA, April 28–May 3, ACM, New York, NY, 2007.
14. Glaser, B. G. and Strauss, A. L., The Discovery of Grounded Theory. Strategies for Qualitative Research. Aldine De Gruyter, Hawthorne, NY, 1967.
15. Green, S. B., and Salkind, N. J., Using SPSS for Windows and Macintosh: Analyzing and Understanding Data, 5th Edition. Prentice Hall, Upper Saddle River, NJ, 2005.
16. Harris, C., and Cahill , V., An empirical study of the potential for context-aware power management, Ubicomp 2007: Ubiquitous Computing, 16–19 September, Innsbruck, Austria, 2007, pp. 235–252.
17. Intille, S., Tapia, E., Rondoni, J., Beaudin, J., Kukla, C., Agarwal, S., Bao, L., and Larson, K., Tools for studying
behavior and technology in natural settings, in Proceedings of the Ubicomp 2003: Ubiquitous Computing, 157–174, 2003.
18. Kahneman, D., Krueger, A. B., Schkade, D. A., Schwarz, H., and Stone, A. A., A survey method for characterizing daily life experience: The day reconstruction method, Science 306, 1776–1780, 2004.
19. Krumm, J., and Horvitz, E., Predestination: Inferring destinations from partial trajectories, in Proceedings of Ubicomp 2006, 2006, pp. 243–260.
20. Level of Measurement, http://en.wikipedia.org/wiki/Level_of_measurement.
21. Mankoff, J., Dey, A., Hsieh, G., Kientz, J., Ames, M., and Lederer, S., Heuristic evaluation of ambient displays, in Proceedings of CHI 2003, 2003, pp. 169–176.
22. Matthews, T., Carter, S., Pai, C., Fong, J., and Mankoff, J., Scribe4Me: Evaluating a mobile sound transcription tool for the deaf, in Proceedings of the International Conference on Ubiquitous Computing (Ubicomp 2006),
Newport Beach, CA, 2006, pp. 159–176. 23. MyExperience ESM Toolkit, http://myexperience.sourceforge.net. 24. NASA TLX: Task Load Index, http://humansystems.arc.nasa.gov/groups/TLX/. 25. Nielsen, J., and Molich, R., Heuristic evaluation of user interfaces, in Proceedings of the ACM CHI’90 Conference,
Seattle, WA, 1–5 April, 1990, pp. 249–256. 26. Page, M., and Vande Moere, A., Evaluating a wearable display jersey for augmenting team sports awareness,
International Conference on Pervasive Computing (Pervasive 2007), 2007, pp. 91–108.
27. Patel, S. N., Kientz, J. A., Hayes, G., Bhat, S., and and Abowd, G., Farther than you may think: An empirical investigation of the proximity of users to their mobile, in Proceedings of the Ubicomp 2006: 8th International Conference on Ubiquitous Computing, Orange County, CA, September 17–21, 2006, pp. 123–140.
28. Patel, S. N., Robertson, T., Kientz, J. A., Reynolds, M. S., and Abowd, G. D., At the flick of a switch: Detecting and classifying unique electrical events on the residential power line, in Proceedings of Ubicomp 2007, 2007, pp. 271–288.
29. Preece, J., Rogers, Y., and Sharp, H., Interaction Design: Beyond Human-Computer Interaction. John Wiley & Sons, Inc., New York, NY, 2002.
30. Questionnaire for User Interaction Satisfaction, http://lap.umd.edu/quis/. 31. Rogers, Y., Connelly, K., Tedesco, L., Hazlewood, W., Kurtz, A., Hall, R., Hursey, J., and Toscas, T., Why it’s worth
the hassle: The value of in-situ studies when designing ubicomp, Proceedings of UbiComp 2007: Ubiquitous Computing, 2007, pp. 336–353.
32. Scholtz, J., and Consolvo, S., Toward a framework for evaluating ubiquitous computing applications, IEEE Pervasive Computing Magazine 3(2), 82–88, 2004.
33. Sohn, T., Li, K., Griswold, W., and Hollan, J., A diary study of mobile information needs, in Proceedings of the ACM CHI 2008, Conference on Human Factors in Computing Systems, Florence, Italy, April 5–10, 2008, pp. 433–442.
34. Strauss, A., and Corbin, J., Basics of Qualitative Research, Techniques and Procedures for Developing Grounded
Theory. Sage Publications, London, 1998. 35. U.S. Institutional Review guidebook, http://www.hhs.gov/ohrp/irb/irb_chapter3. htm, describes basic IRB
guidelines. 36. Woodruff, A., Anderson, K., Mainwaring, S., and Aipperspach, R., Portable, but not mobile: A study of wireless
laptops in the home, Pervasive Computing, 5th International Conference, Pervasive 2007, Toronto, Canada, May 13–16, 2007, pp. 216–233.