CHAP10 HEALTH SECTOR - Prgis.jp.pr.gov/Externo_Econ/PDE2014/Chapter10 Health Sector.pdf · ECONOMIC...
41
Chapter First Draft ECONOMIC DEVELOPMENT PLAN FOR THE HEALTH SECTOR Jaime del Valle, Ph.D. * José Laborde, Ph.D. * * Affiliations: JLDV Consulting & University of Puerto Rico, Rio Piedras Campus 10
Transcript of CHAP10 HEALTH SECTOR - Prgis.jp.pr.gov/Externo_Econ/PDE2014/Chapter10 Health Sector.pdf · ECONOMIC...

ECONOMIC DEVELOPMENT PLAN FOR THE HEALTH SECTOR
1
Chapter
First Draft
ECONOMICDEVELOPMENT PLANFOR THE HEALTH SECTOR
Jaime del Valle, Ph.D. *José Laborde, Ph.D. *
* Affi liations: JLDV Consulting & University of Puerto Rico, Rio Piedras Campus
10

ECONOMIC DEVELOPMENT PLAN FOR THE HEALTH SECTOR
2

ECONOMIC DEVELOPMENT PLAN FOR THE HEALTH SECTOR
i
TABLE OF CONTENTS
CHAPTER Page
Introduction I DIAGNOSTIC ASSESSMENT OF PUERTO RICO’S HEALTH SECTOR General demographic and economic profi le ................................................................................................. 3 Demographic profi le................................................................................................................................... 3 Population size .......................................................................................................................................... 3 Municipalities with highest and lowest population ..................................................................................... 3 Sex distribution .......................................................................................................................................... 4 Median age ................................................................................................................................................ 5 Puerto Rico’s population pyramid .............................................................................................................. 6 Demographic facts ..................................................................................................................................... 7 Economic profi le ........................................................................................................................................... 8 Puerto Rico’s economy .............................................................................................................................. 8 Labor force................................................................................................................................................. 9 Employment by economic sector ............................................................................................................... 9 Median income ........................................................................................................................................ 10 Population poverty line ............................................................................................................................ 10 Historical review ...........................................................................................................................................11 History.......................................................................................................................................................11 The beginning of the Puerto Rico health sector ....................................................................................11 The Arbona System ............................................................................................................................. 12 Development of the public health sector in Puerto Rico ...................................................................... 13 A new public policy on health ............................................................................................................... 14 Puerto Rico’s Health Reform ................................................................................................................ 14 Mi Salud ............................................................................................................................................... 15 Diagnosis of the Puerto Rico Health Care System ..................................................................................... 15 Health sector productivity ........................................................................................................................ 16 Health sector employment and establishment ..................................................................................... 16 Providers and facilities ............................................................................................................................. 17 Hospitals and hospital beds ................................................................................................................. 17 Hospitals by region .............................................................................................................................. 18 Health care professionals in Puerto Rico ............................................................................................. 19 Physicians ............................................................................................................................................ 21 Type of physicians ............................................................................................................................... 22 Medical schools ....................................................................................................................................... 23 Health care expenditure........................................................................................................................... 24 Public budget ....................................................................................................................................... 25 Insured population in Puerto Rico ........................................................................................................ 25 Private insurers and their premiums .................................................................................................... 26 Insured and costs of public health insurance MI Salud ........................................................................ 26 Uninsured population in Puerto Rico ................................................................................................... 28
ECONOMIC DEVELOPMENT PLAN FOR THE HEALTH SECTOR
ii
CHAPTER Page Aggregated expenditures on health .............................................................................................. 29 Medicaid spending cap and Affordable Care Act .............................................................................. 29 Health outcomes .................................................................................................................................. 29
II SWOT Analysis SWOT Analysis .................................................................................................................................... 31 Strengths .............................................................................................................................................. 31 Weakness ............................................................................................................................................ 32 Opportunities ........................................................................................................................................ 33 Threats ................................................................................................................................................. 34 References ........................................................................................................................................... 35 Appendix 1: Specialties Active in Puerto Rico ..................................................................................... 36
TABLES
CHAPTER I
2 Population Change 1980 – 2010 ............................................................................................................... 3 3 Municipalities with highest and lowest population ..................................................................................... 4 4 Sex Ratio by Age in 2010 .......................................................................................................................... 5 5 Median Age in High Populated Municipalities ........................................................................................... 6 6 Population Over 65 ................................................................................................................................... 7 7 Population Under 18 ................................................................................................................................. 7 8 Demographic Facts 1990, 2000, 2010 ...................................................................................................... 8 9 Labor Force 2005 – 2013 .......................................................................................................................... 9 10 Employees by Economic Sector ............................................................................................................... 9 11 Households Incomes ............................................................................................................................... 10 12 Families Under Poverty Line ................................................................................................................... 11 13 GDP by Sector in Puerto Rico 2012 ........................................................................................................ 15 14 Jobs by Medical Establishments Sizes ................................................................................................... 16 15 Rate of Beds 2010 .................................................................................................................................. 17 16 Rate of Beds Compared to US States 2010 ........................................................................................... 17 17 Rate of Beds Compared to Near Countries ............................................................................................ 17 18 Hospitals and Beds by Health Region in Puerto Rico ............................................................................. 18 19 Population Facts of Health Regions 2012 ............................................................................................... 19 20 Registered Health Professionals 2010 .................................................................................................... 20 21 Physician and Hospital Beds in Puerto Rico ........................................................................................... 21 22 Physician Density per 1000 ..................................................................................................................... 21 23 Rate of Physicians in Caribbean Countries ............................................................................................. 22 24 Physicians by Hospital Type.................................................................................................................... 22 25 School of Medicine in Puerto Rico .......................................................................................................... 24 26 Medicine Programs Available in Puerto Rico .......................................................................................... 24 27 Budgetary allocation for health ................................................................................................................ 25 28 Population in Health Insurance ............................................................................................................... 26 29 Population and Premiums in Private Plans ............................................................................................. 26 30 Mi Salud Physical Care Tariffs (FY 2012-13) .......................................................................................... 27

ECONOMIC DEVELOPMENT PLAN FOR THE HEALTH SECTOR
iii
Page
31 MI Salud Mental Care Tariff (FY 2012-13) ............................................................................................... 27 32 Medicare Insured .................................................................................................................................... 28 33 Uninsured By State 2012 ........................................................................................................................ 28 34 Aggregated Expenditures on Health 2012 .............................................................................................. 29 35 Leading causes of death, Puerto Rico 2010 ........................................................................................... 29 36 Prevalence of Risk Factor and Chronic Diseases, Puerto Rico 2011 ..................................................... 30
GRAPHICS
CHAPTER I
1 Puerto Rico Population 1990 -2012 .......................................................................................................... 3 2 Sex distribution of population .................................................................................................................... 4 3 Median Age 1990 – 2000 .......................................................................................................................... 5 4 Population Pyramid 1990 .......................................................................................................................... 6 5 Population Pyramid 2000 .......................................................................................................................... 6 6 Population Pyramid 2010 .......................................................................................................................... 7 7 GNP and GDP 2006 – 2012 ...................................................................................................................... 8 8 Percent of Real GDP Growth 2006 – 2012 ............................................................................................... 8 9 Population Under Poverty Line 1990 – 2010 .......................................................................................... 11 10 Health and Social Services as a percent of GDP .................................................................................... 16 11 Health Sector Establishment and Workers.............................................................................................. 16 12 Health Professional Registered 2007 – 2010 .......................................................................................... 19 13 Health Professionals Active in Puerto Rico by Type 2007 – 2010 .......................................................... 20 14 Physicians Active in Puerto Rico 2010 .................................................................................................... 23 15 Food and Medical Service Personal Expenses ....................................................................................... 25 16 Insured by Mi Salud ................................................................................................................................ 27 17 Reported Uninsured Population .............................................................................................................. 28 18 Leading Causes of Death, Puerto Rico 2010 .......................................................................................... 30
FIGURES
CHAPTER I
1 The Arbona Regionalization System (1954 - 1992) ................................................................................ 13 2 Health Regions in Puerto Rico ................................................................................................................ 18
CHAPTER II 1 SWOT...................................................................................................................................................... 31

ECONOMIC DEVELOPMENT PLAN FOR THE HEALTH SECTOR
1
Introduction
This report is the fi rst part of a comprehensive analysis and assessment of the health sector in Puerto Rico. This part will include a historical review, a diagnosis and a SWOT analysis for the health sector to determine its current status in Puerto Rico.
At the start, it is important to consider that unlike other sectors of the economy, the fundamental objective of any health care system is to improve the quality of life of the general population. While the system undoubtedly creates employment and income, these are not the main measures of its contribution to the social well-being of its people, and the economy. Chapter 1 will present a demographic and economic analysis, identifying the behavior of several relevant variables by periods. Then we will make an assessment on the resources available in Puerto Rico to provide the health care services for the population. In Chapter 2 we will present a SWOT analysis. The overall purpose of this report is to identify patterns affecting the health system at present and during the next decade.

ECONOMIC DEVELOPMENT PLAN FOR THE HEALTH SECTOR
2
CHAPTER 1Diagnostic Assessment of
Puerto Rico’s Health Sector

ECONOMIC DEVELOPMENT PLAN FOR THE HEALTH SECTOR
3
General Demographic and Economic Profi le
Demographic Profi le
Population Size
According to the US Census Bureau, in 2010 Puerto Rico had a population of 3,725,789. This represented a decrease of 2.2% or 82,821 persons compared to 2000 when the population was at its historic high of 3,808,610. The 2012 census estimate shows that the rate population decline has continued, with an estimated population of 3,667,084, representing an additional decrease of 0.7%. This population decline is the result of two observable demographic patterns: migration and low birth rate. In fact, net migration in 2012 was estimated at 54,000 people and birth rate has declined by 27% between 2000 and 2010.
Table 1: Puerto Rico Population 1990 -2012
Source: Census 2010
1990 2000 2010 2011 2012
3,522,037
3,808,610
3,725,789 3,694,093
3,667,084
Table 2: Population Change 1980 - 2010
Source: Census 2010 and US Census Bureau estimates 2011, 2012
1980-1990 1990- 2000 2000-2010 2011 2012 10.2% 8.1% -2.2% -0.9% -0.7%
Municipalities with highest and lowest population
Most of the population of Puerto Rico lives in the Standard Metropolitan Area (SMA) of San Juan. This area includes the most populated municipalities: San Juan, Caguas, Carolina and Bayamon. Together these municipalities have a population of 923.097 or 24.7% of the total population of the Island. Ponce has the largest population in the southern region of Puerto Rico, with 166,327 persons in 2010. Within the SMA, Caguas was the only municipality that did not experience a decrease in its population.

ECONOMIC DEVELOPMENT PLAN FOR THE HEALTH SECTOR
4
The less populated municipalities in the island are: Culebra, Florida, Las Marias and Maricao. The municipality with the largest population decline in Puerto Rico was Ceiba, located at the east of the island. According to 2010 census, Ceiba lost 24.9% of its population between 2000 and 2010.1
Table 3: Municipalities with highest and lowest population
Municipality 2010 2000 Change %
Bayamon 208,116 224,044 15,928 7.1Caguas 142,893 140,502 2,391 1.7Carolina 176,762 186,076 9,314 5Ponce 166,327 186,475 20,148 10.8San Juan 395,326 434,374 39,048 9Puerto RicoCulebra 1,818 1,868 50 2.7Florida 12,680 12,367 313 2.5Las Marias 9,881 11,061 1,180 10.7Maricao 6,276 6,449 173 2.7
Source: Census 2010
Sex Distribution
With the declining population, the ratio between men and women has widened. According to the census of 2010 the ratio was 52.1% females and 47.9% males. The gender gap has widened since 1980 when the ratio was 51.3% females to 48.7% male.
Graph 2: Sex Distribution of Population
Source: Puerto Rico Planning Board
48.7 48.4 48.1 47.9
51.3 51.6 51.8 52.1
454647484950515253
1980 1990 2000 2010
Male Female
1 The retion in Ceiba’s population is mostly due to the closure of Roosevelt Roads Military base in 2004. In 2000 the population in Roosevelt Roads wards accounted for over 20% of the Municipality total population.

ECONOMIC DEVELOPMENT PLAN FOR THE HEALTH SECTOR
5
Table 4: Sex Ratio by Age in 2010
Source: Census 2010
Male population 1,785,171 Female population 1,940,618 Under 5 years 3.1 Under 5 years 2.9 5 to 9 years 3.3 5 to 9 years 3.1
10 to 14 years 3.7 10 to 14 years 3.5 15 to 19 years 3.9 15 to 19 years 3.7 20 to 24 years 3.5 20 to 24 years 3.5 25 to 29 years 3.2 25 to 29 years 3.4 30 to 34 years 3.2 30 to 34 years 3.4 35 to 39 years 3.1 35 to 39 years 3.4 40 to 44 years 3.1 40 to 44 years 3.4 45 to 49 years 3.1 45 to 49 years 3.6 50 to 54 years 3.0 50 to 54 years 3.5 55 to 59 years 2.7 55 to 59 years 3.3 60 to 64 years 2.7 60 to 64 years 3.2 65 to 69 years 2.2 65 to 69 years 2.6 70 to 74 years 1.7 70 to 74 years 2.0 75 to 79 years 1.2 75 to 79 years 1.5 80 to 84 years 0.7 80 to 84 years 1.1
85 years and over 0.6 85 years and over 1.1 Median age 35.1 Median age 38.6
Median Age
The age structure of the population is essential for demographic analysis. If a population has an average age over 30 years it is considered old. The 2010 census indicates that Puerto Rico’s population is undergoing an accelerated aging process. The median age increased from 32.1 years in 2000 to 36.9 years in 2010. Graph 3 shows the average age by sex since 1990 when it was 27.05 years.
Graph 3: Median Age 1990 - 2000
26.933.7 35.1
27.230.4
38.627.0532.1
36.8
1990 2000 2010
Male
Female
General
Source: Puerto Rico Planning Board
The municipality with the highest median age is San Juan. In fact, the 2012 census estimates shows that the median age of this municipality is higher than the median for Puerto Rico: San Juan’s median age is 39.8 years versus Puerto Rico’s median age of 37.8 years.
ECONOMIC DEVELOPMENT PLAN FOR THE HEALTH SECTOR
6
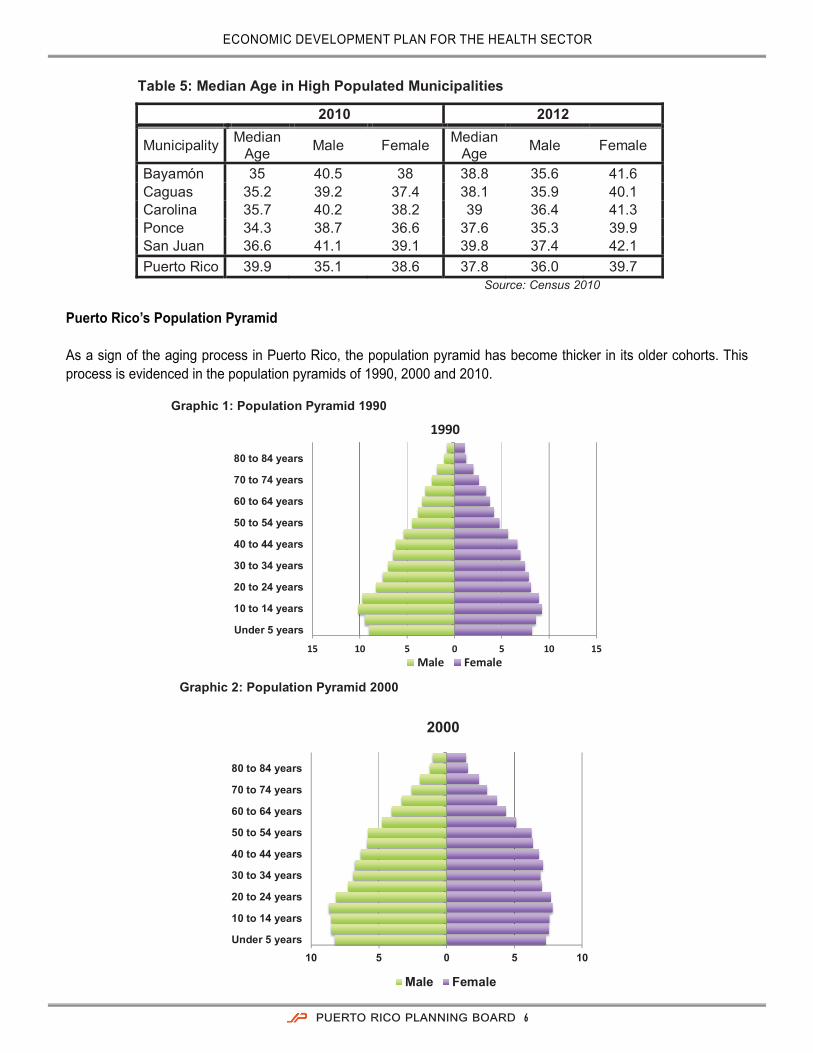
Table 5: Median Age in High Populated Municipalities
2010 2012
Municipality Median Age Male Female Median
Age Male Female
Bayamón 35 40.5 38 38.8 35.6 41.6 Caguas 35.2 39.2 37.4 38.1 35.9 40.1 Carolina 35.7 40.2 38.2 39 36.4 41.3 Ponce 34.3 38.7 36.6 37.6 35.3 39.9 San Juan 36.6 41.1 39.1 39.8 37.4 42.1 Puerto Rico 39.9 35.1 38.6 37.8 36.0 39.7
Source: Census 2010
Puerto Rico’s Population Pyramid As a sign of the aging process in Puerto Rico, the population pyramid has become thicker in its older cohorts. This process is evidenced in the population pyramids of 1990, 2000 and 2010.
Graphic 1: Population Pyramid 1990
15 10 5 0 5 10 15
Under 5 years
10 to 14 years
20 to 24 years
30 to 34 years
40 to 44 years
50 to 54 years
60 to 64 years
70 to 74 years
80 to 84 years
1990
Male Female Graphic 2: Population Pyramid 2000
10 5 0 5 10 Under 5 years
10 to 14 years
20 to 24 years
30 to 34 years
40 to 44 years
50 to 54 years
60 to 64 years
70 to 74 years
80 to 84 years
2000
Male Female

ECONOMIC DEVELOPMENT PLAN FOR THE HEALTH SECTOR
7
Graphic 3: Population Pyramid 2010
5 3 1 1 3 5 Under 5 years
10 to 14 years
20 to 24 years
30 to 34 years
40 to 44 years
50 to 54 years
60 to 64 years
70 to 74 years
80 to 84 years
2010
Male Female
Demographic Facts
As a consequence of an aging population, the proportion of individuals older than 65 in Puerto Rico has increased from 11.2% in 2000 to 14.5% in 2010. The most recent estimates for 2012 suggest that this proportion further increased to 15.9%.
Table 6: Population Over 65
1990 2000 2010 2012
Value 340,884 425,137 541,998 582,034 Percent 9.70% 11.2% 14.5% 15.9%
Source: Census 2010
Table 7: Population Under 18
Source: Census 2010
1990 2000 2010 2012
Value 1,154,527 1,092,101 903,295 849,363 Percent 32.8% 28.7% 24.2% 23.1%
In 2010, life expectancy at birth for Puerto Rico’s population was 78.91 years. This represented an increase from 2000 when the life expectancy was 78.43 years. For males the life expectancy was 75.07 years and for females it was 82.95. Birth Rate per 1,000 women has declined during the last three decades. Along with this decline, the fecundity rate that measure the number of women in reproductive age per 100 females has also declined as another sign of an aging population. On the other hand, the mortality rate has shown a moderate increase throughout these decades. Two of the main factors explaining this increase are heart diseases and the number of homicides in Puerto Rico (see Health outcomes).

ECONOMIC DEVELOPMENT PLAN FOR THE HEALTH SECTOR
8
Table 8: Demographic Facts 1990, 2000, 2010
1990 2000 2010
Life Expectancy at Birth 78.07 78.43 78.91
Birth Rate 18.9 15.6 11.3
Fecundity Rate 71.25 60.64 46.55 Mortality Rate 7.4 7.6 7.9
Source: Puerto Rico Health Department
Economic Profi le
Puerto Rico’s Economy
In 2012 Puerto Rico’s Gross Domestic Product (GDP) reached $101,034 million in nominal prices; an increase of 0.1% in comparison with 2011. Gross National product (GNP) was $69,461.6 in 2012, an increase of 5.9%. The GDP composition by sectors was manufacturing, (45.6%); insurance, fi nance and real estate (20.5%); commerce (7.5%); service (18.8%); government (8.1%); transportation and utilities (2.7%) construction and mineral (1.4%); agriculture (.8%).
Graphic 4: GNP and GDP 2006-2012 (Millions of current dollars)
0.0
20,000.0
40,000.0
60,000.0
80,000.0
100,000.0
120,000.0
2006 2007 2008 2009 2010 2011 2012
87,276.2 89,524.1 93,639.3 96,385.6 98,381.3 100,195.8 101,034.2
57,854.3 60,642.7 62,703.1 63,617.9 64,294.6 65,567.0 69,461.6
GDP GNP
Source: Puerto Rico Planning
Graphic 5: Percent of Real GDP Growth 2006-2012
2006 2007 2008 2009 2010 2011 2012
0.5
(1.2)
(2.9)
(3.8) (3.6)
(1.6)
0.1
Source: Puerto Rico Planning Board

ECONOMIC DEVELOPMENT PLAN FOR THE HEALTH SECTOR
9
Labor Force
According to the US Bureau of Labor Statistics (BLS), by December 2013 the labor force was estimated to be 1,197,168. That represents a decrease of 0.7% with respect to December 2012. Employment decreased by 19,616 jobs to 1,012,607 causing an increase in the unemployment rate to 15.4%. The total unemployed people were 184,561 showing an increase of 11,195 with respect to December 2012.
Table 9: Labor Force 2005 - 2013
Year Labor Force Employment Unemployment Unemployment Rate 2007 1,350,623 1,198,436 152,187 11.3 2008 1,333,251 1,151,876 181,375 13.6 2009 1,285,327 1,080,096 205,231 16.0 2010 1,255,766 1,053,856 201,910 16.1 2011 1,229,226 1,038,726 190,500 15.5 2012 1,205,589 1,032,223 173,366 14.4 2013p 1,197,168 1,012,607 184,561 15.4
*Data for December of each year p: preliminary data Source: US Bureau of Labor Statistics 2013
Employment by Economic Sector
According to the BLS, in 2013 the distribution of employees by sector was 26.8% in government and 73.2% in private sector. The distribution of nonfarm employment was Construction and mining (3.2%); Trade, Transportation and Utilities (19.4%); Information (2.2%); Finance, Insurance and Services (4.9%); Finance, Insurance and Services (4.9%); Professional and Business Services (12.0%); Manufacturing (8.5%) Educational and Health Services (12.8%); Leisure and Hospitality (8.4%) and Other Services (2.0%). Table 10 shows the number of employees by sector and year.
Table 10: Employees by Economic Sector
Year 2009 2010 2011 2012 2013p In thousands
Employed 935.9 920.1 932 929.3 904.3
Government 271 258.8 258.6 258.8 242.3
Private 664.9 661.3 673.4 670.5 662 Construction and Mining 35.6 31.6 36.2 34 28.9 Trade, Transportation, Utilities 172.2 174.4 174.2 174 175
Information 18.8 18.4 18.7 19.1 19.5 Finance, Insurance, Services 45.9 43.9 44.5 45.2 44.4 Professional & Business Services 102.6 104.6 108.7 110.7 108.1
Manufacturing 88.2 85.7 82.6 77.1 76.9 Educational and Health Services 111.9 113.3 117.5 117.5 115.3 Leisure and Hospitality 70.4 70.8 72.9 74.7 75.8
Other Services 19.3 18.6 18.1 18.2 18.1
*Data for December of each year p: preliminary data Source: US Bureau of Labor Statistics 2013

ECONOMIC DEVELOPMENT PLAN FOR THE HEALTH SECTOR
10
Median Income
The 2011 data indicated that median household income in Puerto Rico was $19,122. The applicable minimum wage that year was $7.25/hour. The family median income was $22,296. Of all households (1,230,093), 60.70% had a mean income of $35,490. And 41.50% received some form of Social Security income. These households had a mean annual income of $10,912. Another 13.5% received retirement income with a mean of $13,190. The median earnings of males and females that are full time employees showed minimal differences with $22,793 for males and $21,889 females.
Table 11: Households Incomes Total households 1,230,093 Median household income $19,122 Mean household income $29,872 With earnings 746,974 60.70% Mean earnings $35,490 With Social Security 510,022 41.50% Mean Social Security income (dollars) $10,912 With retirement income 165,951 13.50% Mean retirement income $13,190 With Supplemental Security Income $4,322 0.40% Mean Supplemental Security Income (dollars) $7,274 With cash public assistance income $67,958 5.50% Mean cash public assistance income (dollars) $2,240 With Food Stamp/SNAP benefits in the past 12 months 427,492 34.80%
Families 905,467 Median family income $22,296 Mean family income $33,037 Nonfamily households 324,626 Median nonfamily income $10,862 Mean nonfamily income $18,640 Median earnings for workers $16,003 Median earnings for male full-time, year-round workers $21,793
Median earnings for female fulltime, year-round workers $21,889
Source: Community Survey 2012
Population Poverty Line
The percent of population under the poverty line in 2010 shows an increase compared with 2000 census, but still below that for 1990. This was mostly due to the lack of economic growth between years 2006 and 2010 and the decrease in employment.

ECONOMIC DEVELOPMENT PLAN FOR THE HEALTH SECTOR
11
Graphic 6: Population Under Poverty Line 1990-2010
Source: Community Survey 2012
Table 12: Families Under Poverty Line
Source: Community Survey 2012
Families and People Whose Income in the Past 12 Months is Below the Poverty Level
2012 2011 All families 40.60% 41.70% With related children under 18 years 50.90% 51.70% With related children under 5 years only 52.40% 50.00% Married couple families 28.90% 30.20% With related children under 18 years 32.20% 33.90% With related children under 5 years only 31.70% 34.50% Families with female householder, no husband present
57.40% 58.40%
With related children under 18 years 68.30% 68.60% With related children under 5 years only 70.20% 67.40%
55.30%
44.6% 45.30%
0.00%
10.00%
20.00%
30.00%
40.00%
50.00%
60.00%
1990 2000 2010
Historical Review
History
A historical review of the health system in Puerto Rico since the 1900’s reveals four mayor stages. The fi rst was the creation of the Puerto Rico Department of Health in 1912. The second stage was the creation of what is known as the “Arbona System” implemented in 1958. The third, the Puerto Rico Health Reform of 1993 and the fourth and last is MI Salud in 2010.
The beginning of the Puerto Rico Health Sector
The Department of Health was created under the Act No. 81 of March 14, 1912 directed by a commissioner under the governor orders. At this time the public health was provided by municipal and district hospitals. During this stage, the private sector consisted of private hospitals from churches or medical practices (i.e. Auxilio Mutuo in San Juan; Santo Asilo de Damas in Ponce; La Concepcion in San German.)
In 1946 the Hill-Burton Act was enacted. This act provided federal funds for the construction and improvement of hospitals in Puerto Rico. The act sought to give free or low-cost medical care and to increase the amount of hospital beds in the United States. The law never achieved its goal due to a lack of regulation and a national health policy. However, the act allowed the construction of public hospitals and strengthened the private health sector in Puerto Rico. By this time the government continued to fund the public health services, while the private care was reserved to the population with resources to pay for it. There was no system of health care at that time.

ECONOMIC DEVELOPMENT PLAN FOR THE HEALTH SECTOR
12
The Arbona System
In 1954 a reorganization and change in the structure of the public health system of Puerto Rico was recommended. Those recommendations had as its main purpose to create a regional health system. Following those recommendations, Dr. Guillermo Arbona and John B. Grant from the Rockefeller Institute created a new health model. They organized a hierarchical system with different levels of services to different levels of care and geographic services area. The Arbona system, as it was known, had a decentralized structure with an integrated system that coordinated the health care services.
Under this model, Puerto Rico was divided into homogenous regions. As criteria of demarcation, the system considered the size of municipalities, political boundaries, transportation networks and epidemiological profi les. Each region was composed from three to seven municipalities.
To ensure the access of health care, every municipality had a center that provided a primary level of care, which worked as an entry point to the health care system. The services were ranked by level of complexity. When a more specialized and highly complex service was needed, the patient was transferred to a more specialized hospital. With this concept the health system had a viable administration and ensured the access to services for the population.
The Arbona System had three levels of care: the primary, secondary and tertiary level. A fourth, more specialized level, was known as supra-tertiary level. A Health Care Center or Diagnostic and Treatment Center (CDT) located in each municipality provided the primary level services. In this level, basic services such as orientation for prevention of diseases, diagnosis, and treatment were offered. The medical teams were composed of general practitioners and specialists with the help of other health professionals such as nurses. At this level, the services were provided for patients whose management did not require surgical procedures or the use of advanced medical equipment. When a patient needed those services, he was transferred to the Area Hospital where the secondary level of care was provided. At the secondary level, the hospital offered specialized medical services such as Internal Medicine, Pediatrics, Surgery, Obstetrics and Gynecology, and sometimes subspecialists. The Area Hospitals were located in the municipalities of Carolina, Guayama, Humacao, Manati and Yauco.
The tertiary level of care was offered for patient that required medical expertise and advanced diagnostic equipment. The regional hospitals for tertiary care was located at Caguas, Arecibo, Fajardo, Bayamon, Ponce, Mayaguez, Aguadilla and San Juan. These centers also provided a Medical Intensive Care Unit and Coronary Intensive Care Unit. The Medical Center of San Juan provided the Supra-tertiary level of care for the island.

ECONOMIC DEVELOPMENT PLAN FOR THE HEALTH SECTOR
13
Figure 1: The Arbona Regionalization System (1954 - 1992)
Treat acute Conditions Support for chronic disease Rehabilitation In regional hospitals
Primary Level
Secondary Level
Tertiary Level
Supra-Tertiary Level
High specialized Care Complex Care Advanced diagnosis & treatment In Medical Centers of San Juan, Ponce and Mayaguez
Cure & Treatment Offered Internal Medicine, Ob & Gyn, and Pediatrics In Area Hospitals
Entry point of system Diagnosis & Treatment Preventive care In every municipality
Source: Adapted from Ramirez 2008
Development of the Public Health Sector in Puerto Rico
The Arbona System coincided with the government project “Bootstrap”, that was an integrated effort to develop the country’s economy in the short term and improve the socioeconomic conditions of the population. The system should contribute to the development of healthy and productive human resources that could contribute to this economic development.
Along with the Arbona Model in 1954, the private system grew in terms hospital beds, medical supplies and specialists in Puerto Rico. This growth was supported by health insurance industries and the economic development experienced during that date.
In 1960, the prevalence of chronic and degenerative diseases that required highly specialized medical management stimulated the build of the Puerto Rico Medical Center in Rio Piedras. With this, the government created the Pediatric Hospital and the University Hospital for Adults. Those hospitals worked as an academic center for medical research and the training of doctors and other health professionals that were studying in the School of Medicine of University of Puerto Rico established in 1950.
In 1965 the U.S. federal government, amended the Social Security Act, embracing Puerto Rico in the Medicare program for population over 65 years and the Medicaid program for low-income citizens. This represented a source of federal funds to fi nance the health system. These measures strengthened the provision of services and expanded the government institutions to provide health care services. It also promoted the development of the insurance industry in Puerto Rico.
During this time, the government also created an insurance to cover car accidents and to address work related accidents/conditions, creating insurances for drivers and injured workers. These organizations were the State Insurance Fund Corporation (SIFC) and the “Administracion de Compensacion por Accidentes Automovilísticos (ACAA).

ECONOMIC DEVELOPMENT PLAN FOR THE HEALTH SECTOR
14
A New Public Policy on Health
In 1976, under the administration of the Governor Rafael Hernandez Colón (1972–1976), he proposed a new public policy about the health care in Puerto Rico. This policy sought to ensure the best quality and access to health care for the population through prevention and primary care. As part of the new policy, the law 11 of June 23, 1976 known as The Puerto Rico’s Comprehensive Health Services Reform Act was enacted. This law is still active as an official public policy for the government. Its three main premises were:
1. The government of Puerto Rico will be responsible for providing access to health services for the population.2. The primary health care should be a priority in the health system. 3. The state should have the participation and collaboration of the private sector to address the health care
needs of the population.
Along with the new public policy, the government created an entity to work with the drug-addicted community in the island. Also, an amendment was made to create the General Health Council. A regulatory base for hospital facilities, health services in the public and private sector, and for the health professionals was also created.
In 1979, the Governor Carlos Romero Barceló (1976-1984) made the fi rst step towards the privatization of public health system, presenting his project “Democratization of Medicine”. The project consolidated the primary and secondary levels of care into the Area Hospitals and allowed the private administration of these facilities. That model shared the risk and costs between the Department of Health and the private administrator. Hence, the profi t generated by the private administrator worked as an incentive to be more effi cient when offering health services.
During the second administration of Governor Hernandez Colon (1984-1992), he enacted a law that regulated the contracts for the private administration of public health facilities in Puerto Rico. This law allowed the transfer of these facilities to private sector and worked as a tool for the privatization process in the Health Reform of 1993.
Puerto Rico’s Health Reform
In 1992, Puerto Rico had a dual health system. One ran by the government and the second one ran by private health insurances. The private model was perceived as efficient and with better quality. The public model was perceived to have a lack of access and with inferior services. The public model, which was based on the health regional system, presented an excess of expenditure and mismanagement of the fiscal resources. In addition, an increase in costs was projected, that would make it difficult to be assumed by the government.
In 1993, Pedro Roselló Gonzalez was elected as the governor of Puerto Rico. During his political campaign, he promised a health care reform that will provide health care insurance for the medically indigent population in Puerto Rico. The first effort was done with the implementation of Act No. 72 of September 7, 1993, which created the new Health Reform for Puerto Rico and a new public corporation: the Puerto Rico Health Insurance Administration (PRHIA). The new model sought to eliminate the disparities in health care services between public and private participants, ensure the access to services, and improve the service quality, the efficiency and effectiveness through competitive mechanisms. Through this model, the government changed his role from a health care provider to a health insurance provider.
With the reform, the Department of Health would be relegated to an agency for normative, regulatory issues and to oversee the general functioning of the health system. Then PRHIA would be authorized by law to make medical services contracts with insurance companies on the market and provide health insurance to indigent population.

ECONOMIC DEVELOPMENT PLAN FOR THE HEALTH SECTOR
15
To deal with the rising costs in medical technology of the public health system, the idea proposed by the Reform was to privatize all the public health system. With that, public and private systems were merged. By this time, the arguments were that with the free market forces, the health sector would grow and the cost would be lower.
In 2003, Governor Sila M. Calderon ended the privatization process of health facilities with the Law 3 of 2003. This law prohibited the sale, assignment, exchange and disposal of health facilities to private interests. The law also established that the Department of Health had the responsibility to provide health care to Puerto Rico’s population.
MI Salud
In 2010, Governor Luis G. Fortuño introduced a new model for the public health system known as MI SALUD. This new plan focuses in preventive care, and seeked to resolve the lack of access produced by the Puerto Rico Health Reform. Amongst the steps taken to improve services were.
• Eliminates referrals for in-network services• Extends hours of services.• 5% of premiums are retained for quality enforcement.• Prescriptions required no counter-signatures.• Expands population eligible for Medicaid using ACA funds.
The health care reform has been widely criticized since its implementation. The statistics does not support its performance in a positively way. In fact, the statistical report of the Department of Health in 2010 does not show an increase in quality and access of services provided by the public health care system. The number of hospital beds in privatized hospitals has decreased from 3,495 (1993) to 2,130 (2010), a reduction of -1.365 hospital beds. Something similar occurred with the number of active physicians in public hospitals. When the reform began, the public system had available about 3,000 physicians, this number decreased to 1,722 in 2010. Furthermore, the rate of hospital beds has decreased from 3.74 per 1000 inhabitants in 1993 to 2.3 beds per 1000 inhabitants in 2010. The next section will show a profi le for the actual Puerto Rico health sector and the transformation experienced by the public health system. Diagnosis of the Puerto Rico Health Care System
Health Sector Productivity
In 2012 the health sector in Puerto Rico grew by 2% when compared to 2011. Since 2003 the sector has contributed approximately 3.5% of annual gross domestic product, being the sixth most important productive sector in the economy of Puerto Rico. The value of services produced in 2012 amounted to $ 3.544 billion.
Table 13: GDP by Sector in Puerto Rico 2012
Source: Puerto Rico Planning Board
Gross Domestic Product 101,034.2 --
1 Manufacturing 46,113.9 45.6% 2 Real Estate and Rental 16,011.5 15.8% 3 Government 8,278.0 8.2% 4 Finance and Insurance 4,754.3 4.7% 5 Retail Trade 4,693.5 4.6% 6 Health Care and Social Services 3,544.0 3.5% 7 Wholesalers Trade 2,942.7 2.9%

ECONOMIC DEVELOPMENT PLAN FOR THE HEALTH SECTOR
16
Graphic 7: Health and Social Services as a percent of GDP
Source: Puerto Rico Planning Board
3.20%
3.30%
3.40%
3.50%
3.60%
2003 2004 2005 2006 2007 2008 2009 2010 2011 2012
% of GNP
Health Sector Employment and Establishment
Despite the decline experienced by the island’s economy since 2006, in 2011 the health sector had 7,293 medical establishments and generated 80,391 jobs.
Graphic 8: Health Sector Establishment and Workers
Table 14: Jobs by Medical Establishments Sizes
2006 2009 2011Number of
Establishments 6,649 7,223 7,2931 4 4,674 5,025 5,0875 9 1,101 1,232 1,26910 19 452 512 48720 49 261 274 26950 99 70 85 79100 249 43 39 48250 499 21 31 28500 999 21 20 20'1000 or more' 6 5 6
Source: Economic Census 2011
67,882 69,697
72,414 73,877
78,522 79,624 79,471 78,678 80,391
6,397 6,419 6,735
6,649
6,993 7,117
7,223 7,272 7,293
6,300
6,700
7,100
7,500
7,900
60,000
64,000
68,000
72,000
76,000
80,000
84,000
2003 2004 2005 2006 2007 2008 2009 2010 2011Paid Workers Establishment
Source: Economic Census 2011

ECONOMIC DEVELOPMENT PLAN FOR THE HEALTH SECTOR
17
The health sector in Puerto Rico is highly fragmented. It operates through many different types of establishments: from elderly care to highly specialized medical services. Most jobs are created in smaller establishments like medical offi ces. The sum of establishments with 1-4 employees increased to 5,087 in 2011 as compared to 4,674 in 2006. Of the 7,293 medical establishments that were in operation in 2011 only 6 generated more than 1,000 jobs.
Providers and Facilities
Hospitals and Hospital Beds
According to the Puerto Rico Health Department, until 2010 there were 68 hospitals established. Of these, 53 were private and 15 were public. Between 2007 and 2009 there were 8,660 hospital beds in service out of the 11,887 beds that were approved by the government. This number represents 72.8% of the total capacity of hospital beds throughout Puerto Rico. This means that there could be 3,227 more beds in use in our health system.
Table 15: Rate of Beds 2010
Beds Approved Beds in Use Capacity in Use Rate of Beds (2010)
11,887 8,660 72.8% 2.3/1,000
Source: Puerto Rico Health Department 2012
During the 1993 health reform, the rate of beds in use per 1,000 inhabitants in Puerto Rico declined from 3.74 in 1993 to 2.3 in 2010. The United States had a density of 2.6 beds per 1,000 inhabitants. When comparing this data with states of the United States in 2010, Puerto Rico would rank 36-37, next to Wisconsin, Connecticut and Rhode Island.
Table 16: Rate of Beds Compared to US States 2010
State Rate of Beds per 1,000 Rank
United Stated 2.6 -- Wisconsin 2.4 35
Connecticut 2.3 36 Rhode Island 2.3 37
Source: Center for Disease Control and Prevention 2010
If we compare the rate of beds in the Caribbean region, Puerto Rico is below Cuba, which has a rate 5.1 beds per 1,000 inhabitants.
Table 17: Rate of Beds Compared to Near Countries
Source: World Health Organization 2013
Country Rate of Beds per 1000
Cuba 5.1/,1000 Puerto Rico 2.3/1,000
Panama 2.4/1,000 Dominican Republic 1.7/1,000
Colombia 1.4/1,000

ECONOMIC DEVELOPMENT PLAN FOR THE HEALTH SECTOR
18
Hospitals by Region
Health system in Puerto Rico is divided in seven regions. Table 18 shows the number of hospital beds and hospitals by region according to the Department of Health. The San Juan metro region has the highest number with 4,900 available beds distributed in 16 hospitals. The lowest numbers of beds are in the Arecibo Region.
Table 18: Hospitals and Beds by Health Region in Puerto Rico
Hospitals Type Beds Hospitals by Region Private Public Arecibo Region 8 0 8 1,019 Aguadilla/Mayaguez Region 8 2 10 1,484
Ponce Region 9 1 10 1,797 Bayamon Region 4 1 5 1,211 Caguas Region 8 0 8 1,476 Metro San Juan Region 16 11 27 4,900 Total 53 15 68 11,887
Source: SARAFS 2010, PRHCA 2012
Figure 2: Health Regions in Puerto Rico
Source: ASES 2013
Arecibo North
San JuanNortheast
East
Southeast Southwest
West

ECONOMIC DEVELOPMENT PLAN FOR THE HEALTH SECTOR
19
Table 19: Population Facts of Health Regions 2012
Region Population Median Age Population Over 65
Median Income
Metro North 968,669 38.6 159,421 $22,691 Arecibo 456,036 37.6 71,183 $15,426
Aguadilla/ Mayaguez 535,488 37.6 46,924 $14,968
Ponce/ Guayama 565,683 36.5 43,842 $15,426 Bayamon 620,110 36.1 90,132 $19,251 Caguas 522,017 37.6 76,876 19,883
Source: Community Survey 2012
Health Care Professionals In Puerto Rico
According to the Puerto Rico Health Department’s Register in 2010 there were 76,701 health professionals registered. This shows an increase of 2,881 professionals between 2007 and 2010. Of that number, 63,144 were active in the island, 2,470 were active out of Puerto Rico and 11,074 were inactive.
Graphic 9: Health Professional Registered 2007 - 2010
Source: Health Professionals Register 2007-2010, Puerto Rico Health Department
73,826
41,826
2,0537,875
76,707
63,144
2,470 11,074
Total Actives in PR Actives Out PR Inactives
2007 2010
The registered professionals were divided between nurses, physicians, pharmacists, medical technologists and other professionals. Table 20 presents the registered health professionals by type of health profession according to Puerto Rico Health Department.

ECONOMIC DEVELOPMENT PLAN FOR THE HEALTH SECTOR
20
Table 20: Registered Health Professionals 2010 Total
Registered Active in PR
ActiveOut of PR Inactive Unspecified
Value % Value % Value % Value % Value % Health Professionals 76,707 100 63,144 100 2,470 100 11,074 13 100 Physicians 11,729 15.3 9,424 14.9 819 33.2 1,473 13.3 13 100 Nurses 32,271 42.1 26,404 41.8 1,005 40.7 4,862 43.9 0 0General Nurses 16,892 52.3 13,940 52.8 796 79.2 2,156 44.3 0 0Licensed Nurses 843 26.1 6,669 25.3 72 7 1,672 34.4 0 0Associated Nurses 5,894 18.3 4,871 8.4 111 11 2 8 0 0Specialist Nurses 1,031 3.2 902 3.4 26 2.6 103 2.1 0 0Obstetric Nurses 41 0.1 22 0.1 - 0 19 0.4 0 0
Total Pharmacist 8,669 11.3 7,199 11.4 231 9.4 1,239 11.2 0 0Assistant Pharmacist 5,676 65.5 4,692 65.2 17 7.4 967 78.0 0 0Pharmacist 2,993 34.5 2,507 34.8 214 92.6 272 22.0 0 0 Medical Technologist 3,476 4.5 2,926 4.6 42 1.7 508 4.6 0 0 Oral Health Professional 3,448 4.5 2,921 4.6 140 5.7 387 3.5 0 0Dentist 1,728 50.1 1,495 52.1 135 96.4 98 25.3 0 0Assistant Dentist 1,623 47.1 1,345 46 3 2.1 275 71.1 0 0
Dental Technologist
++ 1.7 53 1.8 0 0 6 1.6 0 0Dental Hygiene 38 1.1 28 1 2 1.4 8 2.1 0 0Other Professionals 17,108 22.3 14,270 22.6 233 9.4 2,605 23.5 0 0
Source: Health Professionals Register 2007-2010, Puerto Rico Health Department
Graphic 10: Health Professionals Active in Puerto Rico by Type 2007 - 2010
Source: Health Professionals Register 2007-2010, Puerto Rico Health Department
26,227
2,863
8,765
1,504
6,018
13,338
26,404
2,926
9,424
1,495
7,199
14,270
Nurses MedicalTechnologist
Physicians Dentist Pharmacist OtherProfessionals
2007 2010

ECONOMIC DEVELOPMENT PLAN FOR THE HEALTH SECTOR
21
Physicians
According to Department of Health, the number of active physicians in Puerto Rico has decreased slightly between 2004 and 2010, from 9,865 to 9,424 with a mayor drop in 2007 to 8,765. Along with the decreased of physicians, the number of hospital beds also dropped to 8,660 in 2009 from 9,422 in 2004. On this basis, when we compare this to hospital beds, Puerto Rico has more physicians than hospital beds. This does not means that there is no need for more physicians in the island.
Table 21: Physician and Hospital Beds in Puerto Rico
Source: Puerto Rico Health Department 2012
2004 2005 2006 2007 2008 2009 2010
Number of hospital beds 9,422 9,187 7,078 8,129 8,728 8,660Number of physicians 9,865 8,765 9,424
With 9,424 active physicians in Puerto Rico and a population of 3,725,789 people in 2010, the rate of physicians per 1000 inhabitants is 2.53. The data for the United States is higher with a rate of 2.58 physicians per 1000 inhabitants. When we compare this information with States where there are a large number of Puerto Ricans living, the density is similar with the state of Florida, which in 2010 had a density of 2.54 physicians per 1000 inhabitants. This rate is largely exceeded by the states of New York and Pennsylvania, which in U.S. rank as states number 3 and 11 respectively with the highest density of physicians per population. On the other hand, the density of physicians in Puerto Rico is much higher than Mississippi, which is the state with lowest per capita income. Mississippi has a density of 1.76 physicians per 1,000 inhabitants.
Table 22: Physician Density per 1000
Source: Association of American Medical Colleges
State Density per 1000 Rank Massachusetts 4.15 1 Maryland 3.68 2 New York 3.47 3 United States 2.58 -- California 2.56 20 Virginia 2.55 21 Florida 2.55 22 Puerto Rico 2.53 Wisconsin 2.53 23 Missouri 2.47 24 West Virginia 2.46 25 Arkansas 1.89 48 Idaho 1.84 49 Mississippi 1.76 50
If we compare the rate of physicians between near countries in the Caribbean region, Puerto Rico is above all countries except Cuba.

ECONOMIC DEVELOPMENT PLAN FOR THE HEALTH SECTOR
22
Table 23: Rate of Physicians in Caribbean Countries
Country Year Rate Cuba 2010 6.72 Puerto Rico 2010 2.54 Venezuela 2001 1.94 Dominican Republic 2000 1.88 Barbados 2005 1.81 Panama 2000 1.5 Colombia 2010 1.47 Trinidad & Tobago 2007 1.18 St Kitts & Nevis 2000 1.16 St. Vicent & Granadines 2001 0.75 St. Lucia 2002 0.47 Antigua & Barbuda 1999 0.17
Source: World Bank 2013
Table 24 shows the proportion of physicians by hospital type, between public and private hospitals. There is an average of 115 physicians per public hospital, while there is an average of 152 physicians per private hospital. If we consider only the active physicians by hospital, the average would be 91.3 physicians by public hospital and 101.7 physicians by private hospital.
Table 24: Physicians by Hospital Type
Hospital Type Physician Type2 Total
Public (15) Active Physicians 1379 Consulting Physicians 266 Courtesy Physicians 77
Total 1722
Private (53) Active Physicians 5388 Consulting Physicians 1050 Courtesy Physicians 1640
Total 8078 Source: Puerto Rico Health Department
Type of Physicians
Of the 9,424 physicians active in Puerto Rico, there are 2,896 general practitioners (generalists) and 6,528 specialists.
2 Active Physicians: Physicians who admit and treat patients in the hospital, working on committees, etc. Consulting Physicians: Physicians who do not admit patients to the hospital. Courtesy Physicians: Physicians who admit patients to the hospital but do not participate in the program guards, nor part of committees, or participate in the
activities of the faculty.

ECONOMIC DEVELOPMENT PLAN FOR THE HEALTH SECTOR
23
Graphic 11: Physicians Active in Puerto Rico 2010
Source: Health Professionals Register 2007-2010, Puerto Rico Health Department
Specialists6,528
Generalists2,896
Active in PR: 9,424
According to the Puerto Rico Health Department’s Register the most common specialties in Puerto Rico are Internal Medicine (1,300 physicians), Pediatrics (1,043 physicians) Family Medicine (498 physicians) and Obstetrics and Gynecology (475 physicians), followed by Physiatrist (413 physicians). (See Appendix 1)
The Medical-Surgeon College of Puerto Rico (MSCPR), lists 12,571 specialists in 60 specialties and subspecialties in Puerto Rico by 2013. Of these there are 18 specialties that have less than 10 physicians for all population. According to this list, the specialties with most needs are pediatrics and neurology. (Appendix 2)
The scarcity of physicians is diffi cult to demonstrate. There are different factors that determine the proper amount of doctors for any given population. The World Health Organization (WHO) estimates that a density lower than 2.3 medical workers (physicians, nurses, midwives) per 1,000 inhabitants puts at risk the development of the country. Fortunately, that is not the case for Puerto Rico because the number of doctors, nurses and midwives exceeds the minimum required for our population. But the lack of specialists in the island can result in an increased number of patients by each doctor, an increase in medical services’ cost and poor treatment of diseases.
According to the Medical-Surgeon College of Puerto Rico, the main reason for the decline of professional doctors in Puerto Rico is migration. In a study questioning the reasons for migration of doctors abroad, specifi cally to United States, doctors in the island and migrants indicated as main reasons: malpractice insurance costs and high costs to maintain private offi ces (utilities). Also physicians who practice in Puerto Rico are in an inferior salary scale compared with doctors working abroad. Besides, the lack of specialized medical care assistants as well as the increase in their wages contribute to the closure of medical offi ces in Puerto Rico (MSCPR 2012). Another reason for migration is the lack of medical residencies in Puerto Rico’s hospitals, forcing many students to do their residence abroad, get a job there and choosing not return to the island (Vanderbilt 2004).
Medical Schools
Puerto Rico has 4 schools of medicine and several residency programs, which could help increase the number of physicians available on the island and thus strengthen the health care system and promote its development. The rate of acceptance in these schools is below 10%, which could demonstrate the interest of young students in Puerto Rico

ECONOMIC DEVELOPMENT PLAN FOR THE HEALTH SECTOR
24
toward medical studies. Of those that are not accepted in Puerto Rico’s schools of medicine, many decide to migrate to Mexico, the Dominican Republic, Spain or the Virgin Islands.
There are 13 residency programs in Puerto Rico, which are provided by public and private hospitals in Puerto Rico. By 2012 there were 797 residency positions, of which about 190 are available each year for around 250 graduated students each year. This promotes that many students emigrate to medical residency programs abroad. Once in foreign countries, some remain abroad attracted by better working conditions. The lack of medical residency programs is a limiting fact for the development and retention of specialist physicians in Puerto Rico.
Table 25: School of Medicine in Puerto Rico
School of Medicine Enrolled Total Students
Rate of Acceptance
Cost Per Year (Residents)
Universidad Central del Caribe 65 300 6.4% $52,669 Ponce School Of Medicine 66 282 5.1% $56,765 Unviersidad de Ciencias Medicas de San Juan Bautista 59 211 7.7% $52,672 Puerto Rico School of Medicine 110 455 11.8% $37,037 PR School of Medicine Average 75 312 $49,786 US Average $51,971
Table 26: Medicine Programs Available in Puerto Rico
Source : ACGME
Program Location Residents Caguas Regional Hosp GUAYNABO 5 Damas Hospital Ponce 45 Dr. R E Betances-Mayaguez M C Mayaguez 15 Hospital Episcopal San Lucas Ponce 78 Ponce School of Medicine Ponce 10 San Juan City Hospistal San Juan 97 U Central Del Caribe Sch Med Bayamon 57 University of Puerto Rico School of Medicine San Juan 343 VA Caribbean Healthcare System San Juan 97 Dr. Pila's Hosp PONCE 14 Hospital de la Concepcion San German 16 Bella Vista Hospital Mayaguez 16 Hospital San Pablo BAYAMON 1 Hospital Dr Alejandro Otero Lopez Manati 3 Total Medicine Residents in Puerto Rico 2013 797
Health Care Expenditure
According to Puerto Rico Planning Board, personal spending for health care and funeral services in 2012 was $991.6 millions. This demonstrates an increase of 8% compared to 2011 at constant prices. That amount is higher than food spending, which in 2012 was $593.5 million dollars. Noting the behavior of both costs since 2006, the average personal expenditure related to health services and funeral services grew at 4.5% annually, while that for food rose only 0.1%. When looking at the data since 2009, spending on food has decreased -1.4%, possibly due to a decrease in population, while medical and funeral expenses increased.

ECONOMIC DEVELOPMENT PLAN FOR THE HEALTH SECTOR
25
Graphic 12: Food and Medical Service Personal Expenses
Source: Puerto i
Source: Puerto Rico Planning Board
2.6%0.5%
2.9%
-5.4%
1.0%-0.6% -0.5%
2.3%
6.9%
16.3%
3.3%
-6.4%
1.3%
7.6%
-10.0%
-5.0%
0.0%
5.0%
10.0%
15.0%
20.0%
-
200.0
400.0
600.0
800.0
1,000.0
1,200.0
2006 2007 2008 2009 2010 2011 2012
Food Medical and Funeral ServicesAnnual Change Food Annual Change M&F Services
Public Budget
Puerto Rico’s budget for health care agencies and corporations associated for public health, for FY 2013-2014 was $4,190.4 million. It represents over 40% of total government budget. The budget allocation for health over the last three fi scal years has remained above $4billions. ASES, which is the agency in charge of the public health care insurance services takes the largest share of the budget (See Table 27).
Table 27: Budgetary allocation for health Public Agency or Corporation 2010-11 2011-12 2012-13 2013-14
in thousands
Dept. of Health 913,652 876,093 830,169 821,214ASES 2,107,983 2,173,503 2,250,274 2,226,236CFSE 436,850 421,206 467,684 472,528ACAA 82,162 86,328 97,398 98,398ASEM 184,690 235,750 234,605 238,120Dept. of Correction 73,436 73,495 71,148 70,393ASSMCA 140,255 149,483 138,699 139,594Medical Emergency Corps 36,175 38,015 36,544 35,751Cardiovascular Center 89,622 89,171 89,531 88,158
Total Budget for Health 4,064,825 4,143,044 4,216,052 4,190,392
Source: Office of Management Budget
The total budget for agencies or health-related corporations does not necessarily represent government spending on health. The budgets includes public corporations that generate their own income from external sources. The State Insurance Fund Corporation (SIFC) and the Administration Automobile Accident (ACAA) are public insurances corporations. However these insurances are part of the health system.
Insured Population in Puerto Rico
Data from the Offi ce of the Commissioner of Insurance of Puerto Rico (OCI), shows that in 2012 95.9% of the population in Puerto Rico was covered by medical insurance. Of these 36.5% of the population was privately insured, 38.9% was with the private plan funded by the government of Puerto Rico and 20.2% were Medicare benefi ciaries. When comparing the 2012 population estimates with the insured population, the result is that 149,173 or 4.1% of the island’s population are uninsured.

ECONOMIC DEVELOPMENT PLAN FOR THE HEALTH SECTOR
26
Table 28: Population in Health Insurance
Health Insurance Coverage 2012 Private 1,337,356 36.5%Public 1,426,785 38.9%Medicare 741,685 20.2%Dept. of Correction 11,885 Total 3,517,711 95.9%Population 3,667,084 - w/o Insurance 149,173 4.1%
Source: Office of the Commissioner of Insurance, 2012
Private Insurers and Their Premiums
In Puerto Rico in 2012 there were twelve private health insurance companies that insured 1,337,356 people. Triple S Salud is the biggest one. In 2012 these private insurances generated $1,875.4 million in premiums. The sales of private health plans are divided among groups: individuals, public employees and retirees of local and federal government. Table 29 shows the distribution of insured and the premiums value by each group.
Table 29: Population and Premiums in Private Plans
Insured Premiums Private Group Plans 802,097 $1,070,811,858 Private Individual Plans 214,145 $207,421,202 Public Employees of Commonwealth of PR 211,007 $347,424,054
Retired Employees of Commonwealth of PR 57,009 $93,989,433
Federal Government Employees 53,098 $155,725,450 Total Private Plans 1,337,356 $1,875,371,997
Source: Office of the Commissioner of Insurance, 2012
Graphic 13: Population in Private Insurance
Source: Office of the
Commissioner of Insurance, 2012
Private Group
802,097Private
Individual 214,145
Public Employees
211,007
Retired 57,009
Federal Governm…
Insured and Costs of Public Health Insurance MI Salud
Puerto Rico Health Insurance Administration (ASES) had a budget of $2,250,274 million in FY 2012-2013 and insured 1,426,785 from MI Salud and part of the Medicare Platinum subscribers for a grand total of 1,684,678 participants in 2012. For this population the government paid a premium of $2,209,745,000 million.

ECONOMIC DEVELOPMENT PLAN FOR THE HEALTH SECTOR
27
Graphic 14: Insured by MI Salud
1,506,322
1,577,0931,604,648
1,648,678
1,450,000
1,500,000
1,550,000
1,600,000
1,650,000
1,700,000
2010 2011 2012 2013
The way that ASES provides the government health plan is through the contract of private medical healthcare plans. Of these private insurers, the principal is Triple S Health Insurance, which insured 1,337,356 people in 2012 (including participants of MI SALUD). In 2012 each health region of Puerto Rico had a contract for the provision of health insurance. The average contract rates for physical health was $ 118.15 per insured person. On the other hand, the insurance for mental health care was provided by APS Healthcare Puerto Rico. This insurer charges a fee of $ 8.47 per insured (mental health).
Table 30: Mi Salud Physical Care Tariffs (FY 2012-13)
Region Insurer Total East HUMANA $144.56 SouthEast HUMANA $127.88 Southwest HUMANA $120.16 North ASES/SSS TPA Contract $109.07 Metro North ASES/SSS TPA Contract $127.25 San Juan ASES/SSS TPA Contract $148.67 Northwest ASES/SSS TPA Contract $123.32 West ASES/SSS TPA Contract $102.42 Virtual ASES/SSS TPA Contract $63.60
Source: ASES 2013
Table 31: MI Salud Mental Care Tariff (FY 2012-13)
Region Mental Health Care Provider APS 2012-13 East APS $8.47 SouthEast APS $8.47 Southwest APS $8.47 North APS $8.47 Metro North APS $8.47 San Juan APS $8.47 Northwest APS $8.47 West APS $8.47 Virtual APS $8.47
Source: ASES 2013

ECONOMIC DEVELOPMENT PLAN FOR THE HEALTH SECTOR
28
Table 32: Medicare Insured
Type of Medicare Subscribers Premiums
Medicare Supplementary 28,795 36,537,346 Medicare Platinum 89,942 314,857,134 Medicare Advantage 423,461 4,439,170,323 Part A + Part B Medicare* 199,487 Total Advantage 741,685 4,790,564,803
Source: Office of the Commissioner of Insurance, 2012
Uninsured Population in Puerto Rico
As we have mentioned before, according to data from the OCI by 2012, 95.9% of the total population was insured. This results in a population of 149,173 uninsured or 4.1% of the population On the other hand, according to reports made by external consultants, the number of uninsured persons in Puerto Rico has benn decreasing since 2007, when there were 350,000 uninsured people. The most recent estimates for 2013 indicated that the number is around 282,000 uninsured. The reason for discrepancy in the offi cial numbers versus that of the external consultants can explained be the double count made by public agencies in their reporting.
Graphic 15: Reported Uninsured Population
Source: Figueroa, 2008; Advantage Consultin Group 2012 3
350,000
296,000282,000
250,000270,000290,000310,000330,000350,000370,000
2008 2012 2013
Anyhow, the proportion of insured population is high, reaching over 90%. If we get as correct that 149,173 people (4.5% of the population) are uninsured and compare that number with other states, Puerto Rico is above 49 states. Only surpassed by Massachusets, with 4.1% of their population uninsured according to 2012 census data. Below Puerto Rico are Vermont (7.0%), Hawaii (7.7%), District of Columbia (7.9%) and Connecticut (8.1%).
Table 33: Uninsured By State 2012
State Uninsured Population Rank
Massachusetts 4.10% 1 Puerto Rico 4.50% -- Vermont 7% 2 Hawaii 7.70% 3 District of Columbia 7.90% 4 Connecticut 8.10% 5
Source: Census 2012
3 2008, Perfi l de la población sin seguro de salud en Puerto Rico, Figueroa R. et.al. 2012, Puerto Rico Health Benefi ts Exchange Feasibility Assessment and Planning Project, Advantage Business Consulting.2013, Análisis de población sin seguro médico y sub-asegurada en Puerto Rico, Advantage Business Consulting.

ECONOMIC DEVELOPMENT PLAN FOR THE HEALTH SECTOR
29
Aggregated Expenditures on Health
If we add the amounts of government budget, private insurances and Medicare, and an estimate of self-insured expenditures, the aggregate expenditure on health for fi scal year 2012 was $11,878,938,800. That amount divided by the 2012 Census’ estimate of population (3,667,084) results in an aggregate per capita expenditure of $3,239,34 in Puerto Rico.
Table 34: Aggregated Expenditures on Health 2012
Health Coverage Premium Government Budget of Health Agencies (Including MI SALUD) $4,213,002,000
Private Premiums $1,875,371,997 Medicare $4,790,564,803 Auto insured $1,000,000,000 Total $11,878,938,800 Population estimate 2012 3,667,084 Per capita expenditure $3,239,34
Medicaid Spending Cap and Affordable Care Act Since the Medicaid program was established in 1965, federal Medicaid spending in insular areas as Puerto Rico, are subject to an annual limit or cap. As a result, the federal government will match every Medicaid dollar spent by the insular areas up to each area’s limit, and any insular area spending above the limit is not matched. This produced a lack of federal funds in comparison with the states. The cap to insular areas increased with the Affordable Care Act (ACA) to 35%.
With the Affordable Care Act (ACA), Puerto Rico received an increase in federal funds that began in 2012. The fi gure that the government of Puerto Rico will get until 2019 will be $7,268.6 million.
Health Outcomes
Although much of the population had a health care insurance funded by either the government or private citizens, the population of Puerto Rico continues to have chronic health problems that diminish the quality of life of citizens. The next few tables show the leading causes of death in Puerto Rico and the comparison with some of the U.S. states.
Value Rank Diabetes 70.2 3 of 56 Deaths Due Heart Diseases per 100,000 124.9 55 of 56 Cancer Deaths per 100,000 123.3 54 of 56 HIV/AIDS Cases 28.6 8 of 55 HIV Deaths Rate per 100,000 21.5 2 of 55
Source: Center for Disease Control and Prevention

ECONOMIC DEVELOPMENT PLAN FOR THE HEALTH SECTOR
30
Graphic 16: Leading Causes of Death, Puerto Rico 2010
* per 100,000 inhabitants
Source: Puerto Rico Department of Health 2012
125.7
123.8
70.4
46.1
36.7
26.5
26.2
23.8
26.3
20.0
0.0 50.0 100.0 150.0
Heart diseases
Malignant neoplasms
Diabetes mellitus
Alzheimer's disease
Cerebrovascular diseases
Chronic lower respiratory diseases
Accidents [non-intentional injuries]
Renal deseases
Homicides
Pneumonia and influenza
Table 35: Prevalence of Risk Factor and Chronic Diseases, Puerto Rico 2011
Source: Behavioral Risk Factor Surveillance System. Risk Factors.
Prevalence of Risk Factors and Chronic Diseases, Puerto Rico 2011 Indicator Male Female Total
Risk factors Current smoker 20.80% 9.40% 14.80% Lack of physical activities 39.60% 54.20% 47.30% Overweight or obese 71.10% 61.70% 66.10% Diseases Arthritis 13.4% 25.3% 19.7% COPD 2.1% 4.0% 3.1% Coronary heart disease 6.7% 7.6% 7.2% Current asthma 6.6% 13.2% 10.1% Depression 15.0% 18.5% 16.8% Diabetes 12.0% 14.2% 13.5% Heart attack 5.0% 4.6% 4.8% Kidney disease 1.8% 2.1% 2.0% Other type of cancer 2.9% 3.6% 3.3% Pre-diabetes 1.8% 2.5% 2.2% Skin cancer 0.9% 0.7% 0.8% Stroke 1.4% 2.0% 1.7%

ECONOMIC DEVELOPMENT PLAN FOR THE HEALTH SECTOR
31
CHAPTER 2: SWOT Analysis
Strengthens Weakness
Opportunities Threats
SWOT
SWOT Analysis
In this Chapter a Strengths, Weaknesses, Opportunities and Threats (SWOT) evaluation will be performed of the health care system of Puerto Rico. This analysis is preliminary and will feed of the remaining phases of this study.
Strengths
Puerto Rico’s health care system has many important strengths that may allow this sector to grow and continue to improve the quality of life of the patients it serves.
One of the most important ones is the fact that both the local and U.S. governments value this sector as one of the cornerstones of a developed and productive society. The total resources assigned to this sector show that it is a priority for public policy makers both local and abroad. It is estimated that expenditures on health care are over $10 billion a year in Puerto Rico. Although there is always more to be done, local government spending on this sector is the second highest only behind education, another pillar of our society. The allocation of these resources within the sector needs to be reevaluated and aligned to ensure better health outcomes and cost-effectiveness in the future. In such diffi cult economic times this is one of the few sectors in Puerto Rico that could thrive without signifi cant increases in spending.
Another temporary strength are additional Medicaid and other funds assigned by the Patient Protection and the Affordable Care Act of 2010 (ACA) to Puerto Rico. The ACA awarded $5.5 billion in additional funds to the state Medicaid program as well as $925 million of fl exible funds that the government decided to use to strengthen their

ECONOMIC DEVELOPMENT PLAN FOR THE HEALTH SECTOR
32
Medicaid program.4 These funds are available until 2019 and there is no guarantee they will be re-awarded. The implications of this will be discussed in the threats section of this analysis. These funds allow the MI Salud program to insure over 1.6 million lives, although not all are funded by Medicaid. It also provides relief to a scarce local government budget which historically has fi nanced most of the Government Health Insurance Program (GHIP).
One of the main objectives of the ACA was to remedy or at least alleviate the high uninsured population of the United States. Some estimates place the number of uninsured individuals at close to 50 million Americans. In Puerto Rico this problem is not as severe with under 300 thousand people uninsured which represents close to 7% of the total population which is signifi cantly better than the 15% the U.S.A. experienced before the ACA was enacted. While having your population insured is desired it is not the fi nal objective. The fi nal objective is to have a healthy populations which is not assured just by the fact of having health insurance.
Another strength of Puerto Rico’s health care system is medical infrastructure. There are several specialized health centers throughout the island that have advanced technology like gamma knifes for example that other countries in the Caribbean do not. Puerto Rico also possesses and ample supply of hospital beds and a solid group of health care professionals especially at the primary level. This is not so in the specialist and subspecialist groups.
Weaknesses
While Puerto Rico does enjoy several strength in its health care system it also endures several weaknesses and ineffi ciencies in the system. The most glaring weaknesses are that the system is very expensive and shows relatively poor health outcomes. Puerto Rico has one of the most expensive health care systems in the world spending close to $3,000.00 per capita a year. At the same time Puerto Rico has one of the highest obese and overweight prevalence (70%) in the US, extremely high diabetes (cifra) and hypertension rates (cifra) amongst other chronic conditions. These chronic conditions are related to high medical expenses, losses in productivity and premature deaths amongst other things.
These high medical expenses are attributed to the fragmentation of the health care system. While Puerto Rico historically has had a dual system, in other words a public and a private system working parallel, the change to a privatization model in the 1990s converted the whole system into a mainly profi t driven one. This has created an insurance driven market that has historically been known to create market distortions. These factors amongst others have created a fragmented system. The lack of proper incentives, care coordination and delay in the implementation of electronic health records have worsened the problem.
As a product of a reduction of medical residence programs, proper remuneration to health care professionals and a reduction in population Puerto Rico faces a shortage of medical specialist. For example a country with an extremely high prevalence of diabetics has less than 50 endocrinologist (verify cifra). Any substantial improvement in the health status of Puerto Ricans especially in the treatment of chronic conditions will require an adequate supply specialized physicians.
Another weakness and threat which becomes larger with each passing day is the limited resources available from the local government. The worsening fi scal situation continues to reduce the available paths to improve the countries health care system.
4 It is important to emphasize that Medicaid funds are matched in a 55% federal 45% local distribution currently. This means the state must match these funds with local ones to obtain the benefi ts.

ECONOMIC DEVELOPMENT PLAN FOR THE HEALTH SECTOR
33
Opportunities
In economic theory ineffi ciencies are always an opportunities to improve. The Puerto Rico health care system is not an exception. A fragmented health care system can always benefi t from integration. A better use of ineffi cient resources can lead to savings and better outcomes.
The historical approach to health care in Puerto Rico has always been one of inclusion, this has meant Puerto Rico has been a leader in health care management in past eras like the Arbona regional model. The Puerto Rico health care system is better than the United States in some categories. Puerto Rico has the chance to continue this philosophy and continue to improve. The social and cultural importance placed on health in Puerto Rico for decades has been extremely high. Public health systems like the Arbona model have been pioneers in the world. This concern and view on health provides an opportunity for growth and improvement.
Puerto Rico has an enormous opportunity with the $6.4 billion it will have received in Medicaid funds because of the Affordable Care Act. These funds must be consumed before 2019. There is enormous uncertainty of what will occur in 2020 but for the next several years it will be in an improved federal funding situation. It is important to note that because these funds require local matching (45%) then this implies that Puerto Rico fi scal problems might complicate the local portion but at the same time the federal funds (55%) are alleviating local coffers. These ACA funds have allowed an expansion of over 300,000 in 2011 and an additional 100,000 in 2014. Puerto Rico has an opportunity to assist the medically needed during the next 5-6 years in ways it has not been able to do until de ACA. By the same token if the ACA funds are not reauthorized then it is crucial the fi nancial situation of these citizens improve so that by 2019 they no longer need government assistance in obtaining health insurance.
Another medullar area that Puerto Rico has a chance to improve is it’s health information technology. Puerto Rico has access to millions in federal funds for the adoption of medical records and other tools. Any improvement in care coordination or reduction in duplicity of service must be preceded by an improvement in health IT. While Puerto Rico is in the process of implementing these systems it is of crucial importance to deploy these as quick as possible.
Better coordination of care and a larger emphasis on preventive care are ways in which Puerto Rico can improve the health of its citizens and generate enormous fi nancial savings. New models like the Patient Centered Medical Home (PCMH) and Accountable Care Organizations (ACO) are vehicles to obtain these savings and better care. Puerto Rico is in the process of developing a PCMH model for the western region of the Island that can positively impact the health of this population and move us towards a more effi cient system.
Puerto Rico has several medical facilities that are unique in the Caribbean. Devices like gamma knives and others are quite costly and Puerto Rico is fortunate to have them. Puerto Rico has a solid medical infrastructure especially in hospitals that can serve as a base for future growth of the sector.
Medical tourism has become a priority in recent years. We have seen the development of various hotels located next to hospitals. The one in Manatí was inaugurated this month. We have also seen the government actively discuss this as an alternative for growth. If Puerto Rico can improve the dissemination of health care metrics and increase the amount of foreign patients that acquire medical services in the island it can generate additional jobs and increase national production.
The health care sector is one of the better funded and highest priorities for the local and US governments. It is one of the few sectors that have shown growth in these recessionary years. The future of this sector relies on IT, better coordination of care and medical tourism.

ECONOMIC DEVELOPMENT PLAN FOR THE HEALTH SECTOR
34
Threats
Puerto Rico’s health care system faces large threats from a funding, population and provider perspective. In other words in both supply and demand for health services.
Funding
Puerto Rico’s health care system is funded by our local government, the federal government, businesses and individuals.The local government in Puerto Rico is going through one of it’s most diffi cult moments in recent history. Although the Puerto Rico Health Insurance Agency is the second highest funded agency in Puerto Rico the funds are not enough. Not only are they not enough but they will probably decrease in the next budget. This is aggravated by the fact that close to 2/3 of the Island’s population depend on the government for their health insurance.
Federal fund for MI Salud is at an all time high and should continue for the next several years. The threat is that there si no certainty of what will happen after the ACA funds expire. States do not have this issue because Medicaid matches their expenditures on Medicaid without a limit. In Puerto Rico our usual Medicaid funds are capped ($284M in 2013). This implies that after this amount the local government must pay with local funds which are not a problem in the states. The ACA has allowed PR to use Medicaid money over the cap but it did not remove it. Removal of this cap would be the single most benefi cial event that can occur in terms of fi nancing for the medically needed population of the island.People and businesses especial small and medium sized are struggling with higher taxes, a decrease in their demand and higher costs especially in energy. This makes it tougher for businesses to offer health insurance for their employees, citizens to purchase coverage and may place a higher burden on the government health plan.
Patients
Puerto Rico’s population is aging quickly. Life expectancy is increasing and birth rates have decreased. For the fi rst time in our history we have a median age (38) that is older than the United States. Not only is our population older, the younger cohorts are leaving the island in search of better opportunities which aggravates the problem. This phenomenon is and will continue to affect society in multiple ways like putting pressure on retirement systems, public services and others. It will undoubtedly affect the health care system as well because these individuals consume more health services than their younger counterparts.
Not only is our population aging it is also riddled with chronic health diseases like obesity, diabetes, asthma and cardio-vascular conditions amongst others. The need for better preventive care and disease management is enormous. Better education to improve patient behavior is also of the essence. While efforts are underway these outcomes of benefi ts take year to come into effect and will not all help in the short run.
Health Care Providers
Health care providers face several threats as well. They also face increased taxes, and high energy costs like other sectors. They also have to deal with an exodus of professionals and lack of new professional being educated locally. Medical school residence programs have decreased in recent years and many of the few that are being graduated will take their talents and education elsewhere. It is important for the government to develop a mechanism to correct this issue and have the proper foresight as these professional take years to develop.
Puerto Rico’s health care sector faces enormous threats. The two main ones are funding and the health status of an aging population. Although the fi rst one could be reduced with better federal funding and local economic growth, the second is much more complex. Puerto Rico must control the exodus of population, increase their birth rates and provided education and coordinated care for its citizens to achieve a better Puerto Rico for all.

ECONOMIC DEVELOPMENT PLAN FOR THE HEALTH SECTOR
35
References
1. Alameda J. & Ramirez L. (2012): El Costo de los Servicios de Salud en Puerto Rico: Perspectiva Económica; XIII Foro Industrial de la Salud Prognosis del Sistema de Salud de Puerto Rico
2. Association of American Medical Colleges: 2011 State physicians Workforce Data Book 3. Colegio de Médicos Cirujanos de Puerto Rico 2012: Costs of Medical Services in Puerto Rico 4. Diaz- Gines F. (2011): Puerto Rico Health & Insurance Conference 2011: “ A New Economic Health Care” 5. Gorrin Peralta J. (2011): Historia de la Salud Pública en Puerto Rico (Presentación); Escuela Graduada de Salud
Pública: Programa de Salud de la Madre y el(la) Niño(a) 6. Laborde J. (2013): El “Patient Protection and Affordable Care Act” y la Población No Asegurada de Puerto Rico:
Anual Health Care Update 7. Laborde J. (2013): Gastos y Datos Descriptivos de la Salud en Puerto Rico 8. Marin H. (2013): Seguros de Salud en Puerto Rico: Perfi l y Alternativas; Escuela Graduada de Salud Pública
RCM,UPR 9. Perfi l del Sistema de Salud de Puerto Rico Organización Panamericana de la Salud 2007: Washington DC 10. Planning for Health Care Improvement For The People of Puerto Rico (2004) Vanderbilt Center for Better Health
2004; University of Puerto Rico; Endowment for Health Services Research UPR School of Medicine 11. Puerto Rico Community Health Assesment: Secondary Data Profi le 2012: Departamento de Salud de Puerto Rico
& Insituto de Estadisticas de Puerto Rico 12. Ramirez R. (2010): Sistema de Salud de Puerto Rico: Sistema de Salud de Puerto Rico:Aspectos Políticos, Retos
& Aspectos Políticos, Retos & Posibles Soluciones Posibles Soluciones Presentación: Curso Medular en Salud Pública Escuela Graduada de Salud Pública
13. Registro de Profesionales de la Salud 2007 – 2010 Departamento de Salud Estado Libre Asociado de Puerto Rico

ECONOMIC DEVELOPMENT PLAN FOR THE HEALTH SECTOR
36
Apendix 1: Specialties Active in Puerto Rico Generalistas 2896
Especialistas 6528
Especialista Activos en PR
Medicina Interna 1300
Pediatría 1043
Medicina de Familia 498
Obstetricia y Ginecología 475
Psiquiatría 415
Cirugía General 226
Anestesiología 200
Medicina de Emergencia 181
Oftalmología 174 Medicina Preventiva General 152 Medicina Física y Rehabilitación 146
Radiología Diagnostica 143
Medicina Ocupacional 123
Gastroenterología 119
Neurología 109
Urología 82
Dermatología 72 Enfermedades Cardiovasculares 64
Enfermedades Infecciosas 62 Patología Anatómica y Clínica 49
Reumatologia 45
Nefrología 45
Radiología 40
Otorrinolaringología 40
Cirugía Ortopédica 40
Endocrinología 37
Medicina Nuclear 36
Hematología 34
Ortopedia 33 Psiquiatría de Niños y Adolescentes 32 Otorrinolaringología-Cirugía de Cabeza y Cuello 32
Patología Anatómica 28
Medicina Geriátrica 26
Fisiatría 26
Cirugía Neurológica 25 Cirugía Cardiovascular y Torácica 22 Cirugía Ortopédica y Fractura 19
Urología Adulta y Pediátrica 17
Cardiología 16
Sin Especificar 15 Cirugía Plástica y Reconstructiva 15
Neuroradiología 14 Ortopedia y Traumatología 13 Hematología y Oncología Pediátrica 13 Enfermedades Pulmonares 13 Endocrinología, Diabetes y Metabolismo 13
Alergia e Inmunología 13
Cirugía Plástica 12
Hematología y Oncología 11
Neurología Pediátrica 10
Ginecología 9
Cirugía de Mano 9
Cirugía Urológica 8
Radioterapia 7
Radiologia Terapeutica 7
Cirugía Pediátrica 7
Cirugía Colon-Recto 7 Radiologia Pediatirca 6
Radiación Oncológica 6
Psiquiatría Geriátrica 6
Patología Forense 5
Ortopedia Pediátrica 5
Cirugía Cabeza-Cuello 5 Radiologia Vascular e Intervencional 4
Patología 4
Neurología Clínica 4
Neuropatología 3
Neurofisiología Clínica 3
Neumología 3
Nefrología Pediátrica 3
Cirugía Vascular 3
Psiquiatría Forense 2
Oncología 2
Obstetricia 2
Neurología Vascular 2
Nefrología e Hipertensión 2
Medicina Deportiva 2
Citopatología 2
Cirugía Torácica 2
Cardiología Pediátrica 2
Cardiología Intervencional 2
Urología Pediátrica 1
Spinal Cord Injury 1 Reumatologia e Inmunologia 1
Retina y Vitreo 1
Radiologia Nuclear 1
Radiología intervencional 1
Proctología 1
Oncología Médica 1
Oftalmología Pediátrica 1
Neurotología 1
Neonatología 1 Medicina Submarina e Hiperbárica 1
Manejo del Dolor 1 Gastroenterología Pediátrica 1
Enfermedades Vasculares 1 Endocrinología y Metabolismo 1
Endocrinología Pediátrico 1
Dermapatologia 1 Cuidado Intensivo Pediátrico 1
Cuidado Crítico Quirúrgico 1
Cuidado Crítico 1
Cirugía Periferovascular 1
Cirugía Perifero Vascular y Cirugía General Cirugía Periferovascular 1
Cirugía Abdominal 1
Alergista Pediátrica 1
Cardiología Invasiva 1
Toxicología Médica 0
Psiquiatría de Niños 0
Perinatología 0
Patología Clínica 0 Patología Anatómica y Patología Oncologica 0 Neurología-Eeb & Epilepsia 0
Medicina Materno Fetal 0
Ginecología Oncológica 0
Anestesia Cardiovascular 0