![Presentacion sectores[com abr07]](https://static.fdocuments.us/doc/165x107/55b70d13bb61ebbf3b8b4592/presentacion-sectorescom-abr07.jpg)
Changing world - Austin Independent School District · desarrollo significativo en sectores como la...
44
THE AUSTIN INDEPENDENT SCHOOL DISTRICT :: ANNUAL REPORT DISTRITO ESCOLAR INDEPENDIENTE DE AUSTIN :: INFORME ANUAL 2010 CHANGING WITH THE WORLD CAMBIANDO CON EL MUNDO
Transcript of Changing world - Austin Independent School District · desarrollo significativo en sectores como la...

T H E A u S t i n I N D E P E N D E N T S c h o o l D I S T R I C T : : A N N u A l R E P O R T
D I S T R I T O e S c o l A r I N D E P E N D I E N T E D E A u S t i n : : I N F O R M E A N u A l
20
10
Changing with
the worldC A M B I A N D O C O N E l M u N D O
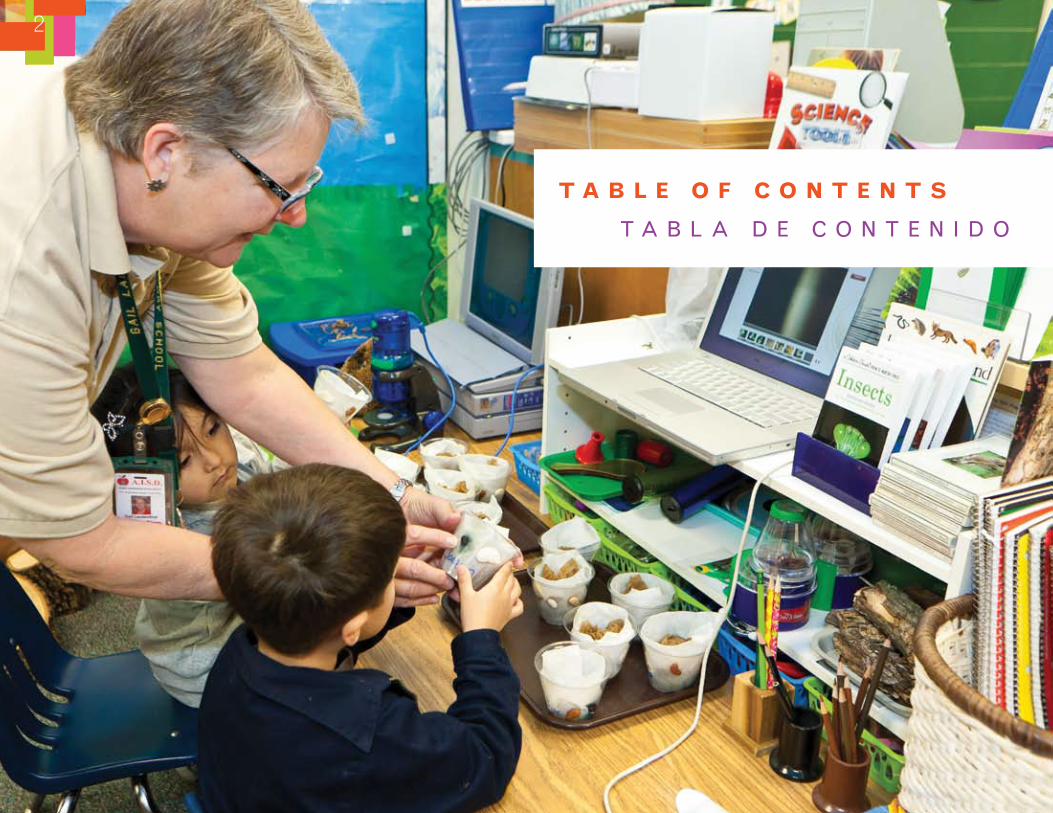
t A B l e o f c o n t e n t S
T A B l A D E C O N T E N I D O
2
4,6 Superintendent’sLetterCarta de la superintendente
8,10 President’sLetterMensaje del presidente
22 AustinISDBoardofTrusteesMesa Directiva de Austin ISD
EDucATIonEDUCACIÓN
13 StateAccountabilityRatings,2008-2010Índices Estatal es de responsabilidad, 2008-2010
13 AdequateYearlyProgress2010FederalAccountabilityRating campusReport Progreso Anual Adecuado (AYP) Índices de Responsabilidad Federal por plantel
13 AYPDistrictReportInforme AYP del distrito
14 TAKSGoals1-2Grades5to11TAKS metas 1-2 grados 5 a 11
14-16 TAKSPassingRatesforstudentsinAISDforatleastthree consecutiveyearsTAKS % de aprobados en AISD por lo menos tres años consecutivos
17-19 TAKSPassingRatesforstudentsnoTinAISDforatleastthree consecutiveyears TAKS % de aprobados que no estuvieron en AISD por lo menos tres años consecutivos
20-29 TAKSResultsbySubjectacrossallgrades,2005-2010 Resultados de TAKS por materia en todos los grados, 2005-2010
30 SATVerbal,Math,andWritingAverageScores,2009-2010: AISD,State,andnation Puntuaciones promedio en las secciones verbal, matemáticas y escritura de la prueba SAT, 2009-2010: AISD, estado y nación
30 SATPerformancebySubjectArea,classof2010 Aprovechamiento de SAT por áreas de materia, Clase de 2010
31 AustinISDAttendanceRateoverTime Asistencia de Austin ISD a lo largo del tiempo
32 completionRatesbyStudentGroup Índices de terminación por grupo estudiantil
33 PostsecondaryEnrollmentRatesbyStudentGroup Índices de matrícula post secundaria por grupo estudiantil
34 PostsecondaryEducationEducación post secundaria
35 TotalEnrollment,2007-2010Matrícula total, 2007-2010
35 EnrollmentbyPercentagesPorcentajes de matrícula
3
STAFFPERSONAL
37 AustinISDTeacherEthnicity,2009-2010 Etnicidad de maestros de Austin ISD, 2009-2010
37 AustinISDTeacherExperience,2009-2010 Experiencias de maestros de Austin ISD, 2009-2010
37 AISDTeacherAttrition,2008-2010Atrición de maestros de, AISD 2008-2010
RESouRcESRECURSOS
39 AISDTaxRates,2001-2011Tasas de impuestos de AISD, 2001-2011
40 GeneralFundExpendituresbyMajorobject,2010-2011 Gastos del fondo general por proyecto principal, 2010-2011
41 2010-2011GeneralFundRevenue2010-2011 Fondo general de ingresos
41 2010-2011GeneralFundExpenditures2010-2011 Gastos del fondo general
42 AISD’sRequiredPaymentstoState Pagos obligatorios al estado de parte de AISD
42 2010centralTexasSchoolDistrictPropertyTaxRates 2010 Tasas de impuestos a la propiedad en el centro de Texas
4
As Superintendent of Austin Independent School District, I am proud to present the District’s 2010 Annual Report: Changing With the World. It will give you a summary of Change that Counts: the facts and figures you need to measure the academic, operational and financial condition of AISD.
Our District is growing. At the beginning of the 2010-2011 school year, the number of students in AISD has increased by 800, reaching close to 86,000 students. The Austin region is growing as well, and the economy is seeing significant expansion in such industry sectors as health care and life sciences, information and computer technology, business and financial services, digital media and renewable energy.
Our District is improving. In school year 2009-2010, AISD made gains on virtually every TAKS standard. More than one-third of AISD schools moved up one or two levels in the State Accountability Rankings, and 62 percent of schools were rated Exemplary or Recognized under the state rating system.
Seven of eight schools came off of the state’s list of Academically Unacceptable schools, and no new schools were rated Academically Unacceptable this year. For the fourth year in a row, Austin students taking the SAT in 2010 exceeded both state and national overall average scores. Six AISD high schools were among Newsweek’s 2010 “America’s Best High Schools.” In 2010, our Finance Department earned a Gold Leadership Circle Award for “transparency” and, for the first time, a AAA bond rating. AISD was the eighth largest Green Power government purchaser in the U.S. and the only school district on the top ten list.
Our District is changing. While our student population has grown by six percent over the past five years, our Economically Disadvantaged student population has grown by 15 percent, and represents 63 percent of all AISD students. Over the past five years, our English Language Learner population has grown by 35 percent, and now comprises 29 percent of our student enrollment. We’ve seen a 14 percent growth in our Hispanic
students, a 10 percent decrease in our African American population, and a five percent drop in our Anglo student numbers.
This is our challenge and opportunity: To prepare our students for a future of jobs that may not yet exist, using technologies that haven’t been invented, in order to solve problems that we may not yet even know about. Think of this Annual Report as our scorecard that helps us keep up with the challenges, changes and improvements in the District, so that our kids can be ready for college, career and life in a rapidly evolving world.
Last year, the District adopted a five-year Strategic Plan to address this challenge. And we’re making progress toward our goals. Quality teaching is the greatest lever for improving student outcomes. We are providing more support for our teachers, by improving professional development programs and building a strategic compensation program to financially reward teachers whose students show academic gains. This year, AISD was awarded a five-year,
L E T T E R F R o M T h E S u P E R I n T E n D E n T
5
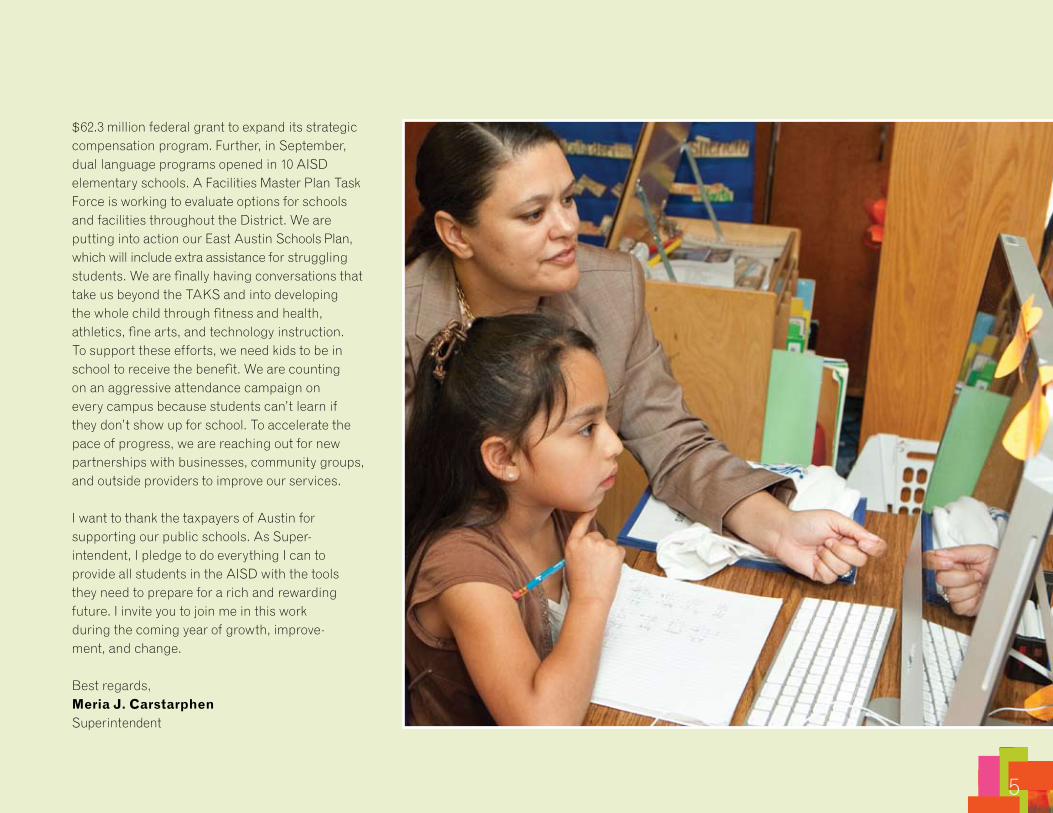
$62.3 million federal grant to expand its strategic compensation program. Further, in September, dual language programs opened in 10 AISD elementary schools. A Facilities Master Plan Task Force is working to evaluate options for schools and facilities throughout the District. We are putting into action our East Austin Schools Plan, which will include extra assistance for struggling students. We are finally having conversations that take us beyond the TAKS and into developing the whole child through fitness and health, athletics, fine arts, and technology instruction. To support these efforts, we need kids to be in school to receive the benefit. We are counting on an aggressive attendance campaign on every campus because students can’t learn if they don’t show up for school. To accelerate the pace of progress, we are reaching out for new partnerships with businesses, community groups, and outside providers to improve our services.
I want to thank the taxpayers of Austin for supporting our public schools. As Super-intendent, I pledge to do everything I can to provide all students in the AISD with the tools they need to prepare for a rich and rewarding future. I invite you to join me in this work during the coming year of growth, improve- ment, and change.
Best regards,MeriaJ.carstarphenSuperintendent

6
M E N S A j E D E L A S U P E R I N t E N D E N t E
En mi papel de superintendente del Distrito Escolar Independiente de Austin, tengo el honor de presentarles el Informe Anual del Distrito para 2010: “Cambiando con el mundo”. Dicho informe les dará un resumen del ‘Cambio que cuenta’, esto es, de los datos y cifras necesarias para evaluar las condiciones académicas, operativas y financieras de AISD.
Nuestro distrito está creciendo. A comienzos de este año académico 2010-11, el número de estudiantes de AISD tuvo un incremento de 800 individuos, con lo que ahora el total se aproxima a 86,000 estudiantes. También está creciendo toda la zona metropolitana de Austin, y la economía está experimentando un desarrollo significativo en sectores como la salud pública y las ciencias naturales, la tecnología e informática, los servicios financieros y empresariales, y los medios digitales y energías renovables.
Nuestro distrito está mejorando. Durante el año escolar de 2009-10, AISD mejoró sus resultados en prácticamente todos los niveles de la prueba TAKS. Más de un tercio de las escuelas de AISD ascendieron una o dos categorías en las clasificaciones de responsabilidad del estado. Otro 62% de las mismas recibieron una calificación de Ejemplar o Reconocida. De las ocho escuelas que se habían calificado de ‘académicamente inaceptables’,
siete lograron salir de tal clasificación, y este año no ha entrado ninguna nueva en esa lista. Por cuarto año consecutivo, los estudiantes que presentaron la prueba SAT en 2010 sobrepasaron las calificaciones promedio estatales y nacionales. Seis secundarias de AISD han aparecido en las listas de la revista Newsweek entre ‘las mejores escuelas secundarias de los Estados Unidos’. Nuestro departamento de finanzas, también en 2010, fue galardonado con el Gold Leadership Circle Award por su “transparencia” y, por primera vez, ha conseguido una clasificación para bonos de triple A (AAA). El Distrito fue también el consumidor número ocho de energía verde de los EE.UU. y el único distrito escolar entre los diez primeros puestos de la lista.
Nuestro distrito está transformándose. Mientras la población estudiantil crecía un 6% durante los últimos cinco años, el grupo de estudiantes en desventaja económica ha aumentado un 15%, representado ahora un 63% de todos los estudiantes de AISD. En el transcurso de los últimos 5 años, la cifra de estudiantes aprendices del idioma inglés se ha incrementado en un 35% y en este momento es el 29% del total de nuestro alumnado. Hemos también observado un crecimiento de un 14% en el grupo de estudiantes de origen hispánico, una disminución de un 10% en el grupo de los afroamericanos y una caída también del 5% en el grupo de estudiantes de origen caucásico.
Nos enfrentamos a este reto y a esta oportunidad: preparar a nuestros estudiantes para un futuro laboral que quizá todavía no exista, que va a contar con tecnologías que todavía no se han inventado, para intentar resolver problemas de los que todavía ni siquiera somos conscientes. Piensen en este Informe Anual como si fuese la cartulina de resultados que nos va ayudar a dar seguimiento a los retos, cambios y mejoras dentro del Distrito, para que así todos nuestros estudiantes puedan estar preparados para la universidad o una profesión, y para vivir en un mundo siempre cambiante.
El año pasado, el Distrito adoptó un plan estratégico a cinco años para tratar estos retos. Y los avances hacia esas metas se están dando. La calidad de la educación es el pilar más relevante para mejorar el rendimiento estudiantil. Les estamos dando más apoyo a nuestros maestros al mejorar programas de desarrollo profesional y diseñar un programa de compensación estratégica para recompensar monetariamente a aquellos maestros cuyos alumnos rindan más. Este año a AISD se le ha concedido $62,3 millones a un plazo de 5 años para poder ampliar ese programa estratégico de compensación. Además, en septiembre, se inauguraron programas de lenguaje dual en 10 primarias de AISD. Un Equipo Especial del Plan Maestro de Instalaciones está evaluando opciones
7
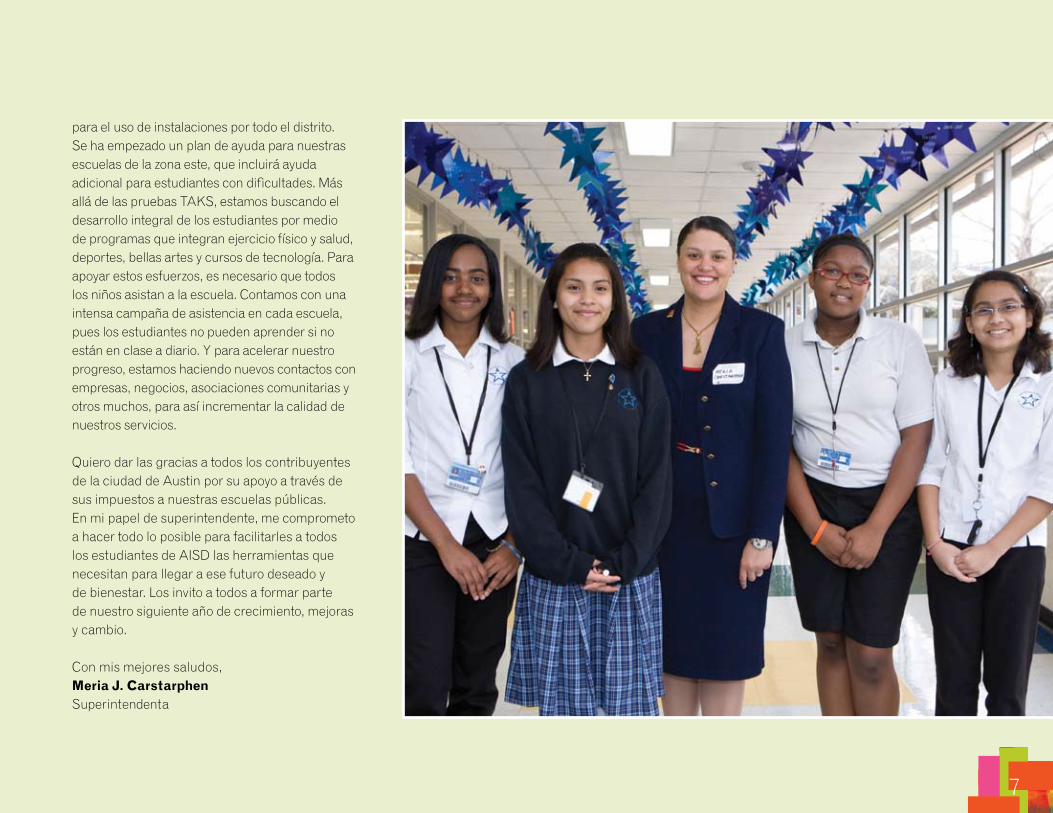
para el uso de instalaciones por todo el distrito. Se ha empezado un plan de ayuda para nuestras escuelas de la zona este, que incluirá ayuda adicional para estudiantes con dificultades. Más allá de las pruebas TAKS, estamos buscando el desarrollo integral de los estudiantes por medio de programas que integran ejercicio físico y salud, deportes, bellas artes y cursos de tecnología. Para apoyar estos esfuerzos, es necesario que todos los niños asistan a la escuela. Contamos con una intensa campaña de asistencia en cada escuela, pues los estudiantes no pueden aprender si no están en clase a diario. Y para acelerar nuestro progreso, estamos haciendo nuevos contactos con empresas, negocios, asociaciones comunitarias y otros muchos, para así incrementar la calidad de nuestros servicios.
Quiero dar las gracias a todos los contribuyentes de la ciudad de Austin por su apoyo a través de sus impuestos a nuestras escuelas públicas. En mi papel de superintendente, me comprometo a hacer todo lo posible para facilitarles a todos los estudiantes de AISD las herramientas que necesitan para llegar a ese futuro deseado y de bienestar. Los invito a todos a formar parte de nuestro siguiente año de crecimiento, mejoras y cambio.
Con mis mejores saludos,MeriaJ.carstarphenSuperintendenta

8
Wow. What a year. Lots of changes, lots of progress. It is clear that the Austin Independent School District is moving in the right direction. This Annual Report offers a transparent, accurate picture of the District’s academic and financial state for 2010, Dr. Meria Carstarphen’s first year leading our District as superintendent. As you will see, our students’ academic performance at the subject level, campus and district levels improved significantly over the past year. A new Strategic Plan was approved during school year 2010, and the District has already initiated new programs and reorganized operations to better serve our students and families. In addition, the District took significant steps to reduce its spending during school year 2010, which enabled a budget to be approved for school year 2011 which did not necessitate having to ask the voters to approve a tax increase.
Yet, even as improvement was made, we realize that our District is at a crossroads and must continue to change, just as the world changes around us. One of our overarching
goals is for all students to graduate ready for college, career and life in a globally competitive economy. That means not only having the core academic knowledge, but also being able to think critically, work collaboratively, utilize technology effectively and analyze and appropriately filter the multifaceted and never-ending media and data overload that seems to permeate the lives of today’s youth.
If we are to continue along the path of growth and improvement, we will need the backing and support of businesses, community members, other governmental entities, our student families and our Austin ISD staff, as we work together to improve student achievement in the face of static or declining resources. To achieve this objective, we must employ the Power of Us to ensure our students are coming to school every day healthy, fit and ready to learn, as well as improve the quality of our teachers in the classroom and enhance the learning and enrichment that our children experience while at school. We need to be strategic and
smart about the decisions and trade-offs we have to make to allocate our limited resources, including creating new partnerships as we seek to manage our tax dollars wisely.
On behalf of all our students and staff, I want to thank you for your commitment to our District, and I invite you to review the information in this Annual Report, and join me in supporting the Austin Independent School District in its mission of ensuring that every student has access to a world class education.
MarkJ.Williams, President Austin School District Board of Trustees
P R E S I D E n T ’ S L E T T E R

9
Thirty-six high school seniors were named National Merit Finalists. Treinta y seis estudiantes de cuarto año de secundaria fueron nombrados Finalistas de Mérito Nacional.
ChANgE thAt COUNtS CAMBIO QUE CUENTA

10
¡Ay! ¡Qué año! Muchísimos cambios y mucho progreso. Está claro que el Distrito Escolar Independiente de Austin va en la dirección correcta. El Informe Anual muestra de forma transparente y precisa el estado financiero y académico para el año 2010, el primer año en que la Dra. Meria Carstarphen ha estado a la cabeza del Distrito como superintendenta. Como podrán ver, el rendimiento académico de nuestros estudiantes a nivel de asignaturas, de las escuelas y de Distrito mejoró de forma significativa durante el año escolar 2010, el Distrito ya inició programas nuevos y reorganizó sus operaciones para servir más a nuestros estudiantes y a sus familias. Además, el Distrito tomó pasos importantes para reducir gastos durante el año escolar 2010, lo cual permitió que se aprobara un presupuesto para el año escolar 2011 sin tener que pedir a los votantes que aprobaran un aumento de impuestos.
No obstante los esfuerzos mencionados, estamos conscientes de que nuestro distrito se encuentra en una encrucijada y tiene que seguir transformándose, de la misma forma que lo hace
el mundo a nuestro alrededor. Una de nuestras metas ineludibles es que todos los estudiantes se gradúen preparados para la universidad, una carrera y la vida en una economía competitiva a nivel global. Eso significa, no sólo contar con todos los conocimientos básicos necesarios, sino también tener la habilidad de pensar de forma reflexiva, trabajar en colaboración con otros, usar tecnología de forma efectiva y analizar y procesar de manera adecuada la gran multitud de información presentan los medios de comunicación y parece formar una gran parte de la vida de los jóvenes de hoy.
Si queremos seguir creciendo y mejorando, necesitaremos el respaldo y apoyo de empresas, miembros de la comunidad, otras entidades gubernamentales, las familias de nuestros estudiantes y a el personal de Austin ISD, mientras trabajamos juntos para mejorar los logros de nuestros estudiantes ahora que nos enfrentamos a una situación en la que los recursos necesarios han disminuido, o no han aumentado. Para lograr este objetivo, debemos emplear El Poder de Nosotros
para asegurar que nuestros estudiantes vengan a la escuela todos los días sanos, saludables y listos para aprender, al igual que mejorar la calidad de nuestros maestros en el salón de clases y mejorar el aprendizaje y enriquecimiento que experimentan nuestros hijos mientras están en la escuela. Debemos ser sabios e intuitivos sobre las decisiones que debemos tomar y compromisos que debemos hacer para asignar nuestros limitados recursos, incluso la creación de colaboraciones nuevas mientras tratamos de administrar sabiamente los fondos de los contribuyentes.
En nombre de todos nuestros estudiantes y personal, quiero agradecerles su compromiso con el Distrito e invitarles a que revisen la información de este Informe Anual, y a que nos unamos todos y apoyemos al Distrito Escolar Independiente de Austin en su misión de garantizar que todos sus estudiantes tengan el acceso a educación de la más alta calidad.
MarkJ.Williams, Presidente Mesa Directiva del Distrito Escolar de Austin
M E N S A j E D E L P R E S I D E N t E

11
Ninety-nine percent of AISD schools met or exceeded TAKS standards, up from 93 percent in 2009, and 95 percent of schools met the federal Adequate Yearly Progress (AYP) standards, up from 94 percent in 2009.
Noventa y nueve por ciento de las escuelas de AISD cumplieron o sobrepasaron los estándares de TAKS, un aumento sobre el 93 por ciento de 2009, y un 95 por ciento de las escuelas cumplieron con los estándares federales de Progreso Anual Adecuado (AYP), mayor al 94 por ciento de 2009.
ChANgE thAt COUNtS CAMBIO QUE CUENTA

AISD made gains on virtually every TAKS standard in 2010. AISD mejoró en casi todos los estándares de TAKS en 2010.
ChANgE thAt COUNtS CAMBIO QUE CUENTA
12
E D u c A T I o n
E D U C A C I Ó N

13
table 1. STATEccounTABILITYRATInGS,2008-2010tabla 1. ÍNDICES EStAtAL ES DE RESPONSAbILIDAD, 2008-2010
2008 2009 2010
ExemplaryEjemplares 15 24 32
RecognizedReconocidas 19 30 36
AcceptableAceptables 63 46 41
Academically Unacceptable 11 8 1Académicamente inaceptables
99 percent of Austin schools met or exceeded state standards in 2010, and two-thirds of campuses were rated Exemplary or Recognized!
El 99 por ciento de las escuelas de Austin cumplieron o sobrepasaron los requisitos estatales en 2010 y dos terceras partes de las escuelas fueron calificadas como Ejemplares o Reconocidas.
table 2. ADEquATEYEARLYPRoGRESS2010FEDERALAccounTABILITYRATInGcAMPuSREPoRTtabla 2. PROgRESO ANUAL ADECUADO (AYP) ÍNDICES DE RESPONSAbILIDAD FEDERAL POR PLANtEL
2007-2008 2008-2009 2009-2010
Met AYPCumplieron AYP 96 102 109
Did Not Meet AYPNo cumplieron AYP 14 6 6
table 3. AYPDISTRIcTREPoRTtabla 3. INFORME AYP DEL DIStRItO
2007-2008 2008-2009 2009-2010
Met AYPCumplieron AYP YES NO NO
14
TAKSGoALS1-2GRADES5To11tAKS MEtAS 1-2 gRADOS 5 A 11
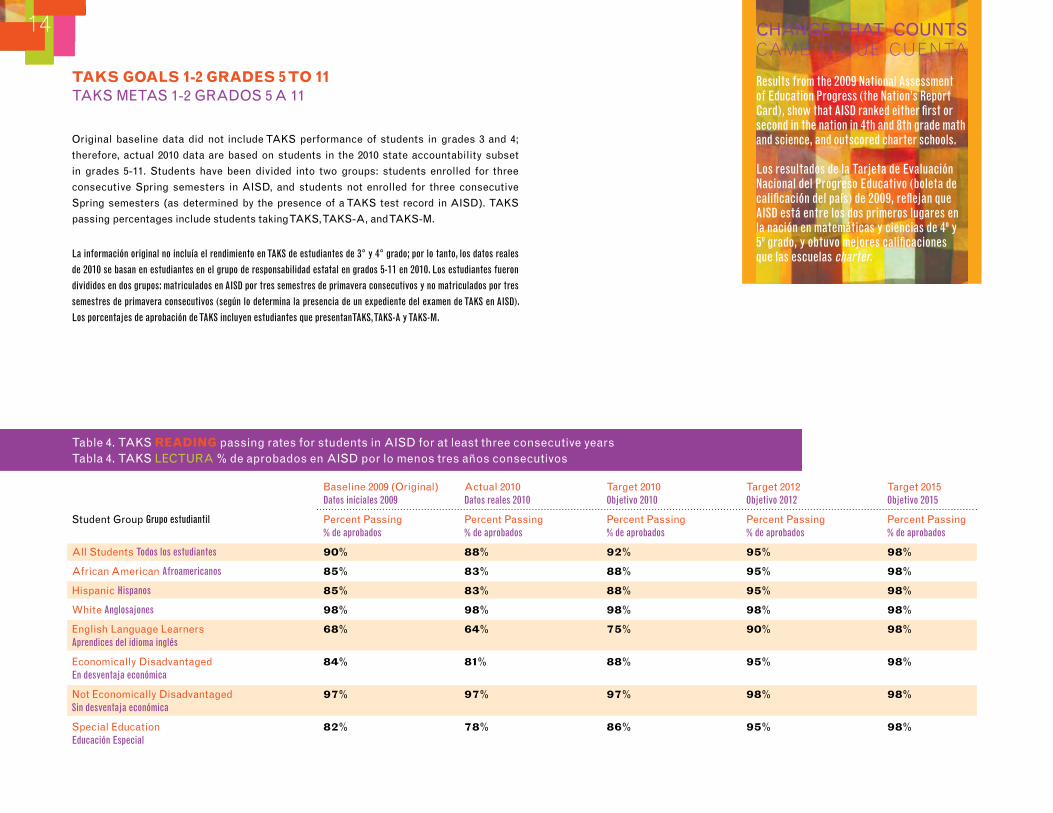
table 4. tAKS READInG passing rates for students in AISD for at least three consecutive yearstabla 4. tAKS LECtURA % de aprobados en AISD por lo menos tres años consecutivos
Original baseline data did not include tAKS performance of students in grades 3 and 4;
therefore, actual 2010 data are based on students in the 2010 state accountability subset
in grades 5-11. Students have been divided into two groups: students enrolled for three
consecutive Spring semesters in AISD, and students not enrolled for three consecutive
Spring semesters (as determined by the presence of a tAKS test record in AISD). tAKS
passing percentages include students taking tAKS, tAKS-A, and tAKS-M.
La información original no incluía el rendimiento en TAKS de estudiantes de 3° y 4° grado; por lo tanto, los datos reales
de 2010 se basan en estudiantes en el grupo de responsabilidad estatal en grados 5-11 en 2010. Los estudiantes fueron
divididos en dos grupos: matriculados en AISD por tres semestres de primavera consecutivos y no matriculados por tres
semestres de primavera consecutivos (según lo determina la presencia de un expediente del examen de TAKS en AISD).
Los porcentajes de aprobación de TAKS incluyen estudiantes que presentanTAKS, TAKS-A y TAKS-M.
baseline 2009 (Original) Actual 2010 target 2010 target 2012 target 2015 Datos iniciales 2009 Datos reales 2010 Objetivo 2010 Objetivo 2012 Objetivo 2015
Student groupGrupo estudiantil Percent Passing Percent Passing Percent Passing Percent Passing Percent Passing % de aprobados % de aprobados % de aprobados % de aprobados % de aprobados
All StudentsTodos los estudiantes 90% 88% 92% 95% 98%
African AmericanAfroamericanos 85% 83% 88% 95% 98%
hispanicHispanos 85% 83% 88% 95% 98%
WhiteAnglosajones 98% 98% 98% 98% 98%
English Language Learners 68% 64% 75% 90% 98% Aprendices del idioma inglés
Economically Disadvantaged 84% 81% 88% 95% 98% En desventaja económica
Not Economically Disadvantaged 97% 97% 97% 98% 98% Sin desventaja económica
Special Education 82% 78% 86% 95% 98% Educación Especial
Results from the 2009 National Assessment of Education Progress (the Nation’s Report Card), show that AISD ranked either first or second in the nation in 4th and 8th grade math and science, and outscored charter schools. Los resultados de la Tarjeta de Evaluación Nacional del Progreso Educativo (boleta de calificación del país) de 2009, reflejan que AISD está entre los dos primeros lugares en la nación en matemáticas y ciencias de 4º y 5º grado, y obtuvo mejores calificaciones que las escuelas charter.
ChANgE thAt COUNtS CAMBIO QUE CUENTA
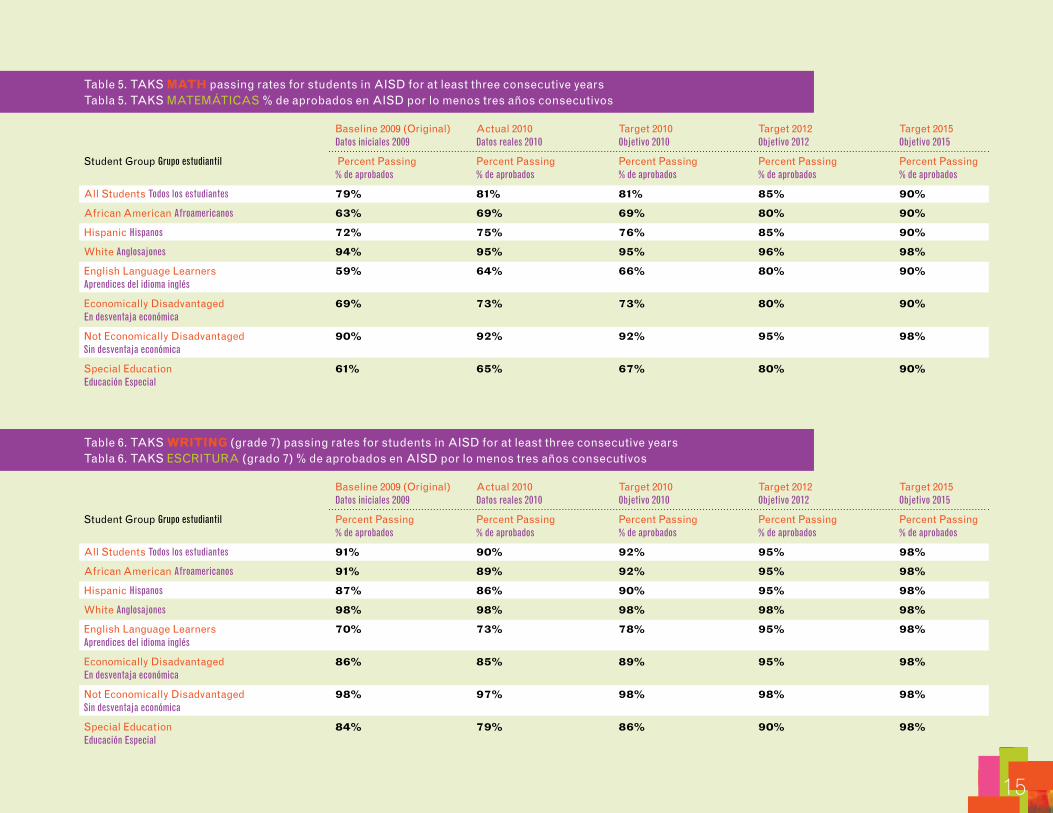
table 5. tAKS MATh passing rates for students in AISD for at least three consecutive yearstabla 5. tAKS MAtEMÁtICAS % de aprobados en AISD por lo menos tres años consecutivos
baseline 2009 (Original) Actual 2010 target 2010 target 2012 target 2015 Datos iniciales 2009 Datos reales 2010 Objetivo 2010 Objetivo 2012 Objetivo 2015
Student groupGrupo estudiantil Percent Passing Percent Passing Percent Passing Percent Passing Percent Passing % de aprobados % de aprobados % de aprobados % de aprobados % de aprobados
All StudentsTodos los estudiantes 79% 81% 81% 85% 90%
African AmericanAfroamericanos 63% 69% 69% 80% 90%
hispanicHispanos 72% 75% 76% 85% 90%
WhiteAnglosajones 94% 95% 95% 96% 98%
English Language Learners 59% 64% 66% 80% 90% Aprendices del idioma inglés
Economically Disadvantaged 69% 73% 73% 80% 90% En desventaja económica
Not Economically Disadvantaged 90% 92% 92% 95% 98% Sin desventaja económica
Special Education 61% 65% 67% 80% 90% Educación Especial
table 6. tAKS WRITInG (grade 7) passing rates for students in AISD for at least three consecutive yearstabla 6. tAKS ESCRItURA (grado 7) % de aprobados en AISD por lo menos tres años consecutivos
baseline 2009 (Original) Actual 2010 target 2010 target 2012 target 2015 Datos iniciales 2009 Datos reales 2010 Objetivo 2010 Objetivo 2012 Objetivo 2015
Student groupGrupo estudiantil Percent Passing Percent Passing Percent Passing Percent Passing Percent Passing % de aprobados % de aprobados % de aprobados % de aprobados % de aprobados
All StudentsTodos los estudiantes 91% 90% 92% 95% 98%
African AmericanAfroamericanos 91% 89% 92% 95% 98%
hispanicHispanos 87% 86% 90% 95% 98%
WhiteAnglosajones 98% 98% 98% 98% 98%
English Language Learners 70% 73% 78% 95% 98% Aprendices del idioma inglés
Economically Disadvantaged 86% 85% 89% 95% 98% En desventaja económica
Not Economically Disadvantaged 98% 97% 98% 98% 98% Sin desventaja económica
Special Education 84% 79% 86% 90% 98% Educación Especial
15
16
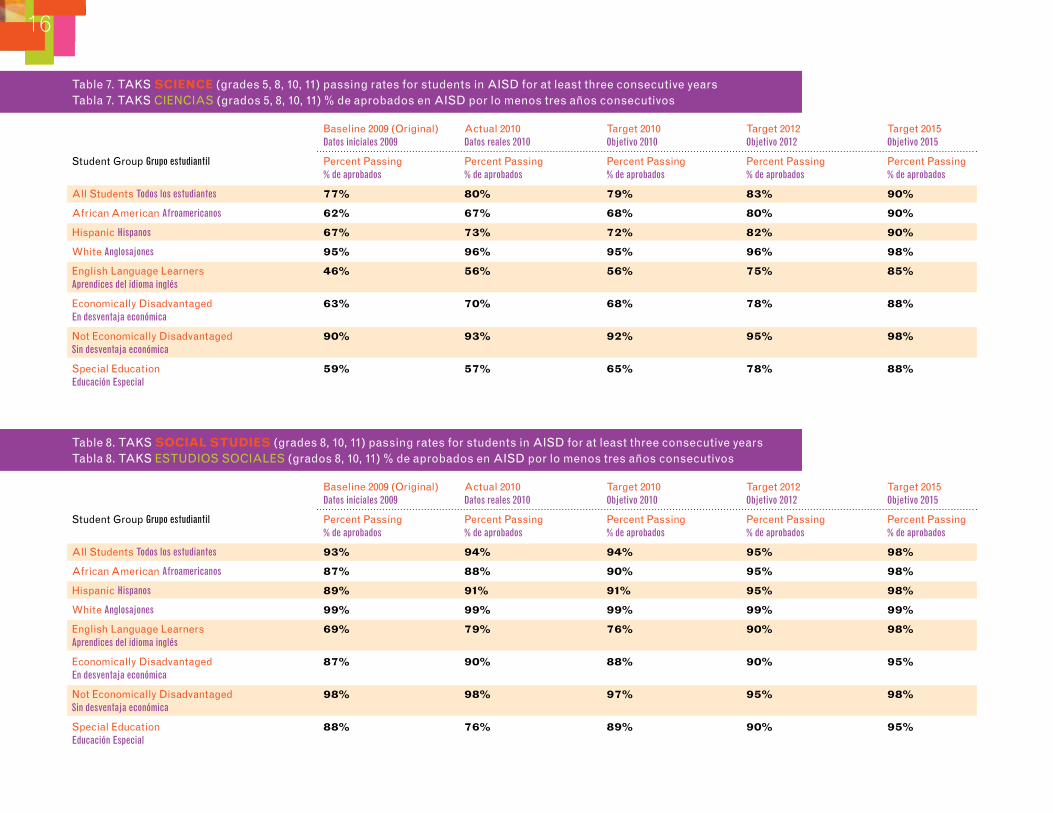
table 7. tAKS ScIEncE (grades 5, 8, 10, 11) passing rates for students in AISD for at least three consecutive yearstabla 7. tAKS CIENCIAS (grados 5, 8, 10, 11) % de aprobados en AISD por lo menos tres años consecutivos
baseline 2009 (Original) Actual 2010 target 2010 target 2012 target 2015 Datos iniciales 2009 Datos reales 2010 Objetivo 2010 Objetivo 2012 Objetivo 2015
Student groupGrupo estudiantil Percent Passing Percent Passing Percent Passing Percent Passing Percent Passing % de aprobados % de aprobados % de aprobados % de aprobados % de aprobados
All StudentsTodos los estudiantes 77% 80% 79% 83% 90%
African AmericanAfroamericanos 62% 67% 68% 80% 90%
hispanicHispanos 67% 73% 72% 82% 90%
WhiteAnglosajones 95% 96% 95% 96% 98%
English Language Learners 46% 56% 56% 75% 85% Aprendices del idioma inglés
Economically Disadvantaged 63% 70% 68% 78% 88% En desventaja económica
Not Economically Disadvantaged 90% 93% 92% 95% 98% Sin desventaja económica
Special Education 59% 57% 65% 78% 88% Educación Especial
table 8. tAKS SocIALSTuDIES (grades 8, 10, 11) passing rates for students in AISD for at least three consecutive yearstabla 8. tAKS EStUDIOS SOCIALES (grados 8, 10, 11) % de aprobados en AISD por lo menos tres años consecutivos
baseline 2009 (Original) Actual 2010 target 2010 target 2012 target 2015 Datos iniciales 2009 Datos reales 2010 Objetivo 2010 Objetivo 2012 Objetivo 2015
Student groupGrupo estudiantil Percent Passing Percent Passing Percent Passing Percent Passing Percent Passing % de aprobados % de aprobados % de aprobados % de aprobados % de aprobados
All StudentsTodos los estudiantes 93% 94% 94% 95% 98%
African AmericanAfroamericanos 87% 88% 90% 95% 98%
hispanicHispanos 89% 91% 91% 95% 98%
WhiteAnglosajones 99% 99% 99% 99% 99%
English Language Learners 69% 79% 76% 90% 98% Aprendices del idioma inglés
Economically Disadvantaged 87% 90% 88% 90% 95% En desventaja económica
Not Economically Disadvantaged 98% 98% 97% 95% 98% Sin desventaja económica
Special Education 88% 76% 89% 90% 95% Educación Especial
17
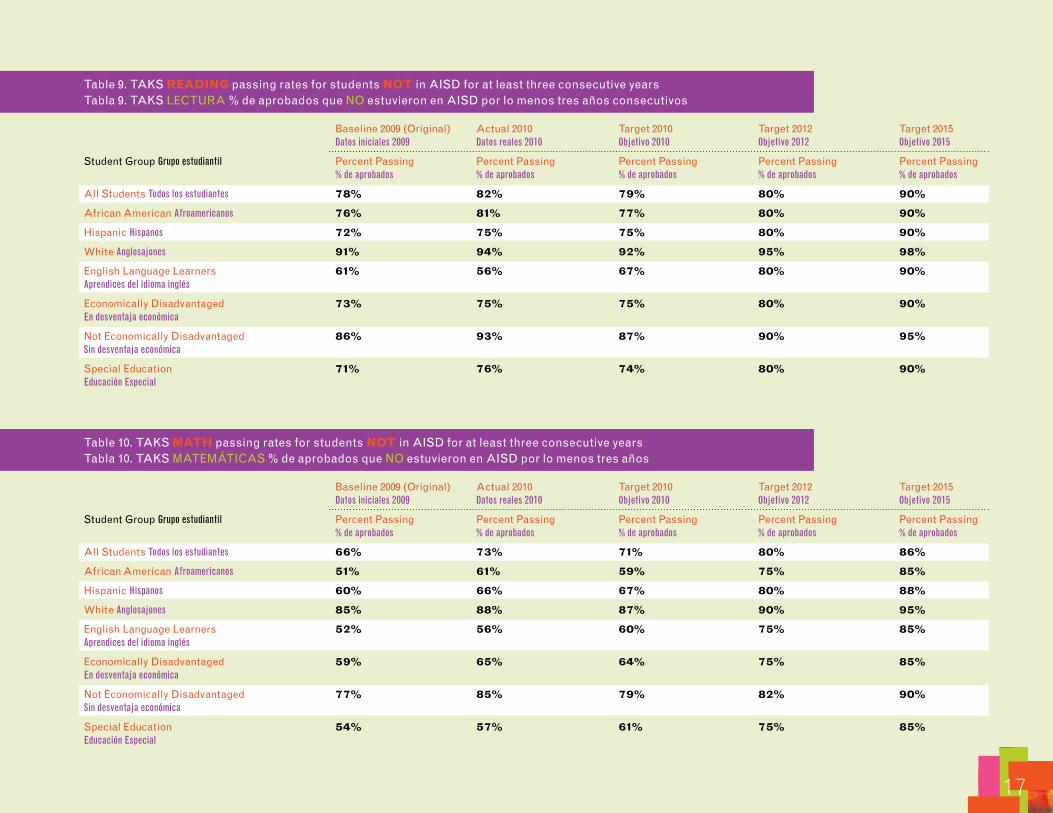
table 9. tAKS READInG passing rates for students noT in AISD for at least three consecutive yearstabla 9. tAKS LECtURA % de aprobados que NO estuvieron en AISD por lo menos tres años consecutivos
baseline 2009 (Original) Actual 2010 target 2010 target 2012 target 2015 Datos iniciales 2009 Datos reales 2010 Objetivo 2010 Objetivo 2012 Objetivo 2015
Student groupGrupo estudiantil Percent Passing Percent Passing Percent Passing Percent Passing Percent Passing % de aprobados % de aprobados % de aprobados % de aprobados % de aprobados
All StudentsTodos los estudiantes 78% 82% 79% 80% 90%
African AmericanAfroamericanos 76% 81% 77% 80% 90%
hispanicHispanos 72% 75% 75% 80% 90%
WhiteAnglosajones 91% 94% 92% 95% 98%
English Language Learners 61% 56% 67% 80% 90% Aprendices del idioma inglés
Economically Disadvantaged 73% 75% 75% 80% 90% En desventaja económica
Not Economically Disadvantaged 86% 93% 87% 90% 95% Sin desventaja económica
Special Education 71% 76% 74% 80% 90% Educación Especial
table 10. tAKS MATh passing rates for students noT in AISD for at least three consecutive yearstabla 10. tAKS MAtEMÁtICAS % de aprobados que NO estuvieron en AISD por lo menos tres años
baseline 2009 (Original) Actual 2010 target 2010 target 2012 target 2015 Datos iniciales 2009 Datos reales 2010 Objetivo 2010 Objetivo 2012 Objetivo 2015
Student groupGrupo estudiantil Percent Passing Percent Passing Percent Passing Percent Passing Percent Passing % de aprobados % de aprobados % de aprobados % de aprobados % de aprobados
All StudentsTodos los estudiantes 66% 73% 71% 80% 86%
African AmericanAfroamericanos 51% 61% 59% 75% 85%
hispanicHispanos 60% 66% 67% 80% 88%
WhiteAnglosajones 85% 88% 87% 90% 95%
English Language Learners 52% 56% 60% 75% 85% Aprendices del idioma inglés
Economically Disadvantaged 59% 65% 64% 75% 85% En desventaja económica
Not Economically Disadvantaged 77% 85% 79% 82% 90% Sin desventaja económica
Special Education 54% 57% 61% 75% 85% Educación Especial
18
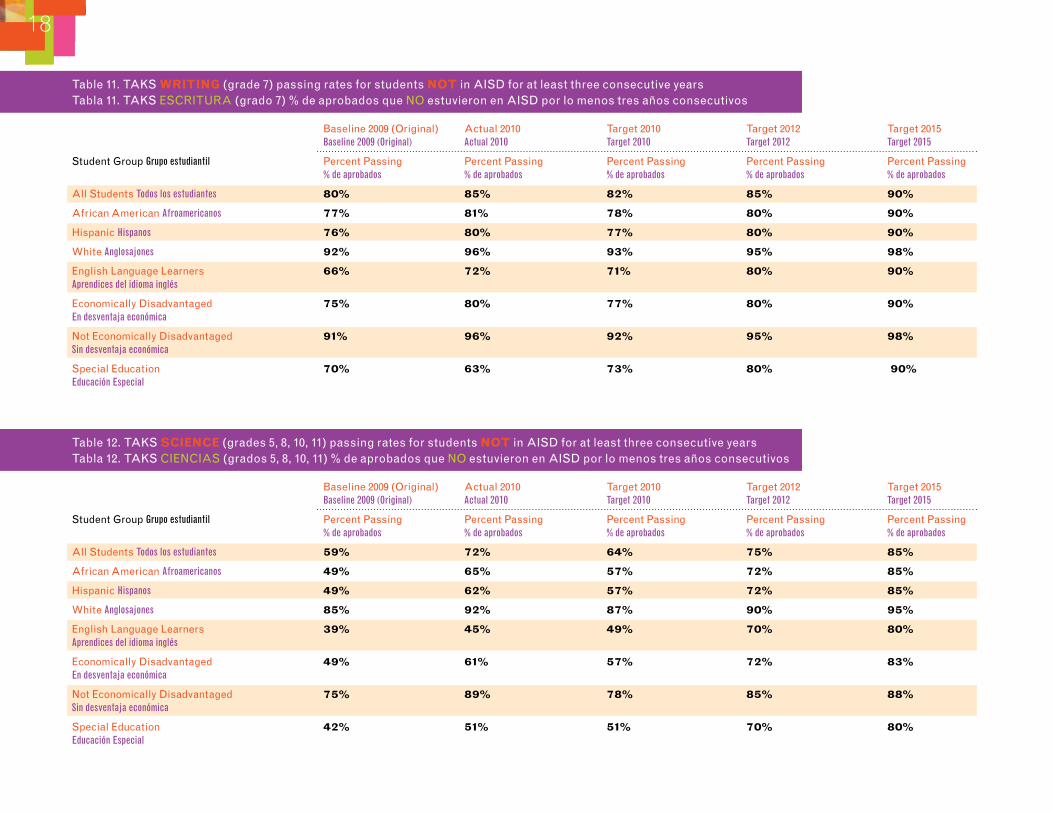
table 11. tAKS WRITInG (grade 7) passing rates for students noT in AISD for at least three consecutive yearstabla 11. tAKS ESCRItURA (grado 7) % de aprobados que NO estuvieron en AISD por lo menos tres años consecutivos
baseline 2009 (Original) Actual 2010 target 2010 target 2012 target 2015 Baseline 2009 (Original) Actual 2010 Target 2010 Target 2012 Target 2015
Student groupGrupo estudiantil Percent Passing Percent Passing Percent Passing Percent Passing Percent Passing % de aprobados % de aprobados % de aprobados % de aprobados % de aprobados
All StudentsTodos los estudiantes 80% 85% 82% 85% 90%
African AmericanAfroamericanos 77% 81% 78% 80% 90%
hispanicHispanos 76% 80% 77% 80% 90%
WhiteAnglosajones 92% 96% 93% 95% 98%
English Language Learners 66% 72% 71% 80% 90% Aprendices del idioma inglés
Economically Disadvantaged 75% 80% 77% 80% 90% En desventaja económica
Not Economically Disadvantaged 91% 96% 92% 95% 98% Sin desventaja económica
Special Education 70% 63% 73% 80% 90% Educación Especial
table 12. tAKS ScIEncE (grades 5, 8, 10, 11) passing rates for students noTin AISD for at least three consecutive yearstabla 12. tAKS CIENCIAS (grados 5, 8, 10, 11) % de aprobados que NO estuvieron en AISD por lo menos tres años consecutivos
baseline 2009 (Original) Actual 2010 target 2010 target 2012 target 2015 Baseline 2009 (Original) Actual 2010 Target 2010 Target 2012 Target 2015
Student groupGrupo estudiantil Percent Passing Percent Passing Percent Passing Percent Passing Percent Passing % de aprobados % de aprobados % de aprobados % de aprobados % de aprobados
All StudentsTodos los estudiantes 59% 72% 64% 75% 85%
African AmericanAfroamericanos 49% 65% 57% 72% 85%
hispanicHispanos 49% 62% 57% 72% 85%
WhiteAnglosajones 85% 92% 87% 90% 95%
English Language Learners 39% 45% 49% 70% 80% Aprendices del idioma inglés
Economically Disadvantaged 49% 61% 57% 72% 83% En desventaja económica
Not Economically Disadvantaged 75% 89% 78% 85% 88% Sin desventaja económica
Special Education 42% 51% 51% 70% 80% Educación Especial

The Texas Business and Education Coalition named four Austin schools to its 2010 Honor Roll. La Coalición de Empresas y Educación de Texas nombró a cuatro escuelas de Austin a su Cuadro de Honor de 2010.
ChANgE thAt COUNtS CAMBIO QUE CUENTA
table 13. tAKS SocIALSTuDIES (grades 8, 10, 11) passing rates for students noT in AISD for at least three consecutive yearstabla 13. tAKS EStUDIOS SOCIALES (grados 8, 10, 11) % de aprobados que NO estuvieron en AISD por lo menos tres años consecutivos
baseline 2009 (Original) Actual 2010 target 2010 target 2012 target 2015 Baseline 2009 (Original) Actual 2010 Target 2010 Target 2012 Target 2015
Student groupGrupo estudiantil Percent Passing Percent Passing Percent Passing Percent Passing Percent Passing % de aprobados % de aprobados % de aprobados % de aprobados % de aprobados
All StudentsTodos los estudiantes 79% 89% 79% 80% 90%
African AmericanAfroamericanos 73% 86% 75% 80% 90%
hispanicHispanos 74% 85% 76% 80% 90%
WhiteAnglosajones 94% 98% 94% 95% 98%
English Language Learners 64% 74% 69% 80% 90% Aprendices del idioma inglés
Economically Disadvantaged 72% 84% 75% 80% 90% En desventaja económica
Not Economically Disadvantaged 89% 96% 91% 95% 98% Sin desventaja económica
Special Education 66% 68% 71% 80% 90% Educación Especial
19
20
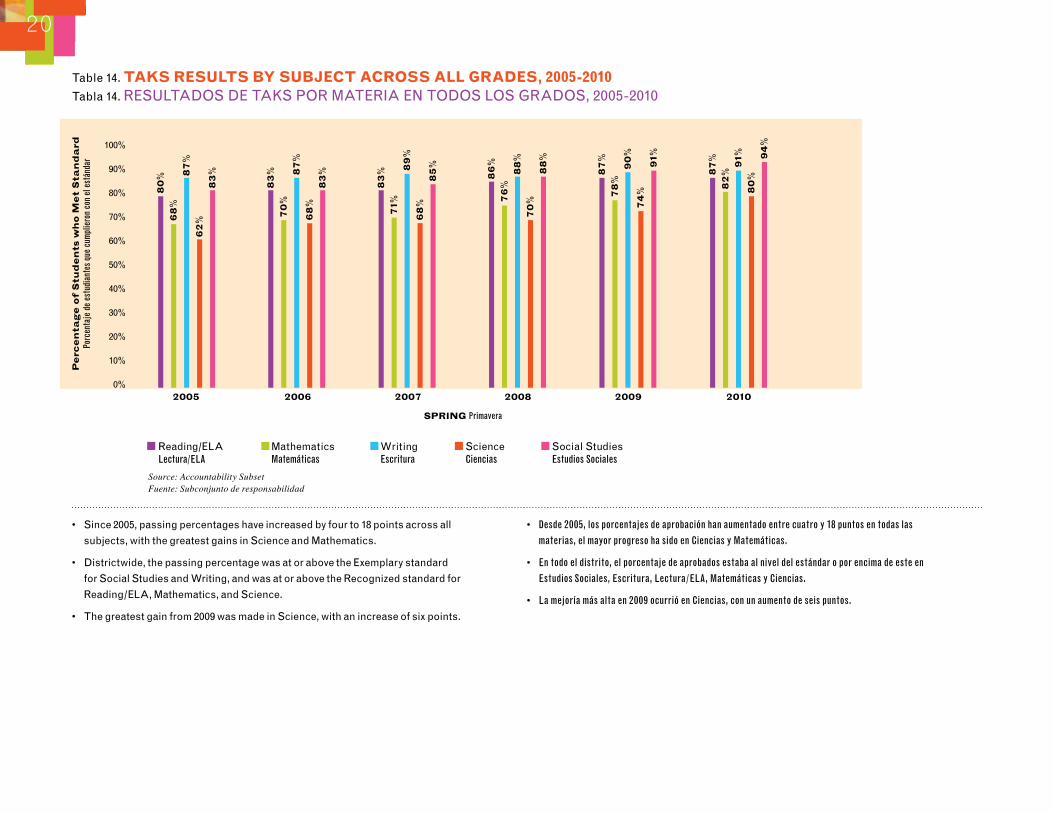
table 14. TAKSRESuLTSBYSuBJEcTAcRoSSALLGRADES,2005-2010tabla 14. RESULtADOS DE tAKS POR MAtERIA EN tODOS LOS gRADOS, 2005-2010
Reading/ELA Mathematics Writing Science Social StudiesLectura/ELA Matemáticas Escritura Ciencias Estudios Sociales
80
%6
8%
87
%6
2%
83
%
83
%7
0%
87
%6
8%
83
%
83
%7
1%8
9%
68
%8
5%
86
%7
6%
88
%7
0%
88
%
2005 2006 2007 20080%
10%
20%
30%
40%
50%
60%
70%
80%
90%
100%
Source: Accountability SubsetFuente: Subconjunto de responsabilidad
87
%7
8%
90
%7
4%
91%
87
%8
2%
91%
80
%9
4%
2009 2010
Pe
rce
nta
ge
of
Stu
de
nts
wh
oM
et
Sta
nd
ard
Porc
enta
je d
e es
tudi
ante
s que
cum
plie
ron
con
el e
stán
dar
SPRINGPrimavera
• Since 2005, passing percentages have increased by four to 18 points across all
subjects, with the greatest gains in Science and Mathematics.
• Districtwide, the passing percentage was at or above the Exemplary standard
for Social Studies and Writing, and was at or above the Recognized standard for
Reading/ELA, Mathematics, and Science.
• the greatest gain from 2009 was made in Science, with an increase of six points.
• Desde 2005, los porcentajes de aprobación han aumentado entre cuatro y 18 puntos en todas las
materias, el mayor progreso ha sido en Ciencias y Matemáticas.
• En todo el distrito, el porcentaje de aprobados estaba al nivel del estándar o por encima de este en
Estudios Sociales, Escritura, Lectura/ELA, Matemáticas y Ciencias.
• La mejoría más alta en 2009 ocurrió en Ciencias, con un aumento de seis puntos.
21
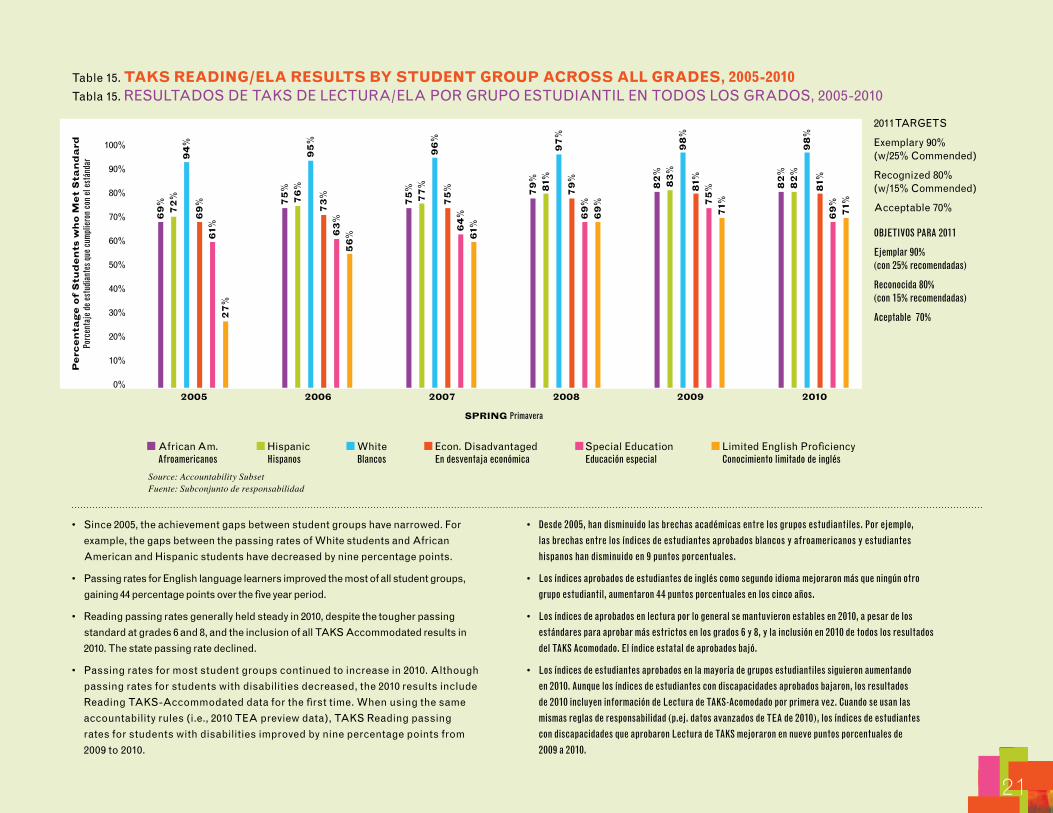
table 15. TAKSREADInG/ELARESuLTSBYSTuDEnTGRouPAcRoSSALLGRADES,2005-2010tabla 15. RESULtADOS DE tAKS DE LECtURA/ELA POR gRUPO EStUDIANtIL EN tODOS LOS gRADOS, 2005-2010
African Am. hispanic White Econ. Disadvantaged Special Education Limited English ProficiencyAfroamericanos Hispanos Blancos En desventaja económica Educación especial Conocimiento limitado de inglés
0%
10%
20%
30%
40%
50%
60%
70%
80%
90%
100%
Source: Accountability SubsetFuente: Subconjunto de responsabilidad
Pe
rce
nta
ge
of
Stu
de
nts
wh
oM
et
Sta
nd
ard
Porc
enta
je d
e es
tudi
ante
s que
cum
plie
ron
con
el e
stán
dar
SPRINGPrimavera
• Since 2005, the achievement gaps between student groups have narrowed. For
example, the gaps between the passing rates of White students and African
American and hispanic students have decreased by nine percentage points.
• Passing rates for English language learners improved the most of all student groups,
gaining 44 percentage points over the five year period.
• Reading passing rates generally held steady in 2010, despite the tougher passing
standard at grades 6 and 8, and the inclusion of all tAKS Accommodated results in
2010. the state passing rate declined.
• Passing rates for most student groups continued to increase in 2010. Although
passing rates for students with disabilities decreased, the 2010 results include
Reading tAKS-Accommodated data for the first time. When using the same
accountability rules (i.e., 2010 tEA preview data), tAKS Reading passing
rates for students with disabilities improved by nine percentage points from
2009 to 2010.
• Desde 2005, han disminuido las brechas académicas entre los grupos estudiantiles. Por ejemplo,
las brechas entre los índices de estudiantes aprobados blancos y afroamericanos y estudiantes
hispanos han disminuido en 9 puntos porcentuales.
• Los índices aprobados de estudiantes de inglés como segundo idioma mejoraron más que ningún otro
grupo estudiantil, aumentaron 44 puntos porcentuales en los cinco años.
• Los índices de aprobados en lectura por lo general se mantuvieron estables en 2010, a pesar de los
estándares para aprobar más estrictos en los grados 6 y 8, y la inclusión en 2010 de todos los resultados
del TAKS Acomodado. El índice estatal de aprobados bajó.
• Los índices de estudiantes aprobados en la mayoría de grupos estudiantiles siguieron aumentando
en 2010. Aunque los índices de estudiantes con discapacidades aprobados bajaron, los resultados
de 2010 incluyen información de Lectura de TAKS-Acomodado por primera vez. Cuando se usan las
mismas reglas de responsabilidad (p.ej. datos avanzados de TEA de 2010), los índices de estudiantes
con discapacidades que aprobaron Lectura de TAKS mejoraron en nueve puntos porcentuales de
2009 a 2010.
2011 tARgEtS
Exemplary 90% (w/25% Commended)
Recognized 80% (w/15% Commended)
Acceptable 70%
OBjETIvOS PARA 2011
Ejemplar 90% (con 25% recomendadas)
Reconocida 80% (con 15% recomendadas)
Aceptable 70%
69
%7
2%
94
%6
9%
61%
2005
27
%
75
%7
6%
95
%7
3%
63
%
2006
56
%
75
%7
7%
96
%7
5%
64
%
2007
61%
79
%8
1%9
7%
79
%6
9%
2008
69
%
82
%8
3%
98
%8
1%7
5%
2009
71%
82
%8
2%
98
%8
1%6
9%
2010
71%

22
ChANgE thAt COUNtS CAMBIO QUE CUENTA
Austin students taking the SAT college entrance exam in 2010 exceeded both state and national overall average scores for the fourth year in a row. AISD students outscored their counterparts in the state and nation in Math, and in the state, in both verbal and Writing scores. Los estudiantes de Austin que tomaron el examen de admisión universitaria SAT en 2010 sobrepasaron el promedio estatal y nacional por cuarto año consecutivo. Los estudiantes de AISD sacaron mejores calificaciones que los demás estudiantes del estado y el país en matemáticas, y a nivel estatal, en las secciones de verbal y escritura.

23
AuSTInISDBoARDoFTRuSTEESMESA DIRECtIvA DE AUStIN ISD
(From left De izquierda) Robert Schneider, District 7 Distrito 7; Tamala Barksdale, At Large 9 Cargo General 9; Lori Moya, Secretary, District 6 Distrito 6; Cheryl Bradley, District 1
Distrito 1; Mark Williams, President, District 5 Presidente, Distrito 5; Vincent M. Torres, Vice President, District 4 Vice Presidente, Distrito 4; Christine Brister, District 3 Distrito 3;
Annette LoVoi, At Large 8 Cargo General 8; Sam Guzman, District 2 Distrito 2.

24
More than one-third of AISD schools moved up one or two levels in the State Accountability Ratings. Más de una tercera parte de las escuelas de AISD subieron uno o dos niveles en la Calificación Estatal.
ChANgE thAt COUNtS CAMBIO QUE CUENTA
25
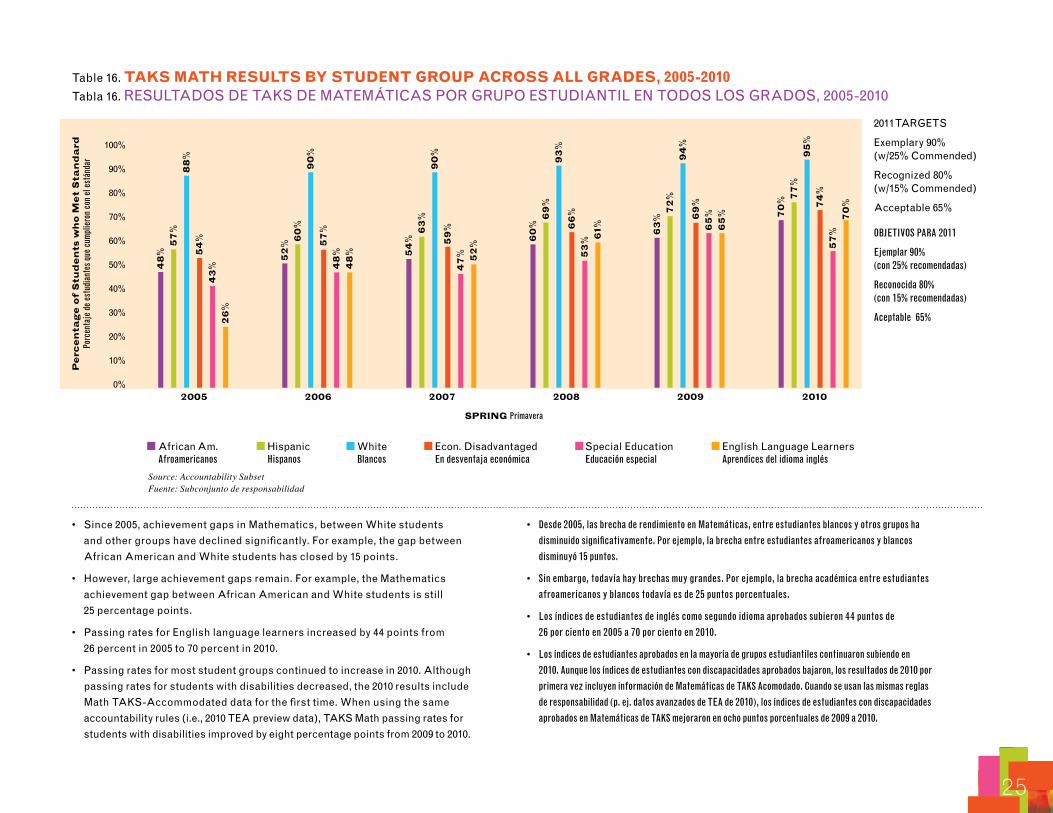
table 16. TAKSMAThRESuLTSBYSTuDEnTGRouPAcRoSSALLGRADES,2005-2010tabla 16. RESULtADOS DE tAKS DE MAtEMÁtICAS POR gRUPO EStUDIANtIL EN tODOS LOS gRADOS, 2005-2010
African Am. hispanic White Econ. Disadvantaged Special Education English Language LearnersAfroamericanos Hispanos Blancos En desventaja económica Educación especial Aprendices del idioma inglés
0%
10%
20%
30%
40%
50%
60%
70%
80%
90%
100%
Source: Accountability SubsetFuente: Subconjunto de responsabilidad
Pe
rce
nta
ge
of
Stu
de
nts
wh
oM
et
Sta
nd
ard
Porc
enta
je d
e es
tudi
ante
s que
cum
plie
ron
con
el e
stán
dar
SPRINGPrimavera
• Since 2005, achievement gaps in Mathematics, between White students
and other groups have declined significantly. For example, the gap between
African American and White students has closed by 15 points.
• however, large achievement gaps remain. For example, the Mathematics
achievement gap between African American and White students is still
25 percentage points.
• Passing rates for English language learners increased by 44 points from
26 percent in 2005 to 70 percent in 2010.
• Passing rates for most student groups continued to increase in 2010. Although
passing rates for students with disabilities decreased, the 2010 results include
Math tAKS-Accommodated data for the first time. When using the same
accountability rules (i.e., 2010 tEA preview data), tAKS Math passing rates for
students with disabilities improved by eight percentage points from 2009 to 2010.
• Desde 2005, las brecha de rendimiento en Matemáticas, entre estudiantes blancos y otros grupos ha
disminuido significativamente. Por ejemplo, la brecha entre estudiantes afroamericanos y blancos
disminuyó 15 puntos.
• Sin embargo, todavía hay brechas muy grandes. Por ejemplo, la brecha académica entre estudiantes
afroamericanos y blancos todavía es de 25 puntos porcentuales.
• Los índices de estudiantes de inglés como segundo idioma aprobados subieron 44 puntos de
26 por ciento en 2005 a 70 por ciento en 2010.
• Los índices de estudiantes aprobados en la mayoría de grupos estudiantiles continuaron subiendo en
2010. Aunque los índices de estudiantes con discapacidades aprobados bajaron, los resultados de 2010 por
primera vez incluyen información de Matemáticas de TAKS Acomodado. Cuando se usan las mismas reglas
de responsabilidad (p. ej. datos avanzados de TEA de 2010), los índices de estudiantes con discapacidades
aprobados en Matemáticas de TAKS mejoraron en ocho puntos porcentuales de 2009 a 2010.
2011 tARgEtS
Exemplary 90% (w/25% Commended)
Recognized 80% (w/15% Commended)
Acceptable 65%
OBjETIvOS PARA 2011
Ejemplar 90% (con 25% recomendadas)
Reconocida 80% (con 15% recomendadas)
Aceptable 65%
48
%5
7%
88
%5
4%
43
%
2005
26
%
52
%6
0%
90
%5
7%
48
%
2006
48
% 54
%6
3%
90
%5
9%
47
%
2007
52
%
60
%6
9%
93
%6
6%
53
%
2008
61% 63
%7
2%
94
%6
9%
65
%
2009
65
% 70
% 77
%9
5%
74
%5
7%
2010
70
%

26
table 17. TAKSScIEncERESuLTSBYSTuDEnTGRouPAcRoSSALLGRADES,2005-2010tabla 17. RESULtADOS DE tAKS DE CIENCIAS POR gRUPO EStUDIANtIL EN tODOS LOS gRADOS, 2005-2010
African Am. hispanic White Econ. Disadvantaged Special Education English Language LearnersAfroamericanos Hispanos Blancos En desventaja económica Educación especial Aprendices del idioma inglés
0%
10%
20%
30%
40%
50%
60%
70%
80%
90%
100%
Source: Accountability SubsetFuente: Subconjunto de responsabilidad
Pe
rce
nta
ge
of
Stu
de
nts
wh
oM
et
Sta
nd
ard
Porc
enta
je d
e es
tudi
ante
s que
cum
plie
ron
con
el e
stán
dar
SPRINGPrimavera
• In 2010, Science passing rates increased for each student group, with one-year
gains of eight or more points for African American and hispanic students,
students with English Language Learners, and students with disabilities.
• Achievement gaps between White students and other groups have declined
significantly. For example, the gap between African American and White students
has closed by 20 points and by 17 points for hispanic students since 2005.
• however, large achievement gaps remain. For example, the Science
achievement gap between African American and White students is still
26 percentage points.
• En 2010, la tasa de aprobación en Ciencias subió para cada grupo estudiantil, con un aumento de
un año de ocho o más puntos entre estudiantes afroamericanos e hispanos, aprendices del idioma
inglés y con discapacidades.
• Las brechas académicas entre estudiantes blancos y otros grupos han disminuido considerablemente.
Por ejemplo, la brecha entre estudiantes afroamericanos y blancos disminuyó 20 puntos y 17 puntos
para estudiantes hispanos desde 2005.
• Sin embargo, todavía hay brechas académicas muy grandes. Por ejemplo, la brecha académica en
ciencias entre estudiantes afroamericanos y blancos todavía es de 26 puntos porcentuales.
2011 tARgEtS
Exemplary 90%
Recognized 80%
Acceptable 60%
OBjETIvOS PARA 2011
Ejemplar 90%
Reconocida 80%
Aceptable 60%
40
% 46
%8
7%
42
% 48
%
2005
25
%
51% 5
4%
91%
50
%4
4%
2006
26
%
54
%5
4%
91%
51%
45
%
2007
26
%
55
%5
8%
91%
54
%3
8%
2008
35
%
59
% 64
%9
4%
61%
48
%
2009
44
%
70
%7
2%
96
%7
0%
59
%
2010
53
%
27
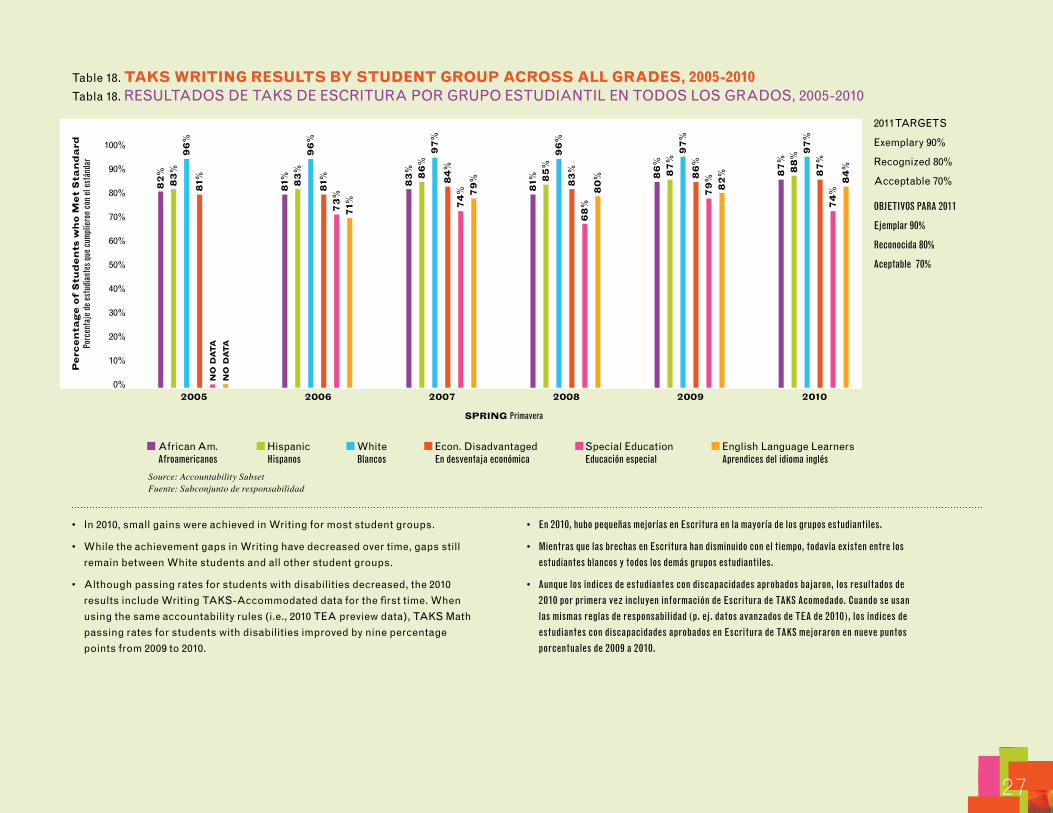
table 18. TAKSWRITInGRESuLTSBYSTuDEnTGRouPAcRoSSALLGRADES,2005-2010tabla 18. RESULtADOS DE tAKS DE ESCRItURA POR gRUPO EStUDIANtIL EN tODOS LOS gRADOS, 2005-2010
African Am. hispanic White Econ. Disadvantaged Special Education English Language LearnersAfroamericanos Hispanos Blancos En desventaja económica Educación especial Aprendices del idioma inglés
0%
10%
20%
30%
40%
50%
60%
70%
80%
90%
100%
Source: Accountability SubsetFuente: Subconjunto de responsabilidad
Pe
rce
nta
ge
of
Stu
de
nts
wh
oM
et
Sta
nd
ard
Porc
enta
je d
e es
tudi
ante
s que
cum
plie
ron
con
el e
stán
dar
SPRINGPrimavera
• In 2010, small gains were achieved in Writing for most student groups.
• While the achievement gaps in Writing have decreased over time, gaps still
remain between White students and all other student groups.
• Although passing rates for students with disabilities decreased, the 2010
results include Writing tAKS-Accommodated data for the first time. When
using the same accountability rules (i.e., 2010 tEA preview data), tAKS Math
passing rates for students with disabilities improved by nine percentage
points from 2009 to 2010.
• En 2010, hubo pequeñas mejorías en Escritura en la mayoría de los grupos estudiantiles.
• Mientras que las brechas en Escritura han disminuido con el tiempo, todavía existen entre los
estudiantes blancos y todos los demás grupos estudiantiles.
• Aunque los índices de estudiantes con discapacidades aprobados bajaron, los resultados de
2010 por primera vez incluyen información de Escritura de TAKS Acomodado. Cuando se usan
las mismas reglas de responsabilidad (p. ej. datos avanzados de TEA de 2010), los índices de
estudiantes con discapacidades aprobados en Escritura de TAKS mejoraron en nueve puntos
porcentuales de 2009 a 2010.
2011 tARgEtS
Exemplary 90%
Recognized 80%
Acceptable 70%
OBjETIvOS PARA 2011
Ejemplar 90%
Reconocida 80%
Aceptable 70%
82
%8
3%
96
%8
1%N
OD
AT
A
2005
NO
DA
TA
81% 83
%9
6%
81%
73
%
2006
71%
83
%8
6%
97
%8
4%
74
%
2007
79
%
81% 8
5%
96
%8
3%
68
%
2008
80
% 86
%8
7%
97
%8
6%
79
%
2009
82
% 87
%8
8% 9
7%
87
%7
4%
2010
84
%

28

29
table 19. TAKSSocIALSTuDIESRESuLTSBYSTuDEnTGRouPAcRoSSALLGRADES,2005-2010tabla 19. RESULtADOS DE tAKS DE EStUDIOS SOCIALES POR gRUPO EStUDIANtIL EN tODOS LOS gRADOS, 2005-2010
African Am. hispanic White Econ. Disadvantaged Special Education English Language LearnersAfroamericanos Hispanos Blancos En desventaja económica Educación especial Aprendices del idioma inglés
0%
10%
20%
30%
40%
50%
60%
70%
80%
90%
100%
Source: Accountability SubsetFuente: Subconjunto de responsabilidad
Pe
rce
nta
ge
of
Stu
de
nts
wh
oM
et
Sta
nd
ard
Porc
enta
je d
e es
tudi
ante
s que
cum
plie
ron
con
el e
stán
dar
SPRINGPrimavera
• In 2010, gains were achieved in Social Studies for all student groups except the
White student group. In the case of the latter group, 99 percent of the students
again met the standard.
• For the first time, passing rates in Social Studies reached 80 percent for each
student group.
• the largest gains in 2010 were achieved by English language learners with a
one-year gain of 12 percentage points.
• gaps among student ethnic groups decreased to 9 points or less for the first
time since tAKS began.
• En 2010, hubo mejorías en Estudios Sociales en todos los grupos estudiantiles salvo el de estudiantes
blancos. En dicho grupo, 99 por ciento de los estudiantes cumplió nuevamente con el estándar.
• Por primera vez, las tazas de aprobación en Estudios Sociales alcanzaron un 80 por ciento para cada
grupo estudiantil.
• Las mejorías más grandes en 2010 las lograron los estudiantes de inglés como segundo idioma con un
aumento de 12 puntos porcentuales en un año.
• Las brechas entre grupos étnicos estudiantiles bajo a 9 puntos o menos por primera vez desde que
empezaron los TAKS.
2011 tARgEtS
Exemplary 90%
Recognized 80%
Acceptable 70%
OBjETIvOS PARA 2011
Ejemplar 90%
Reconocida 80%
Aceptable 70%
74
%7
4%
96
%7
1%8
0%
2005
50
%
76
%7
3%
96
%7
0%
61%
2006
41%
76
%7
8%
97
%7
4%
67
%
2007
41%
80
%8
2%
97
%7
9%
62
%
2008
57
%
84
%8
7%
99
%8
5%
78
%
2009
68
%
90
%9
2% 9
9%
90
%8
2%
2010
80
%
30
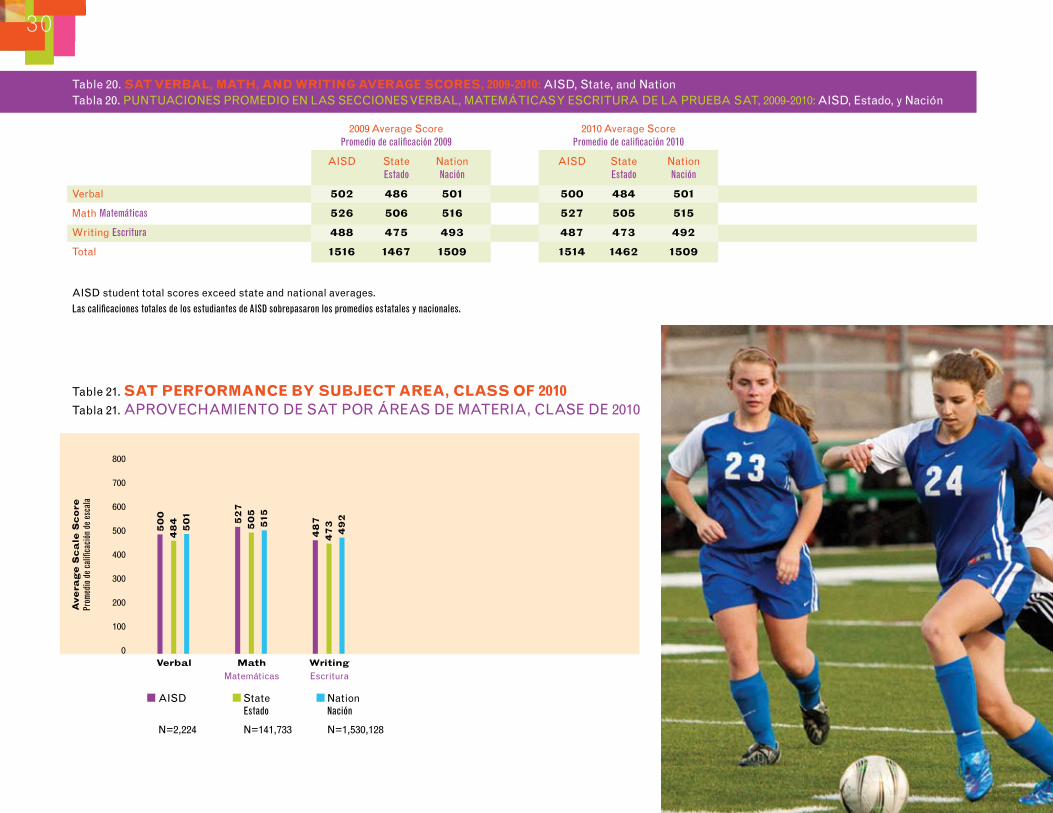
table 20. SATVERBAL,MATh,AnDWRITInGAVERAGEScoRES,2009-2010: AISD, State, and Nationtabla 20. PUNtUACIONES PROMEDIO EN LAS SECCIONES vERbAL, MAtEMÁtICAS Y ESCRItURA DE LA PRUEbA SAt, 2009-2010: AISD, Estado, y Nación
table 21. SATPERFoRMAncEBYSuBJEcTAREA,cLASSoF2010tabla 21. APROvEChAMIENtO DE SAt POR ÁREAS DE MAtERIA, CLASE DE 2010
AISD State Nation Estado Nación
N=2,224 N=141,733 N=1,530,128
50
04
84
50
1
Verbal0
100
200
300
400
500
600
700
800
52
75
05
515
MathMatemáticas
48
74
73
49
2
WritingEscritura
Av
era
ge
Sc
ale
Sc
ore
Prom
edio
de
califi
caci
ón d
e es
cala
2009 Average Score 2010 Average Score Promedio de calificación 2009 Promedio de calificación 2010
AISD State Nation AISD State Nation Estado Nación Estado Nación
verbal 502 486 501 500 484 501
MathMatemáticas 526 506 516 527 505 515
WritingEscritura 488 475 493 487 473 492
total 1516 1467 1509 1514 1462 1509
AISD student total scores exceed state and national averages.
Las calificaciones totales de los estudiantes de AISD sobrepasaron los promedios estatales y nacionales.
Sixty-eight schools – 62 percent of all campuses – were rated Exemplary or Recognized, up from 54 campuses in 2009. Sesenta y ocho escuelas – un 62% de todos los planteles – fueron clasificadas como Ejemplares o Reconocidas, un aumento de las 54 escuelas en 2009.
ChANgE thAt COUNtS CAMBIO QUE CUENTA
31
90%
91%
92%
93%
94%
95%
96%
97%
98%
99%
100%
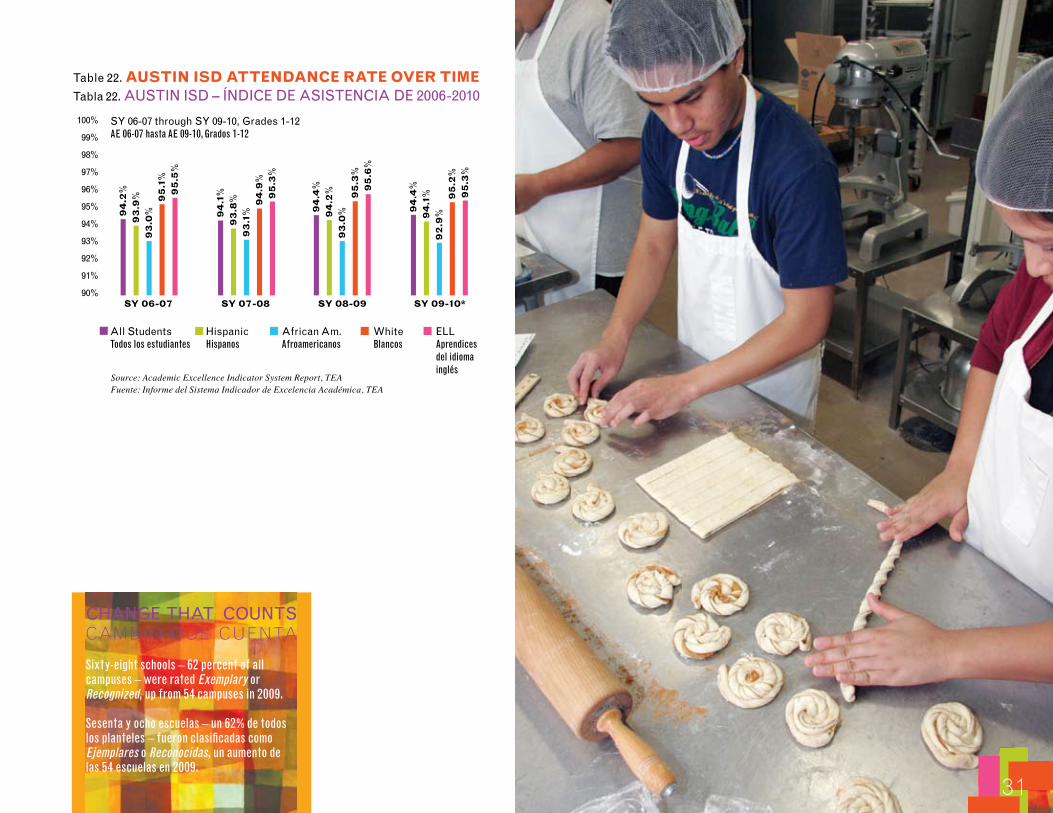
table 22. AuSTInISDATTEnDAncERATEoVERTIMEtabla 22. AUStIN ISD – ÍNDICE DE ASIStENCIA DE 2006-2010
SY 06-07 through SY 09-10, grades 1-12AE 06-07 hasta AE 09-10, Grados 1-12
All Students hispanic African Am. White ELLTodos los estudiantes Hispanos Afroamericanos Blancos Aprendices del idioma inglés
94
.2%
93
.9%
93
.0%
95
.1%
95
.5%
94
.1%
93
.8%
93
.1%
94
.9%
95
.3%
94
.4%
94
.2%
93
.0%
95
.3%
95
.6%
94
.4%
94
.1%
92
.9%
95
.2%
95
.3%
SY06-07 SY07-08 SY08-09 SY09-10*
Source: Academic Excellence Indicator System Report, TEAFuente: Informe del Sistema Indicador de Excelencia Académica, TEA

32
table 23. coMPLETIonRATESBYSTuDEnTGRouP,cLASSESoF2006ThRouGh2009tabla 23. tASAS DE gRADUACIÓN POR gRUPO EStUDIANtIL, gENERACIONES 2006 A 2009
Class of 2006 Class of 2007 Class of 2008 Class of 2009Clase de 2006 Clase de 2007 Clase de 2008 Clase de 2009
0%
10%
20%
30%
40%
50%
60%
70%
80%
90%
100%
Pe
rce
nta
ge
of
Stu
de
nts
Porc
enta
je d
e es
tudi
ante
s
StudentGroupandGraduatingClassGrupo estudiantil y Generación
high school completion rates appear to have declined slightly from the Class
of 2006 to the Class of 2009, though changes in methodology do not allow for
precise longitudinal comparison.
Completion rates were lowest among Economically Disadvantaged students,
and White students continued to complete high school on time at greater rates
than their African American and hispanic peers.
Note. 2005-2006 was the first year dropouts were calculated using the NCES methodology, which has been phased into the completion rate cohort one grade level at a time over the past four years. Due to the inconsistency of methodology each year, the rates displayed above are not comparable.
Las tazas de graduación de secundaria parecen hacer bajado un poco de la Clase de 2006 a la 2009,
aunque cambios en metodología no permiten una comparación longitudinal precisa.
Los estudiantes con desventaja económica tuvieron las tasas de graduación más bajas, y los
estudiantes blancos siguieron terminando la secundaria a tiempo en una proporción mucho más
alta que sus compañeros afroamericanos e hispanos.
Nota. El 2005-2006 fue el primer año que se calculó la tasa de deserción usando la metodología NCES, la cual ha sido añadida al cohorte un grado a la vez en los últimos cuatro años. Debido a la inconsistencia en metodología cada año, las tasas que aparecen arriba no son comparables.
77%
AllTodos
11%
75%
12%
74%
12%
76%
13%
67%
Afr.Am.Afroamericanos
17%
65%
15%
66%
16%
70%
16%
69%
HispanicHispanos
15%
66%
17%
64%
16%
67%
18%90%
WhiteAnglosajones
5%
88%6%
89%5%
89%6%
66%
Econ.Dis.En desventaja económica
16%
63%
15%
61%
17% 75%
12%
Gra
du
ate
d/
Co
nti
nu
ed
Se g
radu
ó / C
ontin
uó

33
table 24. PoSTSEconDARYEnRoLLMEnTRATESBYSTuDEnTGRouP,cLASSESoF2006ThRouGh2009tabla 24. LAS tASAS DE MAtRÍCULA POStSECUNDARIA POR gRUPO EStUDIANtIL, CLASES DE 2006 A 2009
Class of 2006 Class of 2007 Class of 2008 Class of 2009Clase de 2006 Clase de 2007 Clase de 2008 Clase de 2009
0%
10%
20%
30%
40%
50%
60%
70%
80%
90%
100%
Pe
rce
nta
ge
of
Stu
de
nts
Porc
enta
je d
e es
tudi
ante
s
StudentGroupandGraduatingClassGrupo estudiantil y Generación
Enrollment in postsecondary institutions has increased steadily over time, but
hispanic and Economically Disadvantaged students continue to lag behind
their peers.
According to the high School Exit Survey, most students want to attend college,
but hispanic graduates did not satisfy many of the fundamental criteria needed
to enroll in a four year college. Increasing gPA, although an important predictor
of postsecondary enrollment, did not account for the application and enrollment
gap between hispanic graduates and their peers. Intensive support in the
application process improved the opportunity for graduates’ postsecondary
enrollment, and was particularly important for hispanic graduates.
La matrícula en instituciones postsecundarias aumentó progresivamente, pero los estudiantes hispanos y
con desventaja económica siguen quedándose atrás de sus compañeros.
Según la Encuesta de Graduación de Secundaria, la mayoría de los estudiantes quieren ir a la universidad,
pero los hispanos no cumplían con muchos de los criterios fundamentales necesarios para matricularse
en una universidad de quatro años. Un aumento en el GPA, aunque predictor importante de la matrícula
postsecundaria, no explicó la brecha de solicitud y matrícula entre los graduados hispanos y sus
compañeros. Un amplio apoyo en el proceso de solicitud mejoró la posibilidad de que los graduados se
inscribieran en el colegio o la universidad, y fue especialmente importante para los graduados hispanos.
38%
AllTodos
23%
37%
26%
37%
25%
37%
29%
34%
Afr.Am.Afroamericanos
23%
31%
23%
31%
25%
35%
31%
22%
HispanicHispanos
24%
21%
27%
22%
27%
23%
32%50%
WhiteAnglosajones
26%
51%
27%
53%
24%
52%
25%
21%
Econ.Dis.En desventaja económica
22%
19%
25%
19%
25%
21%
33%
Fo
ur-
Ye
arI
nst
itu
tio
n/
Tw
o-Y
ea
rIn
stit
uti
on
Inst
ituci
ón d
e cu
atro
año
s / in
stitu
ción
de
dos a
ños

3 4
table 25. PoSTSEconDARYEDucATIontabla 25. EDUCACIÓN POSt SECUNDARIA
Overall 4-Year 2-YearTotal 4-Años 2-Años
55
%3
2%
20
%
20020%
10%
20%
30%
40%
50%
60%
70%
80%
90%
100%
historical Perspective. Overall
postsecondary enrollment has slowly
increased over time. Enrollment in four-
year institutions has remained constant
since 2007. the recent increase in overall
postsecondary enrollment was driven by
enrollment in two-year institutions.
Perspectiva histórica. La matrícula postsecundaria
total ha subido poco a poco con el tiempo. La matrícula
en instituciones de cuatro años se ha mantenido
constante desde 2007. El aumento reciente en la
matrícula postsecundaria total se debió a la matrícula
en instituciones de dos años.
58
%3
5%
20
%
2003
59
%3
6%
20
%
2004
60
%3
5%
22
%2005
63
%3
8%
23
%
2006
63
%3
7%
26
%
2007
63
%3
7%
25
%
2008
66
%3
7%
29
%
2009
2009 graduates. the majority of 2009
graduates were enrolled in a post-
secondary institution by spring 2010.
Of those enrolled, most were at in-state
institutions; over half were at four-year
institutions; and over half were enrolled
full-time.
Graduados de 2009. La mayoría de los graduados
en 2009 estaban inscritos en una institución
postsecundaria para la primavera de 2010. De los
inscritos, la mayoría estaban en instituciones
dentro del estado; más de la mitad asistían a
instituciones de cuatro años; y más de la mitad
asistían tiempo completo.
NoconfirmedenrollmentbySpring2010
Matrícula no confirmada en la primavera 2010
34%
ConfirmedenrollmentbySpring2010
Matrícula confirmada en la primavera 2010
66%
In-StateEn el estado
88%
Out-of-StateFuera del estado
12%
Two-YearDos Años44%
Four-YearCuatro Años
56%
Full-TimeTiempo completo
53%
UnknownSe desconoce
44%
Half-TimeMedio tiempo
3%
35
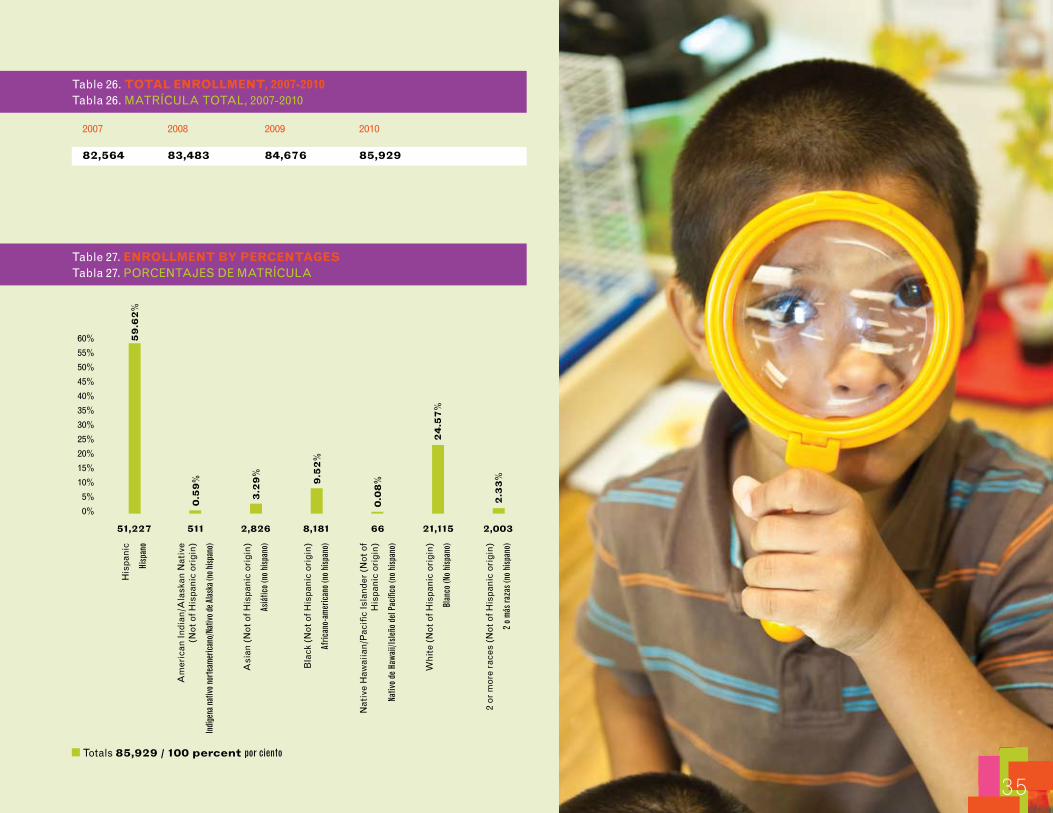
table 26. ToTALEnRoLLMEnT,2007-2010tabla 26. MAtRÍCULA tOtAL, 2007-2010
2007 2008 2009 2010
82,564 83,483 84,676 85,929
0%
5%
10%
15%
20%
25%
30%
35%
40%
45%
50%
totals 85,929/100percentpor ciento
59
.62
%
51,227
his
pani
c
Hisp
ano
0.5
9%
511
Am
eric
an In
dian
/Ala
skan
Nat
ive
(Not
of h
ispa
nic
orig
in)
Indí
gena
nativ
o nor
team
eric
ano/
Nativ
o de A
lask
a (no
hisp
ano)
3.2
9%
2,826
Asi
an (
Not
of h
ispa
nic
orig
in)
Asiá
tico
(no
hisp
ano)
9.5
2%
8,181
bla
ck (
Not
of h
ispa
nic
orig
in)
Afric
ano-
amer
ican
o (n
o hi
span
o)
0.0
8%
66
Nat
ive
haw
aiia
n/P
acifi
c Is
land
er (
Not
of
his
pani
c or
igin
)
Nativ
o de
Haw
aii/I
sleñ
o de
l Pac
ífico
(no
hisp
ano)
24
.57
%
21,115
Whi
te (
Not
of h
ispa
nic
orig
in)
Blan
co (N
o hi
span
o)
2.3
3%
2,003
2 or
mor
e ra
ces
(Not
of h
ispa
nic
orig
in)
2 o
más
raza
s (no
his
pano
)
55%
60%
table 27. EnRoLLMEnTBYPERcEnTAGEStabla 27. PORCENtAjES DE MAtRÍCULA

3 6
Six AISD high schools were among Newsweek’s 2010 “America’s Best High Schools.” Seis secundarias de AISD estuvieron en la lista de 2010 de ‘las mejores secundarias de Estados Unidos’ publicada por la revista Newsweek.
ChANgE thAt COUNtS CAMBIO QUE CUENTA
S T A F F
P E R S O N A L

37
table 28. AuSTInISDTEAchEREThnIcITY,2009-2010tabla 28. EtNICIDAD DE MAEStROS DE AUStIN ISD, 2009-2010
African American White hispanic Other Afroamericanos Anglosajones Hispanos Otros
high SchoolsEscuelas Secundarias 6.88% 74.14% 17.04% 1.94%
Middle SchoolsEscuelas Medias 10.09% 69.8% 16.79% 3.31%
Elementary SchoolsEscuelas Primarias 6.70% 57.50% 34.25% 1.55%
Special Schools Escuelas Especiales 6.99% 72.58% 17.20% 3.23%
total 7.41% 64.03% 26.53% 2.03%
table 30. AISDTEAchERATTRITIon,2008-2010tabla 30. AtRICIÓN DE MAEStROS DE AISD, 2008-2010
2008-2009 Attrition (Resign/Retire) 2009-2010 Attrition (Resign/Retire) 2008-2009 Atrición (Renuncias/Retiros) 2009-2010 Atrición (Renuncias/Retiros)
high SchoolsEscuelas Secundarias 14.6% 10.7%
Middle SchoolsEscuelas Medias 15.1% 10.6%
Elementary SchoolsEscuelas Primarias 13.0% 8.1%
Special Schools Escuelas Especiales 9.9% 6.6%
total 13.7% 9.1%
table 29. AuSTInISDTEAchERExPERIEncE,2009-2010tabla 29. ExPERIENCIAS DE MAEStROS DE AUStIN ISD, 2009-2010
Average Years’ Experience Promedio de años de experiencia
high SchoolsEscuelas Secundarias 10.3
Middle SchoolsEscuelas Medias 10.2
Elementary SchoolsEscuelas Primarias 11.1
Special Schools Escuelas Especiales 13.6
CAC Administration Center Centro Administrativo CAC 16.6
total 11.1
3 8
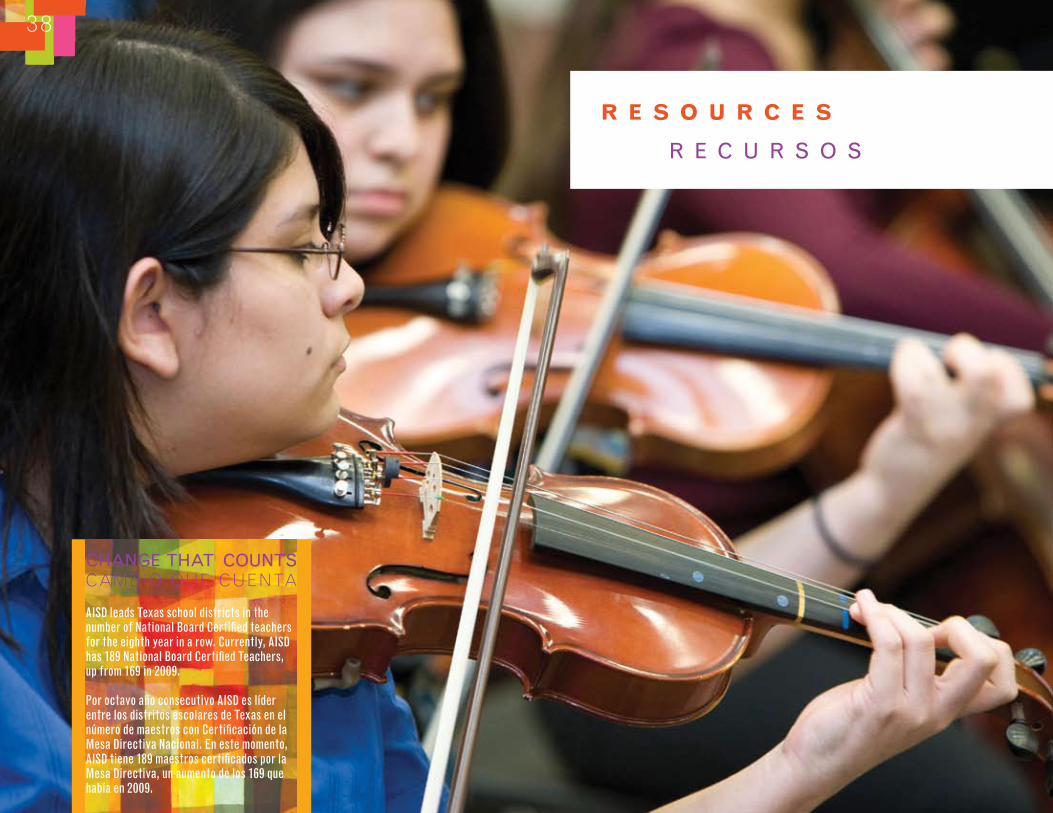
AISD leads Texas school districts in the number of National Board Certified teachers for the eighth year in a row. Currently, AISD has 189 National Board Certified Teachers, up from 169 in 2009. Por octavo año consecutivo AISD es líder entre los distritos escolares de Texas en el número de maestros con Certificación de la Mesa Directiva Nacional. En este momento, AISD tiene 189 maestros certificados por la Mesa Directiva, un aumento de los 169 que había en 2009.
ChANgE thAt COUNtS CAMBIO QUE CUENTA
R E S o u R c E S
R E C U R S O S

table 31. AISDTAxRATES,2001-2011tabla 31. tASAS DE IMPUEStOS DE AISD, 2001-2011
School Year Año escolar M&O* I&S** tOtAL
2001-02 $1.4522 $0.0964 $1.5486
2002-03 $1.500 $0.0964 $1.5964
2003-04 $1.500 $0.1137 $1.6137
2004-05 $1.500 $0.1230 $1.623
2005-06 $1.500 $0.1230 $1.623
2006-07 $1.3700 $0.1230 $1.493
2007-08 $1.0400 $0.1230 $1.163
2008-09 $1.0790 $0.1230 $1.202
2009-10 $1.0790 $0.1230 $1.202
2010-11 $1.0790 $0.1480 $1.227
39
* M&O: Maintenance & Operations / Mantenimiento & Operaciones
** I&S: Interest & Sinking / Interés & Amortización

4 0
table 32. GEnERALFunDExPEnDITuRESBYMAJoRoBJEcT,2010-2011tabla 32. gAStOS DEL FONDO gENERAL POR PROYECtO PRINCIPAL, 2010-2011
SalariesSalarios$629,527,094
(74.57%)
Chapter41PaymentsPagos del Capítulo 41$127,815,376
(15.14%)
ContractedServicesServicios contratados
$56,183,018(6.65%)
Supplies&MaterialsSuministros y materiales
$22,440,670(2.66%)
OtherOperatingExpensesOtros gastos operativos
$6,948,034(0.82%)
DebtServiceServicio de la deuda
$1,194,300(0.14%)
CapitalOutlayGastos de capital
$122,235(0.01%)
OtherUsesOtros usos
$95,000(0.01%)

41
table 33. 2010-2011GEnERALFunDREVEnuEtabla 33. 2010-2011 FONDO gENERAL DE INgRESOS
Local Sources Fuentes locales $628,727,327 75.03%
State Sources Fuentes estatales $172,890,382 20.63%
Federal Sources Fuentes federales $36,357,018 4.34%
tOtAL $837,974,727 100%
Local Property tax provides the greatest revenue by far.
Los impuestos a la propiedad local proporcionan los mayores ingresos.
table 34. 2010-2011GEnERALFunDExPEnDITuREStabla 34. 2010-2011 gAStOS DEL FONDO gENERAL
Instruction Instrucción $453,324,501 53.7%
Instructional Leadership Liderazgo de instrucción $58,084,782 6.88%
Student Support Apoyo estudiantil $68,006,394 8.06%
Administration Administración $17,390,323 2.06%
Plant Maintenance & Operations Mantenimiento de planta y operaciones $105,677,742 12.52%
Ancillary Services Serviccios de ancilarios $5,765,867 .68%
Debt Services Serviccios de deuda $1,194,300 .14%
Capital Outlay Capital de rembolso $1,320,000 .16%
Intergovernment Intergubernamental $133,466,818 15.81%
tOtAL $844,230,727 100%
Instruction tops spending categories.
La categoría de mayor gasto es la instrucción.
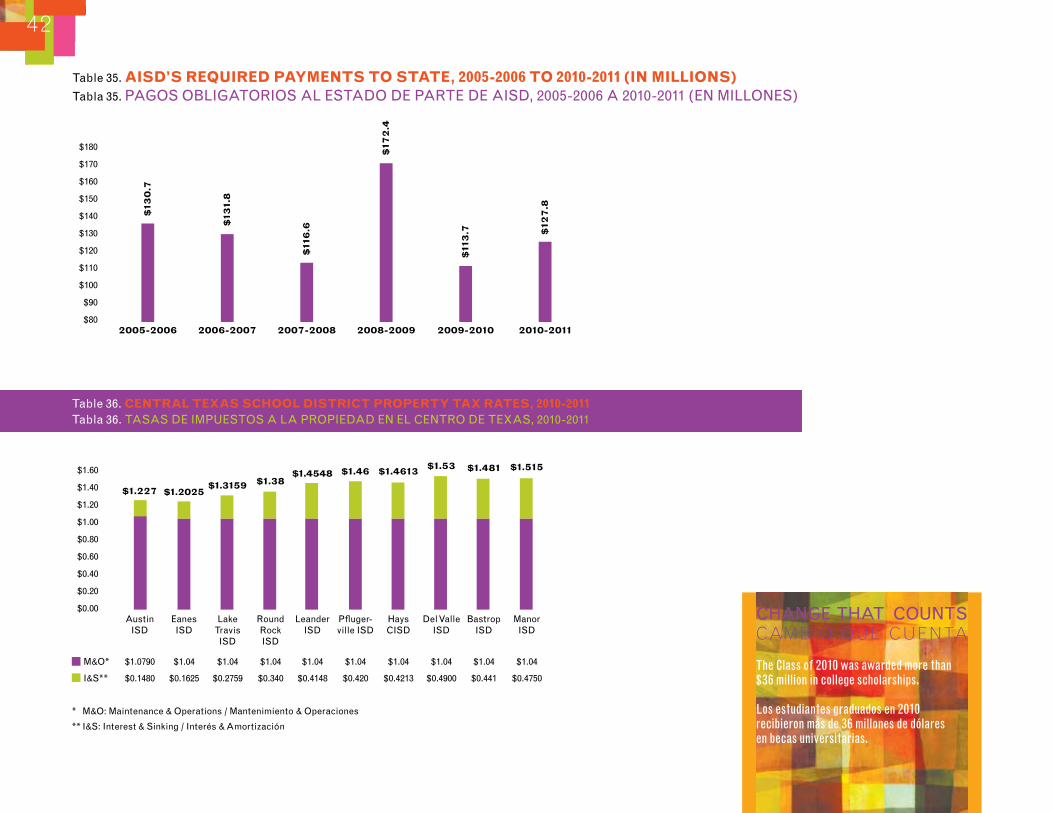
table 36. cEnTRALTExASSchooLDISTRIcTPRoPERTYTAxRATES,2010-2011tabla 36. tASAS DE IMPUEStOS A LA PROPIEDAD EN EL CENtRO DE tExAS, 2010-2011
42
table 35. AISD’SREquIREDPAYMEnTSToSTATE,2005-2006To2010-2011(InMILLIonS)tabla 35. PAgOS ObLIgAtORIOS AL EStADO DE PARtE DE AISD, 2005-2006 A 2010-2011 (EN MILLONES)
$13
0.7
2005-2006$80
$90
$100
$110
$120
$130
$140
$150
$12
7.8
2010-2011
$11
3.7
2009-2010
$17
2.4
2008-2009
$11
6.6
2007-2008
$13
1.8
2006-2007
$160
$170
$180
The Class of 2010 was awarded more than $36 million in college scholarships. Los estudiantes graduados en 2010 recibieron más de 36 millones de dólares en becas universitarias.
ChANgE thAt COUNtS CAMBIO QUE CUENTA
$0.00
$0.20
$0.40
$0.60
$0.80
$1.00
$1.20
$1.40
$1.60
AustinISD
EanesISD
Laketravis
ISD
RoundRock ISD
LeanderISD
Pfluger-ville ISD
hays CISD
Del valleISD
bastropISD
ManorISD
M&O*
I&S**
$1.0790 $1.04 $1.04 $1.04 $1.04 $1.04 $1.04 $1.04 $1.04 $1.04
$0.1480 $0.1625 $0.2759 $0.340 $0.4148 $0.420 $0.4213 $0.4900 $0.441
* M&O: Maintenance & Operations / Mantenimiento & Operaciones
** I&S: Interest & Sinking / Interés & Amortización
$0.4750
$1.227 $1.2025$1.3159 $1.38
$1.4548 $1.46 $1.4613 $1.53 $1.481 $1.515

Seventy-four campuses – 54 elementary schools, 10 middle schools, and five high schools, and five alternative education schools – earned a total of 218 Gold Performance Acknowledgements from the Texas Education Agency. Setenta y cuatro escuelas – 54 primarias, 10 medias, cinco secundarias y cinco escuelas alternativas – obtuvieron un total de 218 galardones ‘Gold Performance Acknowledgements’ de la Agencia de Educación de Texas.
CHANGE THAT COuNTS CaMBio QUe CUenta
4 3

This 2010 Annual Report was prepared by staff from the
Superintendent’s Office, Office of Program Evaluation,
Office of Academics, Office of Finance, Office of School
Operations, and Office of Planning & Community Relations;
Photos by David Omer; Design by BAH! Design. Special
thanks to Konner Gonzalez, McCallum High School.
Este Informe Anual 2010 fue preparado por personal de la
Oficina de la Superintendenta, Oficina de Evaluación de
Programas, Oficina de Asuntos Académicos, Oficina de
Finanzas, Oficina de Operaciones Escolares y Oficina de
Planeamiento y Relaciones Comunitarias. Fotografías de
David Omer; Diseño de BAH! Design. Nuestro sincero
agradecimiento a Konner Gonzalez, McCallum High School.
1 1 1 1 W. 6 t h S t r e e t
A u S T I N , T X 7 8 7 0 3
5 1 2 . 4 1 4 . 1 7 0 0
w w w. A u S T I N I S D. O R G