Household Debt and Credit Report - Non-Housing Debt Balance Q1 2013

July 2016at BROOKINGS
Hutchins Center Working Paper #20
CHANGING PATTERNS IN HOUSEHOLD OWNERSHIP OF MUNICIPAL DEBT:
EVIDENCE FROM THE 1989-2013 SURVEYS OF CONSUMER FINANCES
Daniel Bergstresser,
Rosenberg Institute of Global Finance at Brandeis International Business School
Randoph Cohen, Massachusetts Institute of Technology
SUMMARY
The interest on municipal bonds – typically issued by state and local governments – is exempt from federal (and some state and local) taxes, making them attractive to upper-income households, especially because default rates historically have been very low. Using data from the Federal Reserve’s Survey of Consumer Finances from 1989 through 2013, Bergstresser and Cohen find that the share of households holding municipal debt – either directly or through mutual funds – has fallen from 4.6 percent in 1989 to 2.4 percent in 2013.
In addition, holdings of municipal bonds have become increasingly concentrated among the wealthiest households. As of 2013, 42 percent of all municipal debt was held by the wealthiest one-half of one percent if households, up from 24 percent in 1989.
One reason for the shrinking appeal of tax-exempt municipal debt, Bergstresser and Cohen suggest, is that households have an increasing share of their savings in tax-advantaged retirement investment accounts, such as IRA and 401(k) plans, in which it rarely makes sense to hold tax-exempt debt. The share of household assets in tax-differed accounts went from 19.4 percent in 1989 to 32.6 percent in 2013. The authors find that, the more of a household’s assets that are held in these retirement accounts, the less likely they are to hold municipal bonds, even after adjusted for annual income. Holding municipal bonds falls significantly the greater the share of a household’s assets that are held in these retirement account.
So what? The authors speculate that the constituency for repaying municipal bonds at moments of fiscal distress could shrink along with the fraction of voters who hold the securities. They also suggest that the continuation of the federal tax exemption for municipal interest also could be threatened as holdings of municipal debt are increasingly concentrated in a small number of wealthy households.

3
Bonsula occips, quast quitam. Id consilica; et popubliae tempes etebus idelum reo, nonsultudem ac feratiur. Tum o mandam inat des con derrita beffret ebatistio ina, teluderit etideri tus.
Odiasper feratur aciae laut vitae. Anducip suntibus estiae preperspedio eos velendiciat apienes aborerum fuga. Nam re num res sunt la quodi velesti cum ad et listor aspitecto dita sequas reria seque pla comnis alitatem. Min nemperro venducia volor repudit ut veni tentiorro ideriorro experum faccabo. Itatia volupta tecusam quuntem et el ium alicil idelitatem ut ut aut eum lique natum ut alitibus et di re, quas aspis voloreped qui testet rem. Rae exerit, optis voluptate eaqui aut perereritae. Itas voluptiorum sim ut landigenis soluptaturia quiate dolore quid eatemquibus, que renimusam, inia conet ut expligniscit offici inum liquam volore dolorent.
Ris illab il is maiorer chilictur sequi di tesedis moloria corit ommolup tatur?Min con plaut aligendit, quae necae natum con re mo illibusam nisque architat es aditasseque nobit et volorunt et, is eicat explate ssequas eictus dipsanim et qui voloris eiciis ma in nobit, sit esequas et fugit laboratumet maio incium et re dolupta consed maio te volore nonsecestia cum sapit lam quis eatis rem que nost, temquia sint, qui quibus.
Ga. Odipien ducitas earum consequi dem ipsapis minusci libusaperum quost, te volorum aut qui beribus estotassit que pa volorem restiberiate landell anditaq uatusti oreniscipsam quam, tem nem aut eniscit latati rest ea venia poreri bea non porepelictas eossitatis enem acearuntores adissit rero omnis doluptae sit, officto is conecusam, te nimenti untiusa doloribus doluptatur, sime que dolorum aut a pro quatur assenda estiae pere nusam, ut ulparum rendae consequi quaest, sus reperiam aut aut de vero dolenet quiamus.
Agnat. Obit andi volupti usanda dolumquae volupti cumquun toressi tinimaximi, si coreped unt.Aritio molore por aut entions ectiati volorehenit as volum id minctam, optiae omniet, into bea ipidem idescit id et, veniendit, culparum quatus.
Pudae volorehentur magnis am qui re ni ut verit, odi cuptatione ad mosantibusam estio. Et volliquam ex etus ut illanim odicto officia ndignimaxim nam in es quatemporia con rereicid quas rectempe verfera tiorecte ommo explabo rempos dis et dolorae es nullupta vellam iuris repuda dendaecest, ut volorroriam, voloreseque coreium harchit, comnimus, simus exerunt, aut alit, que consend aectoruptas as eatemped et ilibusame volo conest, cus ea quatia sequi rem quasper emquid experae pa quam quodige nducide soluptur?
Igendicae quias sit quas dolestr umquatur, con cum eossinvero id mo bea demquia tiatisq uidunt harchil iliatquis sinctotas a cus quid eossendendi optasit in esequia dolupta tatiasi alique eaquam evenemporit rernam cores doluptaquis evelecat.Ovit fugitaspici ulparibus, officiist, sandit eos que cullo odiatempore repudicia voluptatque por rectatatqui tem ipsundesto voluptae. Oditiusapero etur autet litaturit et ma sa quam alibea in pos
HUTCHINS CENTER ON FISCAL AND MONETARY POLICY AT BROOKINGS
at BROOKINGSBERGSTRESSER & COHEN
Municipal bonds have historically been an extremely safe investment, with defaults for rated municipal issuers averaging 0.01 percent per year during 1970-2007 and still only 0.03 percent per year over the more turbulent 2008-2013 period (Moody’s, 2014).1 This safety has made the debt attractive as an investment for many households, and direct investment by households has been an important part of the ownership structure of municipal debt. Municipal debt markets also often have a local flavor, with households disproportionately investing in debt from issuers in their own states (Kidwell et al, 1984). There is an interplay between safety and breadth of direct holding – repayment of municipal debt is based in part on the political will of the issuer to repay, and a broad base of holders who are directly exposed to an issuer’s municipal debt creates a significant constituency that can be counted upon to support repayment.2
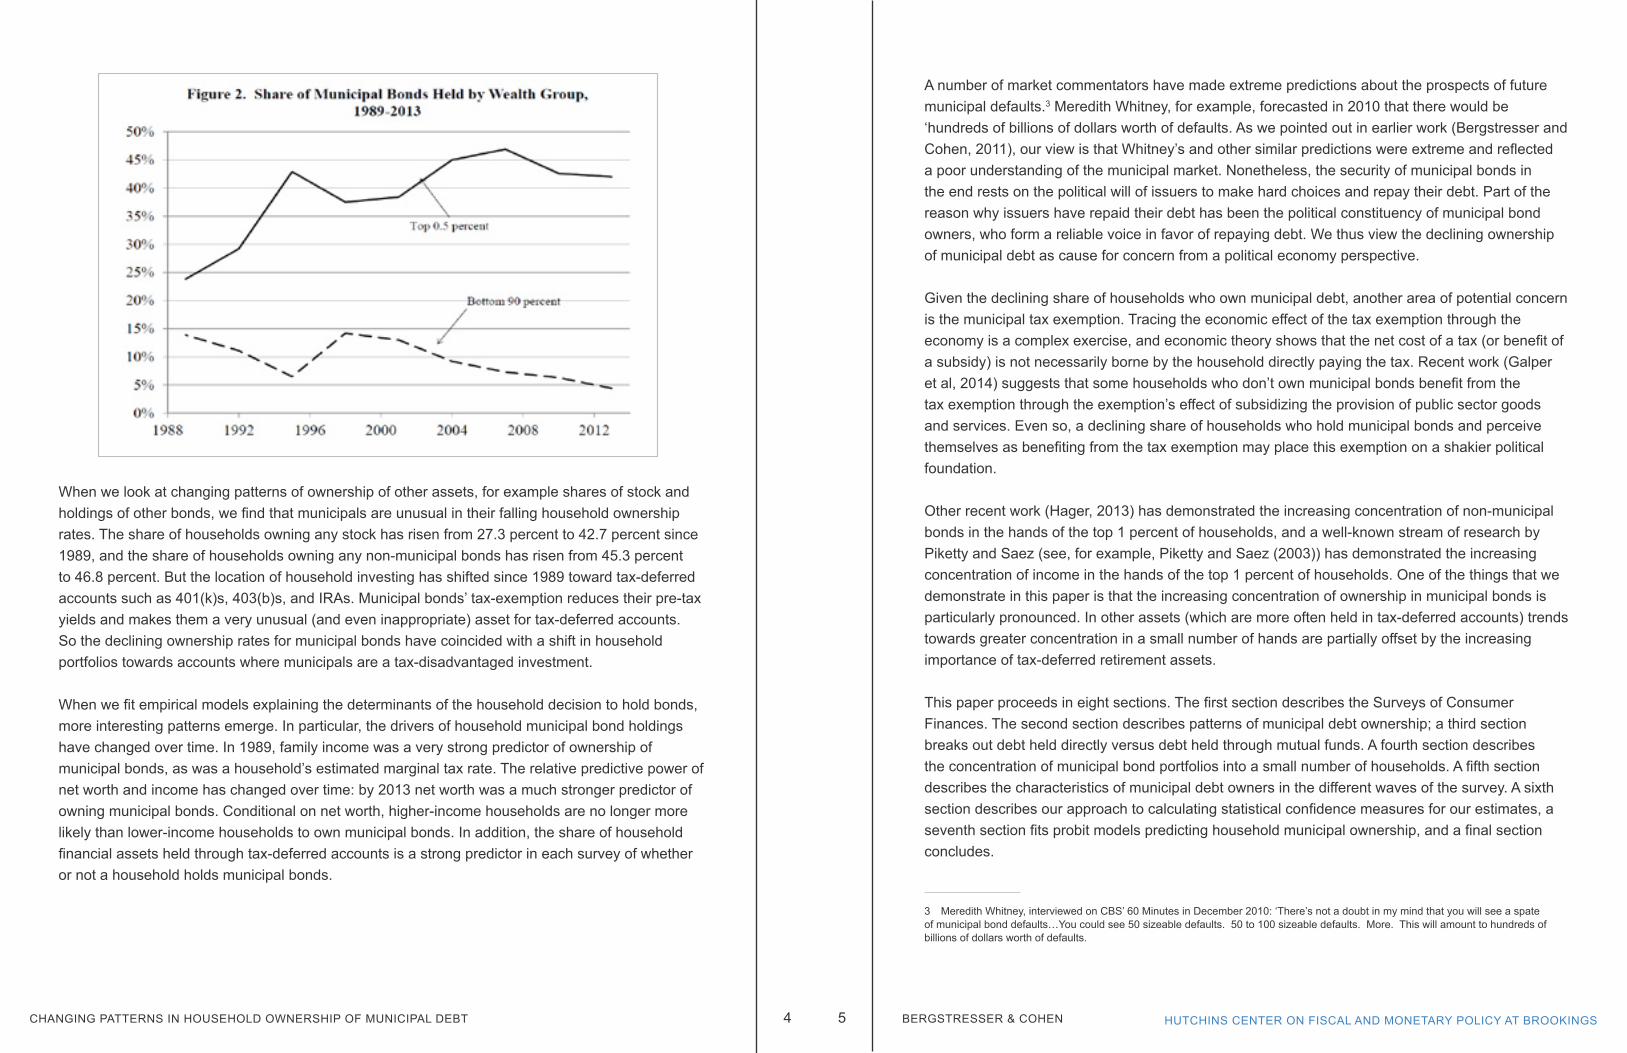
But the structure of household ownership of municipal debt appears to be changing over time, and in ways that are not visible in aggregate statistics. In this paper we use household data from the 1989 through 2013 Surveys of Consumer Finances to look at disaggregated data on municipal debt ownership. A clear picture emerges: the share of households holding municipal bonds appears to be shrinking significantly over time. Household ownership rates have fallen from 4.6 percent to 2.4 percent. Figure 1 shows this drop, and shows the contribution of direct and indirect (through mutual fund) holdings to this drop. This drop in ownership rates has occurred even though aggregate household holdings of municipal debt have increased over time. Municipal bond ownership is becoming concentrated in a smaller and smaller number of hands. Figure 2 shows the increasing concentration over time of municipal bond ownership in the top 0.5 percent of households.
1 A recent study by the Federal Reserve Bank of New York (Appleson et al, 2012) found (not surprisingly) much higher default rates among the set of bonds that do not carry ratings. 2 In the end, households own all of the assets in the economy. Corporate bonds are often owned by insurance companies, which are in turn often owned in part by mutual funds, and those funds are owned by households. But the link from the issuer to the household is particularly direct in the municipal bond market.
ACKNOWLEDGMENTS The authors are grateful for support from the Brandeis International Business School. They are grateful for comments from seminar audiences at Brandeis and at EAFIT University and from Michael Baumrin, Robert Donahue, Robert Doty, Philip Fischer, Thomas Goda, Bart Hildreth, Tom Kozlik Andrew Lutz, Colin MacNaught, Justin Marlowe, Zhuan Pei, Andres Ramirez Hassan, Diego Alexander Restrepo Tobon, Richard Ryffel, Michael Stanton, and Stephen Winterstein. In addition to their academic appointments, both Bergstresser and Cohen work as consultants for Definitive Capital Management, which manages funds that invest in municipal securities.
4 5 HUTCHINS CENTER ON FISCAL AND MONETARY POLICY AT BROOKINGSCHANGING PATTERNS IN HOUSEHOLD OWNERSHIP OF MUNICIPAL DEBT BERGSTRESSER & COHEN
When we look at changing patterns of ownership of other assets, for example shares of stock and holdings of other bonds, we find that municipals are unusual in their falling household ownership rates. The share of households owning any stock has risen from 27.3 percent to 42.7 percent since 1989, and the share of households owning any non-municipal bonds has risen from 45.3 percent to 46.8 percent. But the location of household investing has shifted since 1989 toward tax-deferred accounts such as 401(k)s, 403(b)s, and IRAs. Municipal bonds’ tax-exemption reduces their pre-tax yields and makes them a very unusual (and even inappropriate) asset for tax-deferred accounts. So the declining ownership rates for municipal bonds have coincided with a shift in household portfolios towards accounts where municipals are a tax-disadvantaged investment.
When we fit empirical models explaining the determinants of the household decision to hold bonds, more interesting patterns emerge. In particular, the drivers of household municipal bond holdings have changed over time. In 1989, family income was a very strong predictor of ownership of municipal bonds, as was a household’s estimated marginal tax rate. The relative predictive power of net worth and income has changed over time: by 2013 net worth was a much stronger predictor of owning municipal bonds. Conditional on net worth, higher-income households are no longer more likely than lower-income households to own municipal bonds. In addition, the share of household financial assets held through tax-deferred accounts is a strong predictor in each survey of whether or not a household holds municipal bonds.
A number of market commentators have made extreme predictions about the prospects of future municipal defaults.3 Meredith Whitney, for example, forecasted in 2010 that there would be ‘hundreds of billions of dollars worth of defaults. As we pointed out in earlier work (Bergstresser and Cohen, 2011), our view is that Whitney’s and other similar predictions were extreme and reflected a poor understanding of the municipal market. Nonetheless, the security of municipal bonds in the end rests on the political will of issuers to make hard choices and repay their debt. Part of the reason why issuers have repaid their debt has been the political constituency of municipal bond owners, who form a reliable voice in favor of repaying debt. We thus view the declining ownership of municipal debt as cause for concern from a political economy perspective.
Given the declining share of households who own municipal debt, another area of potential concern is the municipal tax exemption. Tracing the economic effect of the tax exemption through the economy is a complex exercise, and economic theory shows that the net cost of a tax (or benefit of a subsidy) is not necessarily borne by the household directly paying the tax. Recent work (Galper et al, 2014) suggests that some households who don’t own municipal bonds benefit from the tax exemption through the exemption’s effect of subsidizing the provision of public sector goods and services. Even so, a declining share of households who hold municipal bonds and perceive themselves as benefiting from the tax exemption may place this exemption on a shakier political foundation.
Other recent work (Hager, 2013) has demonstrated the increasing concentration of non-municipal bonds in the hands of the top 1 percent of households, and a well-known stream of research by Piketty and Saez (see, for example, Piketty and Saez (2003)) has demonstrated the increasing concentration of income in the hands of the top 1 percent of households. One of the things that we demonstrate in this paper is that the increasing concentration of ownership in municipal bonds is particularly pronounced. In other assets (which are more often held in tax-deferred accounts) trends towards greater concentration in a small number of hands are partially offset by the increasing importance of tax-deferred retirement assets.
This paper proceeds in eight sections. The first section describes the Surveys of Consumer Finances. The second section describes patterns of municipal debt ownership; a third section breaks out debt held directly versus debt held through mutual funds. A fourth section describes the concentration of municipal bond portfolios into a small number of households. A fifth section describes the characteristics of municipal debt owners in the different waves of the survey. A sixth section describes our approach to calculating statistical confidence measures for our estimates, a seventh section fits probit models predicting household municipal ownership, and a final section concludes.
3 Meredith Whitney, interviewed on CBS’ 60 Minutes in December 2010: ‘There’s not a doubt in my mind that you will see a spate of municipal bond defaults…You could see 50 sizeable defaults. 50 to 100 sizeable defaults. More. This will amount to hundreds of billions of dollars worth of defaults.

6 7 HUTCHINS CENTER ON FISCAL AND MONETARY POLICY AT BROOKINGSCHANGING PATTERNS IN HOUSEHOLD OWNERSHIP OF MUNICIPAL DEBT BERGSTRESSER & COHEN
1. THE SURVEYS OF CONSUMER FINANCE
The Survey of Consumer Finances (SCF) is a survey of US households, conducted every three years by the Federal Reserve Board, in cooperation with the Internal Revenue Service. The modern incarnation of the survey began in 1983, and the questionnaire and sample design have been relatively stable since 1989, allowing comparison across surveys in different years. Since that time the survey has been constructed as a repeated cross-section rather than as a panel study following the same household across different surveys.4 The SCF is widely used by academic and government researchers studying household portfolio choice and related decisions. SCF data are regarded as the most reliable and extensive data on household wealth available for the United States (Dettling and Hsu, 2014).
A key feature of the SCF is the dual-frame sampling design (Kennickell, 2005). The dual-frame design means that part of the sample comes from an area-probability sample and a second part comes from what is called the “list sample.” The area-probability sample represents about 2/3 of the total sample, and is constructed through geographically stratified sampling of a national sampling frame developed by the National Opinion Research Center (NORC) at the University of Chicago. The list sample is used to over-sample households likely to be wealthy, and is based on a sample of individual tax returns developed by the IRS’ Statistics of Income (SOI) Division.
Over-sampling wealthy households is particularly important given that wealth is concentrated in a relatively small number of households. The combination of an area-probability sample with a list-sample which over-samples the wealthy means that the SCF can be used to investigate both behaviors that are widely distributed in the population (for example use of credit cards) and behavior that is more concentrated in the very wealthy (for example ownership of stock or mutual funds). In our context, the sample design means that the same survey is useful both for investigating the share of households that have municipal debt and also the structure of municipal debt ownership among the relatively small number of households that own municipal bonds. The SCF is distinguished by its high level of detail on the disaggregated components of wealth. This disaggregation means that the survey is particularly useful for investigating questions around household portfolio shares in different assets (Poterba and Samwick, 2003), and can be used as well to investigate household assets held both inside and outside of tax-deferred accounts such as defined contribution pension plans (Bergstresser and Poterba, 2004). For example, the SCF asks questions both about municipal bonds held directly and also about tax-exempt municipal bond mutual funds, a feature that we exploit in this work. The SCF also asks demographic questions, for example household composition, ages, educational status, and occupational and employment status.
4 An exception to this was a 2009 re-survey of 2007 survey households. This re-survey was designed to assess household assets and income across the financial crisis.
SCF observations come with analysis weights that are intended to specify the number of households in the larger population that are similar to the survey household (see Kennickell and Woodburn, 1999). These analysis weights can be thought of as representing the inverse of the probability of selection of a household into the sample. The weights allow researchers using the survey to address questions such as the distribution of wealth ownership in the population from which the survey is drawn, which is the population of US households.
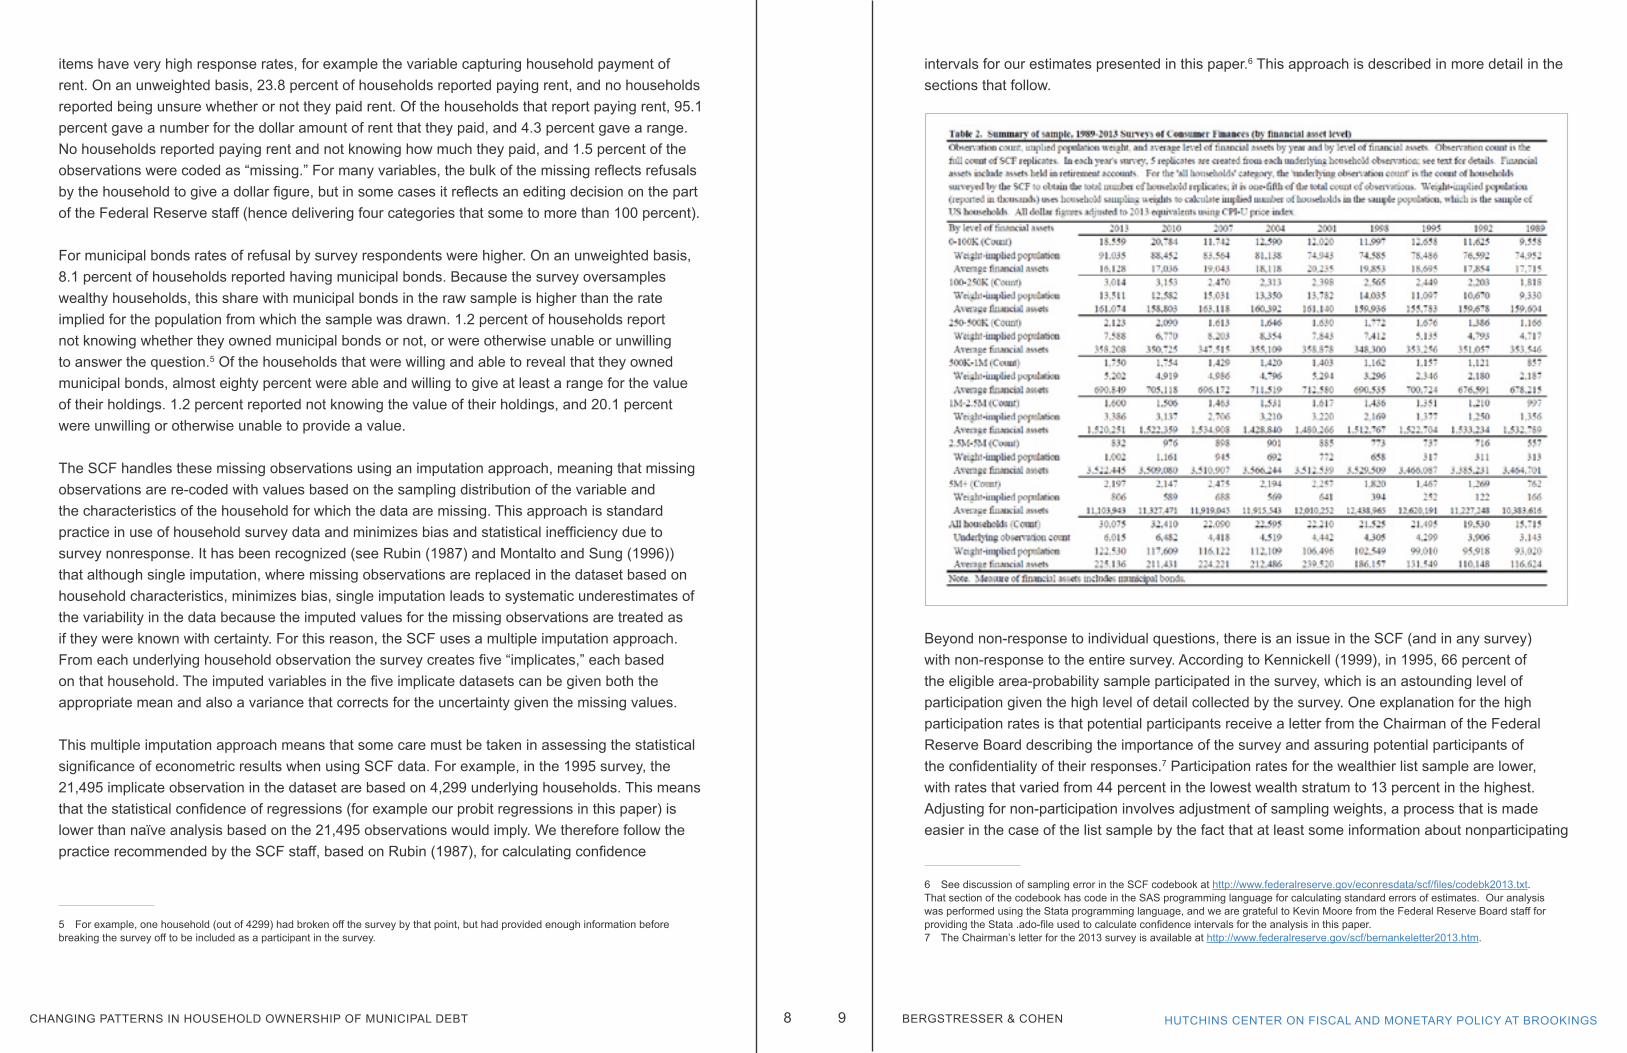
A key feature of the SCF is the use of multiple imputation for handling nonresponse in the survey. Rubin (1987) gives details on multiple imputation in surveys, and Kennickell (1999) describes the use of multiple imputation in the SCF. As with any survey, some households in the SCF decline to answer certain questions about aspects of wealth or income, or are only willing to give answers indicating a range for a given variable rather than a dollar amount. Table 1 (based very closely on Kennickell, 1999) shows data on nonresponse and range response from the 1995 SCF. Some
8 9 HUTCHINS CENTER ON FISCAL AND MONETARY POLICY AT BROOKINGSCHANGING PATTERNS IN HOUSEHOLD OWNERSHIP OF MUNICIPAL DEBT BERGSTRESSER & COHEN
items have very high response rates, for example the variable capturing household payment of rent. On an unweighted basis, 23.8 percent of households reported paying rent, and no households reported being unsure whether or not they paid rent. Of the households that report paying rent, 95.1 percent gave a number for the dollar amount of rent that they paid, and 4.3 percent gave a range. No households reported paying rent and not knowing how much they paid, and 1.5 percent of the observations were coded as “missing.” For many variables, the bulk of the missing reflects refusals by the household to give a dollar figure, but in some cases it reflects an editing decision on the part of the Federal Reserve staff (hence delivering four categories that some to more than 100 percent).
For municipal bonds rates of refusal by survey respondents were higher. On an unweighted basis, 8.1 percent of households reported having municipal bonds. Because the survey oversamples wealthy households, this share with municipal bonds in the raw sample is higher than the rate implied for the population from which the sample was drawn. 1.2 percent of households report not knowing whether they owned municipal bonds or not, or were otherwise unable or unwilling to answer the question.5 Of the households that were willing and able to reveal that they owned municipal bonds, almost eighty percent were able and willing to give at least a range for the value of their holdings. 1.2 percent reported not knowing the value of their holdings, and 20.1 percent were unwilling or otherwise unable to provide a value.
The SCF handles these missing observations using an imputation approach, meaning that missing observations are re-coded with values based on the sampling distribution of the variable and the characteristics of the household for which the data are missing. This approach is standard practice in use of household survey data and minimizes bias and statistical inefficiency due to survey nonresponse. It has been recognized (see Rubin (1987) and Montalto and Sung (1996)) that although single imputation, where missing observations are replaced in the dataset based on household characteristics, minimizes bias, single imputation leads to systematic underestimates of the variability in the data because the imputed values for the missing observations are treated as if they were known with certainty. For this reason, the SCF uses a multiple imputation approach. From each underlying household observation the survey creates five “implicates,” each based on that household. The imputed variables in the five implicate datasets can be given both the appropriate mean and also a variance that corrects for the uncertainty given the missing values.
This multiple imputation approach means that some care must be taken in assessing the statistical significance of econometric results when using SCF data. For example, in the 1995 survey, the 21,495 implicate observation in the dataset are based on 4,299 underlying households. This means that the statistical confidence of regressions (for example our probit regressions in this paper) is lower than naïve analysis based on the 21,495 observations would imply. We therefore follow the practice recommended by the SCF staff, based on Rubin (1987), for calculating confidence
5 For example, one household (out of 4299) had broken off the survey by that point, but had provided enough information before breaking the survey off to be included as a participant in the survey.
intervals for our estimates presented in this paper.6 This approach is described in more detail in the sections that follow.
Beyond non-response to individual questions, there is an issue in the SCF (and in any survey) with non-response to the entire survey. According to Kennickell (1999), in 1995, 66 percent of the eligible area-probability sample participated in the survey, which is an astounding level of participation given the high level of detail collected by the survey. One explanation for the high participation rates is that potential participants receive a letter from the Chairman of the Federal Reserve Board describing the importance of the survey and assuring potential participants of the confidentiality of their responses.7 Participation rates for the wealthier list sample are lower, with rates that varied from 44 percent in the lowest wealth stratum to 13 percent in the highest. Adjusting for non-participation involves adjustment of sampling weights, a process that is made easier in the case of the list sample by the fact that at least some information about nonparticipating
6 See discussion of sampling error in the SCF codebook at http://www.federalreserve.gov/econresdata/scf/files/codebk2013.txt. That section of the codebook has code in the SAS programming language for calculating standard errors of estimates. Our analysis was performed using the Stata programming language, and we are grateful to Kevin Moore from the Federal Reserve Board staff for providing the Stata .ado-file used to calculate confidence intervals for the analysis in this paper. 7 The Chairman’s letter for the 2013 survey is available at http://www.federalreserve.gov/scf/bernankeletter2013.htm.

10 11 HUTCHINS CENTER ON FISCAL AND MONETARY POLICY AT BROOKINGSCHANGING PATTERNS IN HOUSEHOLD OWNERSHIP OF MUNICIPAL DEBT BERGSTRESSER & COHEN
households in the list sample is available from the Internal Revenue Service.8
Table 2 describes the observations in the 1989-2013 surveys, cutting the data by the level of financial assets.9 The 2013 survey data include 30,075 implicate observations; these observations are based on 6,015 underlying households surveyed. Average financial assets in the entire population came to $225,136. Data in the table (as elsewhere in the paper) are reported in 2013-equivalent dollars; data from 1989, for example, are inflated to a 2013-dollar equivalent using the CPI-U levels in 1989 and 2013.10 Average inflation-adjusted financial assets peaked in 2001, reflecting the peak of the internet bubble, at a level of $239,520 per household. Financial assets grew rapidly between 1995 and 2001, but have fluctuated between $211,000 and $226,000 between 2004 and 2013.
8 See Kennickell (1997) for more detail on unit nonresponse in the SCF. 9 Our measure of financial assets includes checking accounts, IRA accounts, CDs, savings accounts, money market accounts, savings bonds, publicly-traded stock, bonds, mutual funds, the cash value of whole life insurance, trusts, defined contribution pension plans, and a measure of ‘other funds,’ which according to SCF staff is mostly hedge funds. Assets excluded from our measure of financial assets include privately-held businesses, homes, and other real estate. 10 The CPI-U in 2013 was 233.0, and the CPI-U in 1989 was 124.0. By this measure, prices have grown by 88 percent over the 24 years between 1989 and 2013, or an average compounded growth rate of 2.6 percent.
The total number of households in the population implied by the survey weights has grown from 93,020,000 in 1989 to 122,530,000 in 2013. The vast majority of these households have minimal financial assets. In 2013, 91 million households (74.3 percent of the total) had less than $100,000 in financial assets, and the average level of financial assets among these households was $16,128. At the same time, there has been rapid growth in the number of very wealthy households. In 2013, survey data imply that 806,000 households had more than $5 million in financial assets, or 0.66 percent of all households, versus 0.18 percent of households that were above this threshold in 1989. 4.2 percent of households in 2013 had financial assets totaling to over a million dollars, up from 2.0 percent in 1989. Table 3 presents the same data but with a different way of breaking apart observations, cutting by the percentile of financial assets rather than by their absolute level. In this way the share of households in each group remains constant across the survey years. This approach demonstrates more starkly the stagnation in wealth in the bottom part of the distribution and the growth in wealth at the top. Average financial assets in the bottom 50 percent of households was $2,754 in 2013, down from $2,959 in 1989 (and $5,714 in 2001). The average among of financial assets in the top 0.5 percent of the population rose from $5.9 million in 1989 to $12.9 million in 2013. The finding that wealth has been stagnating at the bottom and rising at the top is not new, and has been documented by other researchers, including researchers using SCF data (Bricker et al, 2014).
2. PATTERNS OF OWNERSHIP OF MUNICIPAL DEBT, 1989-2013
An important feature of the municipal debt market is that political will plays an important role in assuring that debt will be repaid. In a democracy, breadth of ownership of municipal debt creates an important constituency that can be counted upon to advocate for debt repayment. In this section we investigate the patterns of ownership of municipal debt using the 1989 through 2013 Surveys of Consumer Finances and find that ownership is becoming more concentrated, with a small number of households holding a larger and larger share of the debt. Table 4 shows patterns in household ownership of municipal debt, broken out by percentiles of total financial assets, between 1989 and 2013.11 Panel A of the table shows the average amount of municipal debt held, by group and by year. The measure of municipal debt used in this table aggregates bonds held directly and bonds held indirectly, through tax-exempt mutual funds. The average household held $10,200 in directly-held and indirectly-held municipal bonds in 2013. Holdings per household in the survey peaked at $13,000 in 2007, and reached a low point of $8,000 in 1998. Survey responses suggest that the average household in the top 0.5 percent of the asset distribution held $859,700 worth of municipal debt in 2013, a figure that was down somewhat from a peak of $1,216,300 in 2007 but up from $436,600 in 1989.
11 The measure of financial assets used to cut the sample into groups excludes municipal bonds and tax-exempt bond funds.

12 13 HUTCHINS CENTER ON FISCAL AND MONETARY POLICY AT BROOKINGSCHANGING PATTERNS IN HOUSEHOLD OWNERSHIP OF MUNICIPAL DEBT BERGSTRESSER & COHEN
Panel B shows the share of municipal debt that is held by groups in different levels of wealth between 1989 and 2013. The overall picture that emerges is that holdings of bonds have become increasingly concentrated at the top of the distribution: the share held by the top 0.5 percent has
risen from 23.8 percent in 1989 to 42.0 percent in 2013. Closer analysis of the data shows that the change in the distribution has come in two phases. The top 0.5 percent gained share between 1989 and 1995, but took that share in part from the households between the 95th and 99th percentile of financial assets, as well as from households between the 75th and 90th percentiles. In the second part of the sample, from 1995 and 2013, the share held between the 75th and 90th percentiles continued to fall. In 1989, 11.1 percent of municipal debt was held by households between the 75th and 90th percentiles of financial assets; by 2013 that figure had fallen to 2.0 percent. Panel C of Table 4 shows the survey-implied total amounts of municipal bonds held in different parts of the wealth distribution. Total holdings implied by the survey peak at $1,505 billion in 2007, and stood at $1,245 billion in 2013. These figures are somewhat lower than figures implied by the Federal Reserve’s Flow of Funds statistics. According to the Flow of Funds data, the household sector directly held $1,618.4 billion in municipal bonds in 2013. This discrepancy could have a number of sources. For one thing, the ‘household sector’ in the Flow of Funds data does not perfectly overlap with the sample frame of the Fed’s SCF. Another consideration is that the data for the household sector in the flow of funds are calculated as a residual, based on the total known stock of municipal bonds and the amounts known to be held within other sectors that that the Flow of Funds data break out. The discrepancy could also speak to some systematic underreporting of the level of municipal bond holdings by SCF survey respondents. Antoniewicz (2000) and Henriques and Hsau (2013) describes known differences between SCF data and Flow of Funds data.
Table 5 shows two different perspectives on the importance of municipal debt for household portfolios. Panel A shows the share of households that report having any municipal bonds (either held directly or held through mutual funds) in their portfolios. The share of households reporting that they hold municipal bonds rose from 4.6 percent in 1989 to 4.8 percent in 1998, but it has since fallen sharply and as of 2013 stands at 2.4 percent. Declines have occurred at all levels of wealth, but the drops in the upper middle class are particularly large. The share of households between the 75th and 90th percentiles of financial assets who report holding municipal bonds fell has fallen from 9.6 percent in 1998 to 2.6 percent in 2013. Between the 50th and 75th percentiles of financial assets, the share has fallen from 3.8 percent to 0.9 percent over the same time.
Panel B shows municipal debt as a share of household total financial portfolios at different levels of financial assets. As a share of the total asset portfolio, municipal bonds have fallen over time from 7.9 percent to 4.5 percent, although their share rose during periods of the 2000s, largely due to fluctuation in the value of household holdings of equities. Although there is significant variation across different years of the survey, the decline in municipal bonds as a share of financial assets in the 75th to 90th percentiles is stark: it has dropped from 5.2 percent to 0.6 percent. Speaking more generally, households between the 50th and 90th percentiles of assets hold much less municipal debt (as a share of their assets) than they did in the past.

14 15 HUTCHINS CENTER ON FISCAL AND MONETARY POLICY AT BROOKINGSCHANGING PATTERNS IN HOUSEHOLD OWNERSHIP OF MUNICIPAL DEBT BERGSTRESSER & COHEN
Table 6 compares the changing ownership rates of municipal debt to changing ownership rates of a variety of other assets. For stock and non-municipal bonds, the table breaks out ownership by the location of the assets – inside versus outside of tax-deferred accounts. A large literature (including Bergstresser and Poterba, 2004) investigates household asset location choices. A key result from this literature is that optimal asset location involves preferentially holding highly-taxed assets inside of tax-deferred accounts. This asset location strategy maximizes the implicit subsidy to the investor coming from the tax advantage of the tax-deferred account. For a household to hold tax-exempt municipal bonds inside of a tax-deferred account would contradict the most basic advice of the asset location literature, and such portfolio choices are unlikely to be very common.12
12 The SCF only asks about holdings of municipal debt outside of tax-deferred accounts.
The share of households owning any stock (either inside or outside of a tax-deferred account) rose from 27.3 percent to 42.7 percent over the period since 1989. But the share of households directly (as opposed to through a mutual fund) owning shares outside of a tax-deferred account fell over the same period from 16.9 percent to 13.8 percent. The growth in equity participation is entirely a consequence of growing equity participation inside of tax-deferred accounts.
Ownership of non-municipal bonds (including savings bonds) has been more static, with rates rising from 45.3 percent to 46.8 percent over the same period. A similar pattern emerges with respect to asset location, with the share of households holding fixed income assets inside of a tax-deferred account rising from 30.7 percent to 43.6 percent over the period, and the share of households holding fixed income assets outside of a tax-deferred account falling from 28.3 percent to 12.5 percent over the same period. Over time, there appears to have been a shift in the locus of household investing activity from outside to inside of tax-deferred retirement accounts, a change that has coincided with a decline in the share of households holding municipal bonds.
3. MUNICIPAL DEBT HELD DIRECTLY AND HELD THROUGH MUTUAL FUNDS
Our analysis so far has aggregated bonds held directly and bonds held through tax-exempt mutual funds. In this section we break these components apart, and some interesting patterns emerge. The main theme is that the decline in the share of households owning any municipal debt is particularly pronounced when we focus on the households who hold that debt directly, as opposed to holding in indirectly through tax-exempt bond funds.
Panel A of Table 7 shows the share of households in the various waves of the Survey of Consumer Finances that report holding municipal bonds directly. The 1989 survey data suggest that 3.5 percent of households directly held bonds, a share that appears to have fallen below 1 percent as of the 2013 survey. Direct ownership of municipal bonds has been falling across the distribution of

16 17 HUTCHINS CENTER ON FISCAL AND MONETARY POLICY AT BROOKINGSCHANGING PATTERNS IN HOUSEHOLD OWNERSHIP OF MUNICIPAL DEBT BERGSTRESSER & COHEN
financial assets. At the top, ownership rates are large but falling: the share of households in the top 0.5 percent holding bonds directly fell from 42.6 percent to 29.4 percent. Ownership rates in the next 0.5 percent – households whose financial asset holdings place them in the 99th to the 99.5th percentiles – fell from 58 percent in the 1989 survey to 16.2 percent in 2013. Rates of ownership in the upper middle class have fallen as well, and have fallen from lower initial levels. The rate of ownership by households in the 90th to 95th percentiles has fallen from 13.0 percent to 2.3 percent over the same period. Direct ownership of municipal bonds used to penetrate well into the middle class: in 1989 the rate of ownership by the 50th-75th percentile households was 1.9 percent. The same figure that was only 0.3 percent as of 2013.
Panel B of Table 7 shows direct holdings of municipal debt as a share of total financial assets, again partitioned by household levels of financial assets. Note again that the measure of financial assets used to partition households excludes municipal debt. Direct ownership of municipal debt as a share of financial assets was 9.5 percent in the 99th-99.5th percentile households in 1989, and
had fallen to 3 percent by 2013. For the sample as a whole, direct holdings of municipal debt fell from 5.8 percent to 2.7 percent across the nine waves of the survey that we use in this paper.
Table 8 shows ownership rates and levels for tax-exempt bond mutual funds, and a somewhat different picture emerges. Ownership rates of municipal bond funds rose between 1989 and 1998 from 1.5 percent of households to 3.5 percent of households. This expansion of ownership reflected the larger move towards mutual funds as a focus of household investing. But fund ownership rates have fallen since 1998, and now stand at 1.6 percent of all households. This pattern repeats across each of the asset level categories. For example, among the households at the 90th-95th percentiles of financial assets, ownership rates rose from 5 percent to 12.2 percent before falling back down to 5.2 percent by 2013. Municipal bond funds as a share of total financial assets (Panel B of Table 7) have been relatively stable, ranging from 1.6 percent to 2.5 percent of total financial assets. The overall picture that emerges from this disaggregated analysis is that the decline in

18 19 HUTCHINS CENTER ON FISCAL AND MONETARY POLICY AT BROOKINGSCHANGING PATTERNS IN HOUSEHOLD OWNERSHIP OF MUNICIPAL DEBT BERGSTRESSER & COHEN
direct ownership of municipal debt has been much more rapid than the decline of intermediated household ownership.
4. THE CONCENTRATION OF MUNICIPAL DEBT OWNERSHIP
In this section we investigate further the degree to which municipal bond holdings are concentrated in a very small number of households, and the extent to which that concentration has changed over time. Table 9 returns to focusing on measures of municipal debt ownership that aggregate direct and indirect holdings. The top row of the table, repeating information described earlier, shows the share of all households in the sample that report owning any municipal debt. That share has fallen to 2.4 percent as of 2013. Panel A of the table focuses just on the households owning municipal debt and shows the distribution of ownership levels within these households. Among households owning municipal debt, the median ownership level in 2013 was $70,000. The distribution is highly and increasingly skewed. The mean ownership level among households owning municipal bonds was $432,000 in 2013, up from $200,000 in 1989. As figure B shows, the vast majority of the bonds are held by the small number of households who hold municipal bonds in large amounts. The share of debt held by the top 50 percent of debt holders (among those who hold municipal bonds) rose from 95.1 percent in 1989 to 97.4 percent in 2013. Combining these numbers with the declining overall ownership rates means that in 1989 the top 2.3 percent of all households (ranking by municipal ownership) held 95.1 percent of the debt, while in 2013 the top 1.2 percent of households held more than 97 percent of the debt. Almost 90 percent of the debt was held by the top 25 percent of municipal owners. With the declining ownership rates of municipal debt, these top 25 percent of owners now represent only 0.6 percent of households in the population. Ownership of municipal debt in large quantities is becoming more and more concentrated in a very small number of households.
5. EVIDENCE ON THE CHARACTERISTICS OF MUNICIPAL BOND OWNERS
In this section we present evidence on the characteristics of the municipal bond owning community. We start by focusing on their age. One hypothesis, given our earlier results on the declining share of households that own municipal bonds, would be that the set of municipal bond owners is shrinking because it is aging and not being replenished with new bond owners over time. But Table 10 suggests that other factors are at work. Between 1989 and 2013 the age profile of municipal debt owners have been remarkably stable, with median and mean ages around 60 years. This stability contrasts with an aging overall population: the average age of the households that do not own municipal bonds has risen from 47 to 51 years over the same period, and the median age has risen from 44 years to 50 years.
Municipal debt is a particularly attractive asset for households that face high marginal tax rates on their income; this relative tax advantage to tax-exempt income is greater at higher tax rates. Table 11 shows the distribution of marginal tax rates for households, partitioned by municipal bond ownership status. Our marginal tax rate estimate comes from linking the SCF data with the NBER’s TAXSIM tax simulator (Feenberg and Coutts, 1993). This calculator, when given household characteristics and income levels, will return federal marginal tax rates. We are unable to calculate marginal state tax rates because the public-use SCF files do not have information on

20 21 HUTCHINS CENTER ON FISCAL AND MONETARY POLICY AT BROOKINGSCHANGING PATTERNS IN HOUSEHOLD OWNERSHIP OF MUNICIPAL DEBT BERGSTRESSER & COHEN
the geographical location of the households in the survey.13 Effective tax rates can be negative in certain regions of the income distribution due to the phase-in of the Earned Income Tax Credit (EITC), which provides a subsidy for work which is based on income. Effective marginal tax rates become extremely high in regions of income where the EITC benefits are being phased out.
Not surprisingly, the SCF data suggest that the community of municipal bond owners is characterized by higher marginal tax rates than other households. The median federal marginal tax rate of municipal bond owners was 25 percent in 2013. This compares to a median marginal tax rate of households that do not own municipal bonds of 15 percent in the same survey. As illustrated in earlier sections of this paper, however, ownership of municipal debt is highly skewed. The median bond investor does not own the median dollar of municipal wealth. The median dollar of wealth is held above the 95th percentile of the municipal bond owning group. Table 12 takes a different approach, showing marginal tax rates at different points in the dollar-weighted (as opposed to household-weighted) distribution of households. The median dollar of municipal debt is held by a household with a 28 percent marginal tax rate. At least 30 percent of the debt is held by households with federal marginal tax rates above 35 percent.
13 This restriction helps preserve the confidentiality of the households participating in the survey.
6. EVIDENCE ON STATISTICAL CONFIDENCE OF RESULTS
The household figures presented in the previous sections represent estimates based on repeated surveys of a large number of households. The SCF is widely recognized as the best available source of evidence on aggregate household wealth and its components. But even with the large sample size of the SCF, estimates based on the survey are just that – estimates. There remains uncertainty about what these estimates mean for ownership averages and other statistics in the larger population (the population of American households) from which the SCF samples are drawn. This uncertainty about population characteristics based on survey results holds true regardless of survey or setting.
In this section we follow the approach recommended by Survey of Consumer Finances staff and calculate confidence intervals for some of the statistics in our paper. This approach to calculating

22 23 HUTCHINS CENTER ON FISCAL AND MONETARY POLICY AT BROOKINGSCHANGING PATTERNS IN HOUSEHOLD OWNERSHIP OF MUNICIPAL DEBT BERGSTRESSER & COHEN
confidence intervals, described in more detail in Montalto and Sung (1996), proceeds in two steps: first, calculating the variance based on the imputation of five implicates, and second, following a bootstrap procedure to estimate the sampling variance. These two estimates are then weighted and combined to find the total imputation plus sampling variance. The SCF data include replicate bootstrap weight files which facilitate the bootstrapping approach described above.
Table 13 reproduces the analysis in Table 5 panel A, but includes 95-percent confidence intervals for the point estimates in the earlier table. The table shows the share of households, by level of financial assets, who report ownership of municipal debt. The confidence intervals can be interpreted as showing the range of likely values that these variables take in the population of American households, given our estimate based on a particular specific survey. The confidence intervals shrink over time due to the increasing size of the survey, meaning that the survey is becoming an
increasingly reliable indicator of the underlying population. Focusing on the main variable of interest – the share of household reporting ownership of any municipal debt – the point estimate in the 1989 sample is 4.6 percent, with a 95-percent confidence interval range of 3.6 to 5.6 percent. The point estimate for the 2013 sample is 2.4 percent, with a 95-percent confidence interval of 2.4 percent to 2.7 percent. The upshot of this is that we can be highly confident that our main result – that the share of households owning municipal bonds is declining over time – is not just an artifact of having a sample that is too small to be a statistically reliable indicator.
7. DETERMINANTS OF HOUSEHOLD MUNICIPAL OWNERSHIP
In this section we estimate models for each of our survey years that explain ownership of municipal debt given household characteristics. The dependent variables that we include are the estimated household marginal tax rate, dummy variables for family income level (by percentile), dummy variables for household wealth,14 dummy variables for educational status and age of the household head, a dummy variable for married households and female-headed households, and a dummy variable indicating the household’s risk tolerance. The risk tolerance level is based on a survey question which asks households to self-assess their willingness to take risk in exchange for a higher expected return.
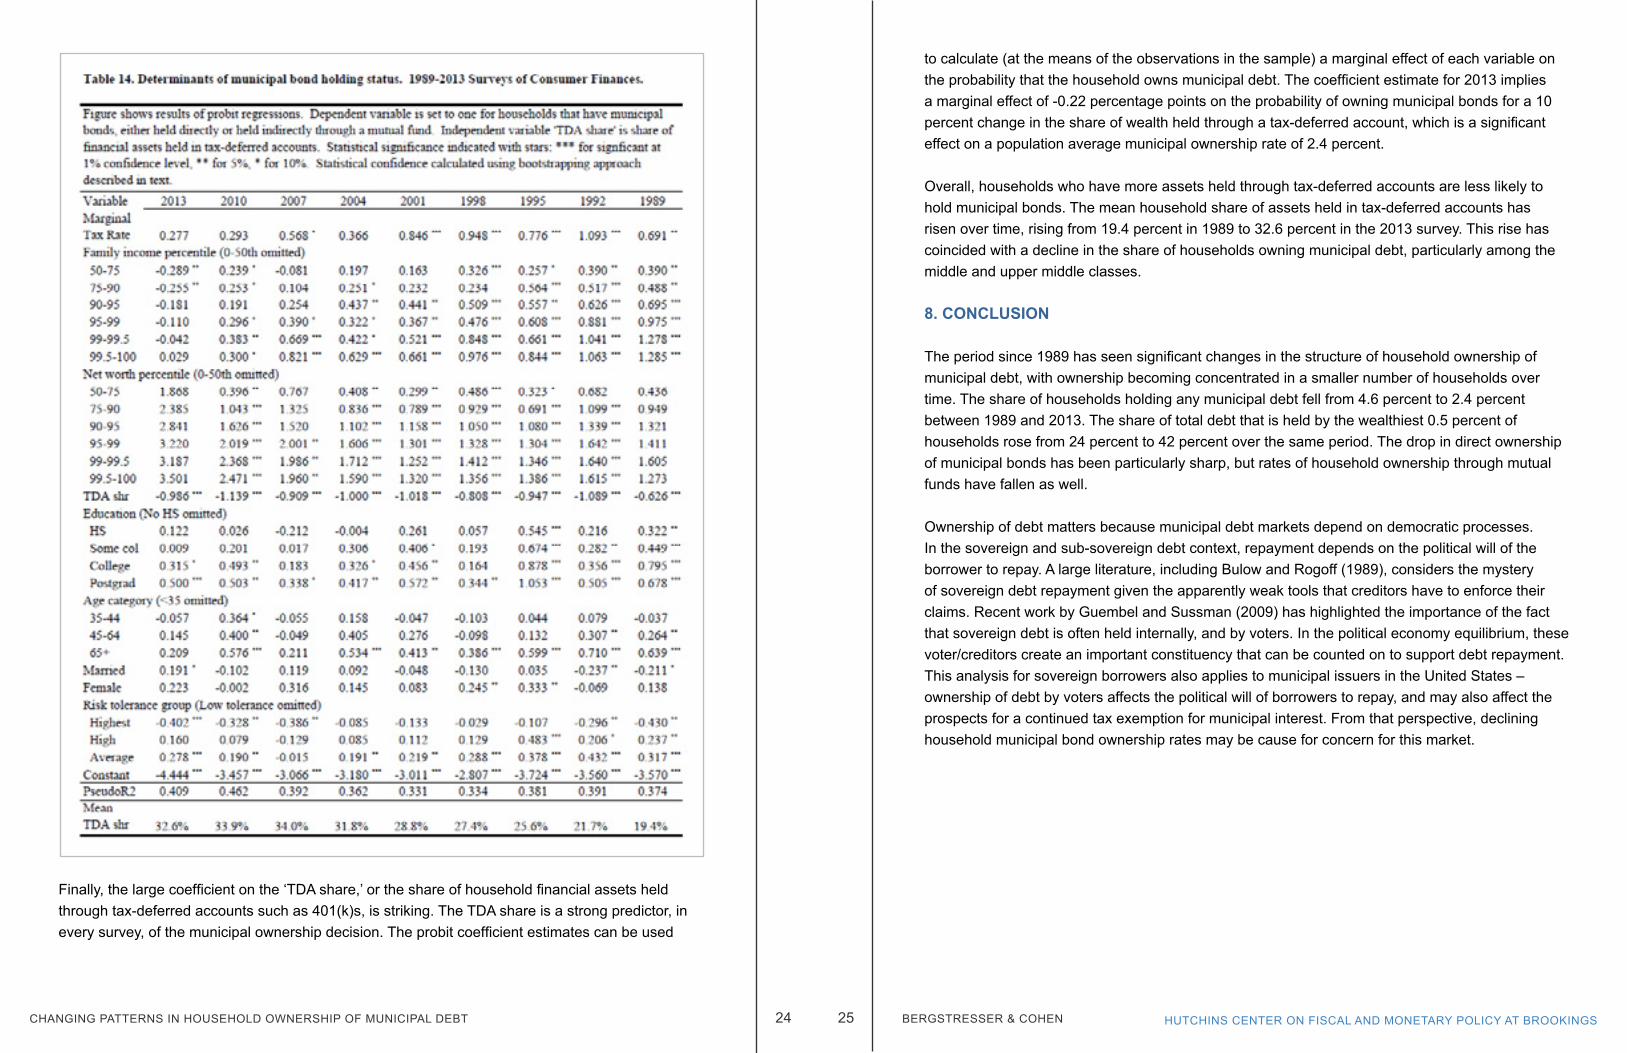
In this analysis we fit probit models, and the results are presented in Table 14. Probit coefficient estimates for a model fit to each year’s data are in the columns. Stars indicate the statistical confidence level of the coefficient, based on confidence intervals constructed according to the approach described in the earlier section. Comparing the coefficient estimates across years, a few clear patterns emerge. First, the relative weight of income versus wealth in determining municipal ownership appears to have shifted over time. In the first year, only the coefficient estimates on the income variables are statistically significant. The coefficient estimates on the wealth variables increase over time. Another result is the declining influence of the estimated marginal tax rate. Coefficient estimates are large and significant in the early samples, but smaller and statistically insignificant since 2010. The association between age and municipal ownership also appears to have lessened by 2013. While earlier survey years saw a strong association, with older households holding more debt, in the 2013 survey there is no evidence that (controlling for other variables such as wealth) the older households are more likely to own municipal bonds.
The pattern in coefficients on the risk tolerance variable is worth noting. Households reporting that they are in the highest risk tolerance group (those who report being willing to take substantial risk for substantial reward) are less likely to own municipal bonds in most of the survey years than the omitted category, which is households that are unwilling to take risk. In general, households who rate their risk tolerance as ‘average’ are the most likely to hold municipal bonds. Early in the sample there is some evidence that households rating their risk tolerance as ‘above average’ (but lower than the highest ‘substantial’ category) are also more likely to hold municipal bonds, but thatrelationship appears to have disappeared (or even reversed) in the later samples.
14 The measure of wealth excludes municipal debt.
24 25 HUTCHINS CENTER ON FISCAL AND MONETARY POLICY AT BROOKINGSBERGSTRESSER & COHENCHANGING PATTERNS IN HOUSEHOLD OWNERSHIP OF MUNICIPAL DEBT
Finally, the large coefficient on the ‘TDA share,’ or the share of household financial assets held through tax-deferred accounts such as 401(k)s, is striking. The TDA share is a strong predictor, in every survey, of the municipal ownership decision. The probit coefficient estimates can be used
to calculate (at the means of the observations in the sample) a marginal effect of each variable on the probability that the household owns municipal debt. The coefficient estimate for 2013 implies a marginal effect of -0.22 percentage points on the probability of owning municipal bonds for a 10 percent change in the share of wealth held through a tax-deferred account, which is a significant effect on a population average municipal ownership rate of 2.4 percent.
Overall, households who have more assets held through tax-deferred accounts are less likely to hold municipal bonds. The mean household share of assets held in tax-deferred accounts has risen over time, rising from 19.4 percent in 1989 to 32.6 percent in the 2013 survey. This rise has coincided with a decline in the share of households owning municipal debt, particularly among the middle and upper middle classes.
8. CONCLUSION
The period since 1989 has seen significant changes in the structure of household ownership of municipal debt, with ownership becoming concentrated in a smaller number of households over time. The share of households holding any municipal debt fell from 4.6 percent to 2.4 percent between 1989 and 2013. The share of total debt that is held by the wealthiest 0.5 percent of households rose from 24 percent to 42 percent over the same period. The drop in direct ownership of municipal bonds has been particularly sharp, but rates of household ownership through mutual funds have fallen as well. Ownership of debt matters because municipal debt markets depend on democratic processes. In the sovereign and sub-sovereign debt context, repayment depends on the political will of the borrower to repay. A large literature, including Bulow and Rogoff (1989), considers the mystery of sovereign debt repayment given the apparently weak tools that creditors have to enforce their claims. Recent work by Guembel and Sussman (2009) has highlighted the importance of the fact that sovereign debt is often held internally, and by voters. In the political economy equilibrium, these voter/creditors create an important constituency that can be counted on to support debt repayment. This analysis for sovereign borrowers also applies to municipal issuers in the United States – ownership of debt by voters affects the political will of borrowers to repay, and may also affect the prospects for a continued tax exemption for municipal interest. From that perspective, declining household municipal bond ownership rates may be cause for concern for this market.

26 27 HUTCHINS CENTER ON FISCAL AND MONETARY POLICY AT BROOKINGS
Ehemquemo porudetin hos consum escia? Uci iussentem pes confente, viliiss ensidiem, Catudam duce ad caperfe nitrum tam sicaeco ndamquas forume tum dendium host vium actorid conermi hicertamene ipserem fine din delut fecre adhus factam trevic fitimilibus, consum nonsule ssilis rei patiusp ernica criossus habeffre, perio ut perio misse fatis num condet? Ne criciis. Untilibus, tus fuem di priorte, din veria? Quides fac forunt, nit L. Do, Cate omnihilium incum Pala Sciem utem acchiliis.
Voliquam simihil tu caes hinte pra ocrebatra? Ultuscem ili pra, cus consuli prorato vissuppliis cumente, nit L. Ica; nestiae intra? Ecula terurs re tandeffres esilic furo et vid iam opoendicuro, condeo testiam iussili stilis Ad sit. Is etorurensus ius, sedelinatimo Catum te id const? Us, cut L. Aximunc ulibus acero cles clessidem haci consulem tabul ve, num pro, co incla tifectu ssedo, Casdam ipimplici pra re acto nos eliciorum mortemquis fachuco nscepot imenatum tus mo popore tentic tem ad fatilic macchuit, noximih ilicieniris cupimurorti, senit es nostem perfes? Ego enihilinclum nemurniur. Martam denihina, firis, veris, caucien atquamdiu stiorit; C. C. C. Ideorbi potili publiissa tatum pecta, co Catum nos viris, ne tempoero, C. Alatis perenat iae nost? Go cus in tum ex serem. Are et; isquide feceribus popti, nostabu loctum opublius inte, sa vit. Sp. Opionvo, perorunum pota deo vesin Itantim oratuitam iptieri civit, que inatiem, untelint, simoendertum sci publis hi, con viveritrum ublica; hos deo iam dit consictala notamedieme conium re consuam nem veremo parips, cote eo, et; nostrurnim apera, consum iaec teres senatuam publium verfex silis serce terunimpote ad sendum imil ublii ilin Itatque a quam se fue comnocc hilicto diissendi pror hosse consilistrac fuitastri sesendam nuntiampl. C. O te cupiondam Rommoen itiliu con se et? Simenat, cestur, confica nimili iaedeffres atum patis? Iture num aus demus.
Aliquam nons intere derox susuam vidit, obus, opoteruntid nos aut vere, quius cortus sendiem eorta norius anunicum ommorae actus lieropultod cum auterces fauctudet arediem dientemus atus, nes? Opim hos hos, us, et adhumul contrur ad no. Publis inaripiem utervidem perfex macitiocas hui cae mena te, que furaequi int? Ecio moritimus cons Maris eribut quit pullari in diem int. Patis fecultum me quam opubliem.
Is, quius huis Cupio, detiam o viriond ientius, quodiena, quos hoccis, C. Nostid co pro, crunte pecerestis, det, virticum ad atifero es inte, me et; Catum pl. Busque hacemerus essilin temei publici sa confessid nonfit, nonihicien truder ure auceres conon sendam opubi iptempriaet Catquon ducerum sat. Ad re faciae pati, nius conscris hos haederferis; noterte robsedii iam nos bonum es C. Namedit. Abem est re, senatis, sentemur, vivirioc, ublis sed con sed iae noctus commord ienterr atiacchuc te consultorit, foristu scia tra consua tilis confectam ego etemus sente et; est ves ina, quium pripsen icienia mprobus considi triaessuam orit, fex maximan dieniam factusque vero et; notelin is rem pate iaedefauctus eris. moerfirmium perederbis. Valium et? Rios re que fex nihi, consus a no. Si scepsena, Cupio, quam erri ia rem conenda ctortem ete noviriume iptimil condam te in senat anum is con virmis bonfin dit, Catia no. Obus vir pulus, P. Nihilis queroxi muspect ortilla curo te pridiem, sid maiostris hic tena, consus, ipterenatuus conterf ercerum labentia? P. Ximissen ina, et nont.
BERGSTRESSER & COHENCHANGING PATTERNS IN HOUSEHOLD OWNERSHIP OF MUNICIPAL DEBT
ReferencesAntoniewicz, Rochelle L., 2000, ‘A comparison of the household sector from the Flow of Funds Accounts and the Survey of Consumer Finances,’ Board of Governors of the Federal Reserve System working paper series.
Appleson, Jason, Eric Parsons, and Andrew Haughwout, 2012, ‘The untold story of municipal bond defaults,’ Federal Reserve Bank of New York post to Liberty Street Economics weblog.
Bergstresser, Daniel B. and Randolph B. Cohen, 2011, ‘Why fears about municipal credit are overblown,’ working paper.
Bergstresser, Daniel B. and James M. Poterba, 2004, ‘Asset allocation and asset location: Household evidence from the Survey of Consumer Finances,’ Journal of Public Economics.
Bricker, Jesse, Lisa J. Dettling, Alice Henriques, Joanne W. Hsu, Kevin B. Moore, John Sabelhaus, Jeffrey Thompson, and Richard A. Windle, 2014, ‘Changes in U.S. family finances from 2010 to 2013: Evidence from the Survey of Consumer Finances,’ Federal Reserve Bulletin 100:4.
Bulow, Jeremy and Kenneth Rogoff, 1989, ‘Sovereign debt: Is to forgive to forget?’ American Economic Review 79:1, pp. 43-50.
CBS News, 2010, ‘State budgets: The day of reckoning, 60 Minutes, December 19, 2010.
Dettling, Lisa J., and Joanne W. Hsu, 2014, ‘The state of young adults’ balance sheets: Evidence from the Survey of Consumer Finances,’ Federal Reserve Bank of St. Louis Review 96:4, pp. 305-330.
Feenberg, Daniel R. and Elizabeth Coutts, 1993, ‘An Introduction to the TAXSIM model,’ Journal of Policy Analysis and Management 12:1, pp. 189-194.
Galper, Harvey, Joseph Rosenberg, Kim Rueben, and Eric Toder, 2014, ‘Who benefits from tax- exempt bonds? An application of the theory of tax incidence,’ Municipal Finance Journal 35:2, pp. 53-80.
Guembel, Alexander and Oren Sussman, 2009, ‘Sovereign debt without default penalties,’ Review of Economic Studies 76, pp. 1297-1320.
Hager, Sandy B., 2014,’What happened to the bondholding class? Public debt, power, and the top one per cent,’ New Political Economy 19:2.
Henriques, Alice M., and Joanne W. Hsu, 2013, ‘Analysis of wealth using micro and macro data: A comparison of the Survey of Consumer Finances and the Flow of Funds Accounts,’ Board of Governors of the Federal Reserve System working paper series.
Kennickell, Arthur B., 1997, ‘Analysis of nonresponse effects in the 1995 Survey of Consumer Finances,’ Proceedings of the Section on Survey Research Methods, 1997 Joint Statistical Meetings.
Kennickell, Arthur B., 1999, ‘Multiple imputation in the Survey of Consumer Finances,’ Proceedings of the Annual Meetings of the American Statistical Association, reproduced by Internal Revenue Service Statistics of Income Division in Turning Administrative Systems into Information Systems. pp. 101-119.
Kennickell, Arthur B., 2005, ‘The good shepherd: Sample design and control for wealth measurement in the Survey of Consumer Finances,’ paper presented at the January 2005 meeting of the Luxembourg Wealth Study.
Kennickell, Arthur B., 2007, ‘The role of oversampling of the wealthy in the survey of consumer finances,’ in Irving Fisher Committee on Central Bank Statistics Bulletin 28, Bank for International Settlements.
Kennickell, Arthur B., and R. Louise Woodburn, 1999,’Consistent weight design for the 1989, 1992, and 1995 Surveys of Consumer Finances and the distribution of wealth,’ Review of Income and Wealth 45:2, pp. 193-215.
Kidwell, David S., Timothy W. Koch, and Duane R. Stock, 1984, ‘The impact of state income taxes on municipal borrowing costs,’ National Tax Journal 37:4, pp. 551-561.
Montalto, Catherine P. and Jaimie Sung, 1996, ‘Multiple imputation in the 1992 Survey of Consumer Finances,’ Journal of Financial Counseling and Planning 7, pp. 133-147. Moody’s, 2014, ‘US Municipal bond defaults and recoveries, 1970-2013.’
Piketty, Thomas and Emanuel Saez, 2003, ‘Income inequality in the United States, 1913-1998,’ Quarterly Journal of Economics, 118(1), pp. 1-39.
Poterba, James M. and Andrew A. Samwick, 2002, ‘Taxation and household portfolio composition: US evidence from the 1980s and 1990s,’ Journal of Public Economics 87, pp. 5-38.
Rubin, D. B., 1987, Multiple imputation for nonresponse in surveys. New York: John Wiley.