Changing Migration - Changing Environment Current migration research from integration prospective...
25
Changing Migration - Changing Environment Current migration research from integration prospective Ágnes Hárs Kopint-Tarki CEU, Budapest, 27th June 2011
-
Upload
alexis-barker -
Category
Documents
-
view
214 -
download
0
Transcript of Changing Migration - Changing Environment Current migration research from integration prospective...

Changing Migration - Changing Environment Current migration research from integration prospective
Ágnes Hárs Kopint-Tarki
CEU, Budapest, 27th June 2011

Share of migrant population vs migrant labour in Europe (prior crisis, 2007)
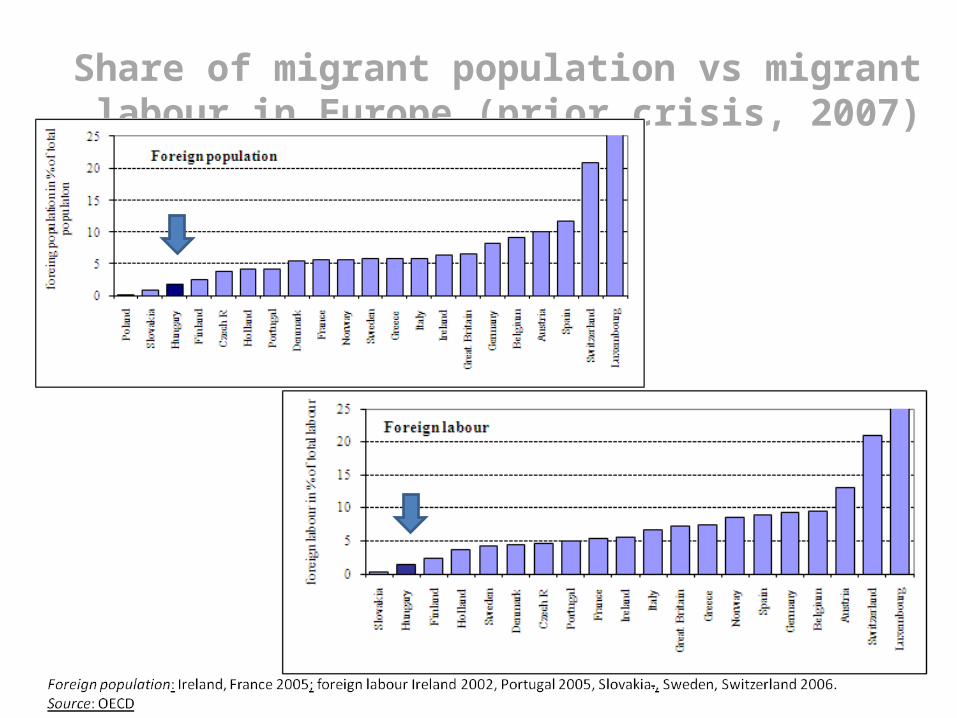
Share of migrant population vs migrant labour in Europe (prior crisis, 2007)

Theorethical background: the IDEA project
• On the basis of both similarities and differences, meaningful groupings of immigration receiving countries in Europe can be identified.
• To be significant, each group will comprise those countries which show the greater similarities among them and the greater differences with the other.
• The groups selected are meaningful and relevant if similarities prevail over differences, and if differences with countries in other groups are generally larger than among them.
• Three major regional groups of countries can be identified in Europe. Each of them is relatively homogeneous and different from the other groups, chiefly on account of historical and structural factors. Three regions often identified in Europe: North Western Europe, Southern Europe and Central-Eastern Europe are usual regional labels.

Theorethical background: the IDEA project• Hypothesis 1: Immigration receiving countries are bound to differ
significantly on account of the stage of the migration cycle in which they find themselves, as this decisively affects the composition of the population of immigrant background and the relationships and its changing relationship with the general population. In the course of their immigration experience, receiving countries go through a migration cycle.
• Hypothesis 2: The position of an immigration country in the recentness/maturity scale has another implication that can be alluded to as a ‘generation effect’. It stems from the influence exerted on the course and characteristics of the immigration experience by the historical context in which their initial and formative phases took place. Especially influential elements of this context may be the types of immigration flows prevailing in that period and the socio-economic conditions that determine them, the dominant conceptions of migration, and the main characteristics of the international economic order and of socio-economic regimes.

Theorethical background: the IDEA project• Hypothesis 3: Immigration receiving countries in Europe are bound to
differ on account of their defining structural characteristics, i.e. types of economy and social system that result in different intensities and types of labour demand, and different orientations towards the inclusion or exclusion of foreigners, and in different degrees of openness or closeness towards the admission and incorporation of immigrants.
• Hypothesis 4: The relative weight of the different types of immigration flows – labour migration, family reunion, asylum, and irregular streams – among countries and possibly groups of countries have different socio-economic impacts and contribute to different perceptions of immigration from the general population. It may have an impact on the economic and social impacts of immigration and on the perception the public has of it (more wanted or unwanted). In turn both impacts and perceptions may affect policies, flows and integration outcomes.

Source: immigrants : OECD, total population: Demography Report 2008

Source: immigrants : OECD, total population: Demography Report 2008

Source: immigrants : OECD, total population: Demography Report 2008
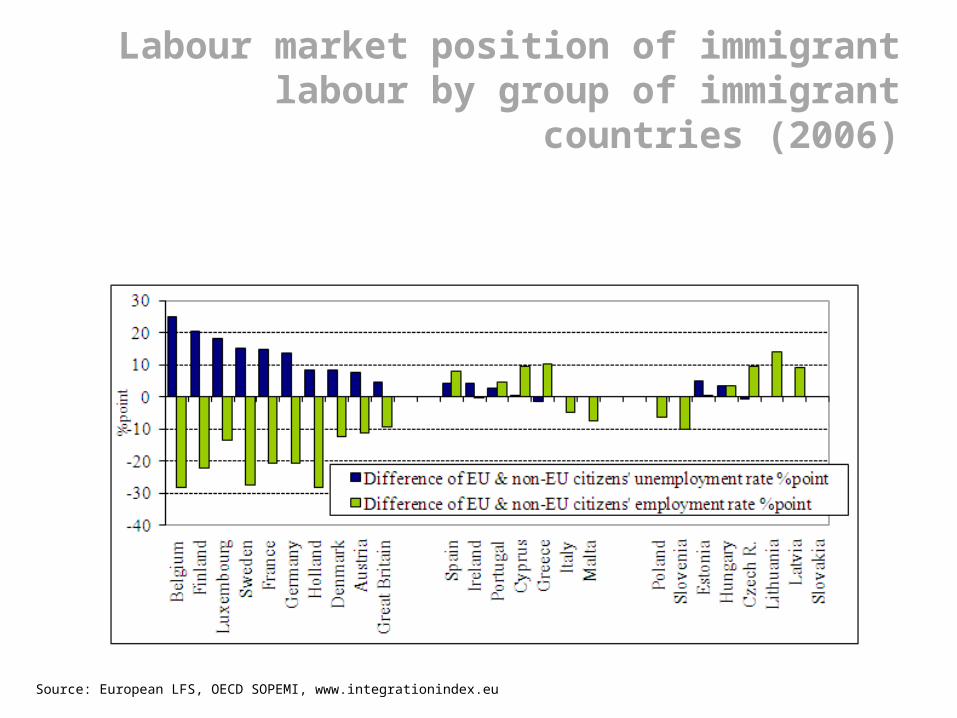
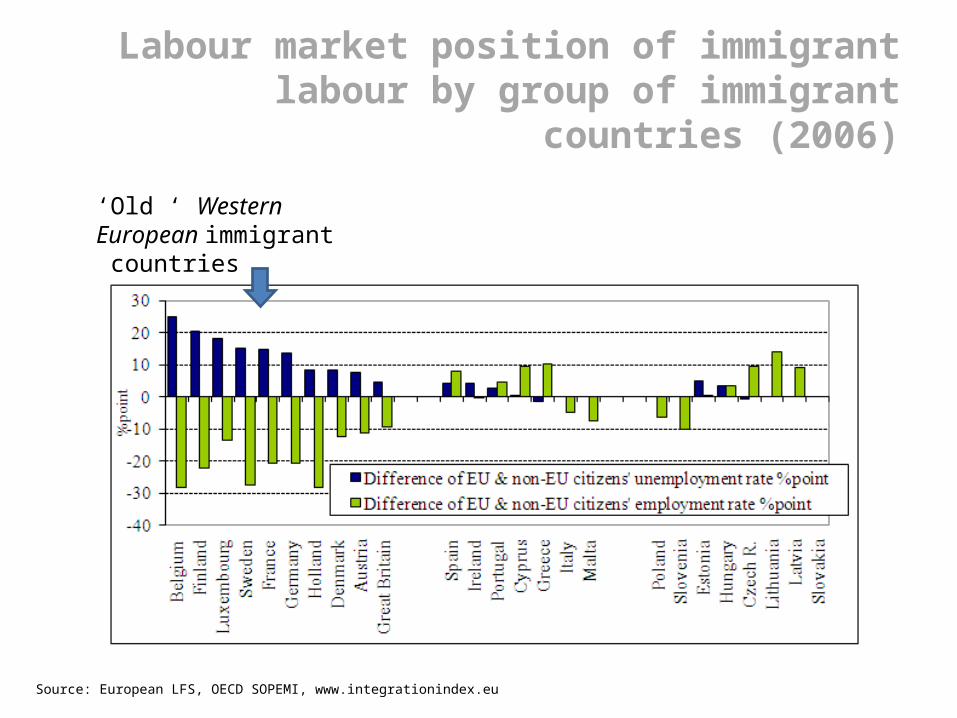
Labour market position of immigrant labour by group of immigrant countries (2006)
Source: European LFS, OECD SOPEMI, www.integrationindex.eu
Labour market position of immigrant labour by group of immigrant countries (2006)
‘Old ‘ Western European immigrant countries
Source: European LFS, OECD SOPEMI, www.integrationindex.eu

Labour market position of immigrant labour by group of immigrant countries (2006)
‘Old ‘ Western European immigrant countries
‘New’ South European immigrant countries
Source: European LFS, OECD SOPEMI, www.integrationindex.eu

Labour market position of immigrant labour by group of immigrant countries (2006)
‘Old ‘ Western European immigrant countries
‘New’ South European immigrant countries
‘Future’ Eastern European immigrant countries
Source: European LFS, OECD SOPEMI, www.integrationindex.eu
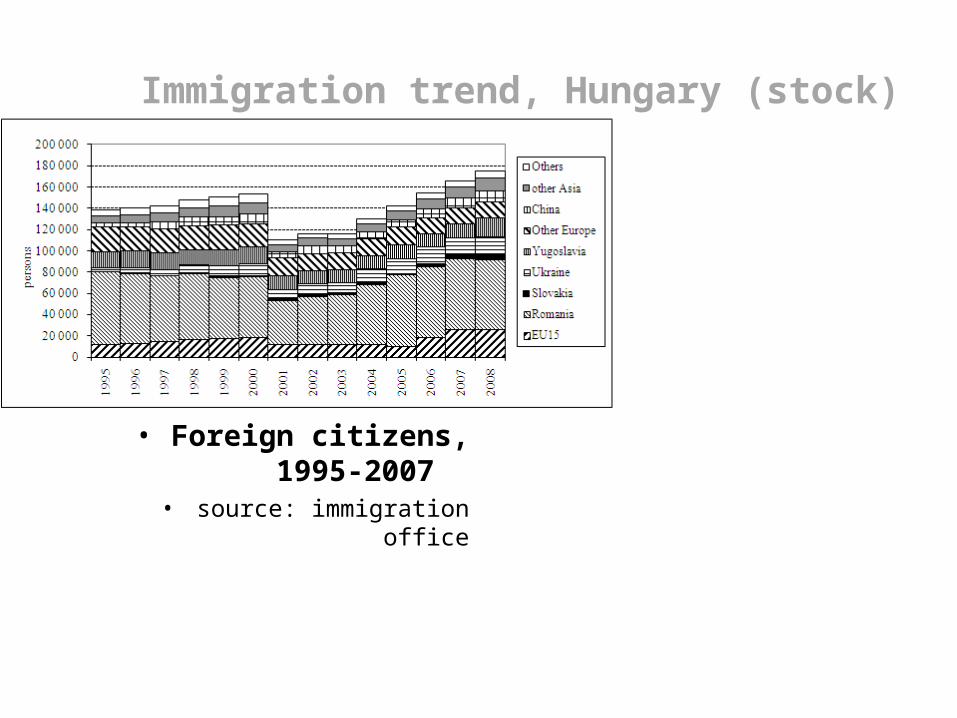
Immigration trend, Hungary (stock)
• Foreign citizens, 1995-2007 • source: immigration office

Immigration trend, Hungary (stock)
• Foreign labour, 1990-2007 • source: work permit
• Foreign citizens, 1995-2007 • source: immigration office

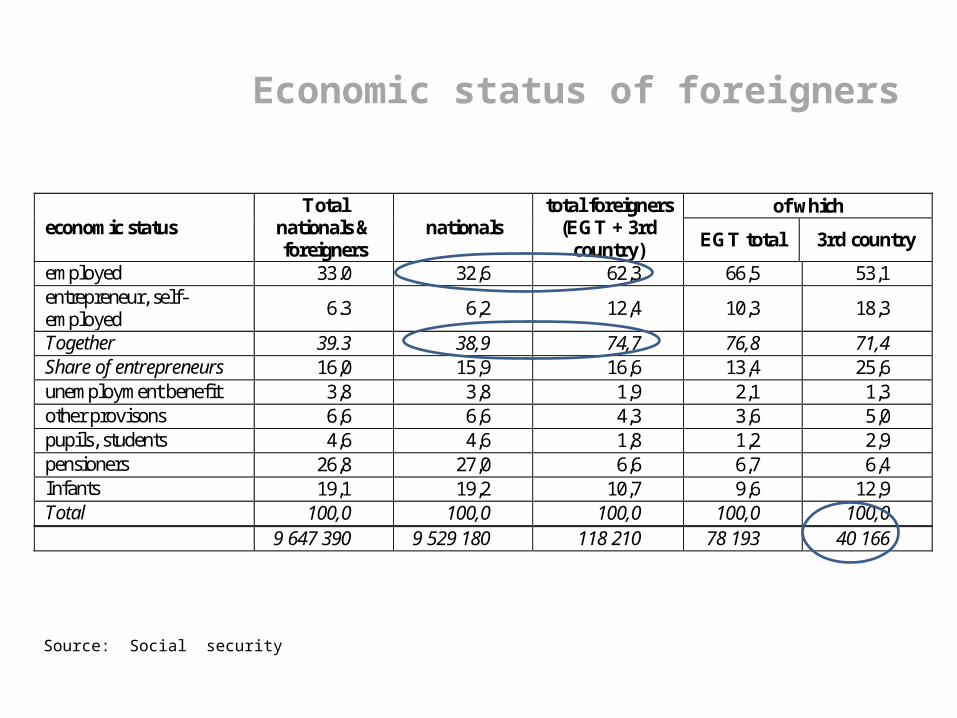
Economic status of foreigners
economic status Total
nationals & foreigners
nationals total foreigners
(EGT + 3rd country)
of which
EGT total 3rd country
employed 33.0 32,6 62,3 66,5 53,1 entrepreneur, self-employed
6.3 6,2 12,4 10,3 18,3
Together 39.3 38,9 74,7 76,8 71,4 Share of entrepreneurs 16,0 15,9 16,6 13,4 25,6 unemployment benefit 3,8 3,8 1,9 2,1 1,3 other provisons 6,6 6,6 4,3 3,6 5,0 pupils, students 4,6 4,6 1,8 1,2 2,9 pensioners 26,8 27,0 6,6 6,7 6,4 Infants 19,1 19,2 10,7 9,6 12,9 Total 100,0 100,0 100,0 100,0 100,0 9 647 390 9 529 180 118 210 78 193 40 166
Source: Social security

Economic status of 3rd country nationals
economic status 3rd country
nationals Ukraine Serbia Russia China Vietnam Others
employed 53,1 58,6 69,4 36,9 50,6 36,2 51,2 entrepreneur, self-employed 18,3 9,1 11,7 21,7 28,5 31,6 20,7 Together 71, 67,7 81,2 58,6 79,1 67,8 71,9 Share of entrepreneurs 13,4 14,5 37,0 36,1 46,6 28,7 13,4 unemployment benefit 1,3 1,7 1,1 1,6 0,1 0,1 1,7 other provisons 5,0 5,4 3,1 5,0 1,8 4,4 6,8 pupils, students 2,9 2,7 6,1 4,5 0,5 3,1 3,7 pensioners 6,4 13,5 0,3 17,1 0,1 0,1 2,9 Infants 12,9 9,0 8,3 13,3 18,3 24,4 12,9 Total 100,0 100,0 100,0 100,0 100,0 100,0 100,0 40 166 13 577 2 181 2 045 7 066 2 150 13 147
share 100 33,8 5,4 5,1 17,6 5,4 32,7
Source: Social security

Limited pull effects on the Hungarian labour market
Ajánlott linkek az IDEA kutatás eredményeihez
http://www.mtaki.hu/uj_intezeti_kiadvanyok/uj_intezeti_kiadvanyok_20100924_003318.html
http://www.idea6fp.uw.edu.pl/?strona=4