Changing Information Technology strategies to cope with ...
177
i Changing Information Technology strategies to cope with funding changes within Higher Education By Jeremy Byrne 10BSP763 – Masters Project January 2012 Supervisor: Professor Neil Doherty, Business School, Loughborough University © Jeremy Byrne 2012
Transcript of Changing Information Technology strategies to cope with ...

i
Changing Information Technology
strategies to cope with funding changes
within Higher Education
By
Jeremy Byrne
10BSP763 – Masters Project
January 2012
Supervisor: Professor Neil Doherty, Business School,
Loughborough University
© Jeremy Byrne 2012

ii
Abstract
This report analyses the trends in expected changes for strategic direction of
information technology departments and also the service delivery within higher
education institutions through the use of a questionnaire. It finds a common trend
amongst higher education institutions whereby there is a shift towards the
outsourcing of Information Technology (IT) services. It highlights the need for change
management methodologies for these types of changes to be a success and also
how benefits of change if properly managed can be successfully realised.

iii
Contents Abstract..................................................................................................................................ii
List of acronyms and abbreviations ...................................................................................... vii
Introduction ........................................................................................................................... 1
Aims of the research ............................................................................................................. 3
Objectives ............................................................................................................................. 4
Literature review ................................................................................................................... 5
The Drivers for Change – the HE and IT environments ..................................................... 5
The need for a strategic approach to the challenges of change ......................................... 7
IT Service delivery ............................................................................................................. 9
Service Delivery - Total Quality Management (TQM) ................................................... 10
Service Delivery - Insourcing and Outsourcing ................................................................ 12
Service Delivery - Business Process Re-engineering (BPR) ........................................ 15
Service Delivery - Benefits Realisation ............................................................................ 20
Change Management and Organisational Culture ........................................................... 23
Implementing change ................................................................................................... 23
Hypotheses ......................................................................................................................... 30
Research Methodology ....................................................................................................... 33
Pilot ................................................................................................................................. 36
Design ............................................................................................................................. 38
Section One: Personal information ............................................................................... 38
Section Two: Current situation ..................................................................................... 39
Section Three: Five Years Time ................................................................................... 40
Section Four: Change Management............................................................................. 41
Implementation ............................................................................................................ 44
Follow up emails .......................................................................................................... 45
Response rate ............................................................................................................. 45
Telephone interviews ....................................................................................................... 46
Face to face interviews .................................................................................................... 47
Research Results Summary ................................................................................................ 48
Data cleaning .................................................................................................................. 48
1) Hypothesis results on strategic priority ......................................................................... 54
Hypothesis 1A ................................................................................................................. 54
Test .............................................................................................................................. 54
Result .......................................................................................................................... 55

iv
Discussion ................................................................................................................... 56
Conclusion ................................................................................................................... 57
Hypothesis 1B ................................................................................................................. 57
Test .............................................................................................................................. 57
Result .......................................................................................................................... 57
Discussion ................................................................................................................... 61
Conclusion ................................................................................................................... 61
Hypothesis 1C ................................................................................................................. 61
Test .............................................................................................................................. 61
Result .......................................................................................................................... 61
Discussion ................................................................................................................... 62
Conclusion ................................................................................................................... 63
Hypothesis 1D ................................................................................................................. 63
Test .............................................................................................................................. 63
Result .......................................................................................................................... 64
Discussion ................................................................................................................... 68
Conclusion ................................................................................................................... 69
Hypothesis 1E ................................................................................................................. 69
Test .............................................................................................................................. 69
Result .......................................................................................................................... 70
Conclusion ................................................................................................................... 72
Conclusion ................................................................................................................... 72
2) Hypothesis results on service delivery ......................................................................... 73
Hypothesis 2A ................................................................................................................. 73
Test .............................................................................................................................. 74
Result .......................................................................................................................... 74
Discussion ................................................................................................................... 76
Conclusion ................................................................................................................... 77
Hypothesis 2B ................................................................................................................. 77
Test .............................................................................................................................. 77
Result .......................................................................................................................... 78
Discussion ................................................................................................................... 81
Conclusion ................................................................................................................... 81
Hypothesis 2C ................................................................................................................. 82
Test .............................................................................................................................. 82

v
Result .......................................................................................................................... 83
Discussion ................................................................................................................... 85
Conclusion ................................................................................................................... 85
Hypothesis 2D ................................................................................................................. 85
Test .............................................................................................................................. 85
Result .......................................................................................................................... 86
Discussion ................................................................................................................... 90
Conclusion ................................................................................................................... 90
Hypothesis 2E ................................................................................................................. 90
Test .............................................................................................................................. 90
Result .......................................................................................................................... 91
Discussion ................................................................................................................... 94
Conclusion ................................................................................................................... 94
3) Hypothesis results on benefits realisation .................................................................... 94
Hypothesis 3A ................................................................................................................. 94
Test .............................................................................................................................. 94
Result .......................................................................................................................... 95
Discussion ................................................................................................................... 98
Conclusion ................................................................................................................... 98
Hypothesis 3B ................................................................................................................. 98
Test .............................................................................................................................. 98
Result .......................................................................................................................... 99
Discussion ................................................................................................................. 102
Conclusion ................................................................................................................. 102
Hypothesis 3C ............................................................................................................... 102
Test ............................................................................................................................ 103
Result ........................................................................................................................ 103
Conclusion ................................................................................................................. 107
4) Hypothesis results on change management ............................................................... 107
Hypothesis 4A ............................................................................................................... 107
Test ............................................................................................................................ 108
Result ........................................................................................................................ 108
Discussion ................................................................................................................. 111
Conclusion ................................................................................................................. 111
Hypothesis 4B ............................................................................................................... 111

vi
Test ............................................................................................................................ 111
Result ........................................................................................................................ 112
Discussion ................................................................................................................. 115
Conclusion ................................................................................................................. 115
Hypothesis 4C ............................................................................................................... 115
Test ............................................................................................................................ 115
Results ....................................................................................................................... 116
Discussion ................................................................................................................. 118
Conclusion ................................................................................................................. 118
Hypothesis 4D ............................................................................................................... 118
Test ............................................................................................................................ 118
Results ....................................................................................................................... 119
Discussion ................................................................................................................. 122
Conclusion ................................................................................................................. 122
Discussion and Conclusions ............................................................................................. 123
Conclusions ............................................................................................................... 127
Improvements to this research ................................................................................... 129
Recommendations ..................................................................................................... 130
References .................................................................................................................... 131
Appendix ........................................................................................................................... 140
A) Interview with the Vice Chancellor of Loughborough University .......................... 140
B) Survey ...................................................................................................................... 142
C) Survey Results ......................................................................................................... 146
D) Results Table ............................................................................................................ 169

vii
List of acronyms and abbreviations
BR: Benefits Realisation
BRM: Benefits Realisation Management
BPR: Business Process Reengineering
HE: Higher Education
HEFCE: The Higher Education Funding Council for England
HRM: Human Resource Management
IS: Information Services / Information Systems
IT: Information Technology
JISC: Joint Information Systems Committee
ROI: Return On Investment
TQM: Total Quality Management

1
Introduction
Higher Education‟s (HE) institutions in England and Wales are facing a particularly
challenging period. Resources are being effectively cut in most institutions, and at a
time when all institutions are dealing with better-informed (and thus probably more
demanding) 'consumers' of their 'product'. IT services occupy a crucial role in all
these institutions - not just in providing efficient support services but also responding
directly to consumers [primarily students] increasing expectations.
In 2010 the Browne report and the Government‟s Comprehensive Spending Review
signalled a step change in the way that Higher Education will function in the UK. IT
is already a key strategic tool for institutions. This project will look at how IT service
provision is changing to cushion the blow of the funding changes, and help
institutions to position themselves for future success. It will focus on changes in
service delivery (insourcing, co-sourcing and outsourcing), IT strategy and change
management techniques. The results will be fed back into IT departments in the HE
sector. This is important and useful as it will help analyse how IT is changing to
accommodate changes in external influencing areas.
Whilst the specific focus of this project is on change within IT, the analysis will draw
upon theoretical concepts from the wider field of organisational change and strategic
management of change. Although most literature focuses on private sector
organisations many of the theories can still be applied higher education institutions.
Due to the funding changes, higher education sector institutions are finding
themselves with less financial resources but with an increasing demand for quality IT
services delivered to both staff and especially the students who, with the increased
fees, are likely to be looking for increased quality, Thompson and Bekhradnia (2010).
With this in mind I intend to analyse the expected change in strategies to cope with
this change, to see what tools will be used, if the changes will be analysed for
benefits and if those benefits are likely to be successfully realised.

2
“HEFCE distributes public money for teaching, research and related activities. In
2010-11 HEFCE will distribute over £7.4 billion to 130 higher education institutions
and 124 further education colleges.“ HEFCE (2011).
The HE sector invested £500 million per year in IT in 1998, as outlined by the
Information Systems and Technology Management: Value for money study by
HEFCE (1998). More recently in 2011 HEFCE invested £12.5 million in shared IT
Services under the Universities Modernisation Fund, HEFCE (2011).

3
Aims of the research
1. Identify current priorities of IT Departments and evaluate them
2. Identify current IT service delivery within IT Departments and evaluate them
3. Identify trends for the next 5 years as perceived by IT management staff
4. Identify organisational culture within IT departments, as perceived by IT
management staff
5. Identify change management methodologies used by IT departments
6. Research in a non-biased way

4
Objectives
Produce recommendations based on findings
Identify possible improvements
Identify further related research

5
Literature review
The Drivers for Change – the HE and IT environments
All organisations, whether public or private, exist within a dynamic rather than static
environment - as the Greek philosopher Heraclitus observed, “the only constant is
change”. Society is continually changing as new economic, political, social and
technological developments occur. Hall, Jones and Raffo (2004) have identified four
areas of change that are particularly relevant to business organisations. These are
changes resulting from legislation, changes in the market, technological change and
finally changes in customer preferences. All of these areas are relevant to this
project, as follows.
A] Legislative change: although legislation does impact upon the HE IT environment
[for example, in relation to data privacy], change over the last decade has been more
relevant to the general HE context. Successive Governments have pursued an
agenda of bringing more market forces to bear upon the HE sector, initially through
competition for research funding and more input from „consumers‟ through the
National Student Survey, and today through differential tuition fees. This, combined
with general cutbacks in public spending as the national economic position has
worsened, has meant a new era of financial restraint for the HE sector, leading to
pressure for greater internal efficiency and cost-cutting. One important point to note
here, however, is that this does not necessarily mean cutbacks in IT resourcing - it is
reasonable to assume that in some cases, maintaining or even increasing
investment in IT will be seen as a means of achieving efficiencies elsewhere in the
organisation.
B] Market change: tuition fees have clearly had an impact upon the market for higher
education, but it has been limited. Final figures for 2012 recruitment are not available
at the time of writing, but UCAS estimates an overall decrease in the region of 9%,
Coughlan (2011). This headline figure incorporates some much bigger changes
among certain types of applicants. The decrease in applications from mature
students, for example, is over 20%; applications from international students have

6
actually risen for 2012 entry, although it remains to be seen what will happen here in
the longer run. In terms of HE‟s core market – home students aged under 25 – the
decrease is estimated at 12%, but the fact remains that demand still far outstrips
supply. League tables for research, teaching and the „student experience‟ however
mean that HE‟s customers are now able to make a much better informed choice
between HE institutions.
C] Technological change: continuous and rapid change in IT has been a constant
feature in the IT environment for decades, for example Moore‟s Law of hardware
growth, hardware capacity doubling every two years, Moore (1965). A more modern
example would be the current stress upon development of mobile devices such as
smart phones and tablets. The pace and scope of change is such that IT
departments in HE institutions are now facing up to the central question of whether
they can continue to provide all the required IT services themselves and keep up
with the demand for change (latest smart phones supported for work use, integrated
social media use, large amounts of cloud storage, email, available free for personal
use from Google etc.) and to find the most cost effective way of delivering a service,
or whether they now look to outsource at least some of their services.
D] Customer change: change in trends and tastes have a powerful role to play in IT,
as it must adapt to changing technology driven by customer demands. While
Universities‟ main customers are their students, it must be remembered that they are
not the only ones as Universities also rely on research and enterprise streams. The
IT department must serve these users and all of the supporting staff as well. The
user‟s perception will determine the success of a new technology or service, which
means that IT departments have realised that different user groups need to be
identified, and their requirements analysed.
Marketing theory offers a different perspective on change, although there is
considerable overlap with the business organisation theory above. Jobber‟s
Principles and Practice of Marketing (2001) identifies the marketing environment as
being made up of two parts, the macroenvironment and the microenvironment:

7
The macroenvironment consists of the following areas:
Economic
Social
Political
Legal
Physical
Technological
The microenvironment consists of the following areas:
Suppliers
Distributors
Customers
Competitors
Jobber goes on to describe a technique called „environmental scanning‟ - the
process of monitoring and analysing the environmental factors above to help predict
and improve the response of changes. In the context of this project both the
microenvironment and macroenvironment are relevant. The macroenvironment will
cover the change in legislation and the technological changes that influence IT
regularly. The microenvironment will cover the areas such as strategic partnerships,
outsourcing and the move towards a competitive market with increased competition.
All change needs to be properly managed Mullins defines management as “the
process of achieving organisational objectives within a changing environment by
balancing efficiency, effectiveness and equity, obtaining the most from limited
resources and working with and through people” (Mullins 2005:195)
The need for a strategic approach to the challenges of change
HE institutions, like other publically funded bodies, are not always masters of their
own destiny, having to work within the changing parameters of government decisions
on resourcing. This can lead to them having a common reactive approach to change,
rather than a proactive approach that focuses on identifying and achieving desirable

8
future objectives. Yeates and Cadle (1996) argue that a good strategy should be
clear, concentrated, flexible, well led and „full of surprises‟ . Whilst it may seem a bit
optimistic to assume it is possible to combine a concentrated focus with flexibility, the
basic point is that an organisation must think for itself about its future objectives, and
not just wait for any outside body to define its future for it. Turner (2007:19) takes the
argument even further, arguing that a strategic vision is one of the defining
characteristics of organisation itself - “Projects are undertaken to help organisations
deliver their strategic plans. The strategic planning process is essential for the
survival of organizations, and it is the strategic planning process that generates
projects. There is not one without the other, and there is no organization without
either.”1
IT Departments are even more vulnerable to the risk of failing to think strategically
about the future, as they have to react to a constantly changing technical
environment and this often entails a change in customer demands. They can find
themselves driven entirely by incorporating each new technological development as
it comes along, without giving proper thought as to what should best be done with
these new capabilities to maximise their benefits. A prime example of this would be
updating Operating Systems to the latest version, often done to keep up without the
benefits of the new features being exploited fully. Strategic thinking is therefore very
important in the HE IT environment – as a major HEFCE (1998) report put it “an IS/IT
strategy which is driven by the information needs of the institution is more likely to
support the achievement of the institution's overall strategic objectives than one
driven by technical considerations…. The development of information systems and
the use of information technology is however very expensive, not only in terms of the
financial investment required to procure the equipment, but perhaps more
significantly in terms of the staff resource required to promote and support its
effective use. As institutions continue to invest significant resources in the
development and use of information systems and technology, it is therefore essential
that appropriate management arrangements are in place to ensure that this
investment provides value for money.” This highlights the need to properly cost

9
analyse services against the benefits to the University, weighted according to their
strategic priority.
This is a point made in more general terms by Zahra and Bogner (1999), who argue
that technological strategy is one of the most important aspects of an organisation‟s
strategic posture, especially in dynamic environments. The overall higher education
environment could be considered quite static compared with others that can have
frequent large amounts of change [for example, technology companies]. However,
due to legislative and funding changes over the last decade, a large amount of
change cannot be avoided by higher education. This means that HE IT Departments
are subject to two change drivers - fast pacing technological change and significant
changes in the overall political and economic context. In their study, Zahra and
Bogner found that the strategy that had the most effect in a changeable time was
„frequent product upgrades‟, focussing on improvements in service quality and
integration of services. Prahalad and Hamel (1990) had a similar viewpoint which
was to focus on core competences; this presumably also alludes to not expanding
into new areas and competences and focusing on improving the current ones.
As existing services are looked at for improvements and streamlining the concept of
service delivery is invariably focused on.
IT Service delivery
All IT Departments in HE are, in essence, service departments. They exist to provide
services for their users, whether that be very visible services like email or a Virtual
Learning Environment for staff and students, or less visible but equally crucial
services like IT infrastructure and backup systems. As such, IT Departments will
always have two kinds of preoccupation – improving what they already do, and
making strategic decisions about what else to do [or stop doing] in the future, what to
provide in their service portfolio. In terms of the theoretical literature, therefore, it is
necessary to examine insights that relate primarily to improving what is already done
[Total Quality Management], to changing delivery methods [insourcing and
outsourcing] and to strategic thinking about what it is best for the Department to

10
focus on, and how to measure whether or not it is achieving its goals [Benefits
Realisation and Business Process Re-engineering].
Service Delivery - Total Quality Management (TQM)
Hall, Jones and Raffo (2004:241) describe Total Quality Management as:
“a managerial approach which focuses on quality and aims to improve the
effectiveness, flexibility, and competitiveness of the business.”
At first sight, TQM may seem to be little more than a restatement of general
principles of management – aiming to improve effectiveness and competitiveness is
surely a core feature of any managerial strategy – and TQM does incorporate some
conventional „top-down‟ managerial processes. So, for example, TQM requires an
organisation to have control over the processes that make up the product or service.
These processes need to be consistent and well documented and should be
regularly monitored and audited to ensure quality is being maintained and then
reviewed if it is thought quality can be improved. One method this can be done by is
Statistical Process Control (SPC) which involves collecting quantitative data on a
particular process for analysis, this can then be used to highlight any problem areas
or areas for potential improvement.
Where TQM differs from other managerial strategies, however, is in its stress upon
the role and importance of each individual in the organisation, not just those at the
top. TQM states every individual is to take quality into account at all times in every
process. This can also be referred to as a Quality Chain where every step of the
delivery of a product or service to the customer has to meet the required quality
standards, the chain is broken if the quality does not met these expectations at any
point, highlighting the importance of every individual performance in a product or
service life cycle. Clearly, for this strategy to work, TQM needs to be used
throughout an organisation, from senior management downwards, and it requires
staff to be committed to their job and to take pride in their work. As well as staff
commitment, TQM stresses the importance of teamwork for decision making to
increase ownership of changes and to improve morale and trust.

11
Hall, Jones and Raffo summarise the benefits of TQM as follows:
Helps focus on customer needs and customer relations
Improve quality in every area
Improve business process efficiency
Measure performance
Use Team work for problem solving
Develop procedures for communication and acknowledgment of work
Continually review process for improvement
Process focused not product or service
Large amount of documentation and procedures are needed
Complete organisational buy in is needed for TQM to be a success
Cole (1996) in his discussion of TQM, also emphasises the vital importance of
commitment throughout the staff of an organisation, coming up with the memorable
maxim that „each employee is a customer to every other employee‟. Cole‟s summary
of the standards that should be adhered to under TQM, set out below, overlaps to a
considerable extent with that of Hall, Jones and Raffo above, but adds the useful
emphasis that TQM is about getting things right in the first place, not simply
correcting errors after they have occurred:
To prevent errors, not detect them and correct them
Tasks should be done right first time
Management must be committed to TQM
Customers requirements must be met
Each employee is a customer to every other employee
There must be continuous improvement
Quality assurance should be used to review and measure performance
Quality is everyone‟s responsibility
Both Cole and Hall, Jones and Raffo offer a prescriptive approach to TQM – as a
manager, you must do this and ensure others do that – but do not say much about
how this can be achieved. Yeates and Cadle (1996) do address this, arguing that in
order to get the commitment of all staff to the organisation‟s mission statement, and

12
to make continual striving for improvement a core feature of the organisation‟s
culture, organisations must spend money and adopt a distinctive managerial style.
The two key features they identify are:
Removal of hierarchical differentiators, same privileges for management and
staff alike
Application of resources, quality improvement teams to identify and solve
quality problems
TQM, then, suggests that if an organisation is facing a situation of incremental
change, it is desirable if not crucial to adopt a managerial style that is inclusive and
inspirational. By treating all staff as part of a team, by removing hierarchical
differentiators, it is argued an organisation will be able to respond effectively to
changes in its environment. In the context of this project – IT Departments within
relatively large organisations, this raises two questions:
How realistic is it to assume the removal of hierarchical differentiators?
Does TQM make sufficient allowance for the effect of specialised knowledge
within organisations? If you are managing a team in which each member has
specialised knowledge and experience not shared by any other team
members, what challenges are involved in getting equal commitment across
the board?
These are questions to which we will return having analysed the empirical evidence.
Service Delivery - Insourcing and Outsourcing
TQM is about improving what an organisation does, but it assumes the organisation
will continue to provide goods or services directly. In IT Departments, however, the
impact of technological change has brought about more fundamental organisational
changes. The rapid development of internet based services, particularly web-based
services, has meant that institutions have increasingly questioned the need or

13
desirability of developing their own services – why build your own search engine, for
example, when you can simply incorporate Google into your own site, or why
develop your own VLE when you can simply use Moodle or Blackboard. Harrington
(1998) makes a valid point when arguing that for an organisation to make a big jump
in savings from outsourcing, they would have had to be operating very inefficiently
before, but this doesn‟t take into account the impact of technological change. An IT
Department may have been relatively efficient when developing its own email and
VLE services ten years ago, but the scope of services offered by suppliers today
such as Google mean that outsourcing becomes the most cost-effective solution.
The net effect of this over the last decade has seen most IT Departments move
some of their activities from in-house to using external suppliers – outsourcing.
Lacity et al (1996) states that “interest in outsourcing largely results from a shift in
business strategy”. Whilst this may be true generally, technological change and the
costs associated with it are a much greater driver in the sphere of IT.
In some situations internal markets can become a factor whereby different
departments look to obtain IT services from outside of the internal IT department
creating additional internal competitive markets, as outlined by Woods (2003).
Foogooa (2008) defines outsourcing as “the use of an external provider of goods or
services instead of having recourse to internal resources to provide the same goods
or services”. Rudd and Lloyd have defined the different forms of service delivery as
follows:
Insourcing – Utilising internal resource to design, develop, implement,
maintain or support services.
Co-sourcing – A combination of insourcing and outsourcing which can feature
one or more external organisations working together to design, develop,
implement, maintain or support services.
Outsourcing – Utilising the resources of an external organisation to provide a
well-defined portion of a service design, develop, implement, maintain or
support. (Rudd and Lloyd 2007)

14
In the HE IT context, there is considerable overlap between „co-sourcing‟ and
„outsourcing‟, as it is the norm for suppliers [Google being a good example] to offer a
degree of tailoring of their products to fit each institution‟s needs. Most HE
institutions have very similar needs, however – mail, VLE, student records, etc. - so
there is less need to work with suppliers on individual outputs. As Read (2010) points
out, outsourcing of IT services can increase collaboration with other organisations
outsourcing with the same methods using the same external providers, so in what
follows co-sourcing and outsourcing will be treated as one category, „outsourcing‟.
Lonsdale and Cox (2000:446) state “Research in the UK has shown that the
“revolution in outsourcing” has impacted more upon firms‟ support activities than its
primary supply chain activities.” The supply chain for a service industry such as
education is hard to define as they do not have physical raw materials to be
processed into a product, but there are clear support activities involved such as IT
services, which would fit into this statement. Lacity et al (1996) said that although
outsourcing IT was a rapidly growing trend particularly throughout American
organisations, growing ten times the size it was in 1989 through to 1996,
organisations have started to move to “selective sourcing” meeting the customer
needs whilst keeping risks to a minimum with a selection of insourcing, outsourcing
and co-sourcing rather than the previous trend of wholly outsourcing IT Services.
Foogooa (2008) however points out that this growth has now slowed down but is still
expanding regularly and now more of a common regular practice than before.
Although technological development has driven IT Departments towards
outsourcing, in-house services remain important. Whilst all HE institutions want
much the same thing from something like an email system, each may have different
requirements in other areas like student records or assessment. As Willcocks and
Lester (1997:64) observed, “There is no incentive for an organisation to outsource its
IS/IT function when its in-house capability is equivalent to or better than that
available in the external market”. Moreover, in some areas – especially those relating
to personal data – the potential risks of out-sourcing and losing a degree of control
outweigh any potential efficiency savings. IT services that contain highly sensitive
data are not good candidates for outsourcing without considerable risk, as Read

15
(2010) highlights. He also goes on to point out that outsourcing from within the
European Union to the United States is also considered a higher risk among
researchers as the US Patriot Act will enable a third party to analyse data stored on
a US based service.
These parameters serve as a reminder that outsourcing is a process that should only
be undertaken after careful consideration. All of the points below should be done
before and during any outsourcing process:
Outsourcing changes need to be implemented carefully.
In house capabilities should be assessed
Investment evaluation should be conducted
Benefits realisations should be conducted
Risk assessment should be conducted
Outsourcing relationships should be properly managed
Procedures to monitor the quality of external processes should be
implemented
Service Delivery - Business Process Re-engineering (BPR)
The term re-engineering was first used in the business context by Hammer &
Champy in 1993 who described it as:
“Re-engineering ... is the fundamental rethinking and radical redesign of business
process to achieve dramatic improvements in critical contemporary measures of
performance such as cost, quality, service and speed.” Hammer & Champy
(1993:32)
Whilst the terminology may be bolder than that employed in TQM [„fundamental‟,
„radical‟, „dramatic‟, etc], there is actually some overlap between the two approaches.
Both, for example, stress the importance of teamwork and the empowerment of team
members and flatter hierarchies. Nevertheless, whilst TQM is appropriate for
organisations wishing to improve within a relatively static environment, BPR is clearly

16
a strategy designed to address major change – both within the organisation, and to
adapt to major changes in the organisation‟s environment. As Hammer and Champy
(1993) argue, due to change in the modern climate, faster changes, more
competition, and higher customer expectations, it is essential to move away from
being focused on tasks and structure and to move to focus more upon the business
processes.
To re-engineer a business process is to completely rethink the way it works from
beginning to end, question everything from a customer perspective and from an
internal efficiency perspective; as such, it is about being innovative and requires
lateral thinking „outside of the box‟. As Archer and Bowker (1995:31) puts it, BPR is
“a vision led structured methodology for the fundamental rebuilding of business
process through the balanced interaction of work tasks, people, information and
technology”. Wastell, White and Kawalek (1994:24) offer a similar view, defining
BPR as “the endeavour to augment organisational performance by improving
efficiency, effectiveness and adaptability of key processes.” Hammer & Champy
(1993) bring out just how radical BPR can be in terms of organisational re-
structuring, suggesting seven principles for BPR initiatives:
1. Organise around outcomes not tasks
2. People who use the output should perform the process
3. People who produce information should process it
4. Treat geographically dispersed resources as if they were centralised
5. Link parallel activities instead of integrating
6. Put the decision point where the work is performed
7. Capture information once at its source
As can be seen from this, BPR is likely to entail not just reorganisation of roles and
responsibilities, but also what are likely to be some fundamental changes in the
organisational culture. Davenport and Short (1990) summarise the culture on which
successful BPR must rest:
From hierarchies to teams
From controlling to empowering

17
From analysis to action
From risk aversion to calculated risk taking
From boundaries to networks
Hammer & Champy (1993) believe this can lead to:
Tasks being combined
Staff involved in process design increasing ownership
Processes more focused on differing customer requirements
Task order and dependencies changing
Single point of contact for the customer
Staff reorganised into process focused groups
Empowered staff
Staff have greater understanding of why a process in happening not just how
it happens
Cultural change where the staff see the customers as more important than
their managers
Flatter organisational structure
Senior management take the role of culture leaders
Such a reorientation would be unlikely to go unchallenged within most organisations;
Davenport and Short offer a useful summary of the most probable obstacles:
Resistance to change
Limitations of existing systems
Lack of executive consensus
Lack of senior executive champion
Unrealistic expectations
Lack of cross-functional project teams
Inadequate skills
IS staff involved too late
Project charter too narrow

18
Although there are many texts describing BPR and its benefits there are also many
critiques who describe its shortfalls.
Coulson-Thomas (1994) argues that processes are not always re-engineered
through innovation but rather simplified within existing frameworks. He also makes
the point that it can be used as a tool to reduce staff and make remaining staff work
harder and more efficiently. Furthermore, with the focus being on the external
customer, internal customers can suffer and those who supply them with services
can be thought of as less important.
Talwar, R (1994) states re-engineering can do damage to the organisation when
used as a blunt cost cutting tool. The point is also made, however, that it is a critical
tool for rethinking a process from start to finish and thus more suited for redesign of
a business as a whole - organisational change rather than process change.
Hammer and Champy (1993) responded to these criticisms with a revised edition of
their text that stated that:
BPR and TQM are complimentary towards each other and do not conflict.
BPR is a process for re-engineering a process not reducing workforce
Their argument stresses that BPR is an on-going process which should be repeated,
that organisations should view change as the norm, and that BPR is not about a one-
off slimming down of the workforce but rather an on-going commitment to a particular
focus. In practice, however, there is evidence to suggest that in its early years, there
was a tendency for BPR to be used as a one-off exercise that did often result in staff
losses. Harvey D (1995) reported on a survey of 128 UK Companies by Business
Intelligence which found 87 had undertaken BPR projects, of these 15% focused on
a single process, 47% on several process and 31% corporate wide. However,
another more recent survey from the year 2000 by Graham, Lloyd, Slack & Williams
(2000) [which used both research from previous texts on BPR and interviews with
relevant people involved with BPR] came to the conclusion that BPR has moved
from a radical process used only by early adopters and often producing radical
change, to one of many tools used by consultants in change management. Even
though it still has a negative image as a tool for reducing staffing, it has been broken

19
down into multiple techniques and methodologies making at least part of it useful
and used in change management programmes. In some of the early adopter cases
BPR had evolved into a hybrid with TQM (total quality management) and HRM
(human resource management). They concluded that BPR is flexible and now that it
has been fragmented organisations could be using one of many techniques and still
be considered to be using BPR.
Another group which has conducted research into BPR is the Centre for Re-
engineering Business Processes (REBUS), established at Brunel University to
provide a multidisciplinary environment for research into BPR and its success factor,
Hlupic, Choudrie and Patel (2000)
REBUS researches into how to improve the success rate of BPR, examples are:
Reducing risks
Reducing resistance to change
Understanding the role of IT in BPR
Realistic goals
This approach was developed in 1997 2 years after Hammer and Champy 1995
reported BPR failure rates as high as 70%
These are the factors that need to be considered for BPR success in the REBUS
approach:

20
Diagram from Hlupic, Choudrie and Patel (2000:5)
Overall, BPR to date has something of a mixed record. Whilst its insistence on
analysing all business processes from the viewpoint of the customer encourages
organisations to rethink their established operating procedures and processes, its
„start with a blank sheet of paper‟ approach can easily produce significant [and, from
the perspective of current staff, probably disproportionate] changes in both
organisational structure and human resources. As such, it could be argued to be an
overly optimistic prescription, because it doesn‟t give sufficient recognition to the
challenges of actually implementing such change – it is surely not coincidental that,
as noted above, as BPR has developed, it has become a much less clearly defined
model, and applied with less rigour.
Service Delivery - Benefits Realisation
Benefits realisation management (BRM) can be defined as “The process of
organising and managing, so that potential benefits, arising from investment in
change, are actually achieved.” Bradley (2010:23). Bradley goes on to state that the
roots of BRM are from organisations looking to calculate their Return On Investment
(ROI) for Information Technology (IT) spend during the 1980s. It has since been
adapted into use in any change management project, not just IT related ones, to
ensure maximum potential is met.

21
Nicol and Coen (2003) state that, although there has been a considerable amount of
research into evaluating benefits and identifying full costs for IT support services
within HE, there was little linking the two. They then go on to provide a framework to
aid in decision making based around these two variables. Barriers to this are as
follows:
Existing financial systems rarely contain the required cost information
Evaluation of benefits tends to be too narrowly defined
Benefits are rarely considered in relation to the strategic objectives of the
institution
The contribution of ICT in teaching and learning cannot be isolated
Comparing benefits across ICT projects is problematic
Ashurst and Hodges (2010) found in their research that post project evaluation of
benefits was not carried out consistently or effectively. They also point out that
benefits are not introduced with new technology, they are introduced with new
processes people use. Ashurst and Doherty (2003) found that projects were virtually
all focused on technology rather than organisational change and benefits realisation.
This may have changed in more recent years as more formal training in project and
change management methodologies that do stress the importance of benefits
realisation, such as PRINCE2 and ITIL v3, have become more widespread. That is
not to say, however, that projects are not still primarily driven by technological
changes rather than potential benefits. Ashurst and Hodges (2010) also found in
their research that it was a critical success factor to have the relevant skills to
conduct successful benefits realisation, and identified PRINCE2 training as relevant
in this context. The point can also be made that the newer, more IT-focused training
available in ITIL v3 would be just as effective; ideally if knowledge was gained in
both areas then one could pick and choose those elements that best fit a particular
organisation or project.
Ashurst, Doherty and Peppard (2008) outline the four core competences for benefits
realisation as:

22
Competence Definition
Benefits
Planning
„the ability to effectively identify the planned outcomes of an IS
development project and make explicit the means by which they
will be achieved‟
Benefits
Delivery
„the ability to design and execute the programme of organisational
change necessary to realise all of the benefits specified in the
benefits plan‟
Benefits
Review
„the organisation‟s ability to effectively assess the success of the
project in terms of the benefits already delivered and the
identification of the ways and means by which further benefits
might be realised‟
Benefits
Exploitation
„the adoption of the portfolio of practices required to realise the
potential benefits from information, applications and IT services,
over their operational life‟
It has been argued by Lin, Pervan, McDermid (2007) that once decisions on
insourcing and outsourcing have been taken, a benefits realisation model should be
implemented immediately to manage the change and realise the benefits. I would
argue, however, that benefits realisation can help in the justification process before
the change commences, and also that the threat of outsourcing can motivate staff to
improve performance and innovate services making them perform a more fit for
purpose service based on customer demands, rather than a generic catch all service
(Lacity and Willcocks 1997). Similarly, Hirschheim and Lacity (2000) stated that
outsourcing might not be perceived as successful due to the fact different
stakeholders have different expectations and perceptions of the results, but this
could be minimised through proper management and dissemination of information
relating to benefits realisation of the outsourcing change, both the benefits targeting
stage before the change and the benefits realisation after the change.
It‟s important when conducting benefits analysis that all stakeholders are thought of
and all areas of potential benefits are explored. A framework of potential areas can
help with this.

23
Nicol and Coen (2003) state that benefits in IT for HE can be categorised into three
areas:
1. Educational
2. Organisational
3. External
It could be argued that research should be another category or that the benefits
could be categorised into the three streams of university business:
1. Learning & teaching
2. Research
3. Enterprise
Nicol and Coen (2003) go on to say that these can then contain benefit types that
are assigned one or more evaluation methods for example:
Enhanced quality of student learning could have the following evaluation methods:
Exam results
Teaching quality assessment reports
Student surveys
And Staff satisfaction could have:
Staff satisfaction surveys
Staff turnover rates
Appraisal information
These can then be weighted according to strategic priority of the institution.
Change Management and Organisational Culture
“Each year UK industry invests around £100bn on change.” Bradley (2010:1)
Implementing change
Identifying the different types of drivers for change is one thing, but deciding what to
do about such change, and then implementing those decisions, is arguably the most
important aspect of the whole change process. Jobber (2001) goes on from the
mapping of types of change to make the point that organisations can and do respond

24
in different ways to a changing environment, identifying five possible organisational
responses to environmental change:
Ignorance - continue as normal no change is made
Delay - waiting for various reasons then making the change
Retrenchment - tackling the efficiency problems but ignoring effective
problems. For example cutting back on costs but not generating more income,
the problems remain but are lessened.
Gradual strategic repositioning - slow measured and planned move to adapt
to the change
Radical strategic repositioning - a large change in response to the
environmental change
This is an important typology, as it reminds us that just because change has taken
place in the environment, it does not necessarily mean that corresponding changes
take place within organisations. What may appear to anyone outside an organisation
to be an obvious or inevitable change may not be perceived in the same light by
those inside the organisation. Organisational change may offer opportunities for
career advancement, but it may also threaten job security and career progression.
Change also disrupts routine and standard operating procedures, which can make
the organisation‟s staff apprehensive and consequently resistant. Again, Jobber
(2001) offers a useful typology termed the „ladder of support‟, which identifies the
different stages of acceptance which can be shown by those affected by the change:
Opposition - openly against the change and direct and forceful in trying to stop
it
Resistance - less openly against the change and more passive in tactics to
delay or stop it
Compliance - will act in accordance to the change but still believe it is not the
best option so do so with minimal effort
Acceptance - a high level of support where staff realise the benefits and will
work towards the change
Commitment - staff are committed to the change and fully believe in it and
work towards it with conviction and enthusiasm

25
It is important to note that this is not a simple hierarchical chain - people can start
anywhere on the ladder and – crucially for the organisation - can move in either
direction.
The JISC infokit on Change Management in the education sector JISC (2011) makes
a similar point with its concept of the Transition Curve. It notes, however, that these
responses are not always iterative, as different people can react in different ways,
missing sections and repeating sections:
Endings
o This can start with numbness, denial and disbelief, it can also include
confusion and uncertainty, other issues can be anger, blame and
resentment as people lose control over their predictable comfortable
environments.
Neutral Zone
o This is a limbo state where things aren‟t as they were but are not yet
how they will be. This can create anxiety, fear, frustration and isolation
but can also spark creativity and start to create optimism.
New beginnings
o This is where the change is accepted, there is adaptation and relief and
enthusiasm.
Kotter (2011), a Harvard business professor and leading thinking and author on
organizational change management, brings together these points about
organisations not necessarily reacting „rationally‟ to change and the importance of
recognising different perceptions on the part of organisational staff. He sets out an
eight step model for dealing with change:
Step 1: Acting With Urgency
Examine market and competitive realities
Identify and discuss crises, potential crises or major opportunities
Step 2: Developing the Guiding Coalition

26
Assemble a group with enough power to lead the change effort
Encourage the group to work as a team
Step 3: Developing a Change Vision
Create a vision to help direct the change effort
Develop strategies for achieving that vision
Step 4: Communicating the Vision Buy-in
Use every vehicle possible to communicate the new vision and strategies
Teach new behaviours by the example of the Guiding Coalition
Step 5: Empowering Broad-based Action
Remove obstacles to change
Change systems or structures that seriously undermine the vision
Encourage the risk-taking and non-traditional ideas, activities, and actions
Step 6: Generating Short-term Wins
Plan for visible performance improvements
Create those improvements
Recognize and reward employees involved in the improvements
Step 7: Don't Let Up
Use increased credibility to change systems, structures and policies that don't fit
the vision
Hire, promote, and develop employees who can implement the vision
Reinvigorate the process with new projects, themes, and change agents
Step 8: Make Change Stick
Articulate the connections between the new behaviours and organizational
success
Develop the means to ensure leadership development and succession

27
As can be seen, Kotter is offering a prescriptive model, encouraging organisations to
not only identify and act upon environmental change, but also to do so in a fashion
which explicitly recognises the need to get organisation staff engaged and committed
to the process of change. Yeates and Cadle (1996), in their work on project
management for information systems, emphasise the importance of this latter
aspect. They argue that successful change management is achieved through proper
consideration of people issues, as people are critical to implementing the change,
and information systems are only tools to enable the people to make better
decisions. Change should be identified and planned for as early as possible, and
then a change programme should be used to run through the change project as well
as before and after it. Any such planning should take into account that organisational
staff will be in one of four „phases of change‟ -
Denial – deny the need to change
Resistance – resist and oppose the change
Exploration – take interest in the change
Confidence – Believe in the benefits of the change
With this in mind, Yeates and Cadle(1996) identify four key considerations for any
programme of organisational change:
Plan the change programme the same way as planning a project
Include communication, training and an impact analysis of the change on
those effected
Phase the changes so people have time to accept each one and are
comfortable with it
Involve end users in the planning and implementing of the change programme
Yeates and Cadle (1996) go on to offer two further useful refinements to their
general model. Firstly, they make the point that managing change may well involve
more than just identifying objectives and communicating them to staff – depending
on the nature of the change, managing it can involve changing the whole managerial

28
culture of an organisation. Managerial cultures are commonly categorised into the
sections below:
Centralised
Autocratic power
culture
Bureaucratic role
culture
Informal Formal
Anarchic
individualistic culture
Matrix task-based
culture
Devolved
Autocratic power culture – led by management, an autocratic leader who can be
charismatic and well respected
Bureaucratic role culture – formal and centralised where everyone has a role clearly
defined and relationships are also clearly set out. However there are often informal
relationships and roles which people exploit to get things done quicker and easier
than using the formal channels. As will be seen, this can be particularly important in
areas of organisations which have a specific technological expertise
Matrix task-based culture – tasks are devolved to the lowest practical level in a
project management style.
Anarchic individualistic culture – informal decentralised where everybody has a say
in all decisions.
(We should also bear in mind that HE institutions may have some unique
characteristics – Farrant (1984) states that Universities often have an anarchic
culture where by decision making is driven primarily by political considerations rather
than economic rationality).
Secondly, they make an important point about the scale of change, reminding us that
there is no one-size-fits-all solution to change management; the strategy adopted
should match the type and scale of change involved. The table below shows which

29
change management technique Yeats and Cadle (1996) recommend, depending on
the type of change and what period of time the change will take place:
Type of
Change
Short Term (3-9 months) Long Term (1 year +)
Radical
Restructuring and
redeployment of staff
Business Process
Re-engineering [BPR]
Incremental
Process automation and
refinement
Total Quality Management
[TQM], innovation schemes
If changes are large and have to be implemented in a short time then it may
require hiring and/or firing of staff as well as restructuring to ensure that the
relevant skills are in the right place.
If the changes are large but there is more time for the implementation then
business process re-engineering can be used as staff will have time to
develop the skills needed.
If the change is incremental or only affects a small proportion of users but
implementation must be done in the short term then processes can be
analysed for refinement and automation. The processes will be tweaked in
this case where as in BPR they are totally re-engineered.
If the change is incremental or only affects a small proportion of users but
implementation can be done over a number of years then total quality
management can be used for gradual process improvements.

30
Hypotheses
The literature review above suggests a multiplicity of specific points that need to be
addressed in any examination of changing IT strategies in HE. Reflecting on the
above, I have identified 16 such specific points, but these can be summarised into
four main hypotheses:
1. Strategic priorities
a. Due to the changes in funding, IT strategies priority will be expected to
change focus to improving and integrating rather than expanding and
innovating.
b. Institutions will seek to utilise more external resources and enter in
more strategic partnerships with both public and private companies in a
bid to save resources and to reduce risk by sharing responsibility.
c. There is a growing awareness of environmental concerns and a desire
to adopt greener practices.
d. Institution type will not affect the priorities, all institutions will be similar.
e. There is a large amount of change expected within IT strategy priority
over the next five years.
Hypothesis One: External factors will cause a change in strategic
direction for IT Departments – from service expansion to service
improvement – and this improvement will be sought in part through
more external partnerships; all types of HE institutions will experience
this change.
2. Service Delivery
a. Some services will be expected to become more outsourced but
systems that contain sensitive data are more likely to remain
insourced.
b. Large changes are expected in service delivery towards both
insourcing and outsourcing as service delivery is changed to try and
improve cost effectiveness.
c. Higher levels of management will expect more outsourcing of services.

31
d. Older institutions will expect less service delivery than newer
universities.
e. Institutions who are expecting large amounts of change in service
delivery will also currently target and realise benefits more than those
who are not expecting as much change.
Hypothesis Two: IT Departments will continue some in-house service
delivery and seek to make it more efficient, but the major change will be
in an expansion of out-sourcing; the greater the degree of change, the
more likely it is that institutions will attempt to both identify and target
specific benefits, and subsequently realise them.
3. Business Process Re-engineering and Benefits Realisation
a. Institutions who have used Business Process Re-engineering (BPR) in
the past are more likely to expect large shifts in change in service
delivery.
b. IT projects target benefits more than they successfully realise them.
c. Institutions who use formal change management methodologies such
as ITIL and PRINCE2 are more likely to have used BPR than those
who do not and as a result are more likely to have successfully realised
benefits more often.
d. Institutions who successfully realise benefits more often are more likely
to fully use change management methodologies such as PRINCE2 or
ITIL.
Hypothesis Three: The use of change management methodologies
increases the chances of successful benefits realisation.
4. Change management and Organisational Hierarchy
a. Although different types of institution will have different organisational
cultures and management styles, a factor in common is that higher levels
of management perceive the organisational culture of the institution
differently to those in middle management.

32
b. Higher levels of management believe benefits are being targeted and
realised more than middle managers.
Hypothesis Four: perceptions of successful benefits realisation will
differ according to a person’s position in the organisational hierarchy.

33
Research Methodology
There are three types of data collection as outlined by Swan (2008):
1) Secondary Participation
This does not require direct contact to collect the data, examples of this would be,
web based surveys, telephone interviews and mail based questionnaires/surveys.
2) In-person Observations
This does require direct contact to collect the data, examples of this would be,
interviews, face to face surveys and focus groups
3) Content analysis
This is based on collecting existing data from existing research and literature
From researching existing literature around this area it became apparent that no
research had been done in this specific area, there has been research on benefits
realisation and IT strategy but none relating it together and analysing it against
change management methodologies and organisational culture, institution types and
managerial positions within the he hierarchy. The most suitable type of data
collection was secondary participation and also if time permitted in-person
observations.
Due to the complex nature of my hypotheses a large amount of quantitative data was
required from a wide range of institutions so that it could be analysed and compared
to get an idea of common trends, for this reason a survey was decided to be the best
option.
The research was primarily quantitative, comprising of a questionnaire of mainly
closed questions. This was appropriate because the hypothesis of the research was
clearly defined and it was possible to formulate questions, which related directly to
them. Leeds-Hurwitz, Wendy. (1995), points out that quantitative research is best

34
suited for hypothesis testing in most situations although not exclusively. This was
augmented with open-ended questions so that the respondent could provide
comments. This qualitative aspect is important in providing the „rich‟ data, which
describes the issues, as the respondent perceives them. Miles & Huberman (1994)
point out that although quantitative data is more efficient and able to test hypotheses
it can miss contextual detail, where qualitative can pick up this „rich‟ data. It can
provide insights, which the researcher had not anticipated.
Although this exploratory aspect of the research was included, the questionnaire was
designed with the subsequent coding and analysis clearly in mind.
Therefore a quantifiable approach would be best suited for this project, as
comparative analysis of data collected was required to look for trends and links
based on the hypotheses.
Data collection techniques research from Rachhod and Zhou (2001) indicates that
the use of online surveys is more positively received by those with high technological
awareness. The other major advantage of an online survey over a postal one is that
it saves time both in sending and receiving the questionnaire and also entering into
the computer for analysis. The only disadvantage is it could be thought of as junk
mail or spam and not responded to.
To minimise the disadvantage of an email containing a questionnaire to appear to be
„junk mail‟ or „spam‟ it has to have a carefully worded covering letter/pretext before
the questionnaire and it also has to come from what would be deemed a safe
sender. Mixed format strategy could be used where by both postal and online
surveys are sent out to maximise response rates, this is discussed by Dillman
(2000). However as the email in this case was coming from a reputable source it
would be more beneficial to contact them with the link and the pretext explanation of
the reasons for the survey in the same email. This could then be followed up with
individual emails with a repeat of the outline of the surveys purpose and a link to take
the survey to other members of UCISA from the institutions who had not replied, this
is a proven technique as outlined Kaplowitz, Hadlock, and Levine (2004).

35
In this case the initial group email sent out was sent from the Director of IT Services
at Loughborough University and the pretext was as follows:
Subject: IT Strategy survey for academic research project
Dear UCISA Directors colleague
Please could I draw your attention to the survey questionnaire link below, relating to
an academic research project examining institutional IT Strategies, and how they are
changing in the face of the current financial climate. This work is part of a joint
research project involving Loughborough School of Business and Economics, and IT
Services.
Survey questionnaire link:
https://www.survey.lboro.ac.uk/itstrategy
We appreciate this is a busy time of year. The survey questionnaire should take
about ten minutes to complete, and is aimed at directors and/or other senior
managers with responsibility for IT. If colleagues were able to find time to look at this,
we would be extremely grateful.
We will summarise the results and report back to the community in due course.
Regards,
Phil Richards pp Jeremy Byrne, IT Services, Loughborough University
Dr Phil Richards
Director of IT
Loughborough University
N1.10 Haslegrave Building
Leicestershire LE11 3TU

36
t: 01509 226001
f: 01509 223987
w: www.lboro.ac.uk or http://ラフバラ大学.com/
The above email was sent to the UCISA group, UCISA stands for Universities and
Colleges Information Systems Association and represents almost all major UK
universities and higher education colleges. It provides a network of contacts within
the industry which can be utilised for mutually beneficial projects such as this one.
UCISA was officially created on the 1st of April 1993 after the 1992 Education Act
created a single higher education sector. It was made up of three existing IT related
bodies:
1. IUCC, the Inter-University Computing Committee
2. PCCC, the Polytechnics and Colleges Computer Committee
3. Management Information Systems Committee
This was the obvious choice of contact method due to the research into IT users
responding more to online questionnaires and also due to the large number of
contacts in the list, [132 Higher Education institutions]. At times contact was made
with universities via the email address for IT departments published on their web
sites but this produced a very low response rate. This list provided a direct contact to
senior management within IT departments, although this did not guarantee the
senior management would respond on occasion they would delegate the task to
another member of staff.
Pilot
The questionnaires first iteration contained a wide selection of questions which were
piloted to selected members of the IT department within Loughborough University at
various levels of the departmental hierarchy. The feedback suggested that the
questionnaire was too long; there were also some suggestions for minor adjustments
of the wording of some questions to remove ambiguity. Two examples of this are:

37
Question 19 “Are you currently using any formal methodologies for change
management?” was thought to be confusing, after I explained PRINCE2 and ITIL
were examples of change management methodologies the pilot test users
understood that change management methodologies were often contained within
project management methodologies. I didn‟t want to change the wording to project
management as it was just the management of change I was interested in, so I
added the examples in the question, after the change it read “Are you currently using
any formal methodologies for change management (for example, ITIL or
PRINCE2)?”.
Question 20, was originally “Has Business Process Reengineering (BPR) ever been
used in your department?” but some responders pointed out they did not know what
Business Process Reengineering was, so I decided to define the phrase in the
question and changed it to “Business process re-engineering. To re-engineer a
business process is to completely rethink the way it works from beginning to end,
question everything from a customer perspective and from an internal efficiency
perspective; it is about being innovative and requires lateral thinking 'outside of the
box'. Has this ever been used in your department?” This removed any ambiguity
over the question.
Taking this feedback the number of questions was reduced down, questions were
removed about forecasting technological, marketing and financial factors. These
were initially included as research was intended to look if forecasting techniques
were in use to predict expected change in these areas and then in turn if those who
did forecasting were expecting more change. The forecasting questions were saved
for any follow up face to face or telephone interviews at a later date.
Acronyms were also removed to avoid confusion as a large number are used within
the IT industry some can have multiple meanings.
The questionnaire was then piloted a second time, including the initial sample group
of people and also a new sample group to take a fresh look. These groups came

38
back with positive feedback, there was a slight concern it was still too long but due to
the hypothesis a large amount of data was needed, so all questions remained.
Design
The final design of my questionnaire can be seen in Appendix B, below is an
overview of the questions asked.
Section One: Personal information
1) Name (Optional)
This was asked to provide a named contact for follow up questions if needed, it was
an optional question so that responders could remain anonymous if they so wished.
2) E-mail Address (Optional)
This was asked to provide a method of contacting responders for follow up questions
and clarifications; again it was an optional question so that responders could remain
anonymous.
3) Do you wish to receive an email of the results of my survey? (results
will have personal information removed)
This was asked to give responders an incentive to fill out the survey as they will see
the trends I have found and the results and recommendations which are produced,
which could benefit their departments.
4) Job title
This was asked for analysis of trends in the results based on the role of the
responder. This question was multiple choice with an open ended „Other‟ category
for those who thought they did not fall into any of the options. The job titles were
based on job titles within IT services at Loughborough University this worked well in
the pilot stages but once live it created a large amount of „Other‟ responses due to
different institutions using different descriptive job titles for similar roles. To improve
this the questionnaire could have been piloted to different institutions not just within

39
Loughborough University or the question could have been reworded to use more
generic roles, rather than job title.
5) Institution Type
This was asked for analysis of trends based on institution type, the categories for this
are based on the date of their foundation, again an open ended „Other‟ category was
provided for responders who decided they did not fall into any of the options.
Section Two: Current situation
6) In terms of the current strategy of your Department, please indicate the
priority given to the following
This was a list of IT Service related strategies drawn up from an analysis of both
Loughborough Universities IT strategies and common IT service strategies from UK
Universities from researching their web sites for strategic plans. This was to gain an
understanding of the responders current strategic priorities within their IT department
with a later repeat question for the same strategic priorities in five years‟ time.
7) Further Comment
This provided the responder the opportunity to add any further comments to the
answers given in question 6 as that was limited to multiple choice the responder may
have been unable to express their exact views.
8) How are the following IT services delivered at present?
This question was a list of IT Services drawn up from the IT services provided by
Loughborough University based on their current IT Service Catalogue. This was to
gain an understanding of how current IT Services were delivered for comparison with
a later repeat question for the same service expected deliveries in five years‟ time.
This could have been improved with a pilot sent to other institutions as they may
have highlighted some services they provide which Loughborough University does
not.
9) Further Comment

40
This provided the responder the opportunity to add any further comments to the
answers given in question 8 as that was limited to multiple choice the responder may
have been unable to express their exact views.
10) To what extent are your University's IT projects used to explicitly target
the following types of benefit?
This was to look to see how often institutions were looking to target these common
IT and University strategic benefits from IT related projects. The list was drawn up
from personal experience and from researching other institutions IT web sites.
11) Further Comment
This provided the responder the opportunity to add any further comments to the
answers given in question 10 as that was limited to multiple choice the responder
may have been unable to express their exact views.
12) To what extent are benefits, in each of the following areas, successfully
realised from your University's IT projects?
This question was to analyse which institutions are successfully realising the same
list of benefits highlighted in question 10.
13) Further Comment
This provided the responder the opportunity to add any further comments to the
answers given in question 12 as that was limited to multiple choice the responder
may have been unable to express their exact views.
Section Three: Five Years Time
14) In terms of the strategy of your Department over the next five years,
please indicate the priority given to the following.
This question was a repeat of question 6 but this focused on the perceived priority in
five years‟ time of the same strategies. This was to find out if the importance was
expected to change in any areas and if so by what magnitude.

41
15) Further Comment
This provided the responder the opportunity to add any further comments to the
answers given in question 14 as that was limited to multiple choice the responder
may have been unable to express their exact views.
16) How do you expect the following IT Services to be delivered in 5 years
time?
This question was a repeat of question 8 but this was focused on the expected
service delivery in five years‟ time of the same services. This was to find out if the
service deliveries were expected to change in any areas and if so by what
magnitude.
17) Further Comment
This provided the responder the opportunity to add any further comments to the
answers given in question 16 as that was limited to multiple choice the responder
may have been unable to express their exact views.
Section Four: Change Management
18) How accurate are the following descriptions of your organisation?
This was to determine the organisational culture and leadership within the
department.
19) Are you currently using any formal methodologies for change management (for
example, ITIL or PRINCE2)?
This was to find out if the organisations are currently using any change management
methodologies. This was a multiple choice question with „Yes‟, „Partly‟, „Not yet but
planning to‟, „No‟ and „Don‟t know‟ as optional answers followed by an open ended
question to ask if they have what have they used? Two examples of the most
commonly used change management methodologies were included as the pilot
reported this was ambiguous.

42
20) Business process re-engineering To re-engineer a business process is to
completely rethink the way it works from beginning to end, question everything
from a customer perspective and from an internal efficiency perspective; it is
about being innovative and requires lateral thinking 'outside of the box'. Has
this ever been used in your department?
This was again to look to see if institutions had used BPR to enable a change before.
This was a multiple choice question with the options, „Yes often‟, „Yes sometimes‟,
„Yes once or twice‟ and „No‟, again it was followed by an open ended question to ask
for an example if they have used it.
21) If you have used business process engineering would you use it again?
This was to analyse if they deemed the process successful and useful enough to re-
use it. This was multiple choice with „Yes‟, „No‟ and an open ended „Other‟ category.
Questions 6, 8, 10, 12, 14, 16 and 18 all contain a Likert scale, a Likert scale is a
multiple choice scale of answers such as, „Always‟, „Usually‟, „Sometimes‟, „Rarely‟
and „Never‟. Intervals between options cannot be presumed equal as highlighted by
research from Jamieson, Susan (2004), for example: „Always‟, „Usually‟,
„Sometimes‟, „Rarely‟ and „Never‟ can be interpreted in different ways:
Always 100% of the time 100% of the time
Usually 90% of the time 80% of the time
sometimes 50% of the time 40% of the time
Rarely 25% of the time 10% of the time
Never 0% of the time 0% of the time
In the above table both the intervals are not equal and the perceived values are
different. To improve the questionnaire a value was placed against each option to try
to remove any ambiguity and misinterpretation.
Always 5
Usually 4
sometimes 3
rarely 2
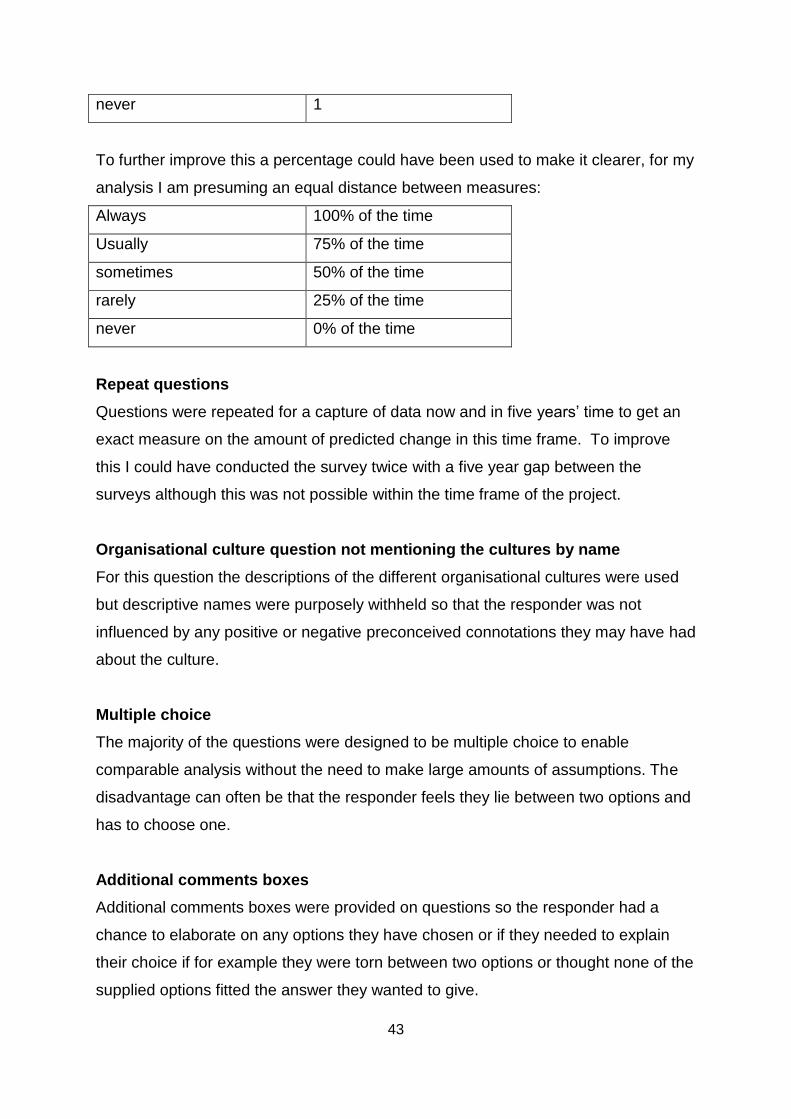
43
never 1
To further improve this a percentage could have been used to make it clearer, for my
analysis I am presuming an equal distance between measures:
Always 100% of the time
Usually 75% of the time
sometimes 50% of the time
rarely 25% of the time
never 0% of the time
Repeat questions
Questions were repeated for a capture of data now and in five years‟ time to get an
exact measure on the amount of predicted change in this time frame. To improve
this I could have conducted the survey twice with a five year gap between the
surveys although this was not possible within the time frame of the project.
Organisational culture question not mentioning the cultures by name
For this question the descriptions of the different organisational cultures were used
but descriptive names were purposely withheld so that the responder was not
influenced by any positive or negative preconceived connotations they may have had
about the culture.
Multiple choice
The majority of the questions were designed to be multiple choice to enable
comparable analysis without the need to make large amounts of assumptions. The
disadvantage can often be that the responder feels they lie between two options and
has to choose one.
Additional comments boxes
Additional comments boxes were provided on questions so the responder had a
chance to elaborate on any options they have chosen or if they needed to explain
their choice if for example they were torn between two options or thought none of the
supplied options fitted the answer they wanted to give.

44
An introduction was written to provide the responder with an overview of what the
questionnaire was and how long it would take to fill out.
This survey is part of a series of research that we at Loughborough are undertaking
into institutional IT strategies, as part of a joint project involving IT Services and the
School of Business and Economics.
We are looking for feedback on how your IT strategy has changed and how you
anticipate that it will change in response to the changing Higher Education
environment, in particular the new funding regime.
Our survey questionnaire should take about ten minutes to complete, and is aimed at
Directors of IT and other senior managers with responsibility for IT.
Thank you in advance for your time.
Regards,
Jeremy Byrne
Loughborough University
Implementation
Various online survey providers were assessed for the use of hosting the online
survey, some provided a paid service others were free to use but placed adverts
within the survey. However the Bristol Online Survey service was recommended
internally by a colleague and it provided suitable data analysis and control, good
support from system administrator and was free of advertisements.
Couper, Mick, Tragott, Michael and Lamias, Mark (2001) research found that not
only the wording of a questionnaire but also the style and layout also had an effect
on the answers and response rates. With this in mind the layout was kept simple and
functional to minimise any effect additional graphics and styling‟s may have.

45
Follow up emails
The approach to gain the maximum overall response was to use follow up emails,
utilising an email list of IT contacts. This was initially sent as a template email to the
UCISA group as a whole.
Then after a week this was followed this up with individual emails to the primary
contacts of the institutions who had not responded, then if a response had not been
received after one week the same email would be sent to the secondary contact for
the institutions who had still not responded, then after another week and if they had
not replied a third email was sent to the final contacts from the institutions who had
not responded. So an institution could receive a maximum of four emails, consisting
of one group email and three individual emails all to separate IT contacts within the
institution. This technique meant that those institutions who had responded did not
get contacted multiple times unless they answered the questionnaire anonymously in
which case they would have received the other follow up emails.
Response rate
The first initial group email was sent to an email list consisting of 132 institutions, this
was responded to by 17 institutions who filled out the questionnaire, providing an
initial response rate of 12.88%. One of these responders was anonymous.
The first round of follow up emails were sent as separate targeted emails to
individuals at the remaining 116 institutions who were yet to respond, although one
of these could have potentially been the anonymous response from the initial group
email response. This generated a further 12 responses which meant the response
rate was 10.34%, however two of these were also anonymous.
The second round of follow up emails was to the second named contact for the
institution. This time from the remaining 104 institutions it generated another 7
responses a rate of 6.73%.

46
The last round of individual targeted emails went to the remaining 97 institutions and
resulted in another 5 responses a rate of 5.15%.
Below is a graph to show the response rate percentage against each round of
emails:
Overall 132 institutions were contacted and there were 41 responses (38 named and
3 anonymous) an overall response rate of institutions contacted was 31.06%.
In total one group email was sent to 132 people and then a further 317 individual
emails were sent to named individuals from the UCISA list, totalling 449 emails with
41 replies means the total response rate to emails was 9.13%.
This had the potential to be improved with additional emails to the contacts or
additional contact methods such as telephone or post, however the sample set was
large enough to analyse.
Telephone interviews
0.00%
2.00%
4.00%
6.00%
8.00%
10.00%
12.00%
14.00%
group email response 1st individual emailresponse
2nd individual emailresponse
3rd individual emailresponse
Percentage response rate for each contact attempt

47
Telephone interviews were planned for after data analysis to clarify any ambiguity
raised and to collect some qualitative data to accompany the qualitative, but due to
time constraints this aim was not completed. However the further comments
questions provided some qualitative data but most responders did not take the
opportunity.
Face to face interviews
An interview the Vice Chancellor of Loughborough University, Shirley Pearce was
conducted due to an opportunity arising early on in the project. The full interview is in
Appendix A, but relevant highlights are:
No substantial changes to services are expected although some may occur
and although they may incur risks these might be necessary to gain a
competitive advantage.
Partnerships with both external private and public institutions are gaining
importance, for cost savings and for gaining a competitive advantage.
The VC is personally involved in the change management of the current
change from faculties to schools helping those affected realise the benefits
and move to becoming committed to the change.
The VC admits there could be more benefits realisation done but some
aspects are in place already and they are interested in doing more.
Competitive change is thought to become more important, some areas we are
world leaders and other institutions will want to challenge that and other areas
we want to improve.
Researching and forecasting is conducted by the university paying particular
attention to key decision makers who can directly affect the university.

48
Research Results Summary
The results are listed in Appendix C but below are the key elements analysed.
Data cleaning
The total responders for the questionnaire were 41, 38 named responses and 3
anonymous responses. Anonymous responses were omitted so there would be no
chance of the same institution being included more than once. If multiple responses
from institutions but from differing people were available they could have been
analysed for differing viewpoints from staff within a particular institution but as there
was only one answer per institution it was decided to analyse one response per
institution and to remove any anonymous responses.
Although the majority of the data was fit for purpose mainly due to the fact that the
questionnaire was online so there were no issues with handwriting causing
ambiguity, there were still a number questions which could be cleaned up using
appropriate assumptions:
Question 3: Do you wish to receive an email of the results of my survey?
(results will have personal information removed)
3. Do you wish to receive an email of the results of my survey? (results will have personal information removed)
Yes:
100.0% 37
No:
0.0% 0
One responder left this unanswered; all other responders did indicate they would like to
receive results of the survey. The assumption was made that the responder who did not
answer this would have answered yes if the question was mandatory and as such they will be
included in the group receiving an email of my results.
Question4: Job Title?

49
4. Job Title:
IT Services Director:
31.6% 12
Assistant Director:
15.8% 6
Team Manager:
2.6% 1
Project Manager:
2.6% 1
Service Manager:
2.6% 1
Other (please specify):
44.7% 17
Associate IT Director
CIO
Director of Academic Services
Director of Corporate Information Services
Director of ICT
Director of Information
Director of Information Services
Director of Information, Media and Technology Services
Head of Information Systems
Head of IT
Head of Relationship Management
Head of Section
Head of Technical Infrastrucutre
ICT Governance Manager
ICT Programme Manager
Infrastructure Manager
IT Director
This question was too specific meaning 17 people decided to opt for other and enter
their specific job title. If the question was more generic such as;
1) Director/head of department or section
2) Assistant director/ assistant head of department or section
3) Team/programme manager
4) Project manager
5) Service/area manager

50
6) Other
Associate IT Director Assistant Director
CIO Other
Director of Academic Services IT Director
Director of Corporate Information Services IT Director
Director of ICT IT Director
Director of Information IT Director
Director of Information Services IT Director
Director of Information, Media and Technology Services IT Director
Head of Information Systems IT Director
Head of IT IT Director
Head of Relationship Management IT Director
Head of Section IT Director
Head of Technical Infrastrucutre IT Director
ICT Governance Manager Service Manager
ICT Programme Manager Team Manager
Infrastructure Manager Service Manager
IT Director IT Director
Then the results would have been:
4. Job Title:
IT Services Director:
63.2% 24
Assistant Director:
18.4% 7
Team Manager:
5.3% 2
Project Manager:
2.6% 1
Service Manager:
7.9% 3
Other (please specify):
2.6% 1
CIO

51
The decision was made to clean the data to the above statistics as it was deemed a
true representation of the job role groups the responders belong in. This assumption
will make the analysis of this field more useful as 42.1% has now been moved from
„Other‟ to what was presumed to be a more accurate response.
Another assumption which can be made here is to categorise them into Higher and
Middle Management. These groups would contain, IT Services Directors, Assistant
Directors and CIO into Higher Management (31 members) and Team Managers,
Project Managers and Service Managers in Middle Management (7 members).
The risk of this assumption is that some responders if given the more generic
question outlined above may have chosen differently to the answers presumed. In
hind sight the question would have been written with more generic job roles, for
example:
Please select your most appropriate management Level for your job role: Higher
management (director or assistant director) or middle management (team managers,
project managers and service managers). I would also include an „Other‟ category
again to allow people to elaborate if they deemed it necessary.
Question 5: Institution Type?
5. Institution Type:
Ancient University:
7.9% 3
Red Brick University:
18.4% 7
Plate Glass University:
13.2% 5
Post-1992 University that
was a former polytechnic:
31.6% 12
Post-1992 University that
was not a former polytechnic:
10.5% 4
Post 2005 University:
7.9% 3
Other (please specify):
10.5% 4
None of the above
Private College with degree awarding powers
We are "The" Red Brick University:-)

52
We gained University title in 2005
This question was also cleaned by making two assumptions for two of the responses that fall
into the other category. Assumption one was that the response „We are “The” Red Brick
University;-)‟ would fall into the Red Brick University category and not the other category.
The second assumption is that the university which gained its title in 2005 should be moved
to post 1992 that was not a former polytechnic, this assumption was made after researching
the institution which gave that response. The risk in these assumptions would be that the
institution that gained university status in 2005 could possibly be seen to be in either the post
1992 or the post 2005 category depending on personal perspective.
5. Institution Type:
Ancient University:
7.9% 3
Red Brick University:
21.1% 8
Plate Glass University:
13.2% 5
Post-1992 University that
was a former polytechnic:
31.6% 12
Post-1992 University that
was not a former polytechnic:
13.2% 5
Post 2005 University:
7.9% 3
Other (please specify):
5.3% 2
None of the above
Private College with degree awarding powers
The above table shows the cleaned responses for this question.
Question 6: In terms of the current strategy of your department, please indicate the
priority given to the following:
In the responses to this question there were three blank answers where nothing had been
selected. These were removed these from the results and where a comparison has been taken
between this question and question 14 which was a repeat of this question but based on
expected priority in five years‟ time, the corresponding answer in question 14 was also

53
removed. This question was mandatory so the blank answers could have been an error by the
hosts of the questionnaire not capturing the response or by allowing a question to be missed.
Question 8: How are the following IT Services delivered at present?
In the responses to this question there were three blank answers where nothing had been
selected. These were removed these from the results and where a comparison was taken for
this question (8) and question 16 which is a repeat of this question but based on expected
priority in five years‟ time the corresponding answer in question 16 was also removed. This
question was mandatory so again the blank answers could have been an error by the hosts of
the questionnaire not capturing the response or by allowing a question to be missed.

54
1) Hypothesis results on strategic priority
Hypothesis 1A
Due to the changes in funding, IT strategies priority will be expected to change over
the next five years to focus more on:
Improving efficiencies
Integrating services
improving quality
Areas expected to drop in priority are:
Widening the service portfolio
Expanding existing services
Adopting innovative technology
This is because research highlighted in the literature review by Zahra and Bogner
(1999) and also Prahalad and Hamel (1990) suggests when large amounts of
change are affecting organisations existing services should be improved rather than
the focus being put on the expansion of existing and new services.
Test Two sets of questions were compared, sets as detailed in the table below to highlight
priorities now and expected priorities in five years‟ time.
Area Question set one Question set two
Improving efficiencies Question 6d Question 14d
Improve Integrating
services
Question 6e Question 14e
improving quality Question 6f Question 14f
Widening the service
portfolio
Question 6k Question 14k
Expanding existing
services
Question 6c Question 14c
Adopting innovative
technology
Question 6a Question 14a

55
Result Using the Likert scale asked in the questions of:
5. Very high priority
4. High priority
3. Medium Priority
2. Low priority
1. Very low priority
The average scores of all responders were:
Area
Average score for
perceived priority
now
Average score for
perceived priority
in 5 years’ time
Difference
Improving
efficiencies 4.34 4.53 0.19
Improve Integrating
services 4.25 4.39 0.14
improving quality 4.46 4.61 0.15
Widening the
service portfolio 3.34 3.61 0.27
Expanding existing
services 3.50 3.58 0.08
Adopting innovative
technology 3.45 3.55 0.10
Table 1: Strategic Priorities Results
The above data represented in a graph looks like this:

56
Figure 1: Strategic priorities
The Y axis represents the 5 priority levels asked in the questions and the X axis
represents the IT strategies which were prioritised.
One result left in the additional comments box requested that reducing the
services portfolio was becoming an increasing priority rather than increasing the
service portfolio becoming less of one.
Discussion There was not much change expected on average in any of these areas of strategy
and they all increased in expected priority, however the strategies expected to fall in
this hypothesis were all significantly lower than the ones expected to rise. This could
mean that the affects have already been felt and the strategic priorities have been
adjusted already, or that these priority levels are not related to the changes taking
place and they have been this way before and are unaffected by the changes in
funding.
1
2
3
4
5
Imp
rovi
ng
effi
cien
cies
Imp
rove
Inte
grat
ing
serv
ices
imp
rovi
ng
qu
alit
y
Wid
enin
g th
e se
rvic
e p
ort
folio
Exp
and
ing
exis
tin
g se
rvic
es
Ad
op
tin
g in
no
vati
vete
chn
olo
gy
Average for now
Average for 5 years time

57
Conclusion To conclude the strategies expected to increase in importance did increase although
not by as much as expected. The strategies expected to decrease also increased
which was unexpected, again change was minimal. However the strategies expected
to increase were deemed to be a higher priority on average than the group expected
to decrease. Strategic focus is currently and expected to stay more on improvement
of services than expansion and creation of new services.
Hypothesis 1B
Institutions over the next five years will seek to utilise more external resources and
enter in more strategic partnerships with both public and private companies in a bid
to save resources and to reduce risk by sharing responsibility, this will in turn reduce
the amount of software and services developed in house. This is based on the
assumption that a shift towards outsourcing will continue to grow as outlined by
Foogooa (2008) and Lacity et al. (1996) who also highlighted that co-sourcing and
selective sourcing will also continue to grow.
Test Two sets of questions were compared, sets as detailed in the table below to highlight
priorities now and expected priorities in five years‟ time.
Area Question set one Question set two
Utilise more external
resource
Question 6j Question 14j
Strategic partnerships with
private companies
Question 6h Question 14h
Strategic partnerships with
public organisations
Question 6i Question 14i
Develop more software
and services in house
Question 6b Question 14b
Result Using the scale asked in the questions of:
5. Very high priority
4. High priority

58
3. Medium Priority
2. Low priority
1. Very low priority
The average scores of all responders were:
Area
Average score for
perceived priority
now
Average score for
perceived priority
in 5 years’ time
Difference
Utilise more external
resource 3.08 3.58 0.50
Strategic
partnerships with
private companies
2.74 3.08 0.34
Strategic
partnerships with
public organisations
2.97 3.29 0.32
Develop more
software and
services in house
2.13 2.00 -0.13
Table 2: Strategic Priorities Results
The above data represented in a graph looks like this:

59
Figure 2: Strategic Priorities
The Y axis represents the 5 priority levels asked in the questions and the X axis
represents the selected IT strategies which were prioritised.
1
2
3
4
5
Uti
lise
mo
re e
xter
nal
reso
urc
e
Stra
tegi
c p
artn
ersh
ips
wit
h p
riva
te c
om
pan
ies
Stra
tegi
c p
artn
ersh
ips
wit
h p
ub
lic o
rgan
isat
ion
s
Dev
elo
p m
ore
so
ftw
are
and
ser
vice
s in
ho
use
Average for now
Average for 5 years time

60
Figure 3: Strategic Priorities
The Y axis represents the 5 priority levels asked in the questions and the X axis
represents all the IT strategies which were prioritised.
This second graph highlights that utilising more external resource gained the most
expected priority increase 0.5 (Table 2) although they were all still notably below the
top three highlighted in Hypothesis 1A.
1
2
3
4
5
Imp
rove
ser
vice
qu
alit
y
Imp
rove
eff
icie
ncy
Imp
rove
inte
grat
ion
of
serv
ices
Red
uci
ng
carb
on
fo
otp
rin
t
Exp
and
exi
stin
g se
rvic
es
Ad
op
tin
g in
no
vati
ve t
ech
no
logi
es
Wid
en t
he
serv
ice
po
rtfo
lio
Uti
lise
mo
re e
xter
nal
res
ou
rce
Stra
tegi
c p
artn
ersh
ip w
ith
pu
blic
org
anis
atio
ns
Stra
tegi
c p
artn
ersh
ip w
ith
pri
vate
co
mp
anie
s
Dev
elo
p m
ore
so
ftw
are
an
d s
ervi
ces
in h
ou
se
Now average score
5 years average score

61
Discussion The priorities did increase as expected for the strategies for utilising more external
resource and for strategic partnerships with both public and private sector
organisations. Developing more software and services in house also dropped as
expected however it was already low, which like in hypothesis 1A could be due to
either the effects of the change coming earlier than expected or this trend is not
effected by the change as it was already low. The increase and decrease could be
less than expected as it is only predicted and also an average across many
institutions.
Conclusion Priorities changed as expected, there is a perceived increase in priorities for
outsourcing related strategies, however the increase is less than expected, and in
turn a decrease on in-house development strategic priority is also expected. This
meets the expectations of the hypothesis.
Hypothesis 1C
Reducing carbon footprint is already a high priority strategy and will continue to be
so over the next five years or increase in priority. Even though reductions in funding
and resources will inevitably effect IT departments within HE institutions there will
still be an expectation to maintain and improve on reducing the carbon footprint of
the department as they can often be very large compared with other departments
within an HE institution. This is based on research into institutions strategic plans
published to their web sites commonly stating that reducing the carbon footprint is a
high priority aim.
Test Two sets of questions were compared, sets as detailed in the table below to highlight
priorities now and expected priorities in five years‟ time.
Area Question set one Question set two
Reducing carbon footprint Question 6g Question 14g
Result Using the Likert scale asked in the questions of:

62
5. Very high priority
4. High priority
3. Medium Priority
2. Low priority
1. Very low priority
The average scores of all responders were:
Area Average score for
perceived priority
now
Average score for
perceived priority
in 5 years’ time
Difference
Reducing carbon
footprint 3.61 3.87 0.26
Table 3: Carbon footprint
The above data represented in a graph looks like this:
Figure 4: Carbon footprint
The Y axis represents the 5 priority levels asked in the questions and the X axis
represents the average result for institutions now and expected to be in five years‟
time.
Discussion The priority did increase although the average was deemed to be between „Medium‟
and „High‟ both now and in five years‟ time, this was lower than expected as it is
1
2
3
4
5
Average for now Average for 5 years time
Reducing carbon footprint

63
often included as a high priority within institutions overall strategic plans. This will
also be achieved as a by-product of outsourcing service.
Conclusion Reducing the carbon footprint of IT departments will increase in priority, although
again the increase is less than expected it still meets the expectations of the
hypothesis.
Hypothesis 1D
The type of institution will not have an effect on the priorities they have both now and
expected in five years‟ time, for example an Ancient University who will generally
have more money than a Post 1992 former polytechnic will have similar priorities and
expect similar change. This is based on the large amount of environmental change in
conjunction with the consistent technological change and as highlighted in the
literature review it is expected for institutions to have a common reactive approach to
change.
Test Three sets of questions were compared, sets as detailed in the table below to
highlight priorities now and expected priorities in five years‟ time. cross referencing
against institution type.
Question set one Question set two Question set
three
Question number Question 6 Question 14 Question 5
Question title In terms of the
current strategy of
your Department,
please indicate the
priority given to the
following
In terms of strategy
of your department
over the next five
years, please
indicate the priority
given to the
following.
Institution Type

64
Result Using the Likert scale asked in the questions of:
5. Very high priority
4. High priority
3. Medium Priority
2. Low priority
1. Very low priority
The average scores for current priorities grouped by institution type were:
Ancient
University
Red Brick
University
Plate
Glass
University
Post-1992
University
that was a
former
polytechnic
Post-1992
University
that was
not a
former
polytechnic
Post 2005
University Other
Adopting
innovative
technologies
3.67 3.00 3.40 3.75 3.20 3.33 4.00
Develop
more
software and
services in
house
2.00 1.88 2.20 2.33 2.20 1.33 3.00
Expand
existing
services
3.33 3.38 4.00 3.33 3.60 3.67 3.50
Improve
efficiency 4.33 4.50 4.40 4.50 3.60 4.67 4.00
Improve
integration of
services
4.33 4.13 4.60 4.25 4.00 4.00 4.50
Improve
service
quality
4.67 4.38 4.60 4.42 4.50 4.33 4.50
Reducing
carbon
footprint
3.67 3.25 3.60 3.75 3.80 3.67 3.50
Strategic
partnership
with private
companies
2.00 3.00 3.00 3.00 2.20 2.67 2.00
Strategic
partnership
with public
4.00 2.50 3.60 3.00 3.00 2.67 2.00

65
organisation
s
Utilise more
external
resource
3.00 2.88 3.60 3.42 2.60 2.67 2.50
Widen the
service
portfolio
2.67 3.25 4.20 3.25 3.20 4.00 2.50
Table 4: Strategic Priorities and institution type, now
The above data represented in a graph to show current priorities:

66
Figure 5: Strategic Priorities and institution type, now
The Y axis represents the 5 priority levels asked in the questions and the X axis
represents the IT strategies which were prioritised, the lines then represent the
different types of institution.
The average scores for priorities in five years‟ time grouped by institution type were:
1
2
3
4
5
Ad
op
tin
g in
no
vati
ve t
ech
no
logi
es
Dev
elo
p m
ore
so
ftw
are
an
d s
ervi
ces
in h
ou
se
Exp
and
exi
stin
g se
rvic
es
Imp
rove
eff
icie
ncy
Imp
rove
inte
grat
ion
of
serv
ices
Imp
rove
ser
vice
qu
alit
y
Red
uci
ng
carb
on
fo
otp
rin
t
Stra
tegi
c p
artn
ersh
ip w
ith
pri
vate
co
mp
anie
s
Stra
tegi
c p
artn
ersh
ip w
ith
pu
blic
org
anis
atio
ns
Uti
lise
mo
re e
xter
nal
res
ou
rce
Wid
en t
he
serv
ice
po
rtfo
lio
Ancient University
Red Brick University
Plate Glass University
Post-1992 University thatwas a former polytechnic
Post-1992 University thatwas not a formerpolytechnic
Post 2005 University
Other

67
Ancient
University
Red Brick
University
Plate Glass
University
Post-1992
University
that was a
former
polytechnic
Post-1992
University
that was not
a former
polytechnic
Post 2005
University Other
Adopting
innovative
technologies
4.33 3.00 3.60 3.75 3.40 3.67 3.50
Develop
more
software and
services in
house
2.00 2.00 1.80 2.08 2.20 1.67 2.00
Expand
existing
services
3.00 3.25 3.80 3.67 3.80 4.00 3.50
Improve
efficiency 4.33 4.50 4.60 4.75 4.00 4.67 4.50
Improve
integration
of services
4.00 4.50 4.80 4.42 4.00 4.33 4.50
Improve
service
quality
4.67 4.50 5.00 4.58 4.40 4.67 4.50
Reducing
carbon
footprint
4.33 3.75 4.00 3.92 3.80 3.67 3.50
Strategic
partnership
with private
companies
2.67 3.25 3.60 3.42 2.00 3.00 2.50
Strategic
partnership
with public
organisations
4.00 2.88 4.20 3.33 3.00 3.00 2.50
Utilise more
external
resource
4.33 3.50 3.80 3.67 3.00 3.00 4.00
Widen the
service
portfolio
3.33 3.25 4.20 3.58 3.40 4.33 3.50
Table 5: Strategic Priorities and institution type, in five years
The above data represented in a graph to show priorities in five years‟ time:

68
Figure 6: Strategic Priorities and institution type, in five years
The Y axis represents the 5 priority levels asked in the questions and the X axis
represents the IT strategies which were prioritised, the lines then represent the
different types of institution.
Discussion There is a common trend amongst institutions for priorities both now (Figure 5) and
expected priorities in five years‟ time (Figure 6). Even where there are some
differences in the later strategies relating to strategic partnerships and utilising more
1
2
3
4
5
Ad
op
tin
g in
no
vati
ve t
ech
no
logi
es
Dev
elo
p m
ore
so
ftw
are
an
d s
ervi
ces
in h
ou
se
Exp
and
exi
stin
g se
rvic
es
Imp
rove
eff
icie
ncy
Imp
rove
inte
grat
ion
of
serv
ices
Imp
rove
ser
vice
qu
alit
y
Red
uci
ng
carb
on
fo
otp
rin
t
Stra
tegi
c p
artn
ersh
ip w
ith
pri
vate
co
mp
anie
s
Stra
tegi
c p
artn
ersh
ip w
ith
pu
blic
org
anis
atio
ns
Uti
lise
mo
re e
xter
nal
res
ou
rce
Wid
en t
he
serv
ice
po
rtfo
lio
Ancient University
Red Brick University
Plate Glass University
Post-1992 University thatwas a former polytechnic
Post-1992 University thatwas not a formerpolytechnic
Post 2005 University
Other

69
external resource these are still small. It should also be noted that sample sizes are
small for some institution types, so accuracy of data could be improved with a larger
data set.
Conclusion All institutions are prioritising strategies in a similar way both now and in five years‟
time, this satisfies the hypothesis made that institution type bears no relevance on
strategic priorities.
Hypothesis 1E
There will be a large shift in priorities between now and expected in 5 years as
environmental changes in funding mean strategic priorities in general will change in
either direction, higher or lower, by approximately the same amount to accommodate
the changes. This is based on research highlighted in the literature review by Yeates
and Cadle (1996) who state that strategy should be flexible to adapt to change,
Zahra and Bogner (1998) have also stated the need to change strategic priorities to
accommodate change in dynamic environments.
Test Two sets of questions were compared, sets detailed in the table below to highlight
priorities now and expected priorities in five years‟ time and measure the amount of
change in steps, up and down in priority on the Likert scale (below).
5 Very high priority
4 High priority
3 Medium priority
2 Low priority
1 Very low priority
Question set one Question set two
Question number Question 6 Question 14
Question title In terms of the current
strategy of your
In terms of strategy of your
department over the next

70
Department, please
indicate the priority given to
the following
five years, please indicate
the priority given to the
following.
Result Table to show the number of institutions who fall into each category.
no change 1 step change 2 step change Blank answer
Adopting innovative
technologies 36 2 0 0
Develop more
software and
services in house
25 13 0 0
Expand existing
services 25 12 1 0
Improve efficiency 24 13 1 0
Improve
integration of
services
24 12 1 1
Improve service
quality 23 15 0 0
Reducing carbon
footprint 23 10 3 2
Strategic
partnership with
private companies
22 16 0 0
Strategic
partnership with
public
organisations
22 16 0 0
Utilise more
external resource 20 17 1 0
Widen the service
portfolio 16 19 3 0
Table 6: Strategic priority change
This table can then be totalled as follows:
Totals Percentages
no change 260 61%
1 step change 145 34%
2 step change 20 4%
Blank answer 3 1%

71
Table 7: Strategic priority change
The following graph can be produced:
Step change in service priority over five years
Figure 7: Strategic priority change
61%
34%
4%
1%
Step Change Totals
no change
1 step change
2 step change
Blank answer

72
Figure 8: Strategic priority change
Conclusion The change is a lot less than expected with largely no change expected in strategic
priorities over the next five years (Figure 7). This gradual strategic repositioning -
slow measured and planned move to adapt to the change, is one of Jobbers
responses to environmental change. However I was expecting more of a radical
strategic repositioning - a large change in response to the environmental change as
the change to funding has happened relatively quickly and is relatively large. I also
expected the change to be in both directions with some gaining priority and some
declining in priority however as highlighted in Hypothesis 1B on average the only
strategy declining is develop more software in-house. It‟s also worth noting that no
institution thought there would be a three or four step change in priority of any
strategy. The move in priorities is largely towards an increase as well with nearly
three quarters of the change (figure 8).
Conclusion The hypothesis was found to be incorrect, there is not a large shift in strategic
priorities expected and when the data is further analysed the shift is more towards an
increase than a decrease, not approximately even as predicted.
26%
74%
Percentages for change in direction of priorities
Percentage of declinesin priorities
Percentage of inclinesin priorities

73
2) Hypothesis results on service delivery
Hypothesis 2A
Some services will be expected to become more outsourced to save costs and
spread/share risk but others will remain in houses due to data sensitivity or due to
having physical aspects rather than purely software.
Areas expected to be more outsourced:
Desktop Software Management
Staff file storage
Student file storage
Staff email and groupware
Student email and groupware
Departmental / enterprise server hosting
Server backup service
Desktop backup service
Areas not expected to be more outsourced:
Datacentre physical hardware
Desktop hardware management
Finance system
High performance computing
Human resources system
Networking service
Service desk
Student labs
This is based on research by Read (2010) highlighted in the literature review which
states the importance of maintaining sensitive data in house and on personal
experience of projects that have analysed the advantages and disadvantages for
various IT services within Loughborough University.

74
Test Two sets of questions were compared, sets as detailed in the table below to highlight
service delivery now and expected service delivery in five years‟ time. Measure the
average score from all institutions based on the priority on the Likert scale
5 Wholly outsourced
4 More insourced than outsourced
3 Equally co-sourced
2 More outsourced than insourced
1 Wholly outsourced
Question set one Question set two
Question number Question 8 Question 16
Question title How are the following IT
services delivered at
present?
How do you expect the
following IT Services to be
delivered in 5 years time?
Result
Using the Likert scale outlined above the average scores of all responders were:
Area Average for now Average for 5
years’ time Difference
Desktop Software
Management 4.82 3.47 1.35
Staff file storage 4.84 3.03 1.81
Student file storage 4.54 2.11 2.43
Staff email and
groupware 4.29 2.18 2.11
Student email and
groupware 2.78 1.24 1.54
Departmental /
enterprise server
hosting
4.68 3.03 1.65
Server backup
service 4.61 3.13 1.48

75
Desktop backup
service 4.89 2.97 1.92
Datacentre physical
hardware 4.58 3.21 1.37
Desktop hardware
management 4.63 3.26 1.37
Finance system 4.46 3.46 1.00
High performance
computing 4.79 2.82 1.97
Human resources
system 4.41 3.11 1.30
Networking service 4.71 3.68 1.03
Service desk 4.79 3.87 0.92
Student labs 4.95 4.22 0.73
Table 8: Service delivery change
The above data represented in a graph looks like this:

76
Figure 9: Service delivery change
The Y axis represents the 5 levels of service delivery asked in the questions and the
X axis represents the IT areas which were asked about their current and future
delivery. The blue bar represents the average now and the red bars represent the
average expected in five years.
Discussion The change towards outsourcing is across all areas, however areas which are
mostly physical or that contain particularly sensitive data such as finance or HR
information are expected to be slightly less outsourced than those which are not.
Student email is the only service currently more outsourced than insourced on
average and is expected to move even more in the outsourced direction. The
1
2
3
4
5
Des
kto
p S
oft
war
e M
anag
emen
t
Staf
f fi
le s
tora
ge
Stu
den
t fi
le s
tora
ge
Staf
f em
ail a
nd
gro
up
war
e
Stu
den
t em
ail a
nd
gro
up
war
e
Dep
artm
enta
l / e
nte
rpri
se s
erve
r h
ost
ing
Serv
er b
acku
p s
ervi
ce
Des
kto
p b
acku
p s
ervi
ce
Dat
acen
tre
ph
ysic
al h
ard
war
e
Des
kto
p h
ard
war
e m
anag
emen
t
Fin
ance
sys
tem
Hig
h p
erfo
rman
ce c
om
pu
tin
g
Hu
man
res
ou
rces
sys
tem
Net
wo
rkin
g se
rvic
e
Serv
ice
des
k
Stu
den
t la
bs
Average for now
Average for 5 years time

77
services expected to remain in-house are approximately between co-sourced and
more insourced than outsourced. Whereas the other services are more between co-
sourced and more outsourced than insourced.
Conclusion The hypothesis is party correct, the services with physical elements or sensitive data
are on average being outsourced less than other services which don‟t have those
characteristics, however a degree of outsourcing is still expected.
Hypothesis 2B
There will be a large shift in service delivery between now and expected in 5 years
as changes in funding mean services will change in how they are delivered in
general and will change in either direction, as either insourcing or outsourcing a
service can be beneficial in different circumstances. This is based on research by
Willcocks and Lester (1997) who stated that services are better in-house when you
have the capability equal to or more than the external market.
Test Two sets of questions were compared, sets as detailed in the table below to highlight
service delivery now and expected service delivery in five years‟ time. Measure the
amount of change in steps, up and down in priority on the Likert scale:
5 Wholly outsourced
4 More insourced than outsourced
3 Equally co-sourced
2 More outsourced than insourced
1 Wholly outsourced
Question set one Question set two
Question number Question 8 Question 16
Question title How are the following IT
services delivered at
present?
How do you expect the
following IT Services to be
delivered in 5 years‟ time?

78
Result
no
change
1 step
change
2 step
change
3 step
change
4 step
change
Blank
answer
Datacentre
physical
hardware
infrastructure 7 15 11 5 0 0
Desktop
hardware
management 9 16 4 8 1 0
Desktop
software
management 7 18 6 7 0 0
Finance
system
16 11 6 2 2 1
High
performance
computing 3 5 7 2 1 20
Human
resources
system 10 13 5 5 4 1
Staff file store 3 13 9 8 4 1
Student file
store 2 9 9 6 11 1
Staff e-mail
and groupware 11 5 3 7 12 0
Student e-mail
and groupware 20 2 1 1 13 1
Departmental/
enterprise
server hosting 2 17 13 4 2 0
Networking
service 12 16 7 3 0 0
Service desk 11 20 6 1 0 0
Student labs 17 15 3 1 0 2
Server backup
service 6 17 9 3 3 0
Desktop
backup service 2 11 6 6 2 11
Table 9: Service delivery step change

79
These were all moves towards outsourcing apart from four, one institute who already
wholly outsources their student email and groupware thought that in 5 years‟ time
this would move by a step of one to, „More outsourced than insourced‟. The same
institute also thought their Human Resource system would move from „More
outsourced than in sourced‟ to „More insourced than outsourced‟. One other
institution currently rated staff file store as „More outsourced than in sourced‟ and
thought in five years‟ time it would move to „More outsourced than insourced‟ and the
last institute thought their human resource system was currently „More outsourced
than insourced‟ and it would move to „Equally co-sourced‟
This can be added up and totalled as a percentage below:
no change 138 22.70%
1 step change 203 33.39%
2 step change 105 17.27%
3 step change 69 11.35%
4 step change 55 9.05%
blank answer 38 6.25%
Table 10: Service delivery step change
This can then be shown as a graph:

80
Figure 10: Service delivery step change
Change in service delivery in steps, expressed as a percentage of the overall
answers.
When you compare this side by side with strategic priority change from hypothesis
1E it highlights how much more this is moving compared to that:
23%
34%
17%
11%
9%
6%
no change
1 step change
2 step change
3 step change
4 step change
blank answer
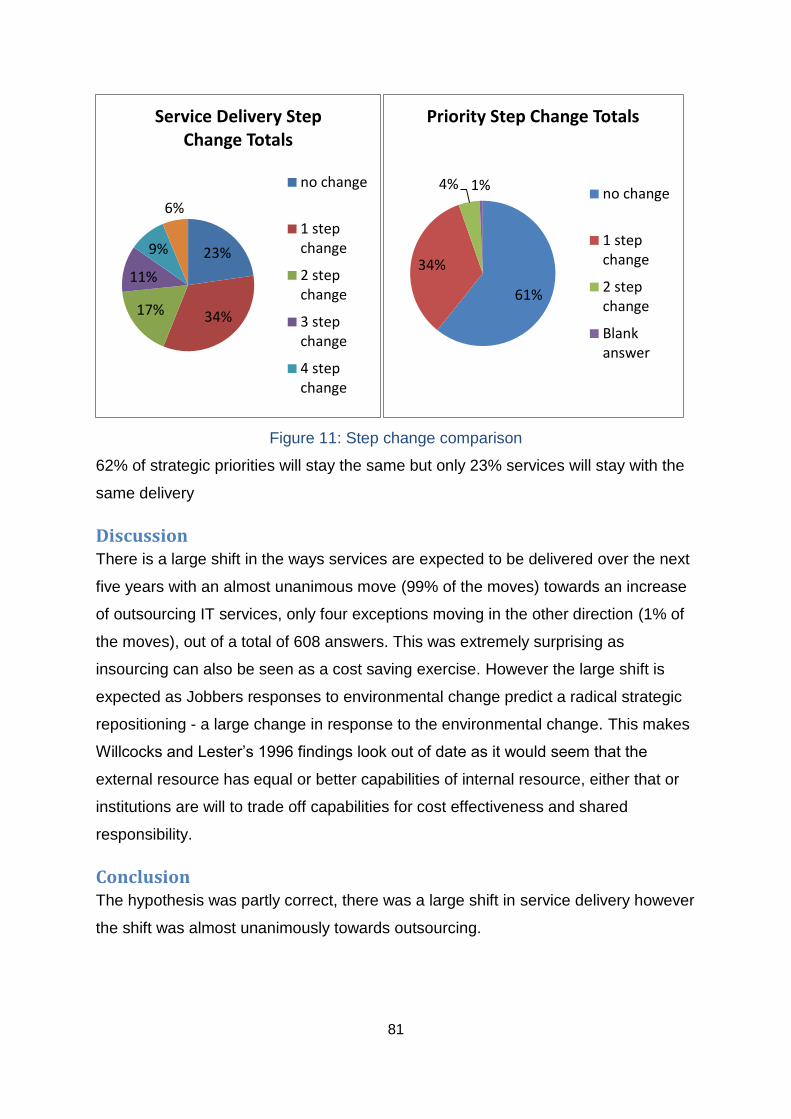
81
Figure 11: Step change comparison
62% of strategic priorities will stay the same but only 23% services will stay with the
same delivery
Discussion There is a large shift in the ways services are expected to be delivered over the next
five years with an almost unanimous move (99% of the moves) towards an increase
of outsourcing IT services, only four exceptions moving in the other direction (1% of
the moves), out of a total of 608 answers. This was extremely surprising as
insourcing can also be seen as a cost saving exercise. However the large shift is
expected as Jobbers responses to environmental change predict a radical strategic
repositioning - a large change in response to the environmental change. This makes
Willcocks and Lester‟s 1996 findings look out of date as it would seem that the
external resource has equal or better capabilities of internal resource, either that or
institutions are will to trade off capabilities for cost effectiveness and shared
responsibility.
Conclusion The hypothesis was partly correct, there was a large shift in service delivery however
the shift was almost unanimously towards outsourcing.
23%
34% 17%
11%
9%
6%
Service Delivery Step Change Totals
no change
1 stepchange
2 stepchange
3 stepchange
4 stepchange
61%
34%
4% 1%
Priority Step Change Totals
no change
1 stepchange
2 stepchange
Blankanswer

82
Hypothesis 2C
Different responders from different levels of management will have different
viewpoints on the amount of outsourcing to expect over the next five years. Higher
management will be more inclined to think a service will be outsourced in five years
than a member of middle management, because higher management traditionally
has the role of longer term strategic thinking and will be looking to the future of
outsourcing and all of its highly publicised benefits, such as cloud computing.
Whereas middle management, for example team managers, are often tasked with
shorter term upgrades and system developments and will be looking more to
improving systems internally with their team resources. This hypothesis is based on
personal experience from the IT Services department at Loughborough University.
Test As data was collected from one individual per institution a comparison of the same
institution with different levels of management cannot be made; however an average
analysis for each IT service surveyed for higher managers and middle managers can
be made.
Three sets of question sets as detailed in the table below were compared to highlight
service delivery now and expected service delivery in five years‟ time. Average
scores from the Likert scale below were grouped by management level of the
responder.
5) Wholly outsourced
4) More insourced than outsourced
3) Equally co-sourced
2) More outsourced than insourced
1) Wholly outsourced
Question set one Question set two Question set
three
Question number Question 8 Question 16 Question 4

83
Question title How are the
following IT
services delivered
at present?
How do you
expect the
following IT
Services to be
delivered in 5
years‟ time?
Job Title?
Result
Higher
management
service
delivery (now)
Middle
management
service
delivery (now)
Higher
management
service
delivery (5
years)
Middle
management
service
delivery (5
years)
Datacentre physical
hardware
infrastructure 4.52 4.86 3.26 3.14
Desktop hardware
management 4.68 4.43 3.29 3.29
Desktop software
management 4.81 4.86 3.55 3.57
Finance system 4.53 4.14 3.50 3.71
High performance
computing 4.71 5.00 3.07 3.50
Human resources
system 4.30 4.86 3.07 3.71
Staff file store 4.80 5.00 3.00 3.42
Student file store 4.47 4.86 2.07 2.57
Staff e-mail and
groupware 4.13 5.00 2.29 1.86
Student e-mail and
groupware 2.67 3.29 1.33 1.00
Departmental/enterpri
se server hosting 4.65 4.86 3.03 3.29
Networking service 4.68 4.86 3.68 4.00
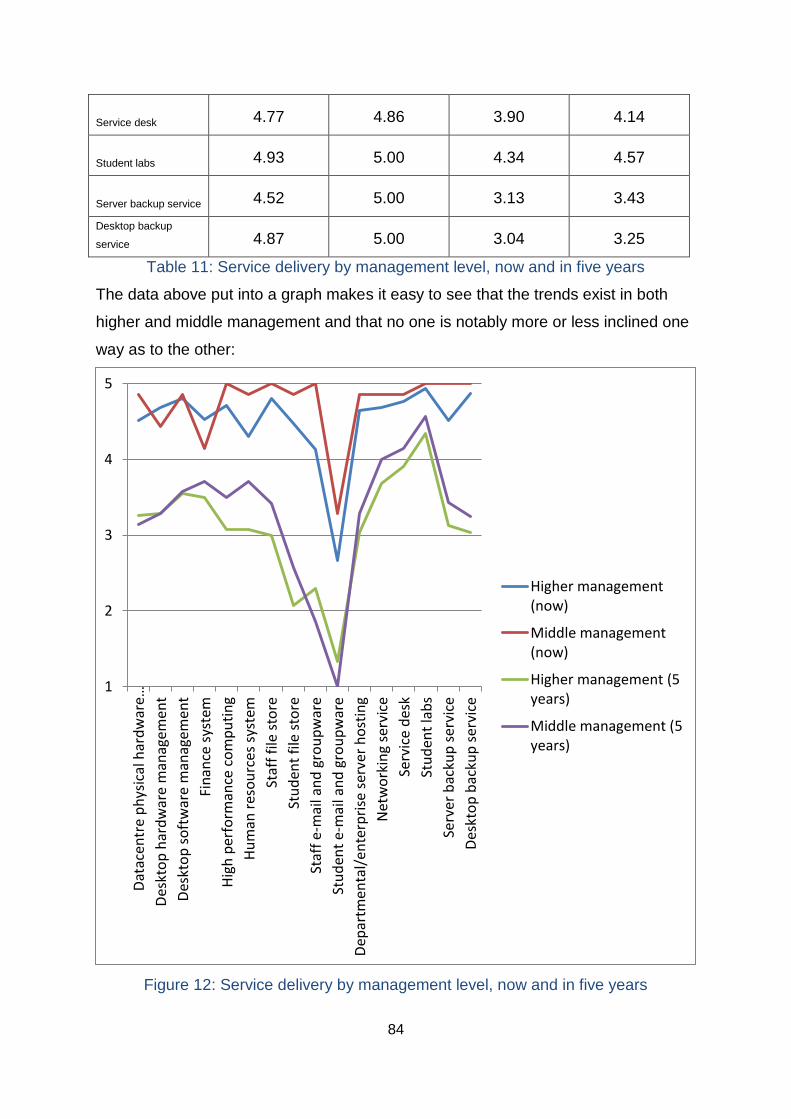
84
Service desk 4.77 4.86 3.90 4.14
Student labs 4.93 5.00 4.34 4.57
Server backup service 4.52 5.00 3.13 3.43
Desktop backup
service 4.87 5.00 3.04 3.25
Table 11: Service delivery by management level, now and in five years
The data above put into a graph makes it easy to see that the trends exist in both
higher and middle management and that no one is notably more or less inclined one
way as to the other:
Figure 12: Service delivery by management level, now and in five years
1
2
3
4
5
Dat
acen
tre
ph
ysic
al h
ard
war
e…
Des
kto
p h
ard
war
e m
anag
emen
t
Des
kto
p s
oft
war
e m
anag
emen
t
Fin
ance
sys
tem
Hig
h p
erfo
rman
ce c
om
pu
tin
g
Hu
man
res
ou
rces
sys
tem
Staf
f fi
le s
tore
Stu
den
t fi
le s
tore
Staf
f e-
mai
l an
d g
rou
pw
are
Stu
den
t e-
mai
l an
d g
rou
pw
are
Dep
artm
enta
l/en
terp
rise
ser
ver
ho
stin
g
Net
wo
rkin
g se
rvic
e
Serv
ice
des
k
Stu
den
t la
bs
Serv
er b
acku
p s
ervi
ce
Des
kto
p b
acku
p s
ervi
ce
Higher management(now)
Middle management(now)
Higher management (5years)
Middle management (5years)

85
Discussion It should be noted that this data set contains a large amount of data cleaning to
ascertain the level of management of the responder which could introduce
inaccuracy. Both higher and middle management expect the similar trends towards
outsourcing across all services.
Conclusion The hypothesis is incorrect as far as this data set is concerned there is no clear
indication that different levels of management will have different perceptions of
service delivery now or expected service delivery in five years‟ time.
Hypothesis 2D
Older Universities will expect less change than newer ones as they are more stable
and constant in their practices compared to newer universities which have more
dynamic attributes to adapt to change quickly to fulfil market demands. This
hypothesis is based on research on types of courses offered to students, newer
emerging course demand is often first filled by newer institutions.
Test Three sets of questions were compared as detailed in the table below to highlight
service delivery now and expected service delivery in five years‟ time. Average
scores from the Likert scale below were grouped by institution type of the responder.
5 Wholly outsourced
4 More insourced than outsourced
3 Equally co-sourced
2 More outsourced than insourced
1 Wholly outsourced
Question set
one
Question set
two
Question set
three
Question
number
Question 8 Question 16 Question 5
Question title How are the How do you Institution

86
following IT
services
delivered at
present?
expect the
following IT
Services to be
delivered in 5
years‟ time?
type?
Result Table to show the differences between score now and score then for service delivery
on average for each institution type.
Ancient
University
Red Brick
University
Plate Glass
University
Post-1992
University
that was a
former
polytechnic
Post-1992
University
that was
not a
former
polytechnic
Post 2005 Other
Datacentre
physical
hardware
infrastructure
1.67 0.75 1.20 1.83 1.00 0.50 2.50
Desktop
hardware
management
1.67 1.38 0.40 1.50 1.40 1.50 2.50
Desktop
software
management
1.67 1.25 1.20 1.67 1.40 0.00 1.00
Finance
system 1.33 0.75 1.75 1.00 0.80 0.00 1.00
High
performance
computing
2.00 1.00 1.50 2.50 1.00 NA 2.00
Human
resources
system
2.67 1.63 1.25 1.33 0.80 2.00 1.00
Staff file
store 2.33 1.63 2.00 2.00 1.60 1.00 3.00
Student file
store 1.67 2.13 2.80 2.50 2.20 1.00 3.50
Staff e-mail
and
groupware
1.33 2.00 2.40 2.00 2.40 0.00 4.00
Student e-
mail and
groupware
0.00 2.250 1.60 1.42 0.80 0.00 4.00

87
Departmenta
l/enterprise
server
hosting
1.67 1.38 2.00 1.92 1.00 1.00 1.50
Networking
service 1.00 0.88 0.20 1.42 0.80 0.50 2.50
Service desk 0.33 0.88 0.80 1.25 0.80 0.00 1.50
Student labs 0.67 0.29 0.60 0.91 0.80 0.00 1.00
Server
backup
service
1.33 0.88 2.00 1.92 1.60 0.00 1.50
Desktop
backup
service
1.50 1.60 2.00 2.11 2.00 0.00 2.00
Table 12: Service delivery differences by institution type
The data above shown as a graph:

88
Figure 13: Service delivery differences by institution type
The Y axis is the difference of the average of service delivery rating now to in 5
years, the x axis are the IT services and the lines represent the institution types. The
difference is always a shift towards outsourcing as on average no service moved
toward insourcing.
The two groups „Post 2005‟ and „Other‟ are out of sync with the rest but this could be
due to them only having two institutions in their group. If we remove them the graph
looks like this:
0
0.5
1
1.5
2
2.5
3
3.5
4
4.5
Dat
acen
tre
ph
ysic
al h
ard
war
e in
fras
tru
ctu
re
Des
kto
p h
ard
war
e m
anag
emen
t
Des
kto
p s
oft
war
e m
anag
emen
t
Fin
ance
sys
tem
Hig
h p
erfo
rman
ce c
om
pu
tin
g
Hu
man
res
ou
rces
sys
tem
Staf
f fi
le s
tore
Stu
den
t fi
le s
tore
Staf
f e-
mai
l an
d g
rou
pw
are
Stu
den
t e-
mai
l an
d g
rou
pw
are
Dep
artm
enta
l/en
terp
rise
ser
ver
ho
stin
g
Net
wo
rkin
g se
rvic
e
Serv
ice
des
k
Stu
den
t la
bs
Serv
er b
acku
p s
ervi
ce
Des
kto
p b
acku
p s
ervi
ce
Ancient University
Red Brick University
Plate Glass University
Post-1992 University thatwas a former polytechnic
Post-1992 University thatwas not a formerpolytechnic
Post 2005
Other

89
Figure 14: Service delivery differences by institution type
This graph shows the trend more clearly and even though the ancient university
group only consists of three institutions the average still falls within the range to
show a common trend.
0
0.5
1
1.5
2
2.5
3D
atac
entr
e p
hys
ical
har
dw
are
infr
astr
uct
ure
Des
kto
p h
ard
war
e m
anag
emen
t
Des
kto
p s
oft
war
e m
anag
emen
t
Fin
ance
sys
tem
Hig
h p
erfo
rman
ce c
om
pu
tin
g
Hu
man
res
ou
rces
sys
tem
Staf
f fi
le s
tore
Stu
den
t fi
le s
tore
Staf
f e-
mai
l an
d g
rou
pw
are
Stu
den
t e-
mai
l an
d g
rou
pw
are
Dep
artm
enta
l/en
terp
rise
ser
ver
ho
stin
g
Net
wo
rkin
g se
rvic
e
Serv
ice
des
k
Stu
den
t la
bs
Serv
er b
acku
p s
ervi
ce
Des
kto
p b
acku
p s
ervi
ce
Ancient University
Red Brick University
Plate Glass University
Post-1992 University thatwas a former polytechnic
Post-1992 University thatwas not a formerpolytechnic

90
Discussion Institution type does not affect the amount of change expected in service delivery; on
average they all seem to follow a similar pattern despite their differences. However
due to some groups of institutions consisting of such small sample sets there could
be a degree of inaccuracy.
Conclusion The hypothesis is incorrect the institution type, based on the year it was founded,
does not correlate to a larger or smaller shift in expected change in service delivery.
Hypothesis 2E
Institutions expecting the most amount of change in service delivery will also conduct
the benefits analysis/targeting more often and successfully realise those benefits
more often than institutions expecting a small amount of change. If an institution
analyses benefits, then targets them and then successfully realises them then they
are more likely to look to change as a way of improvement through the creation and
maximisation of any potential benefits. Whereas an institution which does not do this
as often is less likely to look to change services as they are less aware of the
benefits of doing so and haven‟t successfully realised them as often previously.
Test Four sets of question sets were compared as detailed in the table below to highlight
the amount of change expected in service delivery based on the Likert scale below:
5 Wholly outsourced
4 More insourced than outsourced
3 Equally co-sourced
2 More outsourced than insourced
1 Wholly outsourced
With each institution‟s average score for benefits targeting and successful realisation
based on the Likert scale below:
5 Always

91
4 Usually
3 Sometimes
2 Rarely
1 Never
Question set
one
Question set
two
Question set
three
Question
set four
Question
number
Question 8 Question 16 Question 10 Question
12
Question title How are the
following IT
services
delivered at
present?
How do you
expect the
following IT
Services to be
delivered in 5
years‟ time?
To what
extent are
your
University‟s IT
projects used
to explicitly
target the
following
types of
benefit?
To what
extent are
benefits, in
each of the
following
areas,
successfully
realised
from your
University‟s
IT Projects?
Result
Average score for
benefits analysed
Average score for
benefits realised
Average score for
amount of service
delivery change
Institution 1 3.58 3.36 2.08
Institution 2 3.33 3.17 1.17
Institution 3 3.33 3.00 0.92
Institution 4 3.50 3.17 1.46
Institution 5 3.25 3.00 1.43
Institution 6 3.08 3.33 0.77
Institution 7 3.83 3.58 3.46
Institution 8 4.83 4.83 1.54
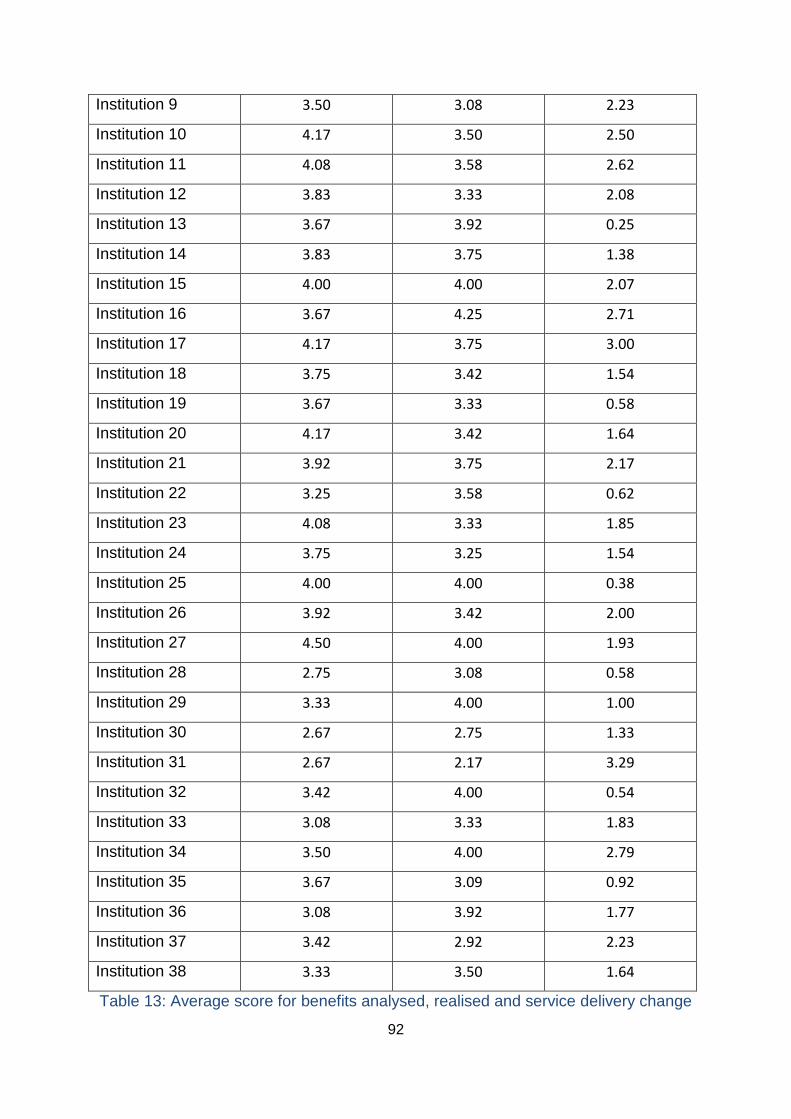
92
Institution 9 3.50 3.08 2.23
Institution 10 4.17 3.50 2.50
Institution 11 4.08 3.58 2.62
Institution 12 3.83 3.33 2.08
Institution 13 3.67 3.92 0.25
Institution 14 3.83 3.75 1.38
Institution 15 4.00 4.00 2.07
Institution 16 3.67 4.25 2.71
Institution 17 4.17 3.75 3.00
Institution 18 3.75 3.42 1.54
Institution 19 3.67 3.33 0.58
Institution 20 4.17 3.42 1.64
Institution 21 3.92 3.75 2.17
Institution 22 3.25 3.58 0.62
Institution 23 4.08 3.33 1.85
Institution 24 3.75 3.25 1.54
Institution 25 4.00 4.00 0.38
Institution 26 3.92 3.42 2.00
Institution 27 4.50 4.00 1.93
Institution 28 2.75 3.08 0.58
Institution 29 3.33 4.00 1.00
Institution 30 2.67 2.75 1.33
Institution 31 2.67 2.17 3.29
Institution 32 3.42 4.00 0.54
Institution 33 3.08 3.33 1.83
Institution 34 3.50 4.00 2.79
Institution 35 3.67 3.09 0.92
Institution 36 3.08 3.92 1.77
Institution 37 3.42 2.92 2.23
Institution 38 3.33 3.50 1.64
Table 13: Average score for benefits analysed, realised and service delivery change

93
Once these are ordered by institution with the highest average score for amount of
service delivery change expected down to the lowest a graph can be used to show if
the trend follows with benefits targeted and successfully realised.
Figure 15: Average score for benefits analysed, realised and service delivery change
The Y axis is the score from the table above and the X axis are the 38 institutions
which responded, with the three lines representing the three questions asked.
Ordered by the amount of expected service delivery change.
0
0.5
1
1.5
2
2.5
3
3.5
4
4.5
5
Inst
itu
tio
n 7
Inst
itu
tio
n 3
4
Inst
itu
tio
n 1
0
Inst
itu
tio
n 2
1
Inst
itu
tio
n 1
5
Inst
itu
tio
n 2
3
Inst
itu
tio
n 2
0
Inst
itu
tio
n 1
8
Inst
itu
tio
n 5
Inst
itu
tio
n 2
Inst
itu
tio
n 3
5
Inst
itu
tio
n 1
9
Inst
itu
tio
n 2
5
Average score forbenefits analysed
Average score forbenefits realised
Average score foramount of servicedelivery change

94
Discussion This shows there is no correlation between those who target and successfully realise
benefits to those who are expecting a large amount of change to IT service delivery.
However it does highlight that institutions do approximately the same amount of
benefits targeting as they successfully realise.
Conclusion The hypothesis is incorrect; there is no correlation between the amount of expected
change in service delivery and the frequency of benefits realisation conducted by an
institution.
3) Hypothesis results on benefits realisation
Hypothesis 3A
Although IT projects often look for benefits and target them they are less often
actually successfully realise them. Hypothesis 2E highlighted that the frequency of
benefits targeted by institution was close to the frequency of benefits successfully
realised. I would expect however for benefits to be frequently targeted as part of a
change management methodology but for the actual measurement of success to be
lower due to the measurements not taking place after the change has „gone live‟ or
due to the expected benefits changing as the change evolves. This is based on
personal experience and also from research in the literature review from Ashurst and
Hodges (2010) who found in their research that post project evaluation of benefits
was not carried out consistently.
Test Two sets of question sets were compared as detailed in the table below to highlight
the difference between benefits targeting and successful realisation.
Question set one Question set two
Question number Question 10 Question 12

95
Question title To what extent are your
University‟s IT projects
used to explicitly target
the following types of
benefit?
To what extent are
benefits, in each of the
following areas,
successfully realised from
your University‟s IT
Projects?
Result
Areas
Number of
institutions who
target benefit more
than realise it
Number of
institutions who
equally target and
realise
Number of
institutions who
realise benefit
more than target it
Improving system
reliability,
measurable by
number of issues
logged with the
service desk
14 17 7
Improving fix times
for logged issues,
measurable
through service
desk statistics
8 19 11
Improving IT
service availability,
reducing planned
and unplanned
downtime
14 21 3
Reducing
environmental
impact / carbon
footprint
8 21 9

96
Improving data
security 9 20 9
Reducing training
needed, simplification and
integration of systems
11 23 3
Improving system
performance, faster
and more efficient
systems
11 25 2
Improvements to
the efficiency and
effectiveness of
administrative
processes
14 19 5
Enhanced support
for and access to
research
10 21 7
Improvements to
managerial
decision-making
10 20 8
Improvements to
the quality of
teaching through e-
learning initiatives
7 27 4
Enhanced
communications
with existing and
potential students
7 23 7
Table 14: Institution by benefits targeted and realised
There was one blank answer under “Reducing training needed, simplification and
integration of systems” that data set contains 37 responders not 38 like the other
data sets.

97
The table above expressed as a graph:
0
5
10
15
20
25
30Im
pro
vin
g sy
stem
rel
iab
ility
, me
asu
rab
le b
y n
um
ber
of
issu
es
logg
ed w
ith
…
Imp
rovi
ng
fix
tim
es f
or
logg
ed is
sues
, mea
sura
ble
th
rou
gh s
ervi
ce d
esk
…
Imp
rovi
ng
IT s
ervi
ce a
vaila
bili
ty, r
edu
cin
g p
lan
ned
an
d u
np
lan
ned
do
wn
tim
e
Re
du
cin
g en
viro
nm
enta
l im
pac
t /
carb
on
fo
otp
rin
t
Imp
rovi
ng
dat
a se
curi
ty
Re
du
cin
g tr
ain
ing
ne
eded
, sim
plif
icat
ion
an
d in
tegr
atio
n o
f sy
stem
s
Imp
rovi
ng
syst
em p
erf
orm
ance
, fas
ter
and
mo
re e
ffic
ien
t sy
stem
s
Imp
rove
me
nts
to
th
e e
ffic
ien
cy a
nd
eff
ecti
ven
ess
of
adm
inis
trat
ive
pro
cess
es
Enh
ance
d s
up
po
rt f
or
and
acc
ess
to
re
sear
ch
Imp
rove
me
nts
to
man
ager
ial d
eci
sio
n-m
akin
g
Imp
rove
me
nts
to
th
e q
ual
ity
of
teac
hin
g th
rou
gh e
-le
arn
ing
init
iati
ves
Enh
ance
d c
om
mu
nic
atio
ns
wit
h e
xist
ing
and
po
ten
tial
stu
de
nts
Number of institutions whotarget benefit more thanrealise it
Number of institutions whoequally target and realise
Number of institutions whorealise benefit more thantarget it

98
Figure 16: Institution by benefits targeted and realised
The Y axis represents the number of institutions, the X axis represents the areas
from the questions and the bars represent if an institution targets that particular area
more, equally or less than it successfully realises it.
Discussion This was surprising as it wasn‟t expected that any areas would have benefits
realised more than they were targeted. The number who equally target and then
successfully realise them is also much higher than expected. More research could
be done in this area to find out why and how this is happening.
Conclusion The hypothesis is incorrect, some benefits are being successfully realised more
often than they are targeted.
Hypothesis 3B
Institutions who successfully realise benefits more often are more likely to fully use
change management methodologies such as PRINCE2 or ITIL.
Test Two question sets were compared as detailed in the table below to highlight a
correlation between high scores in frequency of benefits realisation using the Likert
scale below:
5 Always
4 Usually
3 Sometimes
2 Rarely
1 Never
And institutions who use change management methodologies based on the scale
below:
1 Yes
2 Partly

99
3 Not yet but planning to
4 No
Question set one Question set two
Question number Question 19 Question 12
Question title Are you currently using
any formal methodologies
for change management
(for example, ITIL or
PRINCE2)?
To what extent are
benefits, in each of the
following areas,
successfully realised from
your University‟s IT
Projects?
Result Average score for
benefits realised
Using formal change
management
methodologies
Institution 1 3.36 1
Institution 2 3.17 1
Institution 3 3.00 2
Institution 4 3.17 4
Institution 5 3.00 3
Institution 6 3.33 1
Institution 7 3.58 1
Institution 8 4.83 1
Institution 9 3.08 1
Institution 10 3.50 2
Institution 11 3.58 2
Institution 12 3.33 1
Institution 13 3.92 2
Institution 14 3.75 1

100
Table 15: Benefits by change management methodologies
If the above table is expressed in a graph and is ordered by if the institution uses
formal change management methodologies, it shows that the lower the score the
more they do, so the left hand side answered yes and when the red line rises they
answered partly then not yet but planning to then the last institution on the right hand
side answered no.
Institution 15 4.00 1
Institution 16 4.25 1
Institution 17 3.75 2
Institution 18 3.42 1
Institution 19 3.33 1
Institution 20 3.42 1
Institution 21 3.75 1
Institution 22 3.58 2
Institution 23 3.33 1
Institution 24 3.25 1
Institution 25 4.00 2
Institution 26 3.42 1
Institution 27 4.00 1
Institution 28 3.08 2
Institution 29 4.00 1
Institution 30 2.75 2
Institution 31 2.17 3
Institution 32 4.00 2
Institution 33 3.33 1
Institution 34 4.00 1
Institution 35 3.09 1
Institution 36 3.92 2
Institution 37 2.92 1
Institution 38 3.50 1

101
Figure 17: Benefits by change management methodologies
It looks like there might be a very slight trend of benefits realisation being higher
when the formal change management methodologies are being used.
Simplified it looks like:
0
0.5
1
1.5
2
2.5
3
3.5
4
4.5
5
Inst
itu
tio
n 1
Inst
itu
tio
n 7
Inst
itu
tio
n 1
2
Inst
itu
tio
n 1
6
Inst
itu
tio
n 2
0
Inst
itu
tio
n 2
4
Inst
itu
tio
n 2
9
Inst
itu
tio
n 3
5
Inst
itu
tio
n 3
Inst
itu
tio
n 1
3
Inst
itu
tio
n 2
5
Inst
itu
tio
n 3
2
Inst
itu
tio
n 3
1
Average score for benefitsrealised
Using formal changemanagementmethodologies

102
Figure 18: Average benefits by change management methodologies
And the average score is averaged out for all the answers in each category. As there
was only two responses in the „3 = Not yet but planning to‟ answer and only one in
the „4 = No‟ the data sets are too small to draw a solid conclusion.
Discussion There could be a very slight decrease in the amount of benefits realised when not
implementing a formal change management methodology although with this size
data sample it isn‟t enough to tell, further research using a larger data set may
produce a more definite trend.
Conclusion The hypothesis is inconclusive due to the size of the data set for the groups
analysed.
Hypothesis 3C
Higher levels of management believe benefits are being targeted and realised more
than middle managers. Higher level managers will be looking at project initiation
documents with benefits of proposed projects and will believe these will be managed
and met by middle managers in charge of these projects, however targets are often
set during system development and improvement projects for measurable benefits
which can be recorded once the system is live but once the system does go live
1
2
3
4
5
Yes Partly Not yet butplanning to
No
Average score for benefits realised
Average score for benefitsrealised

103
these are often forgotten about as the main focus is fixing any initial problems that
occur which weren‟t picked up in the testing and pilot phases. It is then hard to draw
the line of the system fully live and initial problems fixed so that real benefits analysis
can be done. Even if they are remembered and resource is still available to monitor
and analyse the benefits the additional problem can be that the initial targets set in
the project planning phase are now unrealistic or inaccurate compared with how the
system has developed and changed through the project process.
Test Compare three sets of question sets as detailed in the table below to highlight the
amount of benefits targeting and successful realisation shown against management
level, attained from job title.
Question set one Question set
two
Question set
three
Question
number
Question 10 Question 12 Question 4
Question title To what extent are
your University‟s IT
projects used to
explicitly target the
following types of
benefit?
To what extent
are benefits, in
each of the
following areas,
successfully
realised from
your University‟s
IT Projects?
Job Title:
Result
Total benefits
analysed
Total benefits
realised Job Title
Institution 1 3.58 3.36 Middle
Management
Institution 2 3.33 3.17 Higher
Management
Institution 3 3.33 3.00 Higher

104
Management
Institution 4 3.50 3.17 Higher
Management
Institution 5 3.25 3.00 Middle
Management
Institution 6 3.08 3.33 Middle
Management
Institution 7 3.83 3.58 Higher
Management
Institution 8 4.83 4.83 Higher
Management
Institution 9 3.50 3.08 Higher
Management
Institution 10 4.17 3.50 Higher
Management
Institution 11 4.08 3.58 Middle
Management
Institution 12 3.83 3.33 Higher
Management
Institution 13 3.67 3.92 Higher
Management
Institution 14 3.83 3.75 Higher
Management
Institution 15 4.00 4.00 Higher
Management
Institution 16 3.67 4.25 Higher
Management
Institution 17 4.17 3.75 Higher
Management
Institution 18 3.75 3.42 Higher
Management

105
Institution 19 3.67 3.33 Higher
Management
Institution 20 4.17 3.42 Higher
Management
Institution 21 3.92 3.75 Higher
Management
Institution 22 3.25 3.58 Higher
Management
Institution 23 4.08 3.33 Higher
Management
Institution 24 3.75 3.25 Middle
Management
Institution 25 4.00 4.00 Higher
Management
Institution 26 3.92 3.42 Higher
Management
Institution 27 4.50 4.00 Middle
Management
Institution 28 2.75 3.08 Higher
Management
Institution 29 3.33 4.00 Higher
Management
Institution 30 2.67 2.75 Middle
Management
Institution 31 2.67 2.17 Higher
Management
Institution 32 3.42 4.00 Higher
Management
Institution 33 3.08 3.33 Higher
Management
Institution 34 3.50 4.00 Higher

106
Management
Institution 35 3.67 3.09 Higher
Management
Institution 36 3.08 3.92 Higher
Management
Institution 37 3.42 2.92 Higher
Management
Institution 38 3.33 3.50 Higher
Management
Table 16: Benefits analysed and realised by management level
There are only seven middle managers who responded compared to thirty one in the
higher management category, but if I rearrange the order of institutions so that the
middle managers are the last seven then put the data into a graph it looks like this:
Figure 19: Benefits analysed and realised by management level
1
1.5
2
2.5
3
3.5
4
4.5
5
Inst
itu
tio
n 2
Inst
itu
tio
n 7
Inst
itu
tio
n 1
0
Inst
itu
tio
n 1
4
Inst
itu
tio
n 1
7
Inst
itu
tio
n 2
0
Inst
itu
tio
n 2
3
Inst
itu
tio
n 2
8
Inst
itu
tio
n 3
2
Inst
itu
tio
n 3
5
Inst
itu
tio
n 3
8
Inst
itu
tio
n 6
Inst
itu
tio
n 2
7
Total benefits analysed
Total benefits realised

107
It doesn‟t look like a pattern exists at all, however if the average for both higher and
middle management is compared it shows a slight difference, as below:
Figure 20: Average benefits analysed and realised by management level
With the Y axis being:
5 = Always
4 = Usually
3 = Sometimes
2 = Rarely
1 = Never
And the X axis the average amount of benefits analysed realised for each
management group.
Conclusion There is a very slight decrease but a larger sample group would be needed to
confirm the hypothesis.
4) Hypothesis results on change management
Hypothesis 4A
Higher levels of management perceive the organisational culture of the institution
differently to those in middle management. It‟s very rare that an organisation culture
1
2
3
4
5
Average benefits analysed Average benefits realised
Higher Management
Middle Management

108
will be perceived the same at all levels of management, as there is large amount of
research into the benefits of having the culture perceived the same at all levels,
although it is often noted that this is difficult to achieve.
Test Two sets of question were compared as detailed in the table below to compare
organisational culture against management level attained from the job title.They
used the following Likert scale:
5 = Strongly Agree
4 = Agree
3 = Neutral
2 = Disagree
1 = Strongly Disagree
Question set one Question set
two
Question
number
Question 18 Question 4
Question title How accurate are
the following
descriptions of
your organisation?
Job Title:
Result Higher management Middle Management
Average score for: IT staff
are led by a charismatic
and well respected
management team
3.87 3.00
Average score for: IT staff 3.84 3.71

109
roles are clearly defined
and relationships are also
clearly set out
Average score for: IT staff
use informal relationships
and roles to get things
done quicker and easier
than using the formal
channels
3.26 4.00
Average score for: IT staff
are assigned tasks in the
lowest practical level in a
project management style
3.23 3.00
Average score for: IT staff
are consulted on all
decisions
3.10 2.86
Table 17: Organisational culture by management level

110
Figure 21: Organisational culture by management level
The Y axis is:
5 = Strongly Agree
4 = Agree
3 = Neutral
2 = Disagree
1 = Strongly Disagree
The X axis relates to the questions on organisational culture.
1
2
3
4
5
IT s
taff
are
led
by
a ch
aris
mat
ic a
nd
wel
lre
spec
ted
man
agem
ent
team
IT s
taff
ro
les
are
clea
rly
def
ined
an
dre
lati
on
ship
s ar
e a
lso
cle
arly
set
ou
t
IT s
taff
use
info
rmal
rel
atio
nsh
ips
and
ro
les
toge
t th
ings
do
ne
qu
icke
r an
d e
asie
r th
an u
sin
gth
e fo
rmal
ch
ann
els
IT s
taff
are
ass
ign
ed t
asks
in t
he
low
est
pra
ctic
al le
vel i
n a
pro
ject
man
agem
ent
styl
e
IT s
taff
are
co
nsu
lted
on
all
dec
isio
ns
Higher management
Middle Management

111
Discussion This graph highlights that the higher management levels believe there is an
autocratic power based culture with a charismatic leadership with elements of a
bureaucratic culture with relations oriented leadership. However if you look further
down the management ladder we see that middle management believe the
bureaucratic culture still exists but staff have to use informal relationships to get
tasks completed quickly and easily. So there does seem to be a distinct difference in
perception of organisational culture based on level within the hierarchy.
Conclusion The hypothesis is correct there is a difference in perception of organisational culture
across different levels of management.
Hypothesis 4B
Different types of institution will have different organisational cultures. Older more
traditional institutions will have a different organisational culture to newer more
modern institutions.
Test Two question sets were compared as detailed in the table below to compare
organisational cultures against institution type.
Question set one Question set
two
Question
number
Question 18 Question 5
Question title How accurate are
the following
descriptions of
your organisation?
Institution type

112
Result The table below shows the average score from each institution type for the different
organisational cultures using a Likert scale of:
5 = Strongly Agree
4 = Agree
3 = Neutral
2 = Disagree
1 = Strongly Disagree
Ancient
University
Red Brick
University
Plate
Glass
University
Post-1992
University
that was
not a
former
polytechnic
Post 1992
that was a
former
polytechnic
Post 2005
University Other
IT staff are led
by a
charismatic
and well
respected
management
team
4.00 3.50 3.20 3.40 4.00 4.00 4.00
IT staff roles
are clearly
defined and
relationships
are also
clearly set out
3.67 3.38 3.40 4.00 4.25 3.67 4.00
IT staff use
informal
relationships
and roles to
get things
done quicker
and easier
than using the
formal
channels
3.67 3.00 3.60 3.80 3.58 3.00 2.50
IT staff are
assigned
tasks in the
lowest
practical level
in a project
management
3.00 3.00 3.20 3.00 3.50 3.67 2.00

113
style
IT staff are
consulted on
all decisions
3.33 2.63 2.60 3.60 3.00 3.67 3.50
Table 18: Organisational culture by institution type

114
Figure 22: Organisational culture by institution type
1
2
3
4
5
An
cien
t U
niv
ersi
ty
Red
Bri
ck U
niv
ersi
ty
Pla
te G
lass
Un
iver
sity
Po
st-1
99
2 U
niv
ersi
ty t
hat
was
no
t a
form
er
po
lyte
chn
ic
Po
st 1
99
2 th
at w
as a
fo
rme
r p
oly
tech
nic
Po
st 2
00
5 U
niv
ersi
ty
Oth
er
Average score for: IT staffare led by a charismatic andwell respectedmanagement team
Average score for: IT staffroles are clearly defined andrelationships are also clearlyset out
Average score for: IT staffuse informal relationshipsand roles to get things donequicker and easier thanusing the formal channels
Average score for: IT staffare assigned tasks in thelowest practical level in aproject management style
Average score for: IT staffare consulted on alldecisions
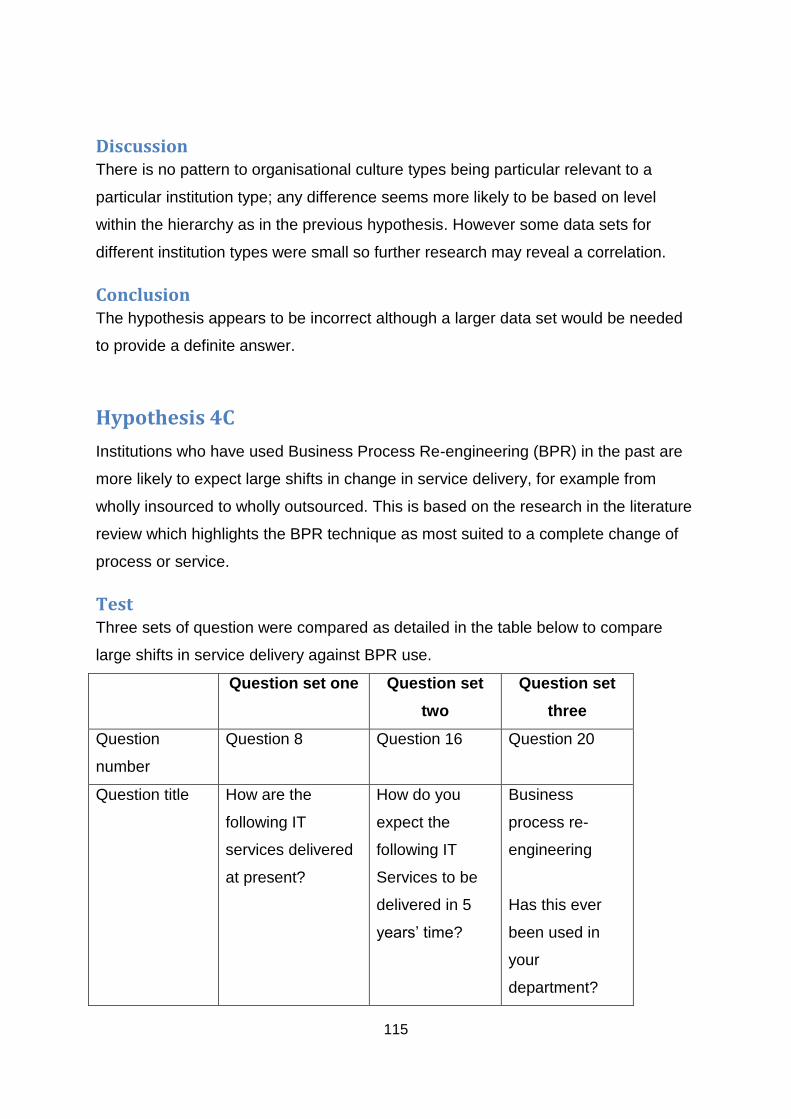
115
Discussion There is no pattern to organisational culture types being particular relevant to a
particular institution type; any difference seems more likely to be based on level
within the hierarchy as in the previous hypothesis. However some data sets for
different institution types were small so further research may reveal a correlation.
Conclusion The hypothesis appears to be incorrect although a larger data set would be needed
to provide a definite answer.
Hypothesis 4C
Institutions who have used Business Process Re-engineering (BPR) in the past are
more likely to expect large shifts in change in service delivery, for example from
wholly insourced to wholly outsourced. This is based on the research in the literature
review which highlights the BPR technique as most suited to a complete change of
process or service.
Test Three sets of question were compared as detailed in the table below to compare
large shifts in service delivery against BPR use.
Question set one Question set
two
Question set
three
Question
number
Question 8 Question 16 Question 20
Question title How are the
following IT
services delivered
at present?
How do you
expect the
following IT
Services to be
delivered in 5
years‟ time?
Business
process re-
engineering
Has this ever
been used in
your
department?

116
Results
The below table has a row for each institution ordered by the amount of BPR they
do, the question „Has Business process re-engineering ever been used in your
department?‟ uses the coded answers below:
1 = Yes often
2 = Yes sometimes
3 = Yes once or twice
4 = no
Has Business process re-engineering
ever been used in your department?
number of moves from wholly outsourced
to wholly insourced service delivery
1 7
1 0
1 4
1 3
1 0
1 2
1 0
1 0
1 3
1 2
1 0
1 0
2 0
2 0
2 0
2 3
2 0
2 1
2 0
2 0

117
2 0
2 8
2 2
2 0
3 0
3 0
3 0
4 1
4 0
4 2
4 4
4 0
4 5
4 0
4 2
4 2
4 4
4 0
Table 19: Business process reengineering by service delivery change
Has Business process re-
engineering ever been used
in your department?
Average number of moves from wholly
outsourced to wholly insourced service
delivery
Yes often 1.75
Yes sometimes 1.17
Yes once or twice 0.00
no 1.82
Table 20: Business process reengineering by average service delivery change

118
Figure 23: Business process reengineering by average service delivery change
Discussion The results could be improved with a larger data set, but the graph still shows that
institutions that do not use BPR are moving services from wholly insourced to wholly
outsourced just as much as those who do use it.
Conclusion The hypothesis is incorrect the use of BPR doesn‟t mean you are more or less likely
to consider moving a service from wholly insourced to wholly outsourced.
Hypothesis 4D
Institutions which use formal change management methodologies such as ITIL and
PRINCE2 are more likely to have used BPR than those who do not and as a result
are more likely to have successfully realised benefits more often.
Test Three sets of question sets were compared as detailed in the table below to
compare change management methodology use with BPR use referencing the
amount of successful benefits realisation.
00.20.40.60.8
11.21.41.61.8
2Ye
s o
ften
Yes
som
etim
es
Yes
on
ce o
r tw
ice
no
Average number of moves from wholly outsourced to wholly insourced service delivery
Average number ofmoves from whollyoutsourced to whollyinsourced servicedelivery

119
Question set one Question set
two
Question set
three
Question
number
Question 12 Question 19 Question 20
Question title To what extent are
benefits, in each of
the following
areas, successfully
realised from your
University's IT
projects?
Are you
currently using
any formal
methodologies
for change
management
(for example,
ITIL or
PRINCE2)?
Business
process re-
engineering
Has this ever
been used in
your
department?
Results
The table in Appendix D has a row for each institution
I have categorised the response to the change management methodologies question
into two groups, group one for those who answered Yes or Partly for using change
management methodologies (Group = Yes) and group two for those who as yet
haven‟t (Group = No).
I categorised the BPR responses into two groups, group one for those who
answered Yes or Yes Sometimes or Yes once or twice (Group = Yes) for using BPR
and group two for those who answered No (Group = No).
The table now looks like this:
Total benefits realised
Are you currently using
any formal
methodologies for
change management?
Has Business process
re-engineering ever
been used in your
department?
3.17 Yes No

120
3.00 Yes Yes
3.17 Yes Yes
3.58 No No
4.83 No No
3.08 Yes Yes
3.50 Yes Yes
3.33 Yes Yes
3.92 Yes Yes
3.75 Yes No
4.00 Yes Yes
4.25 Yes Yes
3.75 Yes Yes
3.42 Yes No
3.33 Yes Yes
3.42 Yes Yes
3.75 Yes No
3.58 Yes Yes
3.33 Yes Yes
4.00 Yes Yes
3.42 Yes Yes
3.08 Yes No
4.00 Yes Yes
2.17 Yes No
4.00 Yes Yes
3.33 Yes Yes
4.00 Yes Yes
3.09 Yes Yes
3.92 Yes Yes
2.92 Yes No
3.50 No No

121
3.36 Yes No
3.00 Yes Yes
3.33 Yes Yes
3.58 Yes Yes
3.25 Yes Yes
4.00 Yes Yes
2.75 Yes Yes
Table 21: Benefits realised by change methodology by business process
reengineering
Number of
Institutions
Average
score for
successful
benefits
realisation
Using change management methodologies to
some degree and have used BPR at least once 27 3.53
Using change management methodologies to
some degree and have not used BPR 8 3.20
Used BPR at least once but not using change
management methodologies to any degree 0 NA
Not using change management methodologies and
never used BRP 3 3.97
Table 22: Average score for benefits realised by change methodology by business
process reengineering
This shows that doing both change management methodologies and BPR does give
you a higher score on the average amount of successful benefits realisation than
only doing change management and not BPR. However the score for not doing
either is even higher although that group only consisted of three institutions.
The graph below shows the percentages of institutions who fall into each category:

122
Figure 24: Average score for benefits realised by change methodology by business
process reengineering
Discussion No institution uses BPR without doing some degree of formal change management
methodology; however the benefits realisation data is too small to draw conclusions
from.
Conclusion The hypothesis is partly correct, institutions which use BPR also use formal change
management methodologies, but without obtaining a larger data set it cannot be
proved that this increases successful benefits realisation.
71%
21%
0% 8%
Percentage of institutions in each category
Using change managementmethodologies to some degreeand have used BPR at least once
Using change managementmethodologies to some degreeand have not used BPR
Used BPR at least once but notusing change managementmethodologies to any degree
Not using change managementmethodologies and never usedBRP

123
Discussion and Conclusions
In overall terms, the survey evidence confirms some of the suppositions posited in
the hypotheses, but has produced some unanticipated responses in a number of
areas, particularly to do with the nature and extent of out-sourcing, the widespread
use of formal change management techniques and processes, and the uniformity of
trends across the spectrum of institutional types. Care should be taken with
interpreting some of the results, however, as without time-series data it is hard to
reach a definite conclusion about some aspects of the change process. The
following summarises the findings in relation to each of the principal hypotheses:
Hypothesis One: External factors will cause a change in strategic direction for
IT Departments – from service expansion to service improvement – and this
improvement will be sought in part through more external partnerships; all
types of HE institutions will experience this change.
The results confirm that expansion of services is not a current priority for most IT
Departments. This is not unexpected in the context of increasing financial restraint,
although one might have expected to see more emphasis upon expansion resulting
from technological development. Improving existing services has become a more
important priority than it used to be with most IT Departments, but the important point
to note here is that there has been relatively little change. It would seem reasonable
to assume that this is because service improvement is a process that has been
underway for some time now and is already well embedded into departmental
processes, but it is impossible to prove this without further time-series data.
Much the same can be said about the prioritisation of the environmental perspective.
Reducing carbon footprint does gain in importance as hypothesised, but not by as
much as anticipated. As with service improvement, it may well be the case that this
is because the concern is already being addressed.
As hypothesised, when examining future priorities over the next five years, utilising
more external resource will be given a higher priority than it has at present, and in-
house development of software and services is set to decline in importance.
Interestingly, the data relating to this part of the survey demonstrates very little
difference across all types of institution. This may seem counter-intuitive, given the

124
sample encompasses institutions ranging from internationally recognised, often well-
resourced research intensive Universities to those which are much more focussed
upon teaching and domestic student recruitment, and are often less well-resourced.
It suggests that the nature of the work involved is a much more important factor in
determining policies and procedures than the context in which the work is
undertaken. As we shall see, this uniformity across the institutional sector is found in
other areas of the results as well.
One important thread running throughout the results in this section is that the amount
of change anticipated by institutions is significantly less than hypothesised. Given the
many fundamental changes that have taken place in the resourcing arrangements
for Universities, combined with the inexorable rate of technological development in
the wider IT community, one might have expected to see significant changes either
taking place or being anticipated. Instead, the picture across the board is of IT
Departments continuing to prioritise their activities in much the same way as they
have over the recent past – with one exception, the move to out-sourcing.
Hypothesis Two: IT Departments will continue some in-house service delivery
and seek to make it more efficient, but the major change will be in an
expansion of out-sourcing; the greater the degree of change, the more likely it
is that institutions will attempt to both identify and target specific benefits, and
subsequently realise them.
As hypothesised, there is a significant shift in the ways services are expected to be
delivered over the next five years, with an almost unanimous move towards an
increase of outsourcing IT services across the board. Again, as hypothesised, some
services, especially those involving sensitive data such as Finance or HR, are
usually undertaken in-house. An unanticipated result, however, was that even these
services are anticipated to move at least partly into outsourcing. It may be that
institutions have developed more trust in the reliability of outsourcing, or it may be
just that financial considerations and cost-savings now outweigh any such possible
concerns. This would require further research.
The hypothesis was disproved on the linkage between amount of change
anticipated, and the use of benefits realisation techniques. The amount of expected
change does not correlate to the amount of benefits realisation undertaken - some

125
who expect a lot of change in the near future do undertake benefit realisation
exercises, but others who also expect a lot of change do not conduct much in the
way of a benefits realisation approach, and the same is true for those who expect
little change. Given the widespread use of formal change management
methodologies and benefits realisation across most institutions, this suggests that
most IT Departments have recognised the advantages of such formal project
planning, and undertake it regardless of the amount of change in their environment.
As with Hypothesis One, this finding again suggests that the nature of the work
involved is a much more important factor in determining policies and procedures
than the context in which the work is undertaken.
Overall, the change towards outsourcing has been much larger than expected
across all services. Levels of management do not have different perceptions of this
even though it was hypothesised that higher management would expect more, and
middle managers would expect less [due to their having a more hands on approach
with the day to day running of the systems and being more likely to know of reasons
- such as integrations with other systems - that they cannot be outsourced easily].
Once again, institution type also bears no relevance on amount of change expected,
disproving the hypothesis that older institutions might be expecting less change than
their newer counterparts.
Hypothesis Three: The use of change management methodologies increases
the chances of successful benefits realisation.
Unfortunately, the data does not provide a definitive answer. It suggests that there
could be a very slight decrease in the amount of benefits realised when not
implementing a formal change management methodology, but the sample size is too
small to be certain of this. This would require further time-series data on perceived
benefit realisation. What is interesting, however, is that BPR and change
management methodologies are inextricably linked – none of the institutions that
have undertaken a BPR process have done so without also using formal change
management methodologies such as those incorporated in ITIL and PRINCE2.
Hypothesis Four: perceptions of successful benefits realisation will differ
according to a person’s position in the organisational hierarchy.

126
This hypothesis was largely borne out by the data, but the effect is small.
Perceptions on the part of higher management and middle management are
different, with the former claiming that benefits realisation is undertaken to a greater
degree and with more success than their middle management colleagues think. The
sample set for middle management, however – some 7 out of 38 – is too small for
definitive judgements. In any future research, it would be important to secure more
responses from middle management, although it is gratifying that so many senior
managers did agree to complete this survey.

127
Conclusions 1. Despite significant changes in the external environment [both in terms of
resourcing and technological change], there is relatively little change
underway or anticipated in the strategies adopted by IT Departments,
apart from the continuing trend towards out-sourcing.
2. Utilising external resource, whether in the form of strategic partnerships or
complete out-sourcing, will continue to expand. There is also a decrease in
priority for developing services in house. The positive aspects of
outsourcing in the current economic climate are out weighing the
negatives.
3. Reducing carbon footprint is still an important priority; however,
improvement to services is still seen as a higher priority.
4. Management level or Institution type bears no relevance on strategic
priorities (either now or in five years), or on service delivery changes.
5. Services with largely physical aspects or services that contain more
sensitive data are less likely to be outsourced than other services – but
even here there is a clear trend towards out-sourcing.
6. There is a significant move towards outsourcing across all IT services, and
across all types of institution.
7. Benefits realisation is in regular use, even amongst those institutions who
expect the least amount of change.
8. Benefits can be successfully realised without being specifically targeted
9. It is probable (though not proven through data capture) that benefits
realisation is more successful in conjunction with change management
methodologies such as ITIL and PRINCE2.
10. Higher management are more likely to believe successful benefits
realisation is undertaken than middle management, but the differences
between the two sub-sets are small.

128
11. Perception of organisational culture is different throughout the
organisational hierarchy.
12. Institution types do not bear relevance on organisational cultures
13. Use of BPR doesn‟t mean an institution is more or less likely to consider
moving a service from wholly insourced to wholly outsourced.
14. No institution undertakes BPR without doing some degree of formal
change management methodology

129
Improvements to this research
This analysis could have been improved with more historical data, by taking
sample data five years ago to look further back, thus allowing more trend
analysis to be done.
Some questions and options for answers could have been clearer to lessen
the need for data cleaning which can induce errors.
Follow up contact could have been made with responders to find any missing
data.
Ideally, survey research could be undertaken in five-year intervals to get a
true representation of priorities and service delivery, rather than expected
ones.
Ideally, the survey could have been followed up with telephone interviews to
see what motivators are deemed to be affecting strategic priorities.
The questionnaire could have been piloted in institutions other than
Loughborough University. This might have addressed some problems
encountered with delineating job titles [reducing the „other‟ responses
received in this category. Scrutiny of other institution‟s strategic priorities via
their web sites did, however, enable a full list in the survey questions, so
additional trialling was not necessary for this important aspect.
Putting percentage values on Likert scales would have helped to highlight the
fact the options are equidistant from each other.
Data about forecasting for change could have been collected
Possibilities for further research
Investigate if projects are now led by technological change or potential
benefits
Investigate if organisations are using weighting systems on potential benefits
based on strategic priorities
Larger survey producing time-series data
Investigate why strategic priorities are static
Is benefits realisation done before making a decision to change? Or is it part
of the change process after it has already been decided?

130
Recommendations
Review strategic priorities regularly to keep in line with organisational level
strategies and also to be flexible to change.
Use strategic priorities to weight benefits to change in service delivery to
decide if they should be insourced, co-sourced or outsourced.
Use formal change management methodologies
Target benefits and measure to see if they are successfully realised
Use BPR when drastically changing an IT service delivery
Compare strategies with other institutions regardless of type
Ensure organisational culture is perceived the same throughout the hierarchy
of the institution
Collaborate with other organisations from both the public and private sector
for mutual benefits

131
References
Adler, Paul. (1989), “Assessing the Company‟s Technological Base”, Handbook of
Technology Management, G.H. Gaynor Edition.
Adler, Paul and Shenhar, Aaron. (1990), “Adapting Your Technological Base: The
Organizational Challenge”, Sloan Management Review, Vol.32, No.1, pp. 25 – 37.
Adler, Paul., McDonald, William and MacDonald, Fred. (1992), “Strategic
Management of Technical Functions”, Sloan Management Review, Vol. 33, No. 2,
pp. 19 – 37.
Allen, David. (1995), “Information systems strategy formation in Higher Education
Institutions”, Information Research, [Online], Vol. 1, No. 1, Available
http://InformationR.net/ir/1-1/paper3.html [Accessed 23rd August 2011]
Ahmad, Hartini., Fracis, Arthur and Zairi, Mohamed. (2007), “Business process
reengineering: critical success factors in higher education”, Business Process
Management Journal, Vol. 13, No. 3, pp. 451-469.
Andresen, Jan, et al. (2000), “A framework for measuring IT innovation benefits”,
ITcon, [Online], Vol. 5, pp. 57 – 72. Available http://www.itcon.org/2000/4/paper.pdf
[Accessed August 2011]
Ansoff, Igor. (1979), “Strategic Management”, London, Macmillan.
Ansoff, Igor. (1984), “Strategic Management of Technology”, The journal of business
strategy, pp. 28 – 39.
Archer, Richard and Bowker, Pauk. (1995), “BPR consulting: an evaluation
of the methods employed”, Business Process Re-engineering & Management
Journal, Vol. 1 No. 2, pp. 28-46.

132
Ashurst, Colin., Doherty, Neil and Peppard, Joe. (2008), “Improving the impact of IT
development projects: the benefits realization capability model”, European Journal of
Information Systems, No 17, pp. 352 – 370.
Ashurst, Colin and Doherty, Neil. (2003), “Towards the Formulation of a „Best
Practice‟ Framework for Benefits Realisation in IT Projects”, Journal of Information
Systems Evaluation, Vol. 6, No. 2, pp. 1 – 10.
Ashurst, Colin and Hodges, Julie. (2010) “Exploring Business Transformation: The
Challenges of Developing a Benefits Realization Capability”, Journal of Change
Management, Vol. 10, No. 2, pp. 217 – 237.
Barnett, R. (1992), “Improving Higher Education: Total Quality Care”, Open
University Press.
Bradley, Gerald. (2010), “Benefits Realisation Management, A practical guide to
achieving benefits through change”, Gower Publishing, 2nd Edition.
Brown, John, (2010). “Securing a sustainable future for higher education: An
independent review of higher education funding & student finance”, [Online]
Available http://www.bis.gov.uk/assets/biscore/corporate/docs/s/10-1208-securing-
sustainable-higher-education-browne-report.pdf [Accessed 10th November 2011].
Canic, Michael and McCarthy, Patrick. (2000), “Service Quality and Higher
Education Do Mix”. [Online] Available
http://www.vstate.info/finadmin/training/documents/ServiceandHigherEd.pdf
[Accessed 7th April 2011].
Cole, Gerald. (1996), “Management Theory and Practice”, Letts, 5th Edition.
Coughlan, Sean. (2011), “University applications for 2012 down 9%”, BBC News,
[Online] Available http://www.bbc.co.uk/news/education-15430180 [Accessed 24th
October 2011].

133
Coulson-Thomas, C. (1994), “Business Process Re-engineering: myth and reality”,
Kogan Page.
Couper, Mick., Tragott, Michael and Lamias, Mark. (2001), “Web Survey Design and
Administration”, [Online] Available http://poq.oxfordjournals.org/ [Accessed 9th
January 2011].
Davenport, Sally., Campbell-Hunt, Colin and Solomon, Julia. (2003), “The dynamics
of technology strategy: an exploratory study”, R&D Management, Vol. 33, No. 5, pp.
481 – 499.
Davenport, T H and Short, J E. (1990), “The new industrial engineering: information
technology and business process redesign”, Sloan Management Review, Summer,
pp. 11 - 27
Dillman, Don. (2000), “Mail and Internet Surveys: The Tailored Design Method”,
John Wiley & Sons, 2nd Edition.
Easterby-Smith, Mark., Thorpe, Richard and Jackson, Paul (2008), “Management
Research”, Sage Publications, 3rd Edition.
Farrant, John. (1984), “Information for management in higher education”, Aslib
Proceedings, November - December, pp. 415-418.
Fidler, Christine and Rogerson, Simon. (1996), “Strategic Management Support
Systems”, Pitman Publishing,
Foogooa, Ravi. (2008), “IS outsourcing – a strategic perspective”, Business Process
Management Journal, Vol. 14, No. 6, pp. 858-864.
Glynne, P. (2007), “Benefits management – changing the focus of delivery”,
Association for Progress Management Yearbook 2006/07, pp. 45-9.

134
Graham, I., Lloyd, A. D., Slack, R. S. and R. A. Williams (2000), "Uptake of BPR in
the UK" Precept Work Package 2: Social shaping of BPR uptake. Precept Working
No. 6.
Hall, D., Jones, R and Raffo, C.(2004), “Business studies”, Causeway Press Ltd.
Hammer, M and Champy, J. (1993), “Re-engineering the corporation – a manifesto
for business revolution”, Nicholas Brealey.
Hancox, Martin and Hackney, Ray. (2000), “IT outsourcing: frameworks for
conceptualizing practice and perception”, Info Systems, No. 10, pp. 217–237.
Hannagan,Tim. (1998), “Managemnt Conecpts and Practices”, F. T. Pitman
Publishing, 2nd Edition.
Harrington, Lisa. (1998), “Insourcing: smart move or overreaction?”, Transportation
and Distribution, May, pp. 108-13.
Harvey, D. (1995), “BPR – facing up to the truth”, Management consultancy, pp. 25-
30.
HEFCE (Higher Education Funding Council for England). (1998), “The Information
Systems and Technology Management Value for Money Study'”, [Online], Available
http://www.hefce.ac.uk/pubs/hefce/1998/98_42.htm [Accessed August 2011]
HEFCE (Higher Education Funding Council for England). (2011), “Shared services in
cloud computing to be funded by HEFCE”, [Online], Available
http://www.hefce.ac.uk/news/hefce/2011/cloud.htm [Accessed July 2011]
Hirschheim, R and Lacity, M. (2000), “The myths and realities of information
technology insourcing”, Communications of the ACM, Vol. 43, No. 2, pp. 99-107.

135
Hlupic, V., Choudire, J. and Patel, N. (2000),”Business Process Re-engineering
(BPR): The REBUS Approach” ”, [Online], Available http://v-
scheiner.brunel.ac.uk/bitstream/2438/4169/1/Fulltext.pdf [Accessed December 2011]
Jamieson, Susan. (2004), “Likert scales: how to (ab)use them”, Medical Education
38, no 12, Blackwell Science Ltd, pp. 1217-1218.
JISC, (2011)”The Transition Curve”, [Online], Available
http://www.jiscinfonet.ac.uk/infokits/change-management/transition-
management/transition-curve [Accessed 5th May 2011]
Jobber, D. (2001), “Principles and Practice of Marketing”, McGraw Hill, 2nd edition.
Johnson, Gerry and Scholes Kevan. (1989), “Exploring Corporate Strategy Text and
Cases”, Prentice Hall.
Kaplowitz, Michael., Hadlock, Timothy and Levine Ralph. (2004), “A Comparison of
Web and Mail Survey Response Rates”, Public Opinion Quarterly, Vol. 68, No. 1 Pp.
94–101.
Kotter, (2011). “The 8-Step Process for Leading Change” ”, [Online], Available
http://www.kotterinternational.com/kotterprinciples/changesteps [Accessed 9th May
2011]
Lacity, Mary., Willcocks, Leslie and Feeny, David. (1996), “The Value of Selective IT
Sourcing”, Sloan Management Review, pp. 13-25.
Lacity, Mary and Willcocks, Leslie. (1997), “Information systems sourcing: examining
the privatization option in USA public administration”, Information Systems Journal,
Vol. 7, pp. 85-108.
Leeds-Hurwitz, Wendy. (1995), “Social approaches to communication”, The Guilford
press.

136
Lin, Chad., Pervan Graham and McDermid, Donald. (2007), “Issues and
recommendations in evaluating and managing the benefits of public sector IS/IT
outsourcing” Information Technology & People, Vol. 20, No. 2, pp. 161-183
Lonsdale, Chris. and Cox, Andrew. (2000), “The historical development of
outsourcing: the latest fad?”, Industrial Management & Data Systems, Vol. 100 No.
9, pp. 444-50.
Loukis, E., Pazalos, K and Georgiou, St. (2009), “An empirical investigation of the
moderating effects of BPR and TQM on ICT business value”, Journal of Enterprise
Information Management, Vol. 22, No. 5, pp. 564-586.
Marshall, Stephen. (2010), “Change, technology and higher education: are
universities capable of organisational change?”, ALT-J, Vol. 18, No, 3. pp. 179- 192.
Medcof, John. (2000), “The Resource- Based View and Transnational Technology
Strategy”, The Journal of High Technology Management Research, Vol. 11, No. 1,
pp. 59–74.
Miles, Mathew and Huberman, Michael. (1994), “Qualitative Data Analysis” Sage
Publications, 2nd Edition.
Moore, Gordon. (1965), “Cramming More Components onto Integrated Circuits”,
Electronics, Vol. 38, No. 8, pp. 114-117.
Mullins, L. (2005), “Management and Organisational Behaviour”, F. T. Prentice Hall,
7th Edition.
Nicol, David and Coen, Michael. (2003), “A model for evaluating the institutional
costs and benefits of ICT initiatives in teaching and learning in higher education”, Alt-
j, Vol. 11, No. 2, pp. 46 – 60.

137
Oppenheim, A, N. (1970), “Questionnaire design and attitude measurement”,
Heinemann London.
Pearce, Shirley. (2005), “Loughborough University – Towards 2016”, [Online]
Available http://www.lboro.ac.uk/admin/policy/strategic_plan.pdf [Accessed April
2011].
Peppard, Joe and Ward, John. (2005), “Unlocking Sustained Business Value from IT
Investments”. California Mangement Review.
Prahalad, C.k and Hamel, Gary. (1990), “The Core Competence of the Corporation”,
Harvard Business Review, May – June, pp. 1 -16.
Ranchhod, Ashok and Zhou, Fan. (2001), “Comparing respondents of e-mail and
mail surveys: understanding the implications of technology”. Marketing Intelligence &
Planning, pp. 254 – 262.
Read, Malcolm. (2010), “Collaboration in Higher Education and Its Benefits for ICT”,
Educause Quarterly, Vol. 33, No. 1, pp. 1 – 4
Remenyi, Dan and Sherwood-smith, Michael. (1998), “Business benefits from
information systems through an active benefits realisation programme”, International
Journal of Project Management, Vol. 16, No 2, pp. 81 – 98.
Rudd, Colin and Lloyd, Vernon. (2007), “ITIL Service Design”, The Stationary Office.
Sapountzis, Stelios, Yates, Kathryn, Kagioglou, Mike and Aouad, Ghassan. (2008),
“Realising benefits in primary healthcare infrastructures”, Facilities, Vol. 27, No. 3/4,
pp. 74 – 87.
Schermerhorn, J. R. (2004), “Core Concepts of Management”, Wiley.

138
Secretary of State for Education. (2010), “The Importance of Teaching: The schools
white paper 2010”, [Online] Available http://www.official-documents.gov.uk/
[Accessed 4th March 2011].
Shih, Tse-Hua and Fan, Xitao. (2009), “Comparing response rates in e-mail and
paper surveys: A meta-analysis”, Science Direct, No. 4, pp. 26-40.
Swan, W A. (2008),”The Three Main Types of Data Collection Tools”, [Online]
Available,http://scienceray.com/technology/information/the-three-main-types-of-data-
collection-tools/ [Accessed 3rd December 2011]
Talwar, R. (1994), “Re-engineering – A wonder drug for the 90s?” , in Business
process re-engineering: myth and reality, Ed. C. Coulson-Thomas, Kogan Page
Thompson, John and Bekhradnia, Bahram. (2010), “The government's proposals for
higher education funding and student finance – an analysis”, [Online] Available
http://www.hepi.ac.uk/files/50%20Government%20proposals%20for%20HE%20fundi
ng%20full.pdf [Accessed January 2012]
Turner, Rodney. (2008), “Gower handbook of project management”, Gower, 4th
edition.
Wastell DG, White P and Kawalek. (1994), “A methodology for business process
redesign”, Vol 3, No 1, pp. 23-40.
Willcocks, Leslie and Willcocks, Feeny. (1997), “Managing IT as a Strategic
Resource” , McGraw-Hill, London.
Woods, M. (2003), “The politics of resource allocation in UK Universities and the
case for the introduction of internal markets”, Nottingham University Business
School.
Yeats, D and Cadle, J. (1996),”Project Management for Information Systems”,
Pitman publishing.

139
Zahra, Sahker and Bogner, William. (1999), “Technology Strategy and Software New
Ventures‟ Performance: Exploring the Moderating Effect of the Competitive
Environment”, Journal of Business Venturing, No 15, pp. 135 – 173.

140
Appendix
A) Interview with the Vice Chancellor of Loughborough University
1) Would you see improving current service quality as more important than widening services offered?
The University is not planning substantial changes in its range of activities, although
continuous development is important to remain current and relevant and it is always
looking for ways to improve the service it provides. This doesn‟t mean however that
the University will not take risks as sometimes you have to take risks to gain a
competitive advantage and to be innovative.
2) IT Services are entering into a strategic partnership with a private company Logicalis, are there any other existing strategic partnerships currently with private companies? And do you see the importance of these increasing in the next five years?
We expect Sponsorships/Partnerships to increase. Our strong partnerships with business,
industry and the professions are a competitive advantage and existing partners include BAE,
EON, Ford, JCB, Rolls Royce, Lotus, Caterpillar and many more.
3) Are any strategic partnerships with public organisations currently in place around the University? And do you see the importance of these increasing in the next five years?
We are planning on building more partnerships like the current one with Birmingham and
Nottingham, the Midlands Energy Consortium. We are currently in the early stages of a
partnership with Leicester University for purchasing together to save money. We are also
looking at sharing expensive equipment with local institutions such as Leicester, Nottingham
and Birmingham. This could be used, for example, for laboratory equipment.
4) How are staff likely to react to organisational change, with regard to the following stages?
a. Opposition - Openly against the change and direct and forceful in trying to
stop it b. Resistance - Less openly against the change and more passive in tactics to
delay or stop it c. Compliance - Will act in accordance to the change but still believe it is not the
best option so do so with minimal effort d. Acceptance - A high level of support where staff realise the benefits and will
work towards the change e. Commitment - Staff are committed to the change and fully believe in it and
work towards it with conviction and enthusiasm
The removal of Faculties and the move to Schools has given rise to lots of mixed reactions, and the Senate minutes reflect this. We set up a working group to help get people on board and I have personally chaired the Project Management Board and ensured strong staff

141
representation. As the project to move to Schools has progressed more staff are realising the benefits and becoming more and more committed to the change.
5) With regards to the change processes and the project to manage these processes
how much benefits realisation has been done? Are potential benefits explored? Are they checked they have been achieved? And are future benefits investigated and exploited to maximise them?
The project group has probably not done enough work on benefit realisations, but I would be very interested in the current work IT Services are doing to introduce monitoring these in a more structured way. We have however run a number of value-for-money projects with specific targets and with periodic reviews which do conform to the models of benefits realisation.
6) Rank these change motivators in order of importance for the next five years?
a. Legislative change b. Competitive change c. Efficiency Change d. Business Survival
They are all important, of course. Business survival is currently not an issue for
Loughborough University as we are in a strong position especially when compared to
other institutions. Competitive change is a challenge as in many areas
Loughborough University is very good, indeed in some areas world leading, whilst in
other areas we are not as good as all our competitors.
7) Do you use any forecasting techniques to predict changes in the market or legislation? If so what are they and how often are they carried out?
We research demographics and social classes. We pay particular attention to key
decision makers who can directly affect the University. We see forecasting as very
important to helping us plan and react to change.

142
B) Survey

143

144

145

146
C) Survey Results
3. Do you wish to receive an email of the results of my survey? (results will have personal information removed)
Yes:
100.0% 37
No:
0.0% 0
4. Job Title:
IT Services Director:
31.6% 12
Assistant Director:
15.8% 6
Team Manager:
2.6% 1
Project Manager:
2.6% 1
Service Manager:
2.6% 1
Other (please specify):
44.7% 17
View All Responses - There are too many responses to display on this page and so all the responses to this
question are available on a separate page.
5. Institution Type:
Ancient University:
7.9% 3
Red Brick University:
18.4% 7
Plate Glass University:
13.2% 5
Post-1992 University that
was a former polytechnic:
31.6% 12
Post-1992 University that
was not a former
polytechnic:
10.5% 4
Post 2005 University:
7.9% 3
Other (please specify):
10.5% 4
View All Responses - There are too many responses to display on this page and so all the responses to this
question are available on a separate page.

147
Section Two: Current Situation
6. In terms of the current strategy of your Department, please indicate the priority given to the following.
6.a. Adopting innovative technology
5) Very High Priority:
10.5% 4
4) High Priority:
31.6% 12
3) Medium Priority:
50.0% 19
2) Low Priority:
7.9% 3
1) Very Low Priority:
0.0% 0
6.b. Develop more software and services in house
5) Very High Priority:
0.0% 0
4) High Priority:
2.6% 1
3) Medium Priority:
34.2% 13
2) Low Priority:
36.8% 14
1) Very Low Priority:
26.3% 10
6.c. Expand existing services
5) Very High Priority:
7.9% 3
4) High Priority:
36.8% 14
3) Medium Priority:
52.6% 20
2) Low Priority:
2.6% 1
1) Very Low Priority:
0.0% 0
6.d. Improve efficiency
5) Very High Priority:
47.4% 18
4) High Priority:
42.1% 16
3) Medium Priority:
7.9% 3
2) Low Priority:
2.6% 1
1) Very Low Priority:
0.0% 0
6.e. Improve integration of services
5) Very High Priority:
41.7% 15
4) High Priority:
41.7% 15
3) Medium Priority:
16.7% 6
2) Low Priority:
0.0% 0

148
1) Very Low Priority:
0.0% 0
6.f. Improve service quality
5) Very High Priority:
54.1% 20
4) High Priority:
37.8% 14
3) Medium Priority:
8.1% 3
2) Low Priority:
0.0% 0
1) Very Low Priority:
0.0% 0
6.g. Reducing carbon footprint
5) Very High Priority:
13.2% 5
4) High Priority:
47.4% 18
3) Medium Priority:
26.3% 10
2) Low Priority:
13.2% 5
1) Very Low Priority:
0.0% 0
6.h. Strategic partnership with private companies
5) Very High Priority:
5.3% 2
4) High Priority:
10.5% 4
3) Medium Priority:
50.0% 19
2) Low Priority:
21.1% 8
1) Very Low Priority:
13.2% 5
6.i. Strategic partnership with public organisations
5) Very High Priority:
5.3% 2
4) High Priority:
15.8% 6
3) Medium Priority:
55.3% 21
2) Low Priority:
18.4% 7
1) Very Low Priority:
5.3% 2
6.j. Utilise more external resource
5) Very High Priority:
0.0% 0
4) High Priority:
34.2% 13
3) Medium Priority:
42.1% 16
2) Low Priority:
21.1% 8
1) Very Low Priority:
2.6% 1

149
6.k. Widen the service portfolio
5) Very High Priority:
5.3% 2
4) High Priority:
34.2% 13
3) Medium Priority:
50.0% 19
2) Low Priority:
10.5% 4
1) Very Low Priority:
0.0% 0
7. Further Comment
Submit - There are too many responses to display on this page and so all the responses to this question are
available on a separate page.
8. How are the following IT services delivered at present?
8.a. Datacentre physical hardware infrastructure
5) Wholly insourced:
65.8% 25
4) More insourced than
outsourced:
28.9% 11
3) Equally co-sourced:
2.6% 1
2) More outsourced than
insourced:
2.6% 1
1) Wholly outsourced:
0.0% 0
Not an IT service provided:
0.0% 0
8.b. Desktop hardware management
5) Wholly insourced:
73.7% 28
4) More insourced than
outsourced:
21.1% 8
3) Equally co-sourced:
0.0% 0
2) More outsourced than
insourced:
5.3% 2
1) Wholly outsourced:
0.0% 0
Not an IT service provided:
0.0% 0
8.c. Desktop software management

150
5) Wholly insourced:
81.6% 31
4) More insourced than
outsourced:
18.4% 7
3) Equally co-sourced:
0.0% 0
2) More outsourced than
insourced:
0.0% 0
1) Wholly outsourced:
0.0% 0
Not an IT service provided:
0.0% 0
8.d. Finance system
5) Wholly insourced:
65.8% 25
4) More insourced than
outsourced:
21.1% 8
3) Equally co-sourced:
2.6% 1
2) More outsourced than
insourced:
5.3% 2
1) Wholly outsourced:
2.6% 1
Not an IT service provided:
2.6% 1
8.e. High performance computing
5) Wholly insourced:
45.9% 17
4) More insourced than
outsourced:
2.7% 1
3) Equally co-sourced:
0.0% 0
2) More outsourced than
insourced:
2.7% 1
1) Wholly outsourced:
0.0% 0
Not an IT service provided:
48.6% 18
8.f. Human resources system
5) Wholly insourced:
71.1% 27
4) More insourced than
outsourced:
10.5% 4
3) Equally co-sourced:
2.6% 1
2) More outsourced than
insourced:
10.5% 4

151
1) Wholly outsourced:
2.6% 1
Not an IT service provided:
2.6% 1
8.g. Staff file store
5) Wholly insourced:
89.5% 34
4) More insourced than
outsourced:
7.9% 3
3) Equally co-sourced:
0.0% 0
2) More outsourced than
insourced:
2.6% 1
1) Wholly outsourced:
0.0% 0
Not an IT service provided:
0.0% 0
8.h. Student file store
5) Wholly insourced:
73.0% 27
4) More insourced than
outsourced:
16.2% 6
3) Equally co-sourced:
2.7% 1
2) More outsourced than
insourced:
8.1% 3
1) Wholly outsourced:
0.0% 0
Not an IT service provided:
0.0% 0
8.i. Staff e-mail and groupware
5) Wholly insourced:
73.7% 28
4) More insourced than
outsourced:
10.5% 4
3) Equally co-sourced:
0.0% 0
2) More outsourced than
insourced:
2.6% 1
1) Wholly outsourced:
13.2% 5
Not an IT service provided:
0.0% 0
8.j. Student e-mail and groupware
5) Wholly insourced:
37.8% 14
4) More insourced than
outsourced:
5.4% 2

152
3) Equally co-sourced:
0.0% 0
2) More outsourced than
insourced:
10.8% 4
1) Wholly outsourced:
45.9% 17
Not an IT service provided:
0.0% 0
8.k. Departmental/enterprise server hosting
5) Wholly insourced:
71.1% 27
4) More insourced than
outsourced:
26.3% 10
3) Equally co-sourced:
2.6% 1
2) More outsourced than
insourced:
0.0% 0
1) Wholly outsourced:
0.0% 0
Not an IT service provided:
0.0% 0
8.l. Networking service
5) Wholly insourced:
78.9% 30
4) More insourced than
outsourced:
15.8% 6
3) Equally co-sourced:
2.6% 1
2) More outsourced than
insourced:
2.6% 1
1) Wholly outsourced:
0.0% 0
Not an IT service provided:
0.0% 0
8.m. Service desk
5) Wholly insourced:
78.9% 30
4) More insourced than
outsourced:
21.1% 8
3) Equally co-sourced:
0.0% 0
2) More outsourced than
insourced:
0.0% 0
1) Wholly outsourced:
0.0% 0
Not an IT service provided:
0.0% 0
8.n. Student labs

153
5) Wholly insourced:
94.6% 35
4) More insourced than
outsourced:
5.4% 2
3) Equally co-sourced:
0.0% 0
2) More outsourced than
insourced:
0.0% 0
1) Wholly outsourced:
0.0% 0
Not an IT service provided:
0.0% 0
8.o. Server backup service
5) Wholly insourced:
73.7% 28
4) More insourced than
outsourced:
21.1% 8
3) Equally co-sourced:
0.0% 0
2) More outsourced than
insourced:
2.6% 1
1) Wholly outsourced:
2.6% 1
Not an IT service provided:
0.0% 0
8.p. Desktop backup service
5) Wholly insourced:
63.2% 24
4) More insourced than
outsourced:
7.9% 3
3) Equally co-sourced:
0.0% 0
2) More outsourced than
insourced:
0.0% 0
1) Wholly outsourced:
0.0% 0
Not an IT service provided:
28.9% 11
9. Further Comment
Submit - There are too many responses to display on this page and so all the responses to this question are
available on a separate page.

154
10. To what extent are your University's IT projects used to explicitly target the following types of benefit?
10.a. Improving system reliability, measurable by number of issues logged with the service desk
5) Always:
15.8% 6
4) Usually:
52.6% 20
3) Sometimes:
15.8% 6
2) Rarely:
10.5% 4
1) Never:
5.3% 2
10.b. Improving fix times for logged issues, measurable through service desk statistics
5) Always:
7.9% 3
4) Usually:
50.0% 19
3) Sometimes:
13.2% 5
2) Rarely:
26.3% 10
1) Never:
2.6% 1
10.c. Improving IT service availability, reducing planned and unplanned downtime
5) Always:
26.3% 10
4) Usually:
57.9% 22
3) Sometimes:
15.8% 6
2) Rarely:
0.0% 0
1) Never:
0.0% 0
10.d. Reducing environmental impact / carbon footprint
5) Always:
7.9% 3
4) Usually:
42.1% 16
3) Sometimes:
34.2% 13
2) Rarely:
15.8% 6
1) Never:
0.0% 0
10.e. Improving data security
5) Always:
13.2% 5
4) Usually:
44.7% 17
3) Sometimes:
39.5% 15
2) Rarely:
2.6% 1
1) Never:
0.0% 0

155
10.f. Reducing training needed, simplification and integration of systems
5) Always:
5.3% 2
4) Usually:
50.0% 19
3) Sometimes:
39.5% 15
2) Rarely:
5.3% 2
1) Never:
0.0% 0
10.g. Improving system performance, faster and more efficient systems
5) Always:
15.8% 6
4) Usually:
63.2% 24
3) Sometimes:
21.1% 8
2) Rarely:
0.0% 0
1) Never:
0.0% 0
10.h. Improvements to the efficiency and effectiveness of administrative processes
5) Always:
21.1% 8
4) Usually:
50.0% 19
3) Sometimes:
26.3% 10
2) Rarely:
2.6% 1
1) Never:
0.0% 0
10.i. Enhanced support for and access to research
5) Always:
10.5% 4
4) Usually:
10.5% 4
3) Sometimes:
57.9% 22
2) Rarely:
15.8% 6
1) Never:
5.3% 2
10.j. Improvements to managerial decision-making
5) Always:
7.9% 3
4) Usually:
39.5% 15
3) Sometimes:
42.1% 16
2) Rarely:
10.5% 4
1) Never:
0.0% 0
10.k. Improvements to the quality of teaching through e-learning initiatives

156
5) Always:
10.5% 4
4) Usually:
60.5% 23
3) Sometimes:
28.9% 11
2) Rarely:
0.0% 0
1) Never:
0.0% 0
10.l. Enhanced communications with existing and potential students
5) Always:
13.2% 5
4) Usually:
31.6% 12
3) Sometimes:
52.6% 20
2) Rarely:
2.6% 1
1) Never:
0.0% 0
11. Further Comment
View All Responses - There are too many responses to display on this page and so all the responses to this
question are available on a separate page.
12. To what extent are benefits, in each of the following areas, successfully realised from your University's IT
projects?
12.a. Improving system reliability, measurable by number of issues logged with the service desk
5) Always:
2.6% 1
4) Usually:
50.0% 19
3) Sometimes:
36.8% 14
2) Rarely:
7.9% 3
1) Never:
2.6% 1
12.b. Improving fix times for logged issues, measurable through service desk statistics
5) Always:
2.6% 1
4) Usually:
47.4% 18
3) Sometimes:
42.1% 16
2) Rarely:
7.9% 3
1) Never:
0.0% 0

157
12.c. Improving IT service availability, reducing planned and unplanned downtime
5) Always:
7.9% 3
4) Usually:
65.8% 25
3) Sometimes:
26.3% 10
2) Rarely:
0.0% 0
1) Never:
0.0% 0
12.d. Reducing Environmental impact / carbon footprint
5) Always:
10.5% 4
4) Usually:
36.8% 14
3) Sometimes:
39.5% 15
2) Rarely:
13.2% 5
1) Never:
0.0% 0
12.e. Improving data security
5) Always:
5.3% 2
4) Usually:
60.5% 23
3) Sometimes:
28.9% 11
2) Rarely:
5.3% 2
1) Never:
0.0% 0
12.f. Reducing training needed, simplification and integration of systems
5) Always:
0.0% 0
4) Usually:
37.8% 14
3) Sometimes:
54.1% 20
2) Rarely:
8.1% 3
1) Never:
0.0% 0
12.g. Improving system performance, faster and more efficient systems
5) Always:
7.9% 3
4) Usually:
55.3% 21
3) Sometimes:
34.2% 13
2) Rarely:
2.6% 1
1) Never:
0.0% 0
12.h. Improvements to the efficiency and effectiveness of administrative processes

158
5) Always:
7.9% 3
4) Usually:
47.4% 18
3) Sometimes:
36.8% 14
2) Rarely:
7.9% 3
1) Never:
0.0% 0
12.i. Enhanced support for and access to research
5) Always:
0.0% 0
4) Usually:
34.2% 13
3) Sometimes:
34.2% 13
2) Rarely:
26.3% 10
1) Never:
5.3% 2
12.j. Improvements to managerial decision-making
5) Always:
2.6% 1
4) Usually:
44.7% 17
3) Sometimes:
42.1% 16
2) Rarely:
10.5% 4
1) Never:
0.0% 0
12.k. Improvements to the quality of teaching through e-learning initiatives
5) Always:
2.6% 1
4) Usually:
71.1% 27
3) Sometimes:
23.7% 9
2) Rarely:
2.6% 1
1) Never:
0.0% 0
12.l. Enhanced communications with existing and potential students
5) Always:
2.7% 1
4) Usually:
48.6% 18
3) Sometimes:
48.6% 18
2) Rarely:
0.0% 0
1) Never:
0.0% 0
13. Further Comment

159
View All Responses - There are too many responses to display on this page and so all the responses to this
question are available on a separate page.
Section Three: The next five years
14. In terms of the strategy of your Department over the next five years, please indicate the priority given to the
following.
14.a. Adopting innovative technology
5) Very High Priority:
10.5% 4
4) High Priority:
39.5% 15
3) Medium Priority:
44.7% 17
2) Low Priority:
5.3% 2
1) Very Low Priority:
0.0% 0
14.b. Develop more software and services in house
5) Very High Priority:
0.0% 0
4) High Priority:
2.6% 1
3) Medium Priority:
26.3% 10
2) Low Priority:
39.5% 15
1) Very Low Priority:
31.6% 12
14.c. Expand existing services
5) Very High Priority:
5.3% 2
4) High Priority:
50.0% 19
3) Medium Priority:
42.1% 16
2) Low Priority:
2.6% 1
1) Very Low Priority:
0.0% 0
14.d. Improve efficiency
5) Very High Priority:
52.6% 20
4) High Priority:
47.4% 18
3) Medium Priority:
0.0% 0
2) Low Priority:
0.0% 0
1) Very Low Priority:
0.0% 0
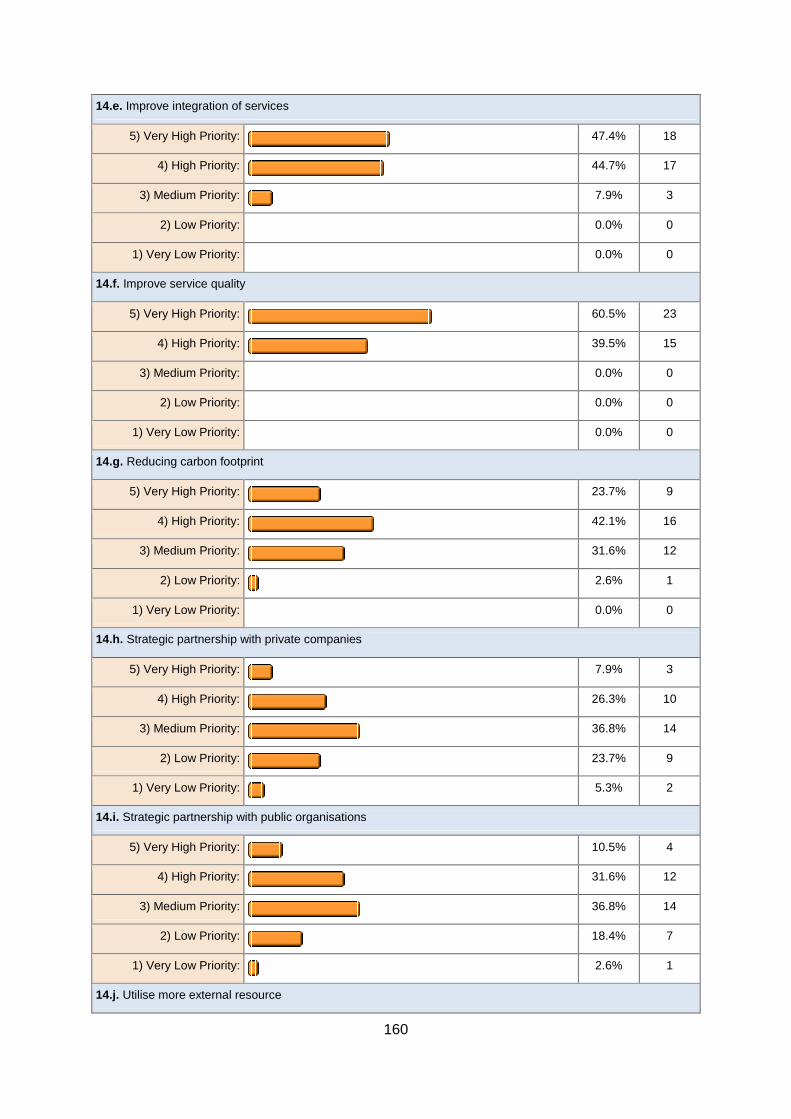
160
14.e. Improve integration of services
5) Very High Priority:
47.4% 18
4) High Priority:
44.7% 17
3) Medium Priority:
7.9% 3
2) Low Priority:
0.0% 0
1) Very Low Priority:
0.0% 0
14.f. Improve service quality
5) Very High Priority:
60.5% 23
4) High Priority:
39.5% 15
3) Medium Priority:
0.0% 0
2) Low Priority:
0.0% 0
1) Very Low Priority:
0.0% 0
14.g. Reducing carbon footprint
5) Very High Priority:
23.7% 9
4) High Priority:
42.1% 16
3) Medium Priority:
31.6% 12
2) Low Priority:
2.6% 1
1) Very Low Priority:
0.0% 0
14.h. Strategic partnership with private companies
5) Very High Priority:
7.9% 3
4) High Priority:
26.3% 10
3) Medium Priority:
36.8% 14
2) Low Priority:
23.7% 9
1) Very Low Priority:
5.3% 2
14.i. Strategic partnership with public organisations
5) Very High Priority:
10.5% 4
4) High Priority:
31.6% 12
3) Medium Priority:
36.8% 14
2) Low Priority:
18.4% 7
1) Very Low Priority:
2.6% 1
14.j. Utilise more external resource

161
5) Very High Priority:
21.1% 8
4) High Priority:
34.2% 13
3) Medium Priority:
28.9% 11
2) Low Priority:
13.2% 5
1) Very Low Priority:
2.6% 1
14.k. Widen the service portfolio
5) Very High Priority:
10.5% 4
4) High Priority:
47.4% 18
3) Medium Priority:
34.2% 13
2) Low Priority:
7.9% 3
1) Very Low Priority:
0.0% 0
15. Further Comment
I would like to differeniate software form services. We focus on adding value to a service. If that means buying off
the shelf we will.Our preference would be not to develop software in house. For example HR Finace and Help
desk all have bought in software but the processes to exploit it are done in house. Whereas Shareoint (though I
would hestiate to call it software) is developed in house to deliver intranet/extranet/VLE etc
See answer to Q7.
16. How do you expect the following IT Services to be delivered in 5 years time?
16.a. Datacentre physical hardware infrastructure
5) Wholly insourced:
7.9% 3
4) More insourced than
outsourced:
36.8% 14
3) Equally co-sourced:
28.9% 11
2) More outsourced than
insourced:
21.1% 8
1) Wholly outsourced:
5.3% 2
Not an IT service provided:
0.0% 0
16.b. Desktop hardware management
5) Wholly insourced:
5.3% 2
4) More insourced than
55.3% 21

162
outsourced:
3) Equally co-sourced:
7.9% 3
2) More outsourced than
insourced:
23.7% 9
1) Wholly outsourced:
7.9% 3
Not an IT service provided:
0.0% 0
16.c. Desktop software management
5) Wholly insourced:
7.9% 3
4) More insourced than
outsourced:
55.3% 21
3) Equally co-sourced:
13.2% 5
2) More outsourced than
insourced:
23.7% 9
1) Wholly outsourced:
0.0% 0
Not an IT service provided:
0.0% 0
16.d. Finance system
5) Wholly insourced:
21.1% 8
4) More insourced than
outsourced:
36.8% 14
3) Equally co-sourced:
15.8% 6
2) More outsourced than
insourced:
13.2% 5
1) Wholly outsourced:
10.5% 4
Not an IT service provided:
2.6% 1
16.e. High performance computing
5) Wholly insourced:
5.3% 2
4) More insourced than
outsourced:
13.2% 5
3) Equally co-sourced:
15.8% 6
2) More outsourced than
insourced:
13.2% 5
1) Wholly outsourced:
10.5% 4
Not an IT service provided:
42.1% 16

163
16.f. Human resources system
5) Wholly insourced:
13.2% 5
4) More insourced than
outsourced:
34.2% 13
3) Equally co-sourced:
15.8% 6
2) More outsourced than
insourced:
18.4% 7
1) Wholly outsourced:
15.8% 6
Not an IT service provided:
2.6% 1
16.g. Staff file store
5) Wholly insourced:
5.4% 2
4) More insourced than
outsourced:
35.1% 13
3) Equally co-sourced:
27.0% 10
2) More outsourced than
insourced:
21.6% 8
1) Wholly outsourced:
10.8% 4
Not an IT service provided:
0.0% 0
16.h. Student file store
5) Wholly insourced:
0.0% 0
4) More insourced than
outsourced:
13.2% 5
3) Equally co-sourced:
23.7% 9
2) More outsourced than
insourced:
23.7% 9
1) Wholly outsourced:
39.5% 15
Not an IT service provided:
0.0% 0
16.i. Staff e-mail and groupware
5) Wholly insourced:
5.3% 2
4) More insourced than
outsourced:
21.1% 8
3) Equally co-sourced:
7.9% 3
2) More outsourced than
18.4% 7

164
insourced:
1) Wholly outsourced:
47.4% 18
Not an IT service provided:
0.0% 0
16.j. Student e-mail and groupware
5) Wholly insourced:
0.0% 0
4) More insourced than
outsourced:
2.7% 1
3) Equally co-sourced:
2.7% 1
2) More outsourced than
insourced:
10.8% 4
1) Wholly outsourced:
83.8% 31
Not an IT service provided:
0.0% 0
16.k. Departmental/enterprise server hosting
5) Wholly insourced:
2.6% 1
4) More insourced than
outsourced:
34.2% 13
3) Equally co-sourced:
34.2% 13
2) More outsourced than
insourced:
21.1% 8
1) Wholly outsourced:
7.9% 3
Not an IT service provided:
0.0% 0
16.l. Networking service
5) Wholly insourced:
26.3% 10
4) More insourced than
outsourced:
36.8% 14
3) Equally co-sourced:
18.4% 7
2) More outsourced than
insourced:
15.8% 6
1) Wholly outsourced:
2.6% 1
Not an IT service provided:
0.0% 0
16.m. Service desk
5) Wholly insourced:
18.4% 7
4) More insourced than
52.6% 20

165
outsourced:
3) Equally co-sourced:
26.3% 10
2) More outsourced than
insourced:
2.6% 1
1) Wholly outsourced:
0.0% 0
Not an IT service provided:
0.0% 0
16.n. Student labs
5) Wholly insourced:
39.5% 15
4) More insourced than
outsourced:
44.7% 17
3) Equally co-sourced:
7.9% 3
2) More outsourced than
insourced:
5.3% 2
1) Wholly outsourced:
0.0% 0
Not an IT service provided:
2.6% 1
16.o. Server backup service
5) Wholly insourced:
7.9% 3
4) More insourced than
outsourced:
42.1% 16
3) Equally co-sourced:
18.4% 7
2) More outsourced than
insourced:
18.4% 7
1) Wholly outsourced:
13.2% 5
Not an IT service provided:
0.0% 0
16.p. Desktop backup service
5) Wholly insourced:
2.6% 1
4) More insourced than
outsourced:
31.6% 12
3) Equally co-sourced:
15.8% 6
2) More outsourced than
insourced:
23.7% 9
1) Wholly outsourced:
7.9% 3
Not an IT service provided:
18.4% 7

166
17. Further Comment
Shared services has a part to play so I have assumed this aligns with wider context of outsourced Ditto public
and private cloud.
This is a pretty vague as there is no overall, communicated strategy on outsourcing - it is a bit piecemeal at the
moment.
Section Four: Change Management
18. How accurate are the following descriptions of your organisation?
18.a. IT staff are led by a charismatic and well respected management team
5) Strongly Agree:
13.2% 5
4) Agree:
55.3% 21
3) Neutral:
23.7% 9
2) Disagree:
5.3% 2
1) Strongly Disagree:
2.6% 1
18.b. IT staff roles are clearly defined and relationships are also clearly set out
5) Strongly Agree:
18.4% 7
4) Agree:
57.9% 22
3) Neutral:
13.2% 5
2) Disagree:
7.9% 3
1) Strongly Disagree:
2.6% 1
18.c. IT staff use informal relationships and roles to get things done quicker and easier than using the formal
channels
5) Strongly Agree:
13.2% 5
4) Agree:
34.2% 13
3) Neutral:
34.2% 13
2) Disagree:
15.8% 6
1) Strongly Disagree:
2.6% 1
18.d. IT staff are assigned tasks in the lowest practical level in a project management style
5) Strongly Agree:
2.6% 1
4) Agree:
28.9% 11

167
3) Neutral:
55.3% 21
2) Disagree:
10.5% 4
1) Strongly Disagree:
2.6% 1
18.e. IT staff are consulted on all decisions
5) Strongly Agree:
5.3% 2
4) Agree:
31.6% 12
3) Neutral:
31.6% 12
2) Disagree:
26.3% 10
1) Strongly Disagree:
5.3% 2
19. Are you currently using any formal methodologies for change management (for example, ITIL or PRINCE2)?
Yes:
63.2% 24
Partly:
28.9% 11
Not yet but planning to:
5.3% 2
No:
2.6% 1
Don't Know:
0.0% 0
19.a. If so, what are you using?
View All Responses - There are too many responses to display on this page and so all the responses to this
question are available on a separate page.
20. Business process re-engineering To re-engineer a business process is to completely rethink the way it works
from beginning to end, question everything from a customer perspective and from an internal efficiency
perspective; it is about being innovative and requires lateral thinking 'outside of the box'. Has this ever been used
in your department?
Yes often:
31.6% 12
Yes sometimes:
31.6% 12
Yes once or twice:
7.9% 3
No:
28.9% 11
20.a. If Yes can you give an example?
View All Responses - There are too many responses to display on this page and so all the responses to this

168
question are available on a separate page.
21. If you have used business process engineering would you use it again?
Yes:
92.3% 24
No:
0.0% 0
Other (please specify):
7.7% 2
Not in the short trerm because it involves a huge amount of unproductive effort. It also unsettles staff.
Not yet used.

169
D) Results Table
Total benefits realised
Are you currently using
any formal
methodologies for
change management?
Business process re-
engineering
Has this ever been used
in your department?
3.17 1 4
3.00 1 2
3.17 2 2
3.58 4 4
4.83 3 4
3.08 1 2
3.50 1 1
3.33 1 1
3.92 1 1
3.75 2 4
4.00 2 2
4.25 1 1
3.75 2 2
3.42 1 4
3.33 1 1
3.42 1 1
3.75 2 4
3.58 1 2
3.33 1 3
4.00 1 1
3.42 1 2
3.08 2 4
4.00 1 1
2.17 1 4
4.00 2 2
3.33 1 1
4.00 1 1
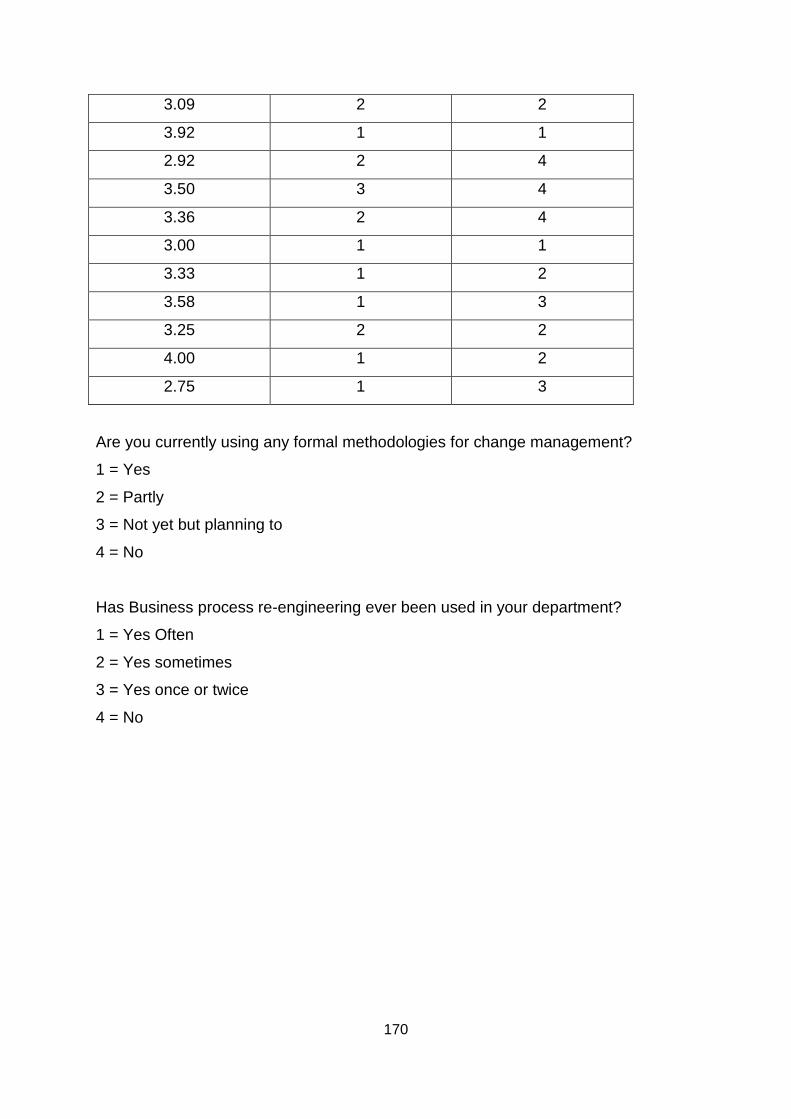
170
3.09 2 2
3.92 1 1
2.92 2 4
3.50 3 4
3.36 2 4
3.00 1 1
3.33 1 2
3.58 1 3
3.25 2 2
4.00 1 2
2.75 1 3
Are you currently using any formal methodologies for change management?
1 = Yes
2 = Partly
3 = Not yet but planning to
4 = No
Has Business process re-engineering ever been used in your department?
1 = Yes Often
2 = Yes sometimes
3 = Yes once or twice
4 = No