Changing patterns in cytoskeletal mRNAexpressionandprotein ...
Changing governance patterns in
European food chains: the rise of a
new divide between global players and
regional producers1*
Florence Palpacuer and Selma Tozanli2**
This article traces general trends in European food markets and theThis article traces general trends in European food markets and thestrategies of leading firms in selected European food chains (milk, sugar,strategies of leading firms in selected European food chains (milk, sugar,cereals, meat). The analysis highlights the emergence of a growing dividecereals, meat). The analysis highlights the emergence of a growing dividebetween the largest downstream firms on the one hand and specialty and between the largest downstream firms on the one hand and specialty and upstream producers on the other. The former have adopted globalizationupstream producers on the other. The former have adopted globalizationand financialization strategies over the past decade and promoted globaland financialization strategies over the past decade and promoted globalsourcing under the deregulated conditions of European primary food sourcing under the deregulated conditions of European primary food and agricultural markets while the latter remain anchored in national or and agricultural markets while the latter remain anchored in national or regional markets and production systems. Implications of these findingsregional markets and production systems. Implications of these findingsfor both Global Value Chain (GVC) analysis and European policy arefor both Global Value Chain (GVC) analysis and European policy arediscussed.discussed.
Key words: Global Value Chains, Europe, CAP reform, food industry
Introduction
European food industries have historically been characterized bysignificant public intervention in regulating agriculture and food production.Building on national agricultural policies launched after World War II, theEuropean Common Agricultural Policy (CAP) established detailed schemesof a Common Market Organisation (CMO) in agricultural and food industriesduring the 1960s, including various forms of price support, productionincentives and market protection, with the objectives of achieving self-
* This article is based on the authors’ contribution to the report “Study on Competition and Concentration in the Agro-food Sector,” Aragrande, M (coord.), Dipartimento di Economiae Ingegneria Agrarie (DEIA) Universita degli Studi di Bologna, prepared for the EuropeanCommission, July, 2003. The authors wish to thank two anonymous reviewers for supportive and useful comments on the theoretical implications of empirical results presented in this article.
** Florence Palpacuer is at University of Montpellier I, France. E-mail: [email protected]. Selma Tozanli (corresponding author) is at Centre International des Hautes EtudesAgronomiques, Institut Agronomique Méditerranéen de Montpellier, France. E-mail: [email protected].

sufficiency in agricultural and food supply and ensuring stable incomefor European farmers. The CAP entered into a phase of crisis in themid-1980s, when it continued to stimulate production increases inthe context of stagnating demand both within and outside Europeanmarkets, thus generating huge stocks of unsold agricultural products.In the face of rising liberal doctrines in the international political arena,and the need to control skyrocketing budget expenditures, the EEC – and subsequently the EU – implemented a series of major reforms in 1992,2000 and 2003, with the objective of reintroducing market forces to theEuropean agricultural and food production system. In 2006, a further set of reforms were introduced aimed at the sugar industry an industry that had remained largely untouched by previous regulatory changesthanks to the strong lobbying capacity of European sugar producers and upstream beet-producing farmers.
The guiding principles of these reforms have been the paradigmof free competition according to which economic welfare is enhanced bymarket liberalization. While European agri-food producers would losethe rents generated by the traditional system of market regulation – or at least part of these rents affected by liberalization policies – and a number of them would be pushed out of the market, deregulation was considered to benefit consumers and tax-payers – who supported agricultural rentseither directly through public subsidies or indirectly through higher retailprices for food products – together with foreign competitors who would gain greater access to the European market. Major agricultural exportingcountries, including members of the Cairns Group1, were expected to become the main beneficiaries of the liberalization of European marketsand had an influential voice in the agricultural reform debate at the World Trade Organisation over the 1990s and early 2000s. Agricultural reformswere also considered to advantage food producers operating in thedownstream segment of European agri-food chains by allowing greater market choice in their sourcing of agricultural and primary processed inputs. However, they met strong resistance from upstream producers,particularly in the sugar industry where the European Association of Sugar Producers sought to preserve CAP protection on account of thelower environmental, social and product quality standards adopted bylarge competitors such as Brazil, and of losses incurred by Europeansugar producers if global competitive forces were to be unleashed in theindustry.
1 The Cairns Group was formed in 1986 and now includes 17 countries from Latin
70 Transnational Corporations, Vol. 17, No. 1 (April 2008)

This article aims to shed light on such conflicting positions in theCAP reform debate by using a Global Value Chain (GVC) perspective toanalyze changes in the competitive dynamics and governance patternsof selected European food chains from the late 1980s to the early2000s. As laid out in the seminal work of Gereffi (1994), the earlier GVC analysis identified large branded firms and retailers in the Westernhemisphere as key players – “lead firms” – in the deployment and continuous redeployment of production systems involving networks of affiliates and suppliers on a world scale.2 It is thus from the perspectiveof major European firms, including large brand firms but also primaryprocessing producers, that changes in the governance of European food chains will be analyzed in this article. Our study focuses on productsand firms belonging to the meat, cereals, sugar and milk chains,3 and draws on databases on food markets (Food for Thought) and food transnational corporations (TNCs) (Agrodata), as well as interviewsconducted with European industry associations and leading food TNCsin 2002 2003 (see appendix 1). First, we highlight the emergence of a new type of “global” food products on European markets, and therising heterogeneity of product/market strategies adopted by major food producers in Europe. Second, we identify a new divide between globalplayers on the one hand, i.e. the largest firms operating downstreamEuropean food chains (secondary processing), and regional producers onthe other, including both upstream producers (primary processing) and specialty downstream firms. We differentiate the two camps on the basisof a typology characterizing the ownership structure, chain position,market, production and sourcing strategies of leading TNCs in our selected European food chains. The theoretical and policy implicationsof these empirical results are discussed in light of recent advances in thesocio-economic literature on GVCs and current orientations in EU food and agricultural reforms.
2
adopted a Global Value Chain (GVC) terminology in subsequent publications including
3 The choice of chains studied was made by the European Commission, for whichthis research was undertaken, on the basis of selected product categories: (i) sugar, soft drinks and confectionaries in the sugar chain, (ii) butter, cheese and ice cream in the milk
beef, pork, poultry, delicatessen and frozen prepared meat in the meat chain.
Transnational Corporations, Vol. 17, No. 1 (April 2008) 71

1. Downstream European food chains: the rise of global market strategies
The analysis of market trends and market concentration ratiosallowed us to establish a distinction between “global” products developed and marketed by large TNCs, and “local” or “generic” products belongingto less concentrated industry segments (subsection 1.1). Focusing onthe top 22 largest producers in our selected European food chains, wecomputed a globalization index showing the rise of global downstreamfirms since the late 1980s, and the persistence of regional strategiesfor firms involved in specialty as well as generic, primary processingproduction (subsection 1.2).
1.1 “Global” versus “local” and “generic” products
In consumer markets, food is certainly one of the most location-specific products, anchored in life styles, customs and habits developed over time, as well as the level of development. Inside Europe, strongdifferences persist between countries; for example, the share of food expenditures in the household budget is twice as large in Portugal
4 Nevertheless, homogeneousconsumption patterns are beginning to emerge in world markets, acrosscountries and macro regions, resulting in the rise of high-growth “global”product segments. A.C. Nielsen (2002) found that seven product categories were exhibiting growth rates of 10% or more in 2001 in themajority of the 47 countries under study. With the exception of alcoholicbeverages, these products are related to the consumers’ preferences for health (dairy products, light and vitamin-enhanced products), ease of use, innovation and sophistication (prepared meals, bottled waters).Similar trends could be observed in the six main European food marketsover the 1990s for products in the milk, meat, cereals and sugar chains(table 1).
While food consumption grew at the average annual rate of 3%in these markets, most product categories exhibiting superior growthrates in table 1 have the characteristics of sophistication (soft drinks,chewing gum), newness (bread spread), ease of use (prepared meals,melted cheese), health (artificial sweetener) or fitness (energetic sweetsin sugar confectionary) all associated with key consumption trends inthe emerging global segment of the world food market. By contrast, themajority of product categories exhibiting sales growth rates below 3%
4 Eurostat, 2000, http://europa.eu.int/comm/eurostat.
72 Transnational Corporations, Vol. 17, No. 1 (April 2008)

were either “generic” products such as flour, sugar, butter and meat, or “local” specialty products such as natural cheese, both incorporated intotraditional consumption patterns. A few low-growth products (savouryand sweet biscuits, ice cream) have also been partly touched by globaltrends as these can cut across traditional products categories. For instance,the practice of “snacking” affects ice creams, biscuits as well as sugar confectionaries that might be sold under the same brand, such as Mars,in the global product segment. As a consequence, a given food categorysuch as ice cream might include both highly sophisticated products,such as those developed and marketed by Unilever, and traditional, localproducts such as the Italian craft-produced ice cream. Overall, applyingthe Fisher’s exact test of independence to our 20 product categories shows that the association between products’ sales growth rate and their
Table 1. Retail sales of selected food products in six EU countries*
(Millions of euros)
Product 1991 2001Average annual
growth rate (%)
Artificial sweetenersArtificial sweeteners 242242 13,713,7
Chewing gumChewing gum 1 1611 161 2 2672 267
Delicatessen productsDelicatessen products 18 04818 048 7,77,7
Dairy spreadsDairy spreads 272272 428428
Soft drinksSoft drinks 13 44113 441
Frozen convenience meatFrozen convenience meat 4 2784 278 6 0206 020 4,14,1
Sugar confectionerySugar confectionery 6 7816 781 9 4169 416 3,93,9
Melted cheeseMelted cheese 2 1612 161 2 9272 927
PoultryPoultry 3,23,2
Average annual growth rate of food consumption expenditures**Average annual growth rate of food consumption expenditures** 3,03,0
Savoury biscuitsSavoury biscuits 866866 1 0731 073 2,42,4
Bread productsBread products 32 13232 132 2,02,0
Sweet biscuitsSweet biscuits 7 3777 377 8 7628 762 1,91,9
Natural cheeseNatural cheese 26 21226 212 1,91,9
PorkPork 36 28936 289 1,71,7
Dry pastaDry pasta 3 6413 641 3 9473 947 0,80,8
FlourFlour 0,80,8
Ice creamIce cream 10 40110 401 0,80,8
ButterButter -0,3-0,3
SugarSugar 2 9612 961 2 7232 723 -0,8-0,8
BeefBeef 41 71941 719 30 37130 371 - 3,1- 3,1
Source: Authors’ calculations based on data provided by Food For Thought, 2003, Geneva.
* Belgium-Luxembourg, France, Germany, Italy, Spain, United Kingdom
** Calculation based on data from Euromonitor for 1990 and 2000 (local currencies and current prices).
Transnational Corporations, Vol. 17, No. 1 (April 2008) 73

characteristics (i.e. global versus generic or local) is significant with a P value of 0.032.
Table 2 provides additional information on these emerging market features by distinguishing four types of products on the European market:branded, private label, specialty and generic products. The ranking of products according to the concentration ratios in the European markets,i.e. the market share of top four producers (CR4), shows that “global”products such as chewing gums, artificial sweeteners, and soft drinks
“generic” and “local” products such as bread, flour, butter, meat, and natural cheese, for which CR4 ratios are in the range of 12% to 30%.6
As discussed further in the next section, high concentration ratios inthe “global” product segment stem from the leading market positionsoccupied by large TNCs, such as Wrigley in chewing gum, Coca Cola,PepsiCo and Cadbury Schweppes in soft drinks, and Unilever and Nestléin ice cream, which have developed a capacity to sell their branded products on several major European markets. A few large retailers havealso set up sourcing and distribution systems at the European level withthese transnational producers, thus contributing to promote the diffusionof their global products across Europe (Rabobank, 2001). Accordingly,large branded producers are emerging as major lead firms in the “global”segment of the European food market.
The market shares of leading producers of local and genericproducts have not reached such a European scale. Interestingly, table 2shows that private labels tend to be more important, with market sharesof 20% or more, for generic products, such as butter, flour and bread,than for most global-type product categories, while meat continues tobe predominantly sold without branded labels. Lead firms appear tobe emerging here in the retail segment, rather than manufacturing, of European food chains. Retail concentration has indeed doubled in Europeduring the 1990s, from a top five retailers’ market share of 13% in 1990
The Fisher’s exact test is used to calculate an exact probability value of the relationship between two dichotomous variables, as found in a two by two cross-table. It works in the same way as the Chi-square test for independence, but can be used when
used here can be found at http://home.clara.net/sisa. 6
concentration levels and average annual sales growth rate (above or below 3%) is
74 Transnational Corporations, Vol. 17, No. 1 (April 2008)

to 26% in 2000,7 although it remained much higher in Northern Europethan in Southern Europe so that on average, retail concentration did not come near the level in the most concentrated segments of manufacturingin European food chains. With the exception of Carrefour, most retailershad not reached leadership positions in a significant number of nationalmarkets in Europe by the early 2000s. However, retailers’ buyingpower within the chain was strengthened by a growing centralization of sourcing. For instance, the top six central buying offices accounted for as
8 Dominant players in European food chains could thus be identified as either major producers in the caseof branded products, or large retailers for generic products sold under
7
8 Institut de Liaison et d’Etudes des Industries de la Consommation, 2000.
Table 2. Market share of top four producers (CR4), retailers’ private
labels, craft production, and no-label products in Western Europe*,
December 2001
Products CR4(%)
Private label(%)
Craftproduction
(%)( )( )( )
No-label products(%)
Chewing-gumChewing-gum 75.875.8 1.61.6Savoury biscuitsSavoury biscuits 68,568,5 20.120.1Articifial sweetenersArticifial sweeteners 66.066.0 12.612.6Soft drinksSoft drinks 64.064.0 15.715.7Ice creamIce cream 58.358.3 14.714.7 11.211.2Dairy spreadsDairy spreads 56.356.3 8.88.8Melted cheeseMelted cheese 54.354.3 12.612.6Sweet biscuitsSweet biscuits 47.947.9 22.422.4 0.30.3SugarSugar 41.741.7 15.915.9Dry pastaDry pasta 38.238.2 23.723.7 2.42.4Sugar confectionerySugar confectionery 35.135.1 14.714.7 0.10.1 0.20.2Frozen prepared meatFrozen prepared meat 31.231.2 19.719.7 1.11.1Natural cheeseNatural cheese 30.130.1 16.716.7 1.01.0 1.81.8DelicatessenDelicatessen 26.126.1 20.420.4 15.115.1 13.413.4ButterButter 26.526.5 21.221.2 3.13.1FlourFlour 25.625.6 32.132.1 9.79.7BeefBeef 19.419.4 15.215.2 69.169.1PoultryPoultry 18.118.1 14.814.8 31.931.9PorkPork 14.014.0 10.310.3 69.669.6BreadBread 12.112.1 22.722.7 53.653.6
Source: Food for Thought, 2003, Geneva.
Notes : Craft production is defined as direct sales from producer to consumer (e.g. bakeries,delicatessen). No-label products are low-cost generic products sold without any branding
* EU15, Switzerland and Norway.
Transnational Corporations, Vol. 17, No. 1 (April 2008)
private labels. For other types of products, leadership in European food chains remained much more dispersed.
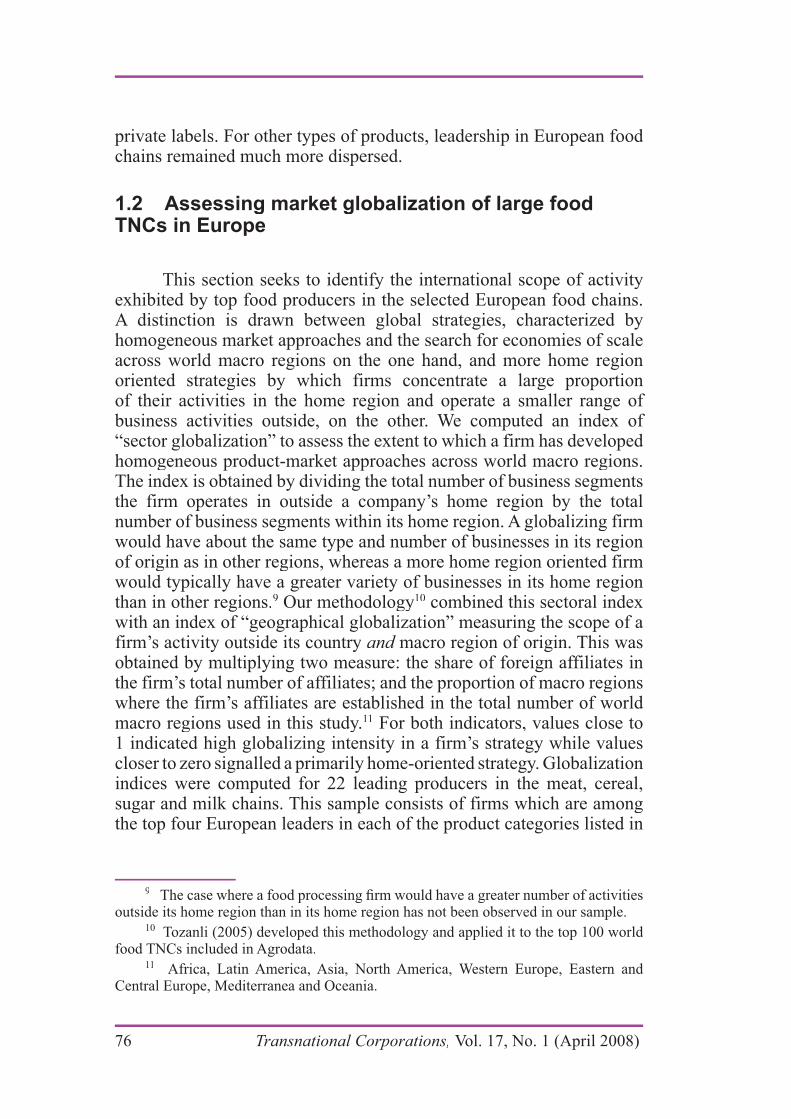
1.2 Assessing market globalization of large foodTNCs in Europe
This section seeks to identify the international scope of activityexhibited by top food producers in the selected European food chains.A distinction is drawn between global strategies, characterized by homogeneous market approaches and the search for economies of scaleacross world macro regions on the one hand, and more home regionoriented strategies by which firms concentrate a large proportionof their activities in the home region and operate a smaller range of business activities outside, on the other. We computed an index of “sector globalization” to assess the extent to which a firm has developed homogeneous product-market approaches across world macro regions.The index is obtained by dividing the total number of business segmentsthe firm operates in outside a company’s home region by the totalnumber of business segments within its home region. A globalizing firmwould have about the same type and number of businesses in its regionof origin as in other regions, whereas a more home region oriented firmwould typically have a greater variety of businesses in its home regionthan in other regions.9 Our methodology10 combined this sectoral indexwith an index of “geographical globalization” measuring the scope of afirm’s activity outside its country and macro region of origin. This wasdobtained by multiplying two measure: the share of foreign affiliates inthe firm’s total number of affiliates; and the proportion of macro regionswhere the firm’s affiliates are established in the total number of world macro regions used in this study.11 For both indicators, values close to1 indicated high globalizing intensity in a firm’s strategy while valuescloser to zero signalled a primarily home-oriented strategy. Globalizationindices were computed for 22 leading producers in the meat, cereal,sugar and milk chains. This sample consists of firms which are amongthe top four European leaders in each of the product categories listed in
9
outside its home region than in its home region has not been observed in our sample.10
food TNCs included in Agrodata.11 Africa, Latin America, Asia, North America, Western Europe, Eastern and
Central Europe, Mediterranea and Oceania.
76 Transnational Corporations, Vol. 17, No. 1 (April 2008)

table 2, and belong to the world top 100 Agrodata database in 2002.12
Appendix 2 provides information on the country of origin, type of chain position, majority ownership, product portfolio, total sales and geographical scope of these 22 firms, while appendix 3 provides valuesfor the computed globalization indices. Figures 1 and 2 indicate their degree of globalization in 1988 and 2002 respectively. Firms located inthe upper right quadrant of the figures exhibit high levels of both sector and geographic globalization, whereas firms located in the lower left quadrant are following home region oriented strategies both in terms of geographical and product scope. The upper left quadrant corresponds tothe strategies by which firms operate a similar range of business withinand outside its home region, but the presence outside the home regionis relatively limited. In the lower right quadrant, firms exhibit highlevels of internationalization outside their macro region, but the range
12
in upstream primary processing activities, both because the world largest food TNCstend to focus on downstream, higher value secondary processing activities, and because
not appear in the sample.
Figure 1. Globalization of leading TNCs in selected European food
chains, 1988
Source: Authors’ elaboration based on Agrodata.
Transnational Corporations, Vol. 17, No. 1 (April 2008) 77
of businesses it operates outside the home region is limited compared tothose within the home region.
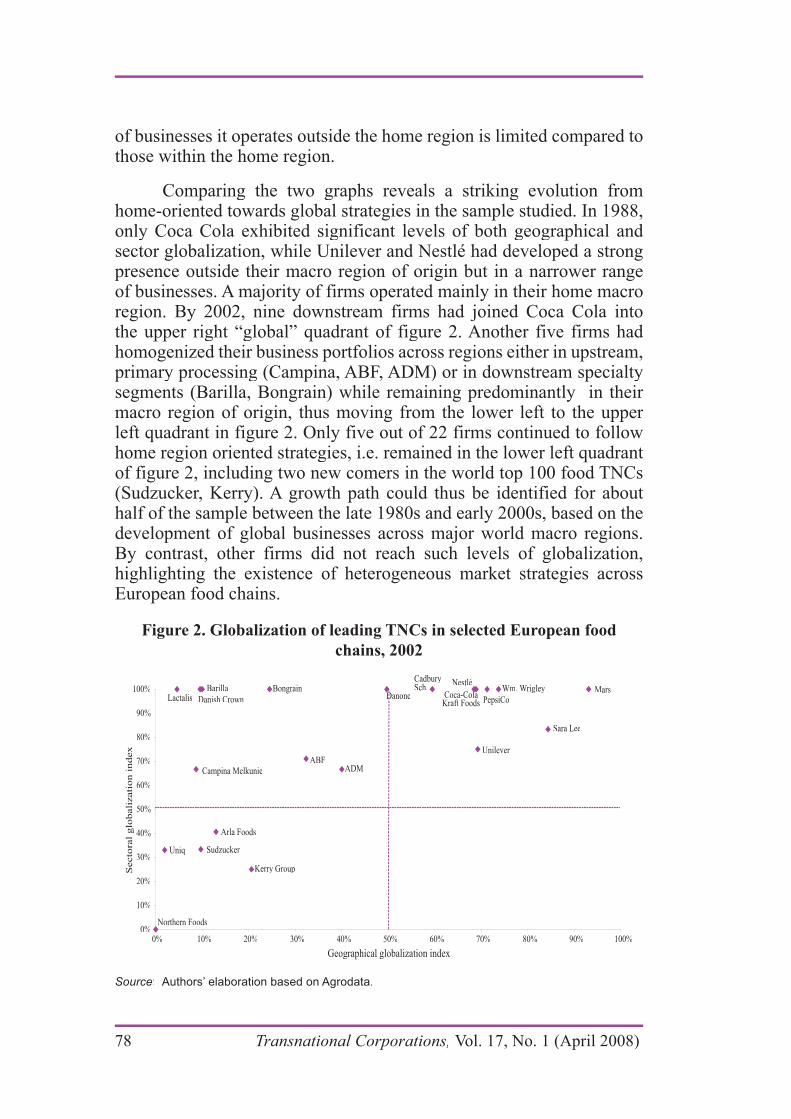
Comparing the two graphs reveals a striking evolution fromhome-oriented towards global strategies in the sample studied. In 1988,only Coca Cola exhibited significant levels of both geographical and sector globalization, while Unilever and Nestlé had developed a strongpresence outside their macro region of origin but in a narrower rangeof businesses. A majority of firms operated mainly in their home macroregion. By 2002, nine downstream firms had joined Coca Cola intothe upper right “global” quadrant of figure 2. Another five firms had homogenized their business portfolios across regions either in upstream,primary processing (Campina, ABF, ADM) or in downstream specialtysegments (Barilla, Bongrain) while remaining predominantly in their macro region of origin, thus moving from the lower left to the upper left quadrant in figure 2. Only five out of 22 firms continued to followhome region oriented strategies, i.e. remained in the lower left quadrant of figure 2, including two new comers in the world top 100 food TNCs(Sudzucker, Kerry). A growth path could thus be identified for about half of the sample between the late 1980s and early 2000s, based on thedevelopment of global businesses across major world macro regions.By contrast, other firms did not reach such levels of globalization,highlighting the existence of heterogeneous market strategies acrossEuropean food chains.
Figure 2. Globalization of leading TNCs in selected European food
chains, 2002
Source: Authors’ elaboration based on Agrodata.
78 Transnational Corporations, Vol. 17, No. 1 (April 2008)
2. Changing governance patterns in European foodchains
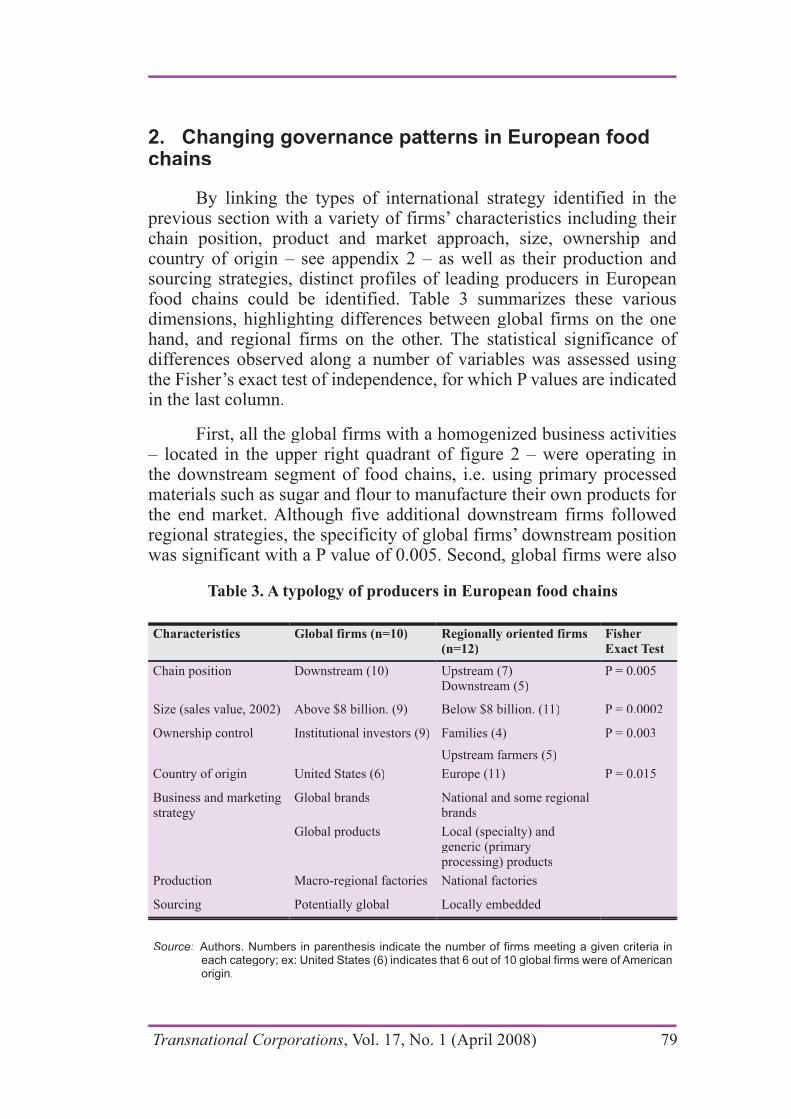
By linking the types of international strategy identified in theprevious section with a variety of firms’ characteristics including their chain position, product and market approach, size, ownership and country of origin – see appendix 2 – as well as their production and sourcing strategies, distinct profiles of leading producers in Europeanfood chains could be identified. Table 3 summarizes these variousdimensions, highlighting differences between global firms on the onehand, and regional firms on the other. The statistical significance of differences observed along a number of variables was assessed usingthe Fisher’s exact test of independence, for which P values are indicated in the last column.
First, all the global firms with a homogenized business activities – located in the upper right quadrant of figure 2 – were operating inthe downstream segment of food chains, i.e. using primary processed materials such as sugar and flour to manufacture their own products for the end market. Although five additional downstream firms followed regional strategies, the specificity of global firms’ downstream position
Table 3. A typology of producers in European food chains
Characteristics Global firms (n=10) Regionally oriented firms
(n=12)
Fisher
Exact Test
Chain positionChain position Downstream (10)Downstream (10) Upstream (7)Upstream (7)
Size (sales value, 2002)Size (sales value, 2002) Above $8 billion. (9)Above $8 billion. (9) Below $8 billion. (11)Below $8 billion. (11)
Ownership controlOwnership control Institutional investors (9)Institutional investors (9) Families (4)Families (4)
Country of originCountry of origin United States (6)United States (6) Europe (11)Europe (11)
Business and marketingBusiness and marketingstrategystrategy
Global brandsGlobal brands National and some regionalNational and some regionalbrandsbrands
Global productsGlobal products Local (specialty) and Local (specialty) and generic (primarygeneric (primaryprocessing) productsprocessing) products
ProductionProduction Macro-regional factoriesMacro-regional factories National factoriesNational factories
SourcingSourcing Potentially globalPotentially global Locally embeddedLocally embedded
Source: Authors. Numbers in parenthesis indicate the number of firms meeting a given criteria ineach category; ex: United States (6) indicates that 6 out of 10 global firms were of Americanorigin.
Transnational Corporations, Vol. 17, No. 1 (April 2008) 79
the largest in our sample, with sales value above $8 billion in 2002,while only one regional primary processing firm, ADM, reached suchsales level. Conversely, only one highly specialized global firm, Wrigley,exhibited sales value below $8 billion in 2002. The relationship betweenlarge size and a global strategy was significant with a P value of 0.0002. Third, global strategies are significantly associated with the strongpresence of institutional investors in the firm’s ownership structure.Among global firms, only Mars remained under private family control.By contrast, ownership of a majority of regional firms was controlled by either families or upstream farmers. Six global firms were also of American origin, whereas most regional firms were European, with a
institutional ownership and American origin were thus key characteristicsof the global segment of European food chains, contrasting with thesmaller size, family and farmers ownership, European origin and varied chain positions associated with regional strategies. Although other variables listed in table III could not be systematically explored for allfirms in the sample, selected case studies and interviews also allowed us to identify distinct production and sourcing patterns for global versusregional producers.
2.1 Global players at the downstream end of European chains
The largest downstream firms in our sample pursued a market strategy typically characterized by the search for global leadership inselected core businesses. Organic growth was achieved mainly throughthe sophistication of marketing and product development responding to– and enhancing – consumer desires for health, thinness, fitness, newnessas well as convenience in use and preparation. With regard to our specificproduct categories, the 2003 Food for Though database indicated that global firms had reached European leadership in high growth, globalproducts such as chewing gum (Wrigley, Cadbury), soft drinks (CocaCola, PepsiCo, Cadbury Schweppes), artificial sweeteners (SaraLee), sugar confectionary (Cadbury, Mars), dairy spreads (Unilever),
specific segments of slower-growth product categories such as icecream (Unilever, Nestlé) or biscuits (Danone). Overall, the intensity of marketing investments made by global food firms placed them among theworld top 100 ‘global marketers’ identified by Advertising Age (2001)across industries, with advertising budgets above $200 million in 2000.
80 Transnational Corporations, Vol. 17, No. 1 (April 2008)

In order to increase returns on these large intangible investments, globalfirms searched to deploy “umbrella” brands by stretching core brandson a growing number of products and countries, as illustrated by therecent launch of the global ice cream Heartbrand by Unilever. Attached to well-known national brands, Heartbrand came with a sophisticated range of product options, a heavy advertising campaign at the Europeanlevel, and innovative forms of distribution. Other examples of umbrellabrands in our sample included Nestlé, Mars, Lu (Danone) and Cadbury.
A pattern of international growth based on financialization
The global growth of large downstream firms also followed thestrategy of selling off businesses with limited potential in order to expand in selected core businesses through mergers and acquisitions. Data for the world top 100 food TNCs indicated that 3,926 major corporatestructural changes, including mergers, acquisitions, restructuring and disinvestments, had been recorded between January 1987 and June2003, of which about two thirds (1,439) took place in Europe (Ayadi,Rastoin and Tozanli, 2004). A typical case is provided by Danone, refocusing on three core businesses including bottled waters, dairyproducts and biscuits while disinvesting from beers, pasta products, convenience foods, condiments and packaging between the mid-1990s and the early 2000s, thus extending its global reach as shown by its trajectory in figures 1 and 2 – although Danone has not yet developed astrong presence outside Europe compared with major competitors suchas Nestlé.
The importance of institutional investors in the ownership structureconstituted another distinctive feature of global firms, not independent from their growth strategies based on the search for global leadership.Since institutional investors are essentially “money managers”, investinghousehold savings under conditions of tight competition rewardingshort-term, relative performance, their growing presence in theownership structure of large publicly traded corporations over the last decade has resulted in growing pressures on top management to increasereturns on capital and a related “financialization” of corporate strategies,defined as the prioritization of objectives to boost “shareholder value”in the strategic management of large corporations (Froud et al., 2000;Lazonick and O’Sullivan, 2000; William, 2000). In mature markets suchas agri-food, large publicly traded corporations have typically searched for higher financial returns on the basis of enhanced branding and product innovation and global scale economies. Conversely, these firms
Transnational Corporations, Vol. 17, No. 1 (April 2008) 81

have relied on financial markets to support their international growthby financing acquisitions (Palpacuer et al., 2006). As a consequence, globalization and financialization appeared to be closely intertwined in the corporate strategies of large downstream producers in Europeanfood chains.
From macro-regional production systems to global sourcing?
Global strategies had implications not only for the marketingstrategy of global firms, but also for their production process. Interviewsconducted by the authors indicated that global firms had launched a restructuring process aimed at developing large macro-regional factories specialized by product lines and serving the entire region,with the objective of generating scale economies and productivity increases. These macro-regional factories had been progressivelyreplacing traditional national factories through continuous restructuringand cost cutting programmes, involving plant closures and lay-offs at the national level, together with modernization and employee trainingin selected macro-regional production sites. For instance, Danonelaunched in 2001 a restructuring programme for its entire Europeanbiscuit division, revamping 16 industrial sites into three categories: (i)five factories destined to become macro-regional production sites, (ii)five factories to be restructured through production transfer towardslarger plants and lay-offs, and (iii) six factories to be closed in thefollowing years. In the early 2000s, Nestlé launched its own version of amacro-regional production system in ice cream, distinguishing between“global factories” that would perform initial production stages for globalor macro-regional markets, and “finishing factories” in which productswould be adapted to local markets. According to Peter Brabeck, CEOof Nestlé: “All aspects of the product perceived by consumers should to remain local, the rest will be global”.13 Authors’ interviews further indicated that global firms had been seeking to concentrate on higher value manufacturing by outsourcing lower value, upstream stages of their production process, including the primary transformation of cocoa(Nestlé), oilseeds (Unilever) and the collection of milk (Danone).
13
24 (Nestlé).
82 Transnational Corporations, Vol. 17, No. 1 (April 2008)

The adoption of global strategies in marketing and productionentailed a centralization of support functions such as sourcing, aimed at controlling and coordinating the activity of local buyers. In the firmsstudied, such centralization relied on new information technologies,including shared internet platforms such as CPGmarket.com launched byDanone and Nestlé in the early 2000s. Although management discourses emphasized that such tools primarily aimed at increasing the efficiencyof a firm’s internal buying departments, centralization also allowed large volume buying and greater price pressures on suppliers. Nestlé– one of few TNCs publishing data on production – indicated that theshare of raw materials in its production cost had already declined from28% to 23% between 1990 and 2000.14 The company launched GLOBE (Global Business Excellence) in 2000, a restructuring programme aimed at optimizing and standardizing management methods across divisionswith the objective of increasing cost efficiency.
The globalization of sourcing would constitute the next logicalstep following such centralization, allowing large downstream firmsto source components and raw materials on a world scale. Althougha number of restrictions have historically been placed on Europeanagricultural and primary processed imports, such option has beenfacilitated by recent technological and regulatory developments. Authors’interviews indicated that improvements in transportation technologieshad reduced geographical constraints in terms of suppliers’ proximityfor the sourcing of perishable products. The use of refrigerated cargosnow allows the long distance transportation of fresh meat, for instance,so that products can travel overseas for several weeks before reachingretailers’ shelves or downstream firms’ processing factories. Global firmsare also said to have modified their product content in order to improvethe transportability and conservation of ingredients. In ice cream, for instance, this could be achieved by substituting milk powder for freshmilk – to the extent allowed by European product regulation, itself under pressures from global producers towards reduction and simplification.In the milk, cereals and meat chains, regulatory changes through CAP reforms since the early 1990s have increasingly allowed the entry of foreign products on the European market. Only in the sugar chain,had highly concentrated and politically powerful national upstreamproducers been able to preserve a strong market protection up to the mid-2000s, although the 2006 reform adopted by the European Commissionis finally introducing significant deregulation to this industry.
14 Source: annual reports.
Transnational Corporations, Vol. 17, No. 1 (April 2008) 83

2.2 Regional producers in upstream and specialtyproduction
With the exception of the upstream United States producer, ADM,regional producers in our sample were of European origin and had not built a significant presence outside their macro region by the early2000s. These firms were among top four producers in low growth, lowconcentrated end European markets for generic and specialty productssuch as sugar (ABF, Sudzucker), bread and pasta (Barilla), naturalcheese (Bongrain, Lactalis), butter (Arla, Campina, Lactalis), meat (Danish Crown), and flour (ADM), as well as higher growth but weakly
Food) (Food for Thought, 2003).
Specialty or generic production
Two main types of market strategy and ownership patterns could be identified among these producers. Regional, family-controlled specialty producers formed the first group. It was adopted by a number of downstream firms (Lactalis, Bongrain, Barilla) that had developed homogeneous businesses across Europe and vertically integrated theupstream primary transformation of agricultural products. The FrenchBongrain and Lactalis were collecting milk for their cheese production,while the Italian dry pasta producer, Barilla, owned cereal-millingfacilities. Lactalis, initially positioned on a broad range of milk-based products, moved out of easily transportable commodities, such as milk powder, in order to focus on specialty products. These medium-sized,Southern European downstream firms were also building regionalbrands by expanding well-known national brands such as the Frenchcheese brand Président owned by Lactalis, or the Italian pasta brand Barilla, in foreign markets. Their specialty product strategies wereassociated with a strong control of families on firms’ ownership. After revamping the leadership of the company in the mid-1990s, the Barilla
between 1996 and 1999, with the explicit aim of reducing the risk of aforeign takeover. Likewise, the Bongrain family owned over 80% of shares in its company, while Lactalis remained privately owned by theBesnier family. A few downstream firms (Uniq, Northern Food) departed from such family-based ownership arrangement. They struggled withdiversified national business portfolios and failed to promote a regionalspecialty market approach. Uniq and Northern food have gone bankrupt
84 Transnational Corporations, Vol. 17, No. 1 (April 2008)

and been sold to institutional investors, although these invested on their own capital resources and not – as done in global firms – as part of their fund management activities. As indicated in figure 2, regional strategiescan also be adopted by upstream producers such the cooperative, DanishCrown, reaching a sectoral globalization index of 100% in its region of origin in 2002.
The second group consists of upstream producers that had launched diversification strategies either into the primary processing of other food chains, into the downstream stages of their own chain, or inunrelated secondary processing businesses. Horizontal diversificationincluded sugar producer Sudzucker’s moves into animal feed, cerealprocessing and sweeteners, as well as ABF’s extension from cerealprocessing into sugar, animal feed and seed processing. Verticaldownstream diversification strategies have been a distinctive featureof Northern European producers in the milk chain (Arla, Campina),leading to the development of a broad range of milk-based products.Unrelated diversification strategies included investments in ready-to-eat products (Sudzucker) or fruit juice (Arla). In our sample, ADMwas the only primary processing firm significantly engaged in buildingglobal leadership in core businesses through overseas investments,as illustrated by its leaning towards the upper right quadrant in figure2. By contrast, European upstream producers had favoured CAP-protected exports over foreign investments in developing world market sales. Under the combined effect of rising non-European competitors,declining EU regulatory support, and in some cases stagnating world demand, their international competitiveness sharply declined duringthe 1990s, resulting in large losses in their world export market share.Being specialized in generic products, these producers could not easilyhave adopted differentiation strategies that might have provided a non-cost competitive advantage over non-European suppliers. On the other hand, as volume producers, they were no longer cost competitive vis-à-vis producers in emerging countries and even United States producers,as they actively invested in lower cost overseas production facilities since the late 1990s.
The share of EU exports in world export volumes declined from 34.1% to 6.3%
(FAO database, 2001).
Transnational Corporations, Vol. 17, No. 1 (April 2008)
Locally-embedded supply chains
Most regionally oriented producers in our sample remained anchored in European upstream chains on the basis of sourcing or ownership linkages in the early 2000s, with half of them belonging tofarmers under cooperative or private status. Beyond the presence of agricultural producers in the ownership of many primary processingfirms, the perishable nature and difficult transportation conditionsof agricultural raw materials generated interdependencies betweenagricultural producers and primary food processors. In the sugar chain,for instance, refineries worked in close collaboration with sugar beet cultivators, and processing plants are located near sugar beet plantations.In the milk and meat chains, close relationships has been developed between livestock farmers and slaughter houses or dairy producers.Major primary food processing firms had thus established high volumeproduction plants in proximity to large EU agricultural productionpools. They provided regular outlets for agricultural producers in theseregions and benefited from CAP protection through CMOs in variouscommodity markets. Buffered from international competition, Europeanprimary processing firms were able to build local oligopolies in major European agricultural regions. Examples include, in the milk chain,
raw milk production in Holland in 2001; Arla Foods, with control over 90% raw milk supply in Denmark and 66% in Sweden in 2001; Lactalis,controlling up to 68% of annual raw milk production in the leadingmilk producer region of Normandy in France in 2000.16 In the sugar chain, major producers also built control over sugar beet productionpools in the EU. Sugar refiners developed long-term relationships withupstream beet producers, signing up annual contracts and providingagricultural inputs and technical assistance. In European meat chains,slaughter houses were established in regions specialized in husbandry.For instance, Danish Crown played an important role in absorbing and coordinating upstream production in Denmark. Authors’ interviewsindicated that interdependencies were looser in the grains chain,however, due to easier transportation conditions for this commodity.With this exception, European primary producers had significant vested interests in national production facilities that became threatened, under conditions of market deregulation through CAP reform, both by the riseof non-European competitors on world primary processed food export markets, and by global downstream firms’ greater freedom to search for
16 Source: Agrodata 2001, Chambre Régionale d’Agriculture de Normandie,2001.
86 Transnational Corporations, Vol. 17, No. 1 (April 2008)
non-European lower cost producers for supplying the European market.Authors’ interviews with European business associations indicated that in anticipation of further market losses for European production, anumber of leading upstream firms had actively engaged in investing inoverseas production facilities.
2.3 Some theoretical and policy implications
What are we to make of this growing divide between upstreamand downstream, global players and regional or national producers?How do such findings contribute to the broader debate on governancepatterns in the GVC literature, and what are their implications from apolicy perspective? We believe that several inferences can be drawn onthe basis of our identification and characterization of diverging profilesand trajectories among large firms in the European food industry.
Changing governance patterns in GVCs
First, by highlighting the rise of “downstream power” in GVCs, weprovide supporting evidence to the analysis of the changing governance
who have been among the few contributors to the governance debate totake into account changes towards financialization and globalization. Incharacterizing such changes, however, they focused on the rise of topinternational retailers and only touched upon key strategic orientations of large food TNCs towards financialization, global branding, oligopolisticcompetition and the outsourcing of production. Our analysis of major food TNCs in Europe thus provides complementary evidence of theemergence of global, financialized firms located in the downstreamsegment of European chains and exercising significant market power over the upstream part of these chains.
distinction made by Gereffi (1994) between buyer-driven and producer-driven forms of governance remains a key one for understandingcurrent changes in the global economy” (p. 164). By combining dataon consumption trends, market concentration and product branding, wewere able to identify distinct types of lead firms in various segments of the European food market including, on the one hand, large producersspecialized in high growth, sophisticated global products that still performed in-house a major part of manufacturing activities and, onthe other hand, large retailers developing their own brands for generic
Transnational Corporations, Vol. 17, No. 1 (April 2008) 87

products and exercising strong buying power vis-à-vis primary food processing producers. Although in traditional chain structures, retailersare located a step further downstream than large producers, in current chain configurations both types of lead firms hold direct control of consumer-related branding and product development activities, asretailers have become increasingly successful in marketing privatelabels and branding. Such intangible activities are key sources of market power in the global economy thanks to their high rent-generating
and to their “parameter setting” role (Humphrey and Schmitz, 2001)allowing lead firms to define what is produced and – to a varying degree– how it is produced upstream the chain. Both branded manufacturersand mass retailers are thus developing new ways of building and maintaining market power to “drive” GVCs, even though the strategicrole of branding and product development activities was not emphasized in Gereffi’s (1994) initial rendering of the typology.
It is important to note here that in highlighting the rise of global financialized “drivers” downstream European food chains,our contribution relates to the “overall form of governance” to bedistinguished from the “forms of coordination” by which activities are
similarly argued for the need to differentiate between the notion of power, relating to how resources and rents are distributed within the chain, and the notion of coordination, pertaining to the ways in whichresources are used in productive processes within the chain. For dinstance, in their influential article on GVCs governance, Gereffi et al.
types of chains while leaving aside the broader perspective on power initially envisioned by Gereffi (1994) and restated by Gibbon and Ponte
food TNCs in managing their relationships with suppliers falls beyond the scope of the current study focusing on sources of power and power distribution within European food chains.
The spread of a global model and its geographical consequences
Our results also tie into a broader debate on the global nature of contemporary capitalism. The emergence of a GVC perspective fostered such debate in the 1990s with regard to the national versus globalcharacter of new forms of economic organization, with Whitley (1996)arguing against Gereffi (1996) that national business systems, rather than
88 Transnational Corporations, Vol. 17, No. 1 (April 2008)
GVCs, remained more prevalent in shaping contemporary industries.The discussion continued in subsequent years over the diffusion of a“shareholder” type of capitalism from the United States into Japan and Western Europe, including a financialization of corporate governancein these countries. In Europe, shareholder capitalism was considered tohave transformed national business systems in ways that still containimportant country-specific features (Dore et al., 1999; Jackson, 2002). Likewise, comparative studies of GVCs in industries such as apparelshow that the trend towards concentration and financialization hasbeen more pervasive in the retail sector of the United States and the
global model of Anglo-Saxon origin, if occurring, was taking placeagainst the background of strong persisting national features in termsof firms’ size, ownership, relation to financial markets and businesscultures (Palpacuer et al.food TNCs in Europe provides additional evidence of the diffusion of adominant pattern of global financialized corporation among lead firmsin European GVCs. It also shows, however, that locally embedded, country-specific production remains significant both in the upstreamsegment of European food chains, among cooperatives formed by farmproducers to perform primary processing activities, and in downstreamspecialty niches developed by family-controlled producers.
Against the backdrop of the rising power of global buyers,regulatory changes in European food chains could have far-reachingconsequences for the relationship between upstream and downstreamparts of the chains and the organization of upstream production. TheCMOs played an instrumental role not only in shaping the geographyof sourcing for agricultural products – that remained largely contained within European boundaries – but also determining the distribution of value between downstream and upstream producers on the basis of astrong upstream price support policy. Recent CAP reforms in the directionof greater market openness and price competition can thus producesignificant changes both in the distribution of gains and the geographicalconfiguration of food chains serving the European market. Authors’interviews indicated that global sourcing had already become significant for non-perishable products such as butter and milk powder in the milk chain, where New Zealand and Australia had become key competitorsof European producers, while the Russian Federation, Ukraine and
for cereals. With regard to the sugar industry, largely untouched by 1992and 2000 reforms, the European Commission estimated that applyingworld market prices would push out of the market a significant number
Transnational Corporations, Vol. 17, No. 1 (April 2008) 89

decline by two thirds and be concentrated in a few countries while theend of market protection would allow as much as 80% of Europeansugar needs to be met by Brazil, the leading world exporting country(CEC, 2003). Authors’ interviews with business associations in Brusselssuggested a slightly different scenario of “inward processing” in whichBrazilian sugar cane, rather than raw sugar, would be imported for further processing within major European ports.17 The 2006 sugar reformis not based on full liberalization but on a 36% cut in institutional priceaiming to bring the price in Europe closer to the world market level, sothat changes are anticipated to be of a lesser magnitude than could beforeseeable under a full liberalization scenario. Further deregulation willnevertheless allow large TNCs operating in the downstream segment of European food chains to develop the type of global production networksthat have emerged in industries such as apparel or electronics over thepast decades. Retaining upstream production in Europe would requirepromoting the type of chains that serve niche markets, as developed by specialty producers, rather than the mass market for which globalsourcing is proving to be more attractive. Since niche markets areunlikely to absorb the bulk of European mass primary-processingproduction capacity, current deregulation policies will significantlyaffect production volumes in coming years.
Conclusion
with North-South relationships in GVCs, and conditions under which suppliers located in developing countries could improve their position by following trajectories of “industrial upgrading” so that their participation in global production could contribute to economicdevelopment in these countries. Unlike most of the GVC literature,this article deals with changes taking place in a Northern setting, in themidst of regulatory reforms that are likely to promote global sourcingand significantly reshape the geography of food production for theEuropean market. It provided evidence of a growing divide betweenmajor players at the downstream end of European chains, which haveengaged in globalization and financialization strategies since the late1980s and have strong incentives to shift from European to lower-
17
production decline and the growth of extra-European imports were no longer provided
90 Transnational Corporations, Vol. 17, No. 1 (April 2008)
cost global sourcing, and upstream producers, which have maintained regional mass production schemes under CAP protection.
The CAP was inspired by a vision of European food industries that is increasing put to question by recent changes in the global economicenvironment. First, the CAP was guided by a territorial approach tofood production and consumption responding to the traditional roleof food products as key cultural components of society. The rise of global products is now transforming food consumption and productionpatterns, freeing them from local embeddedness and the constraints of space, and weakening the normative foundation of the CAP as a tool for constructing a European community. Second, the CAP was, implicitly,based on a view of food chains where upstream agricultural and food processing activities were primary sources of value creation, overlookingthe now paramount role of marketing, product development and distribution activities. Framed with reference to the paradigm of classicmarket competition, the rhetoric underlying recent CAP reforms did not acknowledge the existence of a growing divide between upstream and downstream firms in European agri-food chains, nor did it recognize thepatterns of global sourcing that liberalization was likely to promote thedownstream segment of the chain.18 Accordingly, liberalization policiesare likely to favour both a downstream-driven globalization of Europeanfood chains and a significant dislocation of upstream production inEurope. At a time when issues of environmental protection and thequality of life and food are becoming more important, a key challengewill thus be to preserve European agricultural production while allowingit to evolve out of the productivist model established in the 1960s.
References
A.C. Nielsen (2001). Reaching the Billion Dollar Mark : a review of today’s global brands, Executive News Report from AC Nielsen Global Services, September.
A.C. Nielsen (2002). What’s Hot Around the Globe! Insights on Growth in Food and Beverages, Executive Report from ACNielsen Global Services, May.
Advertising Age (2001). The top 100 world marketers 2000, http://www.adage.com.
Ayadi, N, J.-L. Rastoin and S. Tozanli (2004). Les opérations de restructuration des
Alimentation, Paris.
18 The most recent impact study of liberalization in the sugar industry performed by the European Commission provided no estimate of consequences for European
Transnational Corporations, Vol. 17, No. 1 (April 2008) 91

sugar policy; update of impact assessment, Commission Staff Working Document.
Commission of the European Community (2003). Reforming the European Union’ssugar policy; summary of impact assessment work, Commission Staff WorkingDocument.
Dore, R., B. Lazonick and M. O’Sullivan (1999). “Varieties of capitalism in the twentiethcentury”, Oxford Review of Economic Policy 120.
political economy of late capitalism”, Economy & Society, 29(1), pp. 1 12.
chains”, Review of International Political Economy, 12(1), pp. 78 104.
gains from globalization” IDS Bulletin, Special Issue, 32(3), July.
Competition and Change, 1,pp. 427 439.
Barbara Stallings, ed., Global Change, Regional Responses, Cambridge: CambridgeUniversity Press, pp. 100 142.
Commodity Chains and Global Capitalism, Westport, CT.:123.
Trading Down; Africa, Value Chains, and the Global Economy, Philadelphia: Temple University Press.
Humphrey, J. and H. Schmitz (2001). “Governance in Global Value Chains”, in G.The Value of Value Chains: Spreading the Gains from
Globalization, IDS Bulletin, Special Issue, 32(3), July, pp. 19 29.
Jackson, G. (2002). “Financial markets and the corporation”, New Political Economy,7(1), pp. 121 124.
value chain analysis?”, Journal of Development Studies, 37(2), pp. 117 146.
Lazonick, W. and M. O’Sullivan (2000). “Maximizing shareholder value: a new ideologyfor corporate governance”, Economy and Society, 29(1), pp. 13
Palpacuer, F. (2000a). “Competence-based strategies and global production networks: A discussion of current changes and their implications for employment”, Competitionand Change 400.
Palpacuer, F. (2000b). “Characterizing governance in value chain analysis”. Paper prepared for the IDS/Rockefeller Foundation meeting on global value chains,Bellagio, Italy.
92 Transnational Corporations, Vol. 17, No. 1 (April 2008)
country suppliers in global clothing chains: a comparative European perspective”,World Development, 33(3), pp. 409 – 430.
Palpacuer, F., R. Pérez, S. Tozanli, and J. Brabet (2006). ”Financiarisation et globalizationdes strategies d’entreprise: le cas des multinationales agroalimentaires en Europe” ,Finance, Contrôle, Stratégie 189.
Palpacuer, F. (2006). “The global sourcing patterns of French clothing retailers:Determinants and implications for suppliers’ industrial upgrading”, Environment and Planning A, 38(12), pp. 2271 2283.
Perlmutter, Howard V. (1969). “The tortuous evolution of the multinational corporation”,Columbia Journal of World Business, 4(1), pp. 9 18.
global value chains”, Economy and Society, 34(1), pp. 1 31.
Porter, M. (1986). “Conceptual foundations”, in Michael Porter, ed., Competition in Global Industries 60.
Porter, M. (1998). “Competing across locations”, in M. Porter, ed., On Competition, The Harvard Business Review Book, Harvard: Harvard Business School Publishing.
Commodity Chainsand Global Capitalism, Westport, CT: Greenwood Press, pp. 123 142.
Rabobank (2001). Food retailing: the search for growth, Rabobank International.
Rama, ed., Multinational Agribusinesses, New York: Haworth Press, pp. 1 72.
Whitley, R. (1996). “Business systems and global commodity chains: competing or complementary forms of economic organisations?”, Competition and Change, 1, pp. 411
Economy & Society, 29(1), pp. 1 12.
Transnational Corporations, Vol. 17, No. 1 (April 2008) 93
Appendix 1. List of interviews completed for the study(2002-2003)
Industry associations:
COABISCO – Association of European biscuit producers – President
CIAA – European confederation of food industry associations – Director
EDA – European Dairy Association – President
EUROGLACES – Association of European ice-cream industries – Secretary
General
FEFAC – European Feed Manufacturers’ Federation – Secretary General
GAM – European Flour Milling Association – Secretary General and Member
UNESDA – European federation of non-alcoholic beverages industry
associations – Secretary General
CIUS – Committee of Industrial Users of Sugar – Secretary General
CEFS – Committee of European sugar producers – Director General
SNFSF – National association of French sugar producers – Director
UECBV – European livestock and meat trading union – Secretary General
Corporations:
BARILLA – Bakery Raw Materials & Finished Products Purchasing Manager
BONGRAIN – Director Europe
CADBURY SCHWEPPES – Sourcing Manager Europe
DANONE – Production Manager and Union representative
LACTALIS – Public Relation Manager
Databases used in the study:
Agrodata is maintained at the Institute for Mediterranean Agronomics inMontpellier, France. It records information on the businesses, affiliates,annual sales, profits and restructuring operations of the world top 100food TNCs since 1972. Information is obtained from companies’ websitesand annual reports, as well as 18 business and food trade journals.
Food For Thought is an online private food and drink market database
Western and Eastern Europe.
94 Transnational Corporations, Vol. 17, No. 1 (April 2008)

Ap
pen
dix
2.
Lea
din
g E
uro
pea
n a
gri
-fo
od
TN
Cs
in t
he
sug
ar,
cer
eals
, m
ilk
an
d m
eat
cha
ins,
20
02
(n
= 2
2)
Com
pan
yC
ou
ntr
y o
f ori
gin
Pro
du
ct a
nd
chain
posi
tion
ppp
Sta
tus
Majo
rity
share
hold
ers
(% o
f sh
are
s)(
)
Pro
du
ct p
ort
foli
o (
agri
-food
on
ly)
Tota
l sa
les
(mil
lion
s of
doll
ars
), 2
002
),
Food
sale
s(m
illi
on
s of
doll
ars
), 2
002
),
Reg
ion
(1)
(1) (
nu
mb
er o
f h
ost
cou
ntr
ies)
AB
FA
BF
Upst
ream
Upst
ream
pro
duce
rpro
duce
rP
ubli
cP
ubli
cW
esto
n f
amil
yW
esto
n f
amil
y(a
)(a
)S
eeds,
cer
eal
mil
ling, oil
s an
d f
ats,
See
ds,
cer
eal
mil
ling, oil
s an
d f
ats,
bak
ery p
roduct
s, b
iscu
its,
sugar
, bak
ery p
roduct
s, b
iscu
its,
sugar
, pro
tein
s, y
east
pro
tein
s, y
east
7 0
66
7 0
66
LA
(2),
NA
(1),
Asi
a (1
),
LA
(2),
NA
(1),
Asi
a (1
),
AD
MA
DM
Unit
ed S
tate
sU
nit
ed S
tate
sU
pst
ream
Upst
ream
pro
duce
rpro
duce
rP
ubli
cP
ubli
cIn
stit
uti
onal
Inst
ituti
onal
68%
)68%
)(b
)(b
)O
ils
and f
ats,
cer
eal
pro
cess
ing, fe
ed,
Oil
s an
d f
ats,
cer
eal
pro
cess
ing, fe
ed,
mal
t pro
cess
ing, pro
tein
pro
cess
ing,
mal
t pro
cess
ing, pro
tein
pro
cess
ing,
froze
n f
ood
froze
n f
ood
LA
(4),
NA
(2),
OC
(1),
LA
(4),
NA
(2),
OC
(1),
Arl
aA
rla
Den
mar
k/
Den
mar
k/
Sw
eden
Sw
eden
Upst
ream
Upst
ream
pro
duce
rpro
duce
rC
oop.
Coop.
Cooper
ativ
e m
ember
sC
ooper
ativ
e m
ember
s(1
00%
)(1
00%
)(c
)(c
)D
rinkin
g m
ilk, butt
er, ch
eese
, ic
e D
rinkin
g m
ilk, butt
er, ch
eese
, ic
e cr
eam
, fr
uit
juic
es, co
rn f
lakes
, bab
ycr
eam
, fr
uit
juic
es, co
rn f
lakes
, bab
yfo
od, dri
nkin
g w
ater
food, dri
nkin
g w
ater
LA
(3),
NA
(2),
Asi
a (2
)L
A (
3),
NA
(2),
Asi
a (2
)E
CE
(3),
EC
E (
3),
ME
D (
1),
WE
(7)
ME
D (
1),
WE
(7)
Bar
illa
Bar
illa
Ital
yIt
aly
Spec
ialt
yS
pec
ialt
ydow
nst
ream
dow
nst
ream
pro
duce
rpro
duce
r
Publi
cP
ubli
cB
aril
la f
amil
y
Bar
illa
fam
ily
(c)
(c)
Bak
ery,
bis
cuit
s, p
asta
pro
duct
sB
aker
y, b
iscu
its,
pas
ta p
roduct
s2 3
23
2 3
23
2 3
23
2 3
23
LA
(2),
NA
(1),
Asi
a (1
),
LA
(2),
NA
(1),
Asi
a (1
),
EC
E (
1),
EC
E (
1),
ME
D (
1),
OC
(1),
WE
(11
) M
ED
(1),
OC
(1),
WE
(11
)B
ongra
inB
ongra
inF
rance
Fra
nce
Spec
ialt
yS
pec
ialt
ydow
nst
ream
dow
nst
ream
pro
duce
rpro
duce
r
Publi
cP
ubli
cB
ongra
in f
amil
y (
>
Bongra
in f
amil
y (
>
80%
)80%
)(c
)(c
)C
hee
se p
roce
ssin
g, dai
ry i
ndust
ry,
Chee
se p
roce
ssin
g, dai
ry i
ndust
ry,
feed
feed
4 0
13
4 0
13
4 0
13
4 0
13
LA
(4),
NA
(1),
Asi
a (3
),
LA
(4),
NA
(1),
Asi
a (3
),
OC
(1),
WE
(8)
OC
(1),
WE
(8)
Cad
bury
Cad
bury
Sch
wep
pes
Sch
wep
pes
Glo
bal
Glo
bal
dow
nst
ream
dow
nst
ream
pro
duce
rpro
duce
r
Publi
cP
ubli
cIn
stit
uti
onal
Inst
ituti
onal
(14%
)(1
4%
)(a
)(a
)C
hoco
late
, su
gar
confe
ctio
ner
y, s
oft
C
hoco
late
, su
gar
confe
ctio
ner
y, s
oft
dri
nks
dri
nks
Asi
a (8
),
Asi
a (8
),
EC
E (
2),
ME
D (
2),
OC
(2),
EC
E (
2),
ME
D (
2),
OC
(2),
WE
(8)
WE
(8)
Cam
pin
aC
ampin
aM
elkunie
BV
Mel
kunie
BV
Holl
and
Holl
and
Upst
ream
Upst
ream
pro
duce
rpro
duce
rC
oop.
Coop.
Cooper
ativ
e m
ember
sC
ooper
ativ
e m
ember
s(1
00%
)(1
00%
)(c
)(c
)D
rinkin
g m
ilk, butt
er, ch
eese
, bab
yD
rinkin
g m
ilk, butt
er, ch
eese
, bab
yfo
od, fe
edfo
od, fe
ed3 7
74
3 7
74
3 7
74
3 7
74
LA
(1),
NA
(1),
Asi
a (1
),
LA
(1),
NA
(1),
Asi
a (1
),
EC
E (
2),
EC
E (
2),
Coca
-Cola
Co.
Coca
-Cola
Co.
Unit
ed S
tate
sU
nit
ed S
tate
sG
lobal
Glo
bal
dow
nst
ream
dow
nst
ream
pro
duce
rpro
duce
r
Publi
cP
ubli
cIn
stit
uti
onal
Inst
ituti
onal
(62%
)(6
2%
)(b
)(b
)S
oft
dri
nks,
bott
led w
ater
Soft
dri
nks,
bott
led w
ater
Afr
ica
(4),
LA
(11
), N
A
Afr
ica
(4),
LA
(11
), N
A
(2),
Asi
a (8
), E
CE
(2),
(2),
Asi
a (8
), E
CE
(2),
ME
D (
21),
OC
(1),
WE
(2)
ME
D (
21),
OC
(1),
WE
(2)
Dan
ish C
row
nD
anis
h C
row
nD
enm
ark
Den
mar
kU
pst
ream
Upst
ream
pro
duce
rpro
duce
rC
oop.
Coop.
Cooper
ativ
e m
ember
sC
ooper
ativ
e m
ember
s(1
00%
)(1
00%
)(c
)(c
)A
nim
al s
laughte
ring, m
eat
Anim
al s
laughte
ring, m
eat
pro
cess
ing
pro
cess
ing
EC
E (
2),
WE
(1)
EC
E (
2),
WE
(1)
Dan
one
Dan
one
Fra
nce
Fra
nce
Glo
bal
Glo
bal
dow
nst
ream
dow
nst
ream
pro
duce
rpro
duce
r
Publi
cP
ubli
cIn
stit
uti
onal
Inst
ituti
onal
(71%
)(7
1%
)(c
)(c
)Y
oghurt
s, d
airy
des
sert
s, b
iscu
its,
Y
oghurt
s, d
airy
des
sert
s, b
iscu
its,
bott
led w
ater
, m
ilk b
ased
soft
dri
nks,
bott
led w
ater
, m
ilk b
ased
soft
dri
nks,
condim
ents
condim
ents
13 7
99
13 7
99
13 7
99
13 7
99
Asi
a (7
),A
sia
(7),
EC
E (
7),
ME
D (
6),
OC
EC
E (
7),
ME
D (
6),
OC
(1),
WE
(14)
(1),
WE
(14)
Irel
and
Irel
and
Upst
ream
Upst
ream
pro
duce
rpro
duce
rE
x-c
oop
,E
x-c
oop
,publi
cpubli
cC
ream
erie
s (3
1%
) C
ream
erie
s (3
1%
) (c
)(c
)D
airy
indust
ry, m
eat
pro
cess
ing,
Dai
ry i
ndust
ry, m
eat
pro
cess
ing,
pro
tein
s, an
imal
husb
andry
, poult
rypro
tein
s, an
imal
husb
andry
, poult
ry3 8
23
3 8
23
3 8
23
3 8
23
LA
(2),
NA
(2),
Asi
a (4
),
LA
(2),
NA
(2),
Asi
a (4
),
Unit
ed S
tate
sU
nit
ed S
tate
sG
lobal
Glo
bal
dow
nst
ream
dow
nst
ream
pro
duce
rpro
duce
r
Publi
cP
ubli
cIn
stit
uti
onal
(48%
)In
stit
uti
onal
(48%
)(b)
(b)
Bis
cuit
s, c
off
ee, ch
oco
late
, su
gar
B
iscu
its,
coff
ee, ch
oco
late
, su
gar
co
nfe
ctio
ner
y, c
hee
se, dai
ry s
pre
ads,
co
nfe
ctio
ner
y, c
hee
se, dai
ry s
pre
ads,
fr
uit
juic
es, re
ady-t
o-e
at m
eals
, sn
ack
fruit
juic
es, re
ady-t
o-e
at m
eals
, sn
ack
food, yea
stfo
od, yea
sty
,y
,y
29 7
23
29 7
23
29 7
23
29 7
23
LA
(20),
NA
(1),
Asi
a (8
),
LA
(20),
NA
(1),
Asi
a (8
),
WE
(16)
WE
(16)
Transnational Corporations, Vol. 17, No. 1 (April 2008)

Ap
pen
dix
2.
Lea
din
g E
uro
pea
n a
gri
-fo
od
TN
Cs
in t
he
sug
ar,
cer
eals
, m
ilk
an
d m
eat
cha
ins,
20
02
(co
nti
nu
ed)
Com
pan
yC
ou
ntr
y
of
ori
gin
Pro
du
ct a
nd
chain
posi
tion
Sta
tus
Majo
rity
share
hold
ers
(% o
f sh
are
s)(
)
Pro
du
ct p
ort
foli
o (
agri
-food
on
ly)
Tota
l sa
les
(mil
ion
s of
doll
ars
), 2
002
),
Food
sale
s
(mil
lion
s of
doll
ars
), 2
002
),
Reg
ion
(1)
(1)(
nu
mb
er o
f h
ost
cou
ntr
ies)
Lac
tali
sL
acta
lis
Fra
nce
Fra
nce
Spec
ialt
yS
pec
ialt
ydow
nst
ream
dow
nst
ream
pro
duce
rpro
duce
r
Pri
vat
eP
rivat
eB
esnie
r fa
mil
y
Bes
nie
r fa
mil
y
(100%
)(1
00%
)(c
)(c
)
Dri
nkin
g m
ilk, butt
er, pro
cess
ed a
nd
Dri
nkin
g m
ilk, butt
er, pro
cess
ed a
nd
spec
ialt
y c
hee
sesp
ecia
lty c
hee
seN
A (
1),
EC
E (
3),
WE
(7)
NA
(1),
EC
E (
3),
WE
(7)
Mar
sM
ars
Unit
ed S
tate
sU
nit
ed S
tate
sG
lobal
Glo
bal
dow
nst
ream
dow
nst
ream
pro
duce
rpro
duce
r
Pri
vat
eP
rivat
eM
ars
fam
ily
Mar
s fa
mil
y
(98%
)(9
8%
)(e
)(e
)
Choco
late
, su
gar
confe
ctio
ner
y, i
ce c
ream
,C
hoco
late
, su
gar
confe
ctio
ner
y, i
ce c
ream
,ri
ce m
illi
ng, re
ady-t
o-e
at m
eals
, pet
foo
dri
ce m
illi
ng, re
ady-t
o-e
at m
eals
, pet
foo
d16 0
00
16 0
00
9 6
40
9 6
40
Asi
a (1
0),
EC
E (
7),
ME
DA
sia
(10),
EC
E (
7),
ME
D(3
), O
C (
2),
WE
(16)
(3),
OC
(2),
WE
(16)
Nes
tlé
Nes
tlé
Sw
itze
rlan
dS
wit
zerl
and
Glo
bal
Glo
bal
dow
nst
ream
dow
nst
ream
pro
duce
rpro
duce
r
Publi
cP
ubli
cH
ighly
dis
per
sed
Hig
hly
dis
per
sed
capit
al s
truct
ure
ca
pit
al s
truct
ure
(d)
(d)
Choco
late
, su
gar
confe
ctio
ner
y, c
off
ee, ic
eC
hoco
late
, su
gar
confe
ctio
ner
y, c
off
ee, ic
ecr
eam
, yoghurt
s an
d d
airy
des
sert
s, c
orn
crea
m, yoghurt
s an
d d
airy
des
sert
s, c
orn
flak
es, bab
y f
ood, pet
food, bott
led w
ater
, fl
akes
, bab
y f
ood, pet
food, bott
led w
ater
, so
ft d
rinks
soft
dri
nks
61 8
34
61 8
34
Afr
ica
(11),
LA
(21),
NA
(2),
Afr
ica
(11),
LA
(21),
NA
(2),
Asi
a (1
7),
EC
E (
9),
ME
DA
sia
(17),
EC
E (
9),
ME
D
Nort
her
nN
ort
her
nF
oods
Foods
Spec
ialt
yS
pec
ialt
ydow
nst
ream
dow
nst
ream
pro
duce
rpro
duce
r
Publi
cP
ubli
cF
rankli
n R
esourc
esF
rankli
n R
esourc
es(1
2%
)(1
2%
)(d
)(d
)
Rea
dy-t
o-e
at-m
eals
(fr
oze
n),
bak
ery,
Rea
dy-t
o-e
at-m
eals
(fr
oze
n),
bak
ery,
bis
cuit
s, g
rain
mil
ling, F
ruit
s &
veg
etab
les
bis
cuit
s, g
rain
mil
ling, F
ruit
s &
veg
etab
les
pro
cess
ing, yoghurt
s, m
eat
pro
cess
ing
pro
cess
ing, yoghurt
s, m
eat
pro
cess
ing
2 2
77
2 2
77
2 2
77
2 2
77
WE
(1)
WE
(1)
Pep
siC
oP
epsi
Co
Unit
ed S
tate
sU
nit
ed S
tate
sG
lobal
Glo
bal
dow
nst
ream
dow
nst
ream
pro
duce
rpro
duce
r
Publi
cP
ubli
cIn
stit
uti
onal
Inst
ituti
onal
(69%
)(6
9%
)(b
)(b
)
Soft
dri
nks,
bott
led w
ater
, fr
uit
juic
es,
Soft
dri
nks,
bott
led w
ater
, fr
uit
juic
es,
swee
tener
s, s
nac
k f
ood, bis
cuit
s, f
roze
nsw
eete
ner
s, s
nac
k f
ood, bis
cuit
s, f
roze
nfo
od
food
Asi
a (7
), E
CE
(7),
ME
D (
7),
Asi
a (7
), E
CE
(7),
ME
D (
7),
OC
(2),
WE
(17)
OC
(2),
WE
(17)
Sar
a L
eeS
ara
Lee
Unit
ed S
tate
sU
nit
ed S
tate
sG
lobal
Glo
bal
dow
nst
ream
dow
nst
ream
pro
duce
rpro
duce
r
Publi
cP
ubli
cIn
stit
uti
onal
Inst
ituti
onal
(63%
)(6
3%
)(b
)(b
)
Mea
t pro
cess
ing, bak
ery,
cak
es, die
t fo
od,
Mea
t pro
cess
ing, bak
ery,
cak
es, die
t fo
od,
coff
ee, re
ady-t
o-e
at-m
eals
(ch
ille
d),
snac
k
coff
ee, re
ady-t
o-e
at-m
eals
(ch
ille
d),
snac
k
food
food
17 6
28
17 6
28
9 2
19
9 2
19
Afr
ica
(11),
LA
(17),
NA
(2),
Afr
ica
(11),
LA
(17),
NA
(2),
Asi
a (1
4),
EC
E (
7),
ME
DA
sia
(14),
EC
E (
7),
ME
D(1
17),
OC
(3),
WE
(18)
(117),
OC
(3),
WE
(18)
Sudzu
cker
Sudzu
cker
Ger
man
yG
erm
any
Upst
ream
Upst
ream
pro
duce
rpro
duce
rP
ubli
cP
ubli
cS
outh
Ger
man
bee
t S
outh
Ger
man
bee
t (c
)(c
)
Sugar
ref
inin
g, sw
eete
ner
s, r
ead
y-t
o-e
at-
Sugar
ref
inin
g, sw
eete
ner
s, r
ead
y-t
o-e
at-
mea
ls (
chil
led),
agri
cult
ure
mea
ls (
chil
led),
agri
cult
ure
EC
E (
6),
WE
(6
)E
CE
(6),
WE
(6
)
Unil
ever
Unil
ever
Holl
and U
nit
ed
Holl
and U
nit
ed
Glo
bal
Glo
bal
dow
nst
ream
dow
nst
ream
pro
duce
rpro
duce
r
Publi
cP
ubli
cIn
stit
uti
onal
Inst
ituti
onal
(18%
)(1
8%
)(b)
(b)
Ice
crea
m, m
argar
ine,
oli
ve
oil
, dai
ry
Ice
crea
m, m
argar
ine,
oli
ve
oil
, dai
ry
spre
ads,
tea
, so
ft d
rinks,
tea
pla
nta
tions
spre
ads,
tea
, so
ft d
rinks,
tea
pla
nta
tions
49 1
39
49 1
39
27 8
83
27 8
83
Afr
ica
(11),
LA
(20),
NA
(2),
Afr
ica
(11),
LA
(20),
NA
(2),
Asi
a (1
4),
ME
D (
8),
OC
(2),
Asi
a (1
4),
ME
D (
8),
OC
(2),
EC
E (
12),
WE
(14)
EC
E (
12),
WE
(14)
Uniq
Uniq
Spec
ialt
yS
pec
ialt
ydow
nst
ream
dow
nst
ream
pro
duce
rpro
duce
r
Publi
cP
ubli
cM
&G
Inves
tmen
t M
&G
Inves
tmen
t M
anag
emen
tM
anag
emen
t(1
2%
)(1
2%
)(c
)(c
)
Fro
zen f
oo
d (
read
y-t
o-e
at-m
eals
), d
airy
Fro
zen f
oo
d (
read
y-t
o-e
at-m
eals
), d
airy
spre
ads,
butt
ersp
read
s, b
utt
er2
144
2144
2144
2144
EC
E (
1),
WE
(6)
EC
E (
1),
WE
(6)
Wri
gle
yW
rigle
yU
nit
ed S
tate
sU
nit
ed S
tate
sG
lobal
Glo
bal
dow
nst
ream
dow
nst
ream
pro
duce
rpro
duce
rppp
Publi
cP
ubli
cIn
stit
uti
onal
Inst
ituti
onal
(b)
(b)
Sugar
confe
ctio
ner
y (
chew
ing g
um
)S
ugar
confe
ctio
ner
y (
chew
ing g
um
)2 7
46
2 7
46
2 7
46
2 7
46
Afr
ica
(1),
LA
(2),
NA
(1),
A
fric
a (1
), L
A (
2),
NA
(1),
A
sia
(7),
EC
E (
10),
ME
DA
sia
(7),
EC
E (
10),
ME
D(2
), O
C (
13),
WE
(9)
(2),
OC
(13),
WE
(9)
()
()
()
(),
(),
()
(),
(),
()
So
urc
e:
Ag
rod
ata
da
tab
ase
.(1
) R
egio
ns
: Latin A
merica (
LA
), N
ort
hern
Am
erica
(NA
), O
ceania
(O
C),
Mediterr
anea
n(M
ED
), E
aste
rn &
Centr
al E
uro
pe (
EC
E),
Weste
rn E
uro
pe (
WE
).(a
) http://b
usin
ess.tim
esonlin
e.c
o.u
k/a
rtic
le/0
,,9
06
5-1
27
90
31
_4
,00
.htm
l(b
)w
ww
.edgar-
onlin
e.c
om
; (c
) Annual
report
s;
(d)C
orp
ora
te W
atc
h,
http:/
/ww
w.c
orp
ora
tew
atc
h.o
rg.u
k;
(e)F
orb
es w
ww
.forb
es.
com
.
96 Transnational Corporations, Vol. 17, No. 1 (April 2008)

Appendix 3. Globalization index, 2002
Firm Country of originGeographical
globalizationggggg
Sectoral
globalizationgggggCoca-ColaCoca-Cola United StatesUnited States 69%69% 100%100%
United StatesUnited States 69%69% 100%100%Mars Inc.Mars Inc. United StatesUnited States 93%93% 100%100%PepsicoPepsico United StatesUnited States 71%71% 100%100%Wm. Wrigley Jr. Co.Wm. Wrigley Jr. Co.
ppUnited StatesUnited States 74%74% 100%100%
BarillaBarilla ItalyItaly 10%10% 100%100%BongrainBongrain FranceFrance 24%24% 100%100%Cadbury SchweppesCadbury Schweppes
gggg100%100%
Danish CrownDanish Crownyy
DenmarkDenmark 10%10% 100%100%DanoneDanone FranceFrance 100%100%LactalisLactalis FranceFrance 100%100%NestléNestlé SwitzerlandSwitzerland 68%68% 100%100%Sara Lee CorporationSara Lee Corporation United StatesUnited States 84%84% 83%83%
UnileverUnileverNetherlands/Netherlands/
69%69%
Associated British FoodsAssociated British Foods 32%32% 71%71%Archer Daniels MidlandArcher Daniels Midland United StatesUnited States 40%40% 67%67%Campina MelkunieCampina Melkunie NetherlandsNetherlands 9%9% 67%67%Arla FoodsArla Foods
ppppDenmark/SwedenDenmark/Sweden 13%13% 40%40%
SudzuckerSudzucker GermanyGermany 10%10% 33%33%UniqUniq
yy2%2% 33%33%qq
IrelandIreland 21%21%Northern FoodsNorthern Foods 0%0% 0%0%WrigleyWrigley United StatesUnited States 28%28% 100%100%LactalisLactalis
g yg yFranceFrance 100%100%
PepsicoPepsico United StatesUnited States 18%18% 70%70%Coca-ColaCoca-Cola
ppUnited StatesUnited States 67%67%
Cadbury SchweppesCadbury Schweppes 38%38% 67%67%Mars Inc.Mars Inc. United StatesUnited States 29%29%BarillaBarilla ItalyItaly 9%9%Philip MorrisPhilip Morris United StatesUnited States
yyyy29%29% 47%47%
BongrainBongrainpp
FranceFrance 3%3% 44%44%Archer Daniels MidlandArcher Daniels Midland
ggUnited StatesUnited States 9%9% 43%43%
Northern FoodsNorthern Foods 1%1% 40%40%Sara Lee CorporationSara Lee Corporation United StatesUnited States 41%41% 39%39%Associated British FoodsAssociated British Foods
pppp6%6% 36%36%
Md FoodsMd Foods DenmarkDenmark 23%23% 33%33%Campina MelkunieCampina Melkunie NetherlandsNetherlands 17%17% 33%33%
UnileverUnileverNetherlands/Netherlands/
28%28%
BSN (Danone)BSN (Danone) FranceFrance 28%28% 22%22%NestléNestlé
((SwitzerlandSwitzerland 71%71% 22%22%
Unigate (Uniq)Unigate (Uniq)g ( q)g ( q) 2%2% 20%20%
Source: Agrodata database.
Globalization Index calculation :
MNE)
Sectoral globalisation index
The definition of businesses used for the calculation of sectoral globalisation follows the United Nations’four-digit Standard Industrial Classification. Since the end of the 1980s, the Agrodata research team hasbeen developing the UN SIC using six-digit classes in order to better respond to the high segmentation of food markets.
The eight macro regions used for the calculation of geographical and sectoral globalisation indexes are:
Iceland), ECE (Eastern and Central European States, Russia Federation and Balkan countries), and theMediterranean (Turkey, Iraq, the Syrian Arab Republic, Lebanon, Jordan, Israel, Egypt, Saudi Arabia,
Gibraltar, Malta, and Cyprus).
Transnational Corporations, Vol. 17, No. 1 (April 2008) 97

98 Transnational Corporations, Vol. 17, No. 1 (April 2008)


![THE EMERGEN] PARADIGM: CHANGING PATTERNS OF …](https://static.fdocuments.us/doc/165x107/623c64932f120923b20805b9/the-emergen-paradigm-changing-patterns-of-.jpg)