Changing Geographical Indications of Prosecco: Chances ... · PDF file, 2009, this success has...
28
Changing Geographical Indications of Prosecco: Chances, Risks or Threats? Luca Rossetto, Vasco Boatto, Luigino Barisan Luca Rossetto, Vasco Boatto, Luigino Barisan Research Center for Viticulture and Oenology (Cirve) University of Padova, Italy January 2010 Paper for the pre-AARES conference workshop on The World’s Wine Markets by 2030: Terroir, Climate Change, R&D and Globalization, Adelaide Convention Centre, Adelaide, South Australia, 7- 9 February 2010.
-
Upload
trinhkhanh -
Category
Documents
-
view
215 -
download
1
Transcript of Changing Geographical Indications of Prosecco: Chances ... · PDF file, 2009, this success has...

Changing Geographical Indications of Prosecco:
Chances, Risks or Threats?
Luca Rossetto, Vasco Boatto, Luigino Barisan
Luca Rossetto, Vasco Boatto, Luigino Barisan Research Center for Viticulture and Oenology (Cirve) University of Padova, Italy
January 2010
Paper for the pre-AARES conference workshop on The World’s Wine Markets by 2030: Terroir, Climate Change, R&D and Globalization, Adelaide Convention Centre, Adelaide, South Australia, 7-9 February 2010.
CHANGING GEOGRAPHICAL INDICATIONS OF PROSECCO: CHANCES, RISKS OR THREATS?
Luca Rossetto, Vasco Boatto, Luigino Barisan
ABSTRACT
Recently, Prosecco wine industry has dramatically increased. Wine producers were able to exploit successfully opportunities coming from both the supply growth and consumer appreciation (Boatto et al., 2008; Boatto et al., 2009). More recently, this success has been accomplished by an increasing competition on both domestic and international markets. Indeed, a lack in regulations on production, especially on the management of geographical denominations of origin (DOs), and the policy wine reform are endangering not only the market settlement but also the value of Prosecco terroir. While the consistency of DOC producers have reinforced the value of Prosecco terroir over time, the strategic behaviour of competitors out the traditional production area, may lead to the tragedy of the Prosecco as collective brand. In July 2009, the DOs have been strongly reformed: i) the Prosecco area has been unambiguously defined by introducing a new DOC while the previous one has been replaced by the DOCG; ii) the name Prosecco has also been restricted to wine coming from that area only. This reform is supposed to further protect the value of Prosecco brand but there a dangerous threats since the Prosecco area have been significantly extended and the management of DOs is not yet clear. Theoretically, the theory of clubs may give some hints in managing DOCG while the enforcement through a central authority may be the exit strategy for the management of new DOC. In this paper both hypothesis have been investigated. The existence of a club, in the Conegliano Valdobbiadene historic production area, is analyzed through a NPC model (Corain and Salmaso, 2004) following the SCP approach (Caves, 1992; Carlton and Perloff, 2007) while effects of introducing the new DOC have been forecasted. To be conservative, the second hypothesis has been evaluated assuming that Prosecco entrants behaves as existing ones. Results of NCP analysis confirm the significance of the club for DOCG producers while forecasts about the increasing supply production and effects on prices are consistent with the tragedy of commons scenario. Eventually, the change in DOs should be accomplished by actions safeguarding the value of Prosecco as collective brand. This requires a conversion of overall historic producers from DOC to DOCG more restricted wine production while the control over DOC producers should be strongly enforced. Keywords: Prosecco, denomination of origin, non parametric model, club goods, tragedy of commons.

Introduction
The Prosecco wine has promptly achieved many markets at both domestic and
international level while many brands have got good scores from wine magazine as well
as high appreciation among many wine experts. While the success on the mass market is
quite new, the history of Prosecco goes back to the second half of the XIX century.
Actually, the Prosecco wine is produced through the French Charmat method but it
started to acquire its prestige thanks to the activity of Antonio Carpenè, a founder of the
oldest wine Prosecco companies, and the Oenology School of Conegliano. Antonio
Carpené (1838-1902) learned how to ‘improve’ the Prosecco wine believing in the
chance of producing a sparkling wine with re-fermentation in big tanks. In 1924, the
first bottle of Prosecco wine ‘Colli Trevigiani’ was produced by the sparkling house
Carpenè & Malvolti located in Conegliano. The quality of Prosecco wine was greatly
improved by creating a stratification of vineyards and varieties (XIX Century) and, then,
by introducing the Controlled Denomination of Origin (DOC in Italina) of the
Conegliano Valdobbiadene (CV) area (in 1969)1. Later, the Geographical Indication of
Origin (IGT in Italian) was also introduced to extend Prosecco production to
surrounding areas in Treviso province. The DOC production is controlled by a
Consortium2, follows a strict disciplinary and it is made using local grapes. Conversely,
the IGT wine production has to follow soft restrictions3
Some data can better define this production system. The vineyard area is around 4,800
hectares, while main sparkling bottling companies are about 170 with 5,000 employees.
The production of DOC Prosecco is about 57 million bottles, of which 48 million are
sparkling Prosecco (82% of total). There is also a niche production of a high quality
Prosecco, called Cartizze, namely “Superiore di Cartizze”, which involves 109 hectares
and 1.3 millions of bottles. The line of Prosecco production includes also 8.5 millions of
semi-sparkling wine and half million bottles of still wine (Boatto et al., 2009a; Boatto et
al., 2009b). Almost 25% of Prosecco wine production is exported; most of foreign sales
are sparkling Prosecco. The total value produced by Prosecco at consumption level is
.
1 The DOC means that production must follow rules (disciplinary) in managing vineyard and wine processing. 2 The Consortium enforces the DOC, i.e., it controls that producers follow the disciplinary. 3 For instance, the grape maximum yield allowed in DOC is 18 ton/he while the corresponding max yield in IGT production is 25 ton/he.
2
around 370 millions euro corresponding to an average value of 6.5 euros per bottle.
Over the last five years the DOC production has shifted from 39.5 to 57.3 millions
bottles, i.e., it has increased at the rate of 9% per year. The IGT production is around
116 millions bottles, the area is about 7,400 hectares (Boatto et al., 2009b). In the last
three years, the IGT supply has been increased at an average annukla rate around 16-
18%. Both Denominations of origins (DOs) had successfully driven the Prosecco
production and its supply.
Recently, the European policy and market features of wine sector have changed. On the
one hand, the policy reform of wine sector4
The combination of European policy reform and increasing competitiveness has
encouraged local producers to work out effective strategies for protecting their territory
and the quality of Prosecco. Eventually, the Ministry of Agriculture accepted Prosecco
producers requests through a regulation
allows the grape varieties to be written on
the label even for wines which do not have a geographical indication. Secondly, there is
an increasing trend of producers outside the Prosecco area entering this production.
Actually, the strong growth in Prosecco market, shown in the last decade, has
encouraged new producers to enter production while competition and imitation or
falsification of Prosecco have dramatically increased as well. The competition comes
not only from Italian producers, located outside the Prosecco area, but also from foreign
companies both in Europe (eg. Romania and Spain) and out of Europe (Brazil,
Argentina). According to the theory of contestable markets (Baumol et al., 1982), rivals
have dramatically increased because of high profits and low barriers to entry.
5 which established the Prosecco DOCG instead
of old DOC and introducing a new DOC Prosecco over a wide area covering many
provinces both in Veneto and Friuli Venezia Giulia Regions. This reform has been
strongly supported by the Consortium and its members because the DOCG is supposed
to give a strong protection to local producers6
4 Council Regulation (EC) No 479/2008 on the Common Organisation of the Market in wine and the implementing Regulation (EC) No 702/2009.
. The conversion from IGT to DOC is
mainly driven by the need to define clearly and unambiguously the production area
avoiding any misunderstandings or spreads between grape production area and the place
where wine processing is done.
5 D.M. 17 July 2009. 6 DOCG wines follow restrictive production rules while wines have to pass a tasting Commission examination.

3
This reform goes back to the beginning of 2000s when a proposal for making the a new
DOC covering the province of Treviso was formulated. During the first period (2000 -
2007) the Consortium DOC Prosecco claimed that IGT wine had a competitive
advantage respect to DOC one. Actually, the IGT production had very soft restrictions
in comparison to DOC one while consumers could not distinguish between the two
wines since IGT producers could write Prosecco on the label. In 2000s the Prosecco has
strongly increased especially because of strong IGT growth. However, the adoption of
the measure has hastened in the last years. Events such as the promotion of Prosecco
“Rich Prosecco” sold as a coke and the prize won by a Brazilian Prosecco producer at
Vinitaly exhibition have boosted the adoption of Prosecco reform.
The DOs reform has deleted the Prosecco variety from the national register substituting
it with the Glera variety while the name Prosecco cannot be used for wines produced
outside DOCG or DOC areas. This arrangement seems to open new opportunities for
producers as well as the challenging perspective that Prosecco might reach a leadership
position at both domestic and international markets. Conversely, the introduction of this
measure implies an appropriate governance of the overall area which design is still on
debate, i.e., the activity of governing should be studied carefully because it may have a
strong impact on producer’ profitability.
So far, two arrangements have been proposed: i) to establish one Consortium managing
both DOCG and DOC Prosecco (old and new producers); ii) to establish a new
Consortium for DOC while maintaining the old Consortium for DOCG area.
4
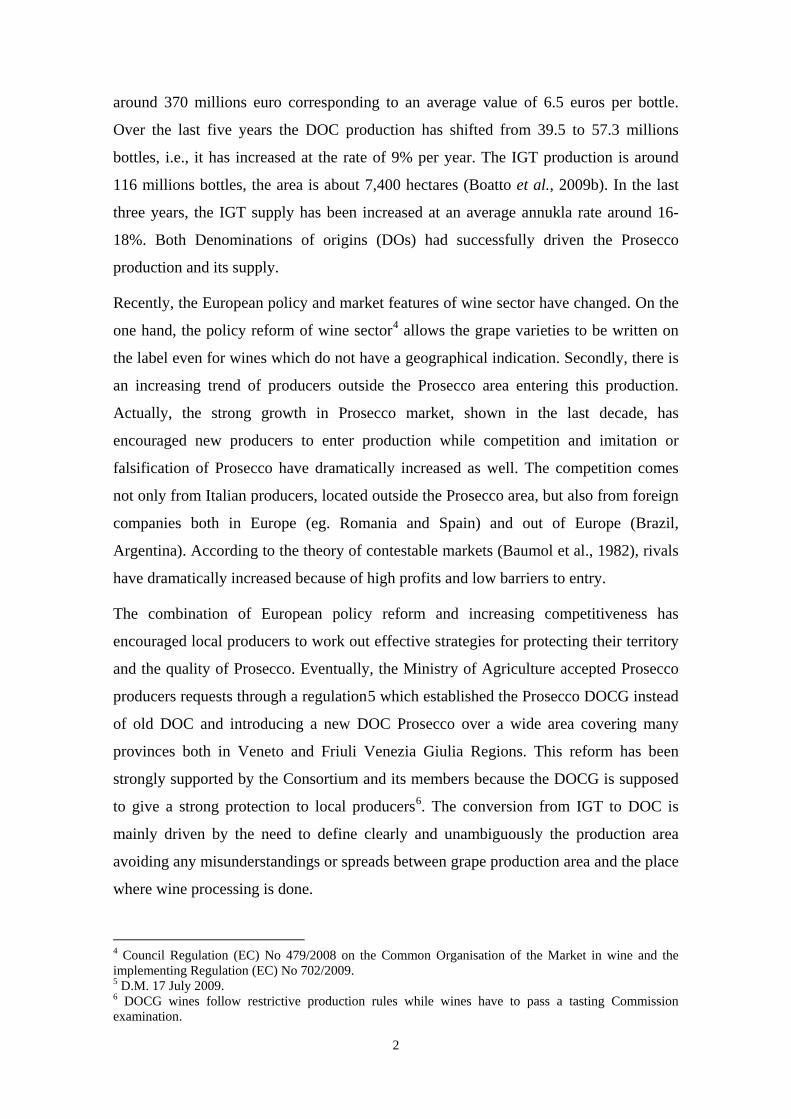
Figure 1 – Map of Prosecco DOCG and DOC
Source: Conegliano Valdobbiadene Consortium, 2009.
Does this reform represent a chance for producers? Are there any risks? Which
opportunities or threatens may arise from this change? Does this change have to be
managed or accomplished by ad hoc activities? And, more generally, does this change
lead to better perspectives for Prosecco producers and then for Prosecco market? The
answer to these questions cannot easily given since there are not examples nor in Italy
neither in other European countries.
In this paper the process of changing Denomination of Origins have been investigated.
In the following paragraph, a review of theoretical models is drawn to analyze different
governance scenarios for Prosecco firms. The third paragraph draws the analysis over a
panel sample of Prosecco firms using the non parametric combination approach to test
the behavior of wine firms on historical DOCG area of production and to evaluate the
impact of the change in DOs. Conclusions are eventually reported.
2. The management of Prosecco’s terroir as a common good
Mainly, the management issue is the regulation of supply to avoid the
exploitation of the Prosecco terroir as quality, reputation or consumer image leading to
the well-known tragedy of commons (Hardin, 1968).
5
Theoretically, the management of Prosecco production can be analyzed following two
approaches: i) the theory of commons; ii) the theory of clubs. In both cases, the
approach should safeguard the profitability of DOCG and DOC producers and the value
of name Prosecco which can be seen as a common good being shared by actual and
potential producers. The economic theory makes his major contribution through three
main interrelated models: i) the theory of common goods (Hardin, 1968; Gordon, 1954;
Dasgupta et al., 1979), ii) the game of prisoner's dilemma (Poundstone, 1992), iii) the
logic of collective action (Olson, 1965).
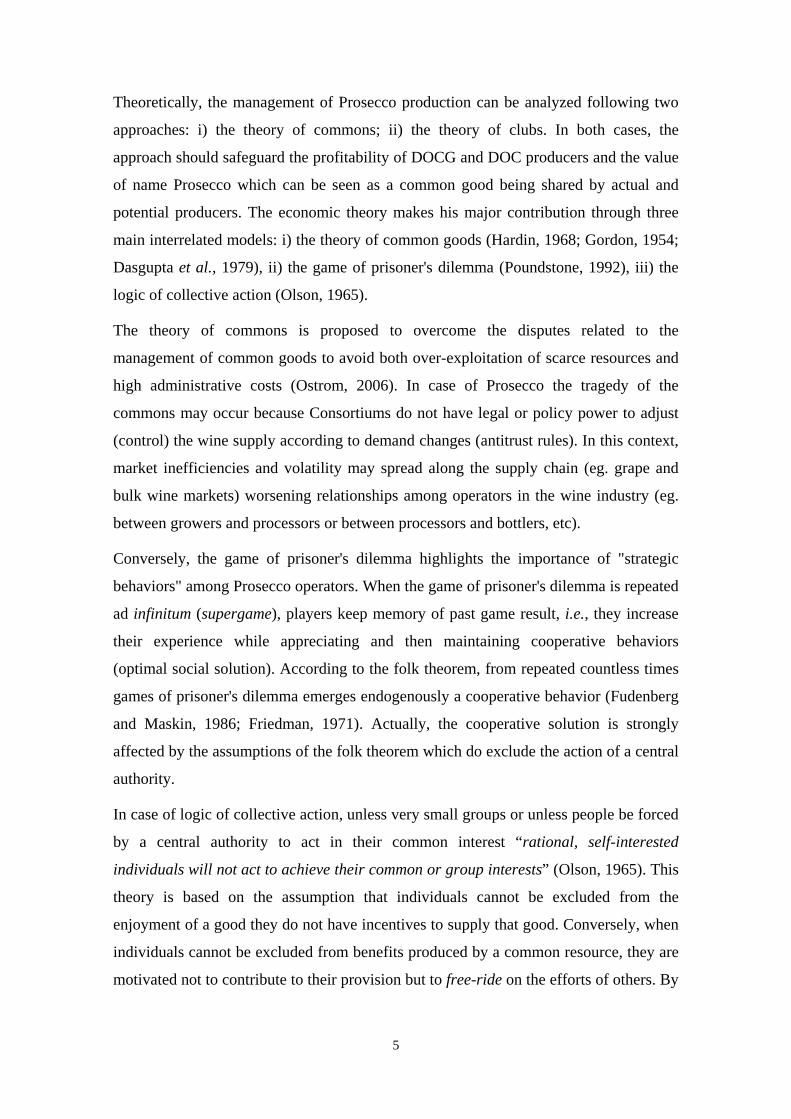
The theory of commons is proposed to overcome the disputes related to the
management of common goods to avoid both over-exploitation of scarce resources and
high administrative costs (Ostrom, 2006). In case of Prosecco the tragedy of the
commons may occur because Consortiums do not have legal or policy power to adjust
(control) the wine supply according to demand changes (antitrust rules). In this context,
market inefficiencies and volatility may spread along the supply chain (eg. grape and
bulk wine markets) worsening relationships among operators in the wine industry (eg.
between growers and processors or between processors and bottlers, etc).
Conversely, the game of prisoner's dilemma highlights the importance of "strategic
behaviors" among Prosecco operators. When the game of prisoner's dilemma is repeated
ad infinitum (supergame), players keep memory of past game result, i.e., they increase
their experience while appreciating and then maintaining cooperative behaviors
(optimal social solution). According to the folk theorem, from repeated countless times
games of prisoner's dilemma emerges endogenously a cooperative behavior (Fudenberg
and Maskin, 1986; Friedman, 1971). Actually, the cooperative solution is strongly
affected by the assumptions of the folk theorem which do exclude the action of a central
authority.
In case of logic of collective action, unless very small groups or unless people be forced
by a central authority to act in their common interest “rational, self-interested
individuals will not act to achieve their common or group interests” (Olson, 1965). This
theory is based on the assumption that individuals cannot be excluded from the
enjoyment of a good they do not have incentives to supply that good. Conversely, when
individuals cannot be excluded from benefits produced by a common resource, they are
motivated not to contribute to their provision but to free-ride on the efforts of others. By
6
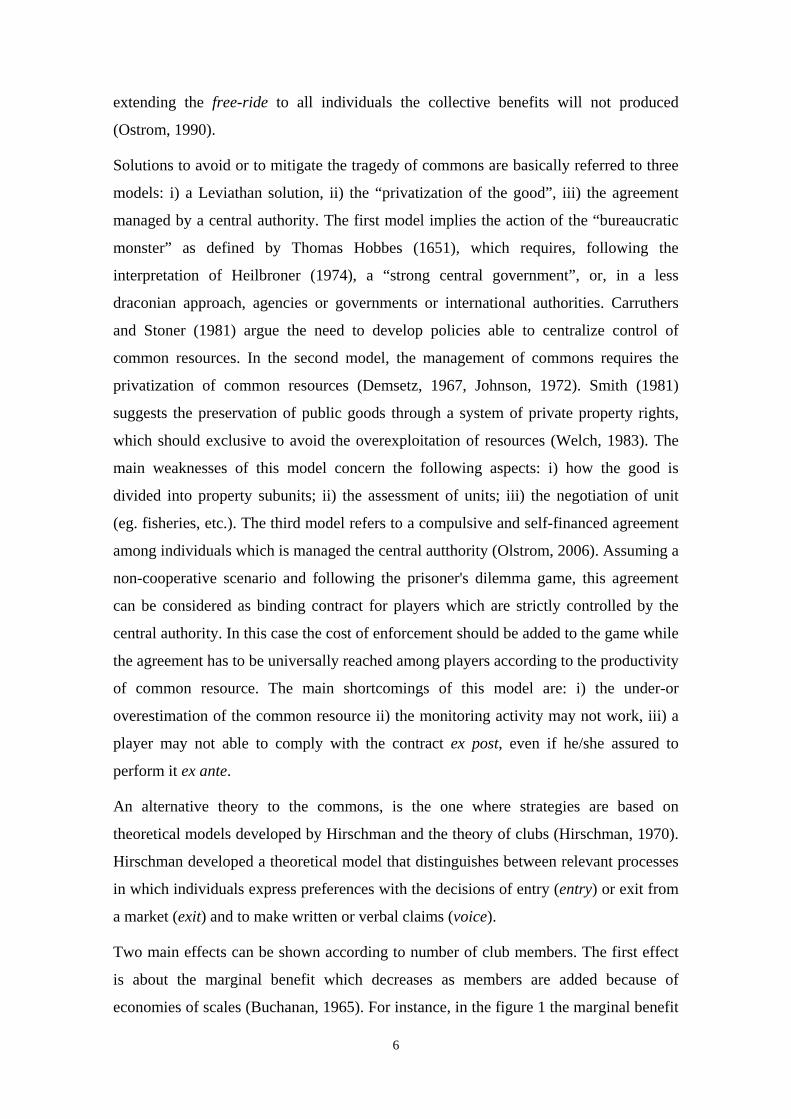
extending the free-ride to all individuals the collective benefits will not produced
(Ostrom, 1990).
Solutions to avoid or to mitigate the tragedy of commons are basically referred to three
models: i) a Leviathan solution, ii) the “privatization of the good”, iii) the agreement
managed by a central authority. The first model implies the action of the “bureaucratic
monster” as defined by Thomas Hobbes (1651), which requires, following the
interpretation of Heilbroner (1974), a “strong central government”, or, in a less
draconian approach, agencies or governments or international authorities. Carruthers
and Stoner (1981) argue the need to develop policies able to centralize control of
common resources. In the second model, the management of commons requires the
privatization of common resources (Demsetz, 1967, Johnson, 1972). Smith (1981)
suggests the preservation of public goods through a system of private property rights,
which should exclusive to avoid the overexploitation of resources (Welch, 1983). The
main weaknesses of this model concern the following aspects: i) how the good is
divided into property subunits; ii) the assessment of units; iii) the negotiation of unit
(eg. fisheries, etc.). The third model refers to a compulsive and self-financed agreement
among individuals which is managed the central autthority (Olstrom, 2006). Assuming a
non-cooperative scenario and following the prisoner's dilemma game, this agreement
can be considered as binding contract for players which are strictly controlled by the
central authority. In this case the cost of enforcement should be added to the game while
the agreement has to be universally reached among players according to the productivity
of common resource. The main shortcomings of this model are: i) the under-or
overestimation of the common resource ii) the monitoring activity may not work, iii) a
player may not able to comply with the contract ex post, even if he/she assured to
perform it ex ante.
An alternative theory to the commons, is the one where strategies are based on
theoretical models developed by Hirschman and the theory of clubs (Hirschman, 1970).
Hirschman developed a theoretical model that distinguishes between relevant processes
in which individuals express preferences with the decisions of entry (entry) or exit from
a market (exit) and to make written or verbal claims (voice).
Two main effects can be shown according to number of club members. The first effect
is about the marginal benefit which decreases as members are added because of
economies of scales (Buchanan, 1965). For instance, in the figure 1 the marginal benefit

7
of the first member when a second one is added to the club is 1/2 of the production cost
(F), i.e., the MB=F/2; similarly, the marginal benefit of 2 members when a third one is
added is F/3, etc.. The second effect is the marginal cost (MC). MC is negative when
the number of members is low but it increases as participants go up because of the
congestion effect (eg. swimming pool). Thus, the optimal size of a club (members)
implies an equilibrium between benefits and congestion costs. Another issue refers to
the existence of more than one club. In this case a member can migrate from a club to
another according to his/her convenience to shift to the new club (Buchanan, 1965).
Figure 1 – The size of the club
2 123 20
MC
MB
F/2
F/3
F/12
F/20
MC
, MB
N0
Source: Buchanan, 1965
When clubs are established, the theoretical model can draw a Pareto efficient solution
by applying excludability and assuming a ‘tacit’ choice of producers joining the club
they prefer. However, it is not possible to reach an optimal Pareto outcome with many
clubs (Buchanan, 1965; Berglas, 1976). Among the advantages, this model allows to
overcome the effects of non-cooperative scenarios, while reaching a second-best
economic result for producers (second best), through co-operative scenarios, instead of
better performance (first best) which cannot be achieved in the market because of
unavoidable entry of competitors (Berglas, 1976).

8
Hypothesis under the theory of clubs may be useful in managing the Prosecco
production. Since the name of Prosecco wine was linked to the vineyard, it could be
considered as a ‘local’ good with a joint supply (DOC and IGT) and partial
excludability (“quasi” public good) because of its limited production area. The
management of the club of Prosecco requires: i) an optimal allocation of costs among
producers reflecting inequalities in the use of the club (production technology, climate
and soil conditions, etc.); ii) to enforce the excludability through institutional devices
(eg. restrictions on eligible area, past experience in producing Prosecco, etc.).
3. The empirical analysis
The analysis on Prosecco producers is aimed to figure out the impact of DO’s reform.
The study includes two analysis: i) the model structure-conduct-performance (SCP) is
applied to a sample of producers to measure the evolution of Prosecco industry over
time; ii) a forecast about the introduction of DO’s reform is done using results coming
from the previous analysis.
The DOC production area has been analyzed through a descriptive - analytical model
following the structure-conduct-performance approach (SCP) (Stigler, 1968; Sutton,
1991,1998; Carlton and Perloff, 2005; Perloff et al., 2007). The SCP model is aimed to
figured out the followings. i) the logical issues business organization; ii) information
about strategies followed by producers. The main hypothesis is to test the SCP model on
a panel of Prosecco firms over six years (2003 - 2008).
3.1 The SCP model: methodology
The analysis is done by applying a non-parametric multi-layer and multivariate
technique called NonParametric Combination (NPC) (Pesarin, 2001, 2002; Corain and
9
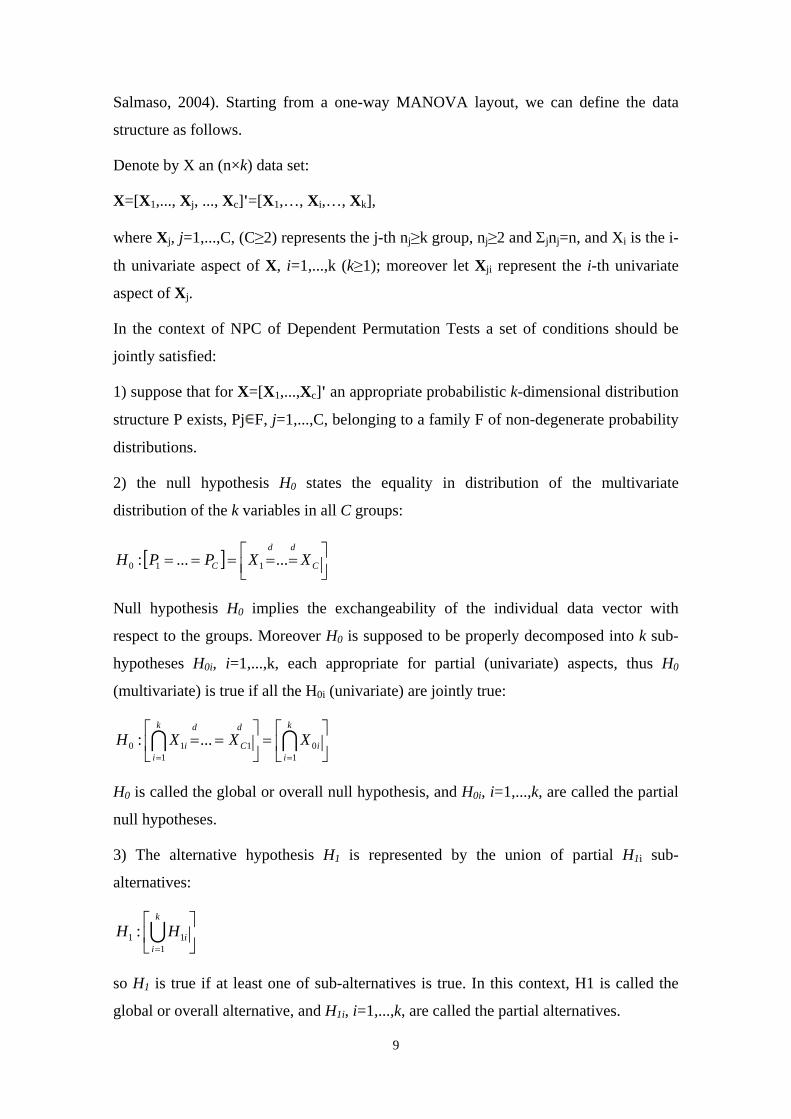
Salmaso, 2004). Starting from a one-way MANOVA layout, we can define the data
structure as follows.
Denote by X an (n×k) data set:
X=[X1,..., Xj, ..., Xc]'=[X1,…, Xi,…, Xk],
where Xj, j=1,...,C, (C≥2) represents the j-th nj≥k group, nj≥2 and Σjnj=n, and Xi is the i-
th univariate aspect of X, i=1,...,k (k≥1); moreover let Xji represent the i-th univariate
aspect of Xj.
In the context of NPC of Dependent Permutation Tests a set of conditions should be
jointly satisfied:
1) suppose that for X=[X1,...,Xc]' an appropriate probabilistic k-dimensional distribution
structure P exists, Pj F, j=1,...,C, belonging to a family F of non-degenerate probability
distributions.
2) the null hypothesis H0 states the equality in distribution of the multivariate
distribution of the k variables in all C groups:
[ ]
===== C
dd
C XXPPH ......: 110
Null hypothesis H0 implies the exchangeability of the individual data vector with
respect to the groups. Moreover H0 is supposed to be properly decomposed into k sub-
hypotheses H0i, i=1,...,k, each appropriate for partial (univariate) aspects, thus H0
(multivariate) is true if all the H0i (univariate) are jointly true:
=
==
==
k
ii
k
i
d
C
d
i XXXH1
01
110 ...:
H0 is called the global or overall null hypothesis, and H0i, i=1,...,k, are called the partial
null hypotheses.
3) The alternative hypothesis H1 is represented by the union of partial H1i sub-
alternatives:
=
k
iiHH
111 :
so H1 is true if at least one of sub-alternatives is true. In this context, H1 is called the
global or overall alternative, and H1i, i=1,...,k, are called the partial alternatives.
10
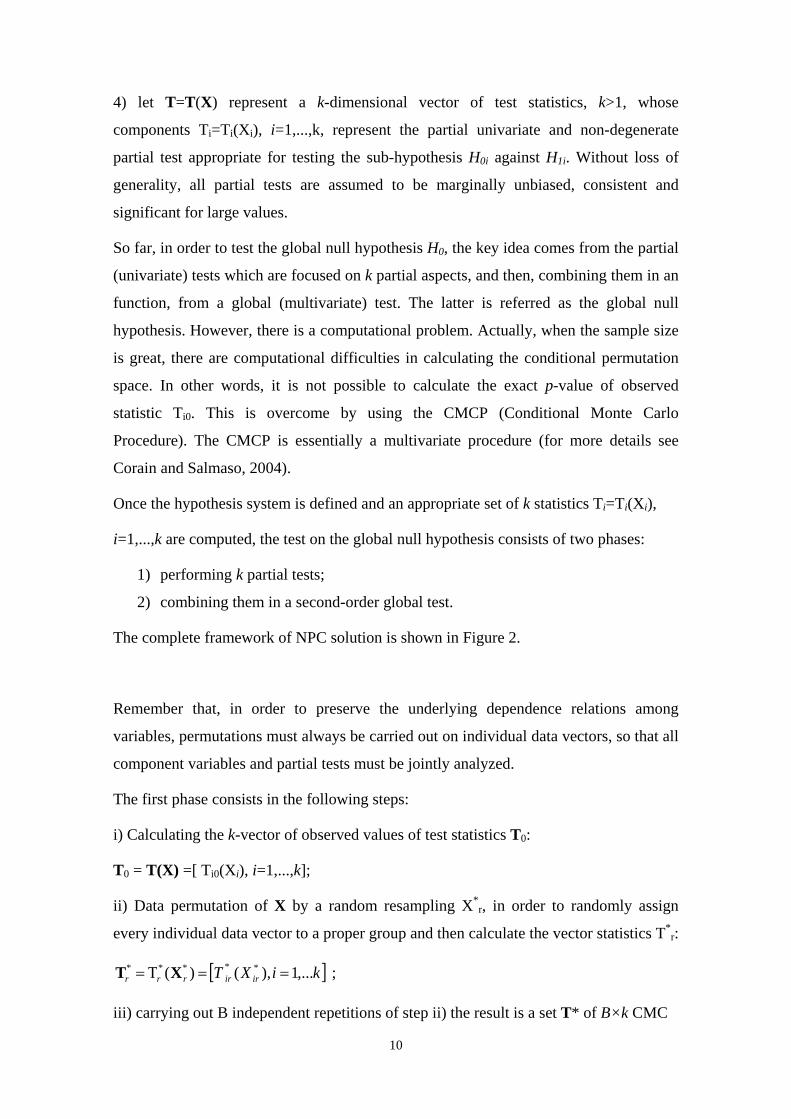
4) let T=T(X) represent a k-dimensional vector of test statistics, k>1, whose
components Ti=Ti(Xi), i=1,...,k, represent the partial univariate and non-degenerate
partial test appropriate for testing the sub-hypothesis H0i against H1i. Without loss of
generality, all partial tests are assumed to be marginally unbiased, consistent and
significant for large values.
So far, in order to test the global null hypothesis H0, the key idea comes from the partial
(univariate) tests which are focused on k partial aspects, and then, combining them in an
function, from a global (multivariate) test. The latter is referred as the global null
hypothesis. However, there is a computational problem. Actually, when the sample size
is great, there are computational difficulties in calculating the conditional permutation
space. In other words, it is not possible to calculate the exact p-value of observed
statistic Ti0. This is overcome by using the CMCP (Conditional Monte Carlo
Procedure). The CMCP is essentially a multivariate procedure (for more details see
Corain and Salmaso, 2004).
Once the hypothesis system is defined and an appropriate set of k statistics Ti=Ti(Xi),
i=1,...,k are computed, the test on the global null hypothesis consists of two phases:
1) performing k partial tests;
2) combining them in a second-order global test.
The complete framework of NPC solution is shown in Figure 2.
Remember that, in order to preserve the underlying dependence relations among
variables, permutations must always be carried out on individual data vectors, so that all
component variables and partial tests must be jointly analyzed.
The first phase consists in the following steps:
i) Calculating the k-vector of observed values of test statistics T0:
T0 = T(X) =[ Ti0(Xi), i=1,...,k];
ii) Data permutation of X by a random resampling X*r, in order to randomly assign
every individual data vector to a proper group and then calculate the vector statistics T*r:
[ ]kiXT irirrrr ,...1),()( ***** ==Τ= XT ;
iii) carrying out B independent repetitions of step ii) the result is a set T* of B×k CMC
11
[ ] [ ] ′=== ,...,,...,,...,1, ***1
**Brr Br TTTTT
is thus a random sampling from the permutation k-variate distribution of vector test
statistics T;
iv) the k-variate EDF (Empirical Distribution Function) )|(ˆ XzBF
[ ] kr rB BF ℜ∈∀+≤+= ∑ zzTIXz ,)1()(2
1)|(ˆ *
where I(•) is the indicator function, and gives an estimate of the corresponding k-
dimensional permutation distribution FB (z | X) of T. Moreover,
[ ] ,,...,1,)1()(21)|(ˆ * kiBzL
r iri =+≥+= ∑ zTIX
gives an estimate 1ℜ∈∀z of the marginal permutation significance level function.
{ }XX |Pr)|( * zTzL ii ≥=
Thus
iii TL λ)|(ˆ0 =X
gives an estimate of the marginal p-value { }XTT |Pr 0*
iii ≥=λ relative to test Ti,
i=1,…,k. All these are unbiased and consistent estimates of corresponding true values.
v) if αλ <i , the null hypothesis H0i relating to the i-th variable is rejected at the
significance level α.
The second phase, based on a nonparametric previous tests, consists in the following
steps:
a) The combined observed value of the second-order test is evaluated through the same
CMC results as the first phase, and it is given by:
)ˆ,...,ˆ(0 ki λλψ=′′T ;
b) The r-th combined value of vector statistics (step iv) is then calculated by
)ˆ,...,ˆ( **1
*krrr λλψ=′′T ,
where Brkiiriir ,...,1,,...,1),|(ˆˆ ** === XTLλ
c) Hence, the p-value of combined test T'' is estimated as:

12
BTrr)( ''
0'*' TI ≥=′′ ∑ψλ
d) If αλψ ≤′′ , the global null hypothesis H0 is rejected at significant level α; where ψ is
an appropriate combining function.
In the nonparametric, combination procedure, several combination functions may be
considered while having some features or properties (for more details see Corain and
Salmaso, 2004). The nested combination is a procedure where a intermediate
combinations which reflect the meaningful classification rules
Figure 2 – Scheme of two-phase NPC solution
Source: Corain and Salmaso, 2004

13
3.2 SCP model: data and results
Data collected concerns bottling companies located within the DOCG area7. The
analysis has been carried out on panel of 109 units (122 units in 2008), over six years
(2003-2008)8 representing the 76% of total sparkling Prosecco companies and about 65
millions bottles. The dataset includes 667 records for 237 variables9
The stratification in business clusters has been drawn on the basis of the total number of
bottles sold annually (standard = 0.75 liters) for both DOs. The dataset was divided into
four clusters: Ti) small units (<150,000 bottles), ii) medium-sized ones (150,000-
500,000), iii) large companies (500.001-1.000.000), iv) very large companies (>
1,000,000).
.
The drivers of the model are the business structure (S), the conduct on the market (C)
(bottles sold), the performance as price (P). Partial tests are carried out on the business
structure (S) as management and organization, vineyard and wine processing or cellar,
on the market conduct (C) as Italian consumption (Nielsen areas), overall distribution,
European markets, markets outside Europe, on the price performance (P) as price
reported in direct and wholesale channels in Italy. The NPC analysis has been carried
out through the software NPC test-R10 which test the model over time and within each
year according to the size of the units.
Results confirm that the SCP model is significant over time showing differences among
business class size within each year and perceptible trends over time (Table 1).
Different strategies have been detected on group drivers such as management and
organization, vineyard and wine processing (structure) which lead to different conducts
on Italian market (Nielsen areas and marketing channels) on foreign markets (European
and extra-European markets) while price performances seems to be related to business
size. Results show a differentiated strategies as market conduct and price positioning.
Likely, this outcome is associated with a change in the marketing mix on products and
7 Usually, bottling wine companies are located in DOC area but they produce a wide range of wines going from DOC to IGT or from sparkling to semi-sparkling Prosecco. 8 Starting from 2003, a survey is carried out among Prosecco companies. The panel employed in NCP analysis has been actually extracted from the database consisting of about 160 units per year. Prosecco companies collected in the sample make wine processing and bottling; some of them have also the vineyard. 9 Variables can be classified in the following categories: i) management and organization; ii) vineyard; iii) oenology; iii) marketing channels in Italy and foreign markets; iv) price positioning.

14
prices over time reported for overall units (from DOC, to Cartizze, to no-DOC) for
denomination of origins (DOC and IGT) and for specific type of product (eg. sparkling
versus semi-sparkling DOC, etc.). For instance, there is a strong statistical significance
(p-value) in comparing the conduct as number and type of marketing channels in Italy,
as penetration of foreign markets (number of foreign countries importing Prosecco) or
as importance of direct versus wholesale channels.
The analysis of results over time (2003-2008) allow us to draw patterns followed by
Prosecco firms in the last years as well as the evolution strategies adopted by firms
according to conditions of the wine market.
Table 1 - P-value table for each tested hypotheses comparing 4 business class sizes,
all Prosecco wines and from 2003 to 2008.
All years Comparison among groups within each year Partial Test (p-Combined):
C -Samples 2003 2004 2005 2006 2007 2008
Structure (S) Management and organization
0.0010** 0.0010** 0.0010** 0.0010** 0.0010** 0.0010** 0.0010**
Vineyard 0.0090** 0.9580 0.9600 0.0250* 0.0020** 0.0040** 0.1698 Wine processing 0.1489 0.0090** 0.0040** 0.0010** 0.0010** 0.0010** 0.0010** Market conduct (C)
Italy and Nielsen areas
0.4895 0.9321 0.9141 0.5774 0.0250* 0.9251 0.0110*
Distribution in Italy
0.0110* 1.0000 0.1678 0.0300* 0.0250* 0.0370* 0.0010**
European markets
0.0490* 1.0000 0.3247 0.2557 0.0020** 0.0060** 0.0010**
World markets (no Europe)
0.0350* 1.0000 0.3247 0.1638 0.0020** 0.0110* 0.0030**
Price Performance (C)
Direct channel in Italy
0.0190* 0.1538 0.1409 0.0160* 0.0240* 0.3776 0.3766
Wholesale channel in Italy
0.3127 1.0000 1.0000 0.0020** 0.0140* 0.0529 0.0010**
Driver groups (SCP)
Structure of firms 0.0070** 0.0010** 0.0010** 0.0010** 0.0010** 0.0010** 0.0010** Market conduct 0.0330* 0.9810 0.3497 0.1139 0.0010** 0.0150* 0.0010** Price performance
0.0440* 0.1538 0.1409 0.0040** 0.0130* 0.1069 0.0050**
Test overall SCP model
p-GLOBAL 0.0150* 0.0150* 0.0020** 0.0010** 0.0010** 0.0020** 0.0010** Statistical significance at 1% (**) and 5% (*)

15
3.3 Forecast the impact of changing Prosecco DOs
Results from SCP analysis have been then used to draw Prosecco perspectives after the
DO’s reform as area, overall Prosecco supply and market price. To be conservative, we
assume that Prosecco entrants behaves as existing ones Actually, SCP results have been
adjusted using additional information such as the extension of DOC’s area, the
plantations of Prosecco vineyards, the demand elasticity.
Special attention is given to Prosecco plantations. Following the trend in Prosecco
vineyard investments in the last two decades, we estimate that about 500 hectares have
been planted every year for both DOs. This figure shows actually a low growth rate
since it includes the vineyard substitution (depreciation). Conversely, in the last three
years (2007-2009) Prosecco plantations have dramatically increased reporting an
average growing rate going from 847 to 1,114 hectares10
Figure 3
. According to the plantation
density ( ), in 2009 the additional Prosecco area may reach 2,400 or 3,250
hectares.
These data are reinforced by the trend observed in Prosecco grafting cuttings. During
the last two decades, the average growth rate of new Prosecco plantations was around
500 hectares per year. Conversely, in the last three years Prosecco investments have
dramatically increased reaching annual values ranging from 847 to 1,114 hectares.
Considering both DOs, the overall area of Prosecco may increase of about 36% respect
to the 2008’s one. This trend comes from a combination of different growth rates
reported for the two DOs. Actually, outside DOCG area and the Province of Treviso,
the Prosecco area may reach a value almost four times the one observed in 2008.
Conversely, within DOCG and Treviso Province, the Prosecco area shows a slight
increase (between 1 and 2.5%).
10 Upper and lower bound of this range correspond to the following assumptions: 3,300 and 2,500 rooted grafts per hectare respectively, the mortality rate of young vines is 70%, the percentage of replanting equals to 4%.

16
Figure 3 - Number of Prosecco rooted grafts and Prosecco estimate of new surfaces for density of
investment (1993 – 2009)
Source: Moltiplicatori viticoli italiani.
According to these results, the DOCG area may reach 5,000 hectares (not far from the
4,900 hectares in 2008) while the DOC area has been estimated to achieve 12,000
hectares (7,400 hectares in 2008). The DOCG area will represent almost 30% of total
one while the DOC area is divided between the Treviso province (41% of total) and
other provinces in Veneto and Friuli Venezia Giulia regions (Table 2). The increase in
Prosecco area can be approximately converted to a corresponding change in grape and
wine production. In case of grapes, the supply may change from about 166,000 to
235,000 tons (Table 3). Consequently, the Prosecco wine supply may shift from 170
millions bottles reported in 2008 to a value between 219 and 263 millions bottles (Table
4) corresponding to a percentage change between 35 and 51%.
Forecasts about price are quite hard to be done. The price positioning analysis of
Prosecco DOs reveals significant differences according to the wine features (sparkling
vs. semi-sparkling), businesses size (small vs. big companies) as well as marketing
channels (direct sales vs. wholesales or horeca vs. retail). Actually, Prosecco sales are
mainly driven by wholesale channels (horeca and retail) while direct sales represent
about 8-9% of total sales. According to the Rabobank classification (Rabobank, 2003)
about 2/3 of Prosecco wine is sold as Popular premium (3-5 euro/bottle) while Basic
(low than 3 euro/bottle) and Premium (over 5 euro/bottle) segments (including
Superpremium wines) represent 20.4 and 7.1% of total sales, respectively. The price
17
positioning is strictly associated with the product mix supplied by firms. Price
performances among Prosecco firms show a greater market power of medium and big
firms respect to small ones. Indeed, medium or big firms offer wide range of Prosecco
wines going from high quality ones such as Cartizze (Premium or Superpremium), cru
or cuvèe, to sparkling and semi-sparkling DOC as well as sparkling or semi-sparlinkg
IGT wines in order to cover all consumer preferences and marketing channels.
Conversely, price strategies among small firms are quit different: from one side there
are firms selling Basic or Popular Premium wines, from other side firms are focused on
Premium and Supermium wines.
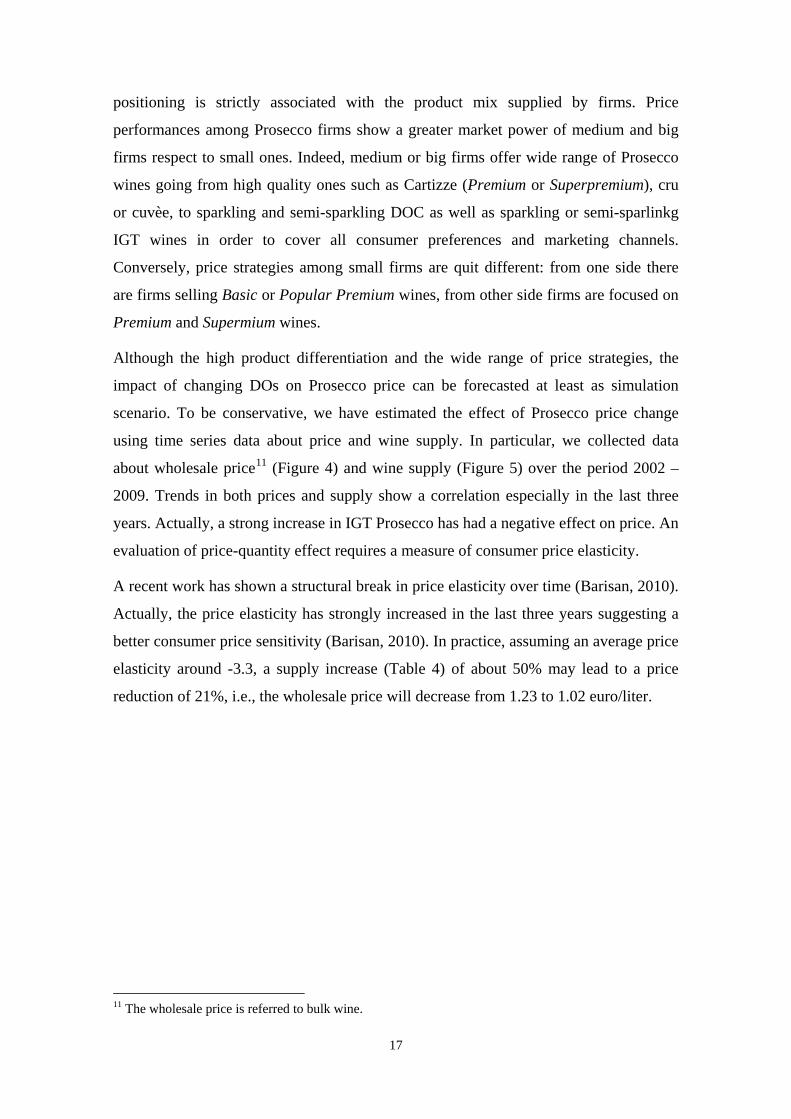
Although the high product differentiation and the wide range of price strategies, the
impact of changing DOs on Prosecco price can be forecasted at least as simulation
scenario. To be conservative, we have estimated the effect of Prosecco price change
using time series data about price and wine supply. In particular, we collected data
about wholesale price11 Figure 4 ( ) and wine supply (Figure 5) over the period 2002 –
2009. Trends in both prices and supply show a correlation especially in the last three
years. Actually, a strong increase in IGT Prosecco has had a negative effect on price. An
evaluation of price-quantity effect requires a measure of consumer price elasticity.
A recent work has shown a structural break in price elasticity over time (Barisan, 2010).
Actually, the price elasticity has strongly increased in the last three years suggesting a
better consumer price sensitivity (Barisan, 2010). In practice, assuming an average price
elasticity around -3.3, a supply increase (Table 4) of about 50% may lead to a price
reduction of 21%, i.e., the wholesale price will decrease from 1.23 to 1.02 euro/liter.
11 The wholesale price is referred to bulk wine.
18
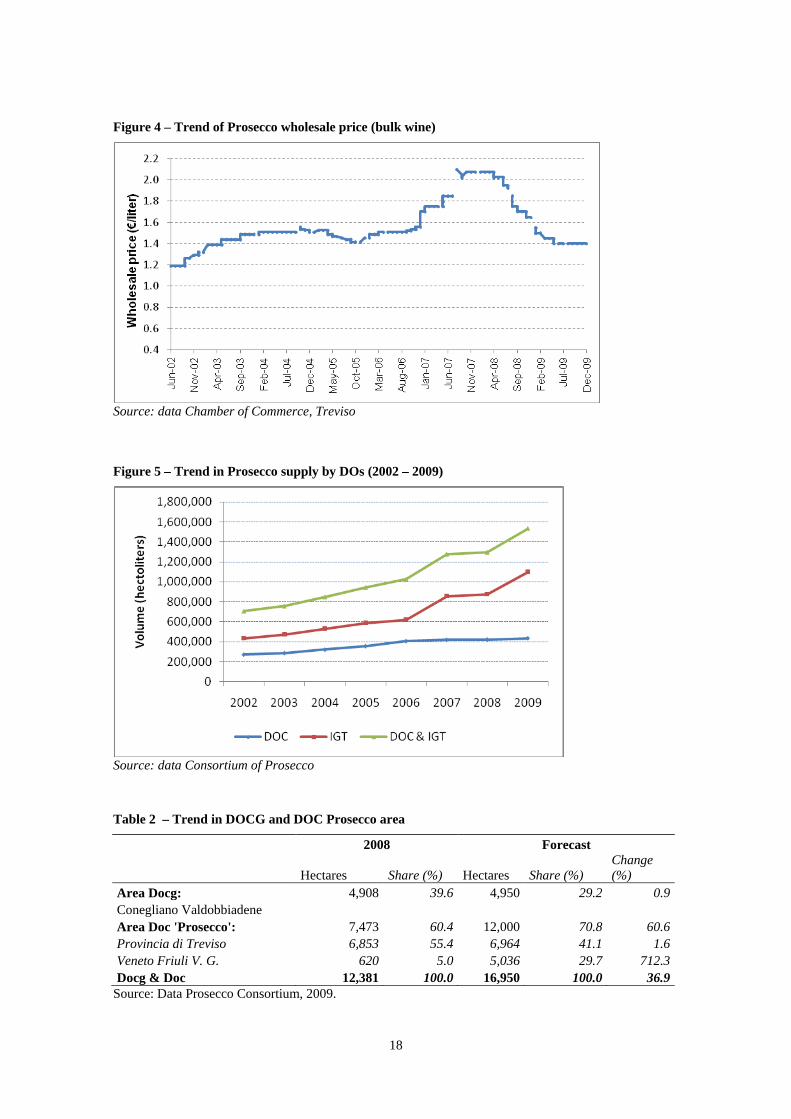
Figure 4 – Trend of Prosecco wholesale price (bulk wine)
Source: data Chamber of Commerce, Treviso Figure 5 – Trend in Prosecco supply by DOs (2002 – 2009)
Source: data Consortium of Prosecco
Table 2 – Trend in DOCG and DOC Prosecco area
2008 Forecast
Hectares Share (%) Hectares Share (%) Change (%)
Area Docg: 4,908 39.6 4,950 29.2 0.9 Conegliano Valdobbiadene Area Doc 'Prosecco': 7,473 60.4 12,000 70.8 60.6 Provincia di Treviso 6,853 55.4 6,964 41.1 1.6 Veneto Friuli V. G. 620 5.0 5,036 29.7 712.3 Docg & Doc 12,381 100.0 16,950 100.0 36.9
Source: Data Prosecco Consortium, 2009.

19
Table 3 – Trend in DOCG and DOC Prosecco grapes
2008 Forecast
tons Share (%) tons Share (%) Change (%)
Area Docg: 61,483 36.9 61,999 26.4 0.8 Conegliano Valdobbiadene Area Doc 'Prosecco': 105,220 63.1 172,766 73.6 64.2 Provincia di Treviso 96,490 57.9 100,272 42.7 3.9 Veneto Friuli V. G. 8,730 5.2 72,494 30.9 730.4 Docg & Doc 166,703 100.0 234,765 100.0 40.8
Source: Data Prosecco Consortium, 2009.
Table 4 – Trend in DOCG and DOC Prosecco wine (bottles 0.75 l)
2008 Forecast
bottles Share (%) bottles Share (%) Change (%)
Area Docg: 57,384,552 35.3 57,865,297 26.4 0.8 Conegliano Valdobbiadene Area Doc 'Prosecco': 105,219,840 64.7 161,248,309 73.6 53.2 Provincia di Treviso 96,490,240 59.3 93,587,520 42.7 -3.0 Veneto Friuli V. G. 8,729,600 5.4 67,660,789 30.9 675.1 Docg & Doc 162,604,392 100.0 219,113,606 100.0 34.8 Production surplus* - DOC/DOCG 11,476,910 11,573,059 - IGT/DOC 32,249,662 TOTAL 174,081,302 262,936,327 51,0
Source: Data Prosecco Consortium, 2009. *) To be conservative, we assume an additional production of
about 20% than the one admitted according to allowed grape yields.
Conclusions
Results from the SCP analysis and the impact of changing DOs can be jointly evaluated.
We can then summarize results as the followings.
i) Results from the SCP analysis confirm the old DOC (Conegliano
Valdobbiadene) is consistent with the theory of clubs. All producers within the
CV area claim the use of DOC as collective brand since they have realized over
two decades that the protection of Prosecco and its area safeguards they own

20
interest. The producer' awareness on the Prosecco value has gradually reinforced
by growing relationships among firms, area (soil type, slope, etc.), climate,
farming methods, vineyard, i.e., the Prosecco terroir has been consolidated.
ii) Conversion of Prosecco producers from DOC to DOCG is not a easily step since
it implies further restrictions on production, greater costs while consumer may
be not well informed about the meaning of DOCG.
iii) The extension of Prosecco area implies a strong risk of increasing supply and
squeezing market prices; consequently, the Prosecco market may collapse in few
years;
iv) Actually, the establishment of the new DOC instead of IGT may amplify a work
in progress effect stemmed by the wine policy reform12
and domestic and
international competitiveness.
Market risks cannot be overcome by changing DOs only. There are three main issues.
1) The management of converting producers in CV area from DOC to DOCG.
2) The management of DOC.
3) The control over market supply.
Let’s talk about the first issue. The club is still a good solution for DOCG producers
because of the following advantages: i) it allows to fix the optimal club size (number of
producers) according to the club constraints (eg. area); ii) it allows a better control over
the wine production through regulations (eg. yield, vineyard renewal rate, discretion
over the potential wine, etc.); iii) it has the option to admit new producers in order to
reach economies of scale; iv) it has an high knowledge about spatial allocation of
production; v) it has also the option to control the supply chain (from plantation, to
cultivation, to wine production and sales); vi) it can introduce the wine traceability
along supply chain (strong control over the wine variety); vii) the establishment of one
club can also avoid supply overexploitation or it can mitigate information asymmetries
because of differentiated Prosecco’ sold in the market ( DOCG vs. DOC); viii) the club
can also improve the performance of marketing devices (eg. promotion) since it
encompasses a well-known variety such as Prosecco; ix) a club associated with variety
12 The wine CMO reform allows to write the vine variety on label.

21
instead of origin13
The club offers also advantages in managing the brand by: i) a better control over
supply quantity and quality; ii) avoiding strategic behaviors such as the supply of low
price and quality wines which may endanger the reputation or image of Prosecco; ii)
increasing the collective reputation of Prosecco; iii) orienting private choices toward a
common interest in safeguarding even privete brands; iv) limiting the competition by
enforcing barriers to entry (eg. merging private brands to the Club of Prosecco as
variety); v) avoiding trivial actions (eg. brands associated with low quality wines) which
may have negative effects over Prosecco supply chain performance; vi) exploiting
benefits of economies of scale in promotion campaigns; vii) overcoming the
fragmentation of Prosecco brands especially on international markets.
may better exploit the market power of variety since it enjoys both
motivation benefits of the collective brand (wine origin, quality, safety) and potential
benefits of using the variety as a marketing strategy; x) the club would better managed
the protection of property rights especially at international level when an agreement on
European DOs as intellectual property rights will be reached; x) the club may exert a
strong lobby because of its monopoly power; xii) the club can also strongly reinforced
actions to protect Prosecco wine against international competition (eg. a Club of
Prosecco or International Club of Prosecco).
All these advantages seem to encourage the establishment club for DOCG management.
However, this is not an easy task. In practice, the conversion of Prosecco producers
from DOC to DOCG is not automatic process since it implies further restrictions on
production, greater costs (eg. enforcement costs) while consumers may be not well
informed about the meaning of DOCG respect to DOC. In other words, premium price
for producing DOCG instead of DOC may not compensate additional costs, thus, the
profitability may reduce.
To alleviate the transition DOC/DOCG and to encourage producers to enter DOCG, the
Consortium has started a varietal wine differentiation by exploiting some aspects of
production area (eg. "rive" or "hilly vineyard"14
13 The wine CMO reform allows to put the variety name on the label.
) or enforcing the production of cru
selections. The promotion of DOCG among consumers is another activity sponsored by
the Consortium and it is accomplished by the introduction of a new logo and a state
14 The name "rive" refers to hills where the cultivation is hard because of strong slopes.

22
band as well as by applying the traceability of Prosecco bottles to avoid speculative or
imitative actions.
The second important question is the management of DOC area. Two main
consequences can be drawn:
1) The success of Prosecco will attract new producers within DOC area; as
consequence, the market equilibrium will be definitively altered.
2) The enlargement of Prosecco area represents a dangerous threat since new producers
are mainly driven by strategic behaviors or speculative actions, i.e., they behave as
the prisoners dilemma (laissez-faire), since they are not interested in protecting
relationships with territory that do not exist or they do not know. In this case the
tragedy of commons lead to the erosion of Prosecco value as collective brand and
terroir.
3) In practice, the strategic behaviors may generate the following effects between
DOCG and DOC productions: i) a sort market cannibalism; ii) a spread in price and
wine quality ratio; iii) a strong annual fluctuations in grape prices.
As reported in paragraph 2, the tragedy of commons is associated with lack in
regulations. If the self regulation of CV Prosecco producers has required more the 20
years to be reached, the idea of extending the same rules to the DOC area is not
realistic. This issue arise because the Consortium does not have the power to control the
wine supply (see paragraph 2). In this context, conditions for building a club do not
hold, i.e., the governance of commons should take a different pattern.
Actually, the governance may be addressed by proposing an exit strategy that includes
three possible options: the Leviathan solution, the “privatization of the good”, the
agreement managed by a central authority.
1) The first option, proposing a Leviathan action, can be hardly followed because: i)
the supply is still changing over time; ii) there may be inefficiencies in monitoring
(‘erga omnes’)all supply chain operators about the compliance of both production
rules and aspects of marketing; iii) there may be mistakes in controlling operators
(eg. fostering opportunistic behaviors, wrong and not justified penalties).
2) The second option, concerning the privatization of the public good, seems to be not
feasible for the evaluation and allocation of the “common good” Prosecco as units,
through a system of property rights.

23
3) The third option may be applied to DOC Prosecco producers. In this case the
enforcement would establish a set of rules, shared by unanimity or majority of wine
producers (eg. from the vineyard to the cellar, to the technical aspects of marketing
and product distribution).
According to the third option, a central authority can enforce the wine quality
requirements without the agreement of producers, reaching the following objectives: i)
it can mitigate market inefficiencies ii) it can avoid risks of supply surplus (eg. by
raising the renewal rate of vineyards, reducing yields, etc.); iii) it can activate measures
protecting the collective reputation of Prosecco (eg. continuous and systematic sampling
tests on quality of wines entering market and reporting of any fraud, falsification or
adulteration to the competent authorities, etc.) iv) it can monitor wine stocks in real time
(storing is a critical issue in Prosecco since the freshness of this wine do not allow a
storage beyond one year); iv) in can resolve conflicts generated by free-rider behaviors
(eg. through actions on technical aspects) vi) it can better manage market crisis.
However, there are other difficulties within this governance. For instance, the agreement
is not shared by all producers, the optimum supply size can be hardly estimated
(overestimation or underestimation of production) or there is a loss in controlling the
supply chain (eg. large number of operators) and then, some aspects or rules might not
be fulfilled despite the more noble intentions agreed ex ante. In practice, there are two
main points about the third solution: to enforce rules and to establish the authority
enforcing controls.
So far, two main solutions have been proposed to limit or to regulate the wine supply: a)
the identification of eligible areas (zoning); b) the enforcement of controls along the
Prosecco supply chain (from the field to the bottle). In case of zoning, areas suited to
wine production are recognized (soil type, climate conditions, etc.). The second option
is focused on monitoring activities about “erga omnes” controls: i) on the vineyard
(yields, vine density,, etc.); ii) on wine processing and, eventually, on final tasting. The
cost of enforcement is supported by producers15
15 The transaction costs is about 3 euro per ton of grape and 0,40-0,45 euro per hectoliter of wine.
(farmers or bottlers or both).

24
One of critical points is about the authority making these controls especially for tasting
wine16
So far, institutions such as the Ministry of Agriculture, Veneto Region as well as the
Prosecco Consortium and Prosecco producers have done a lot of work but there are still
many open questions. Regardless of solution that will be reached in the next future,
what is really important is to avoid to exploit a common resource as Prosecco while
maintain the success of this wine.
. From most part a correct definition of Prosecco sensory profile is considered the
most powerful activity in controlling wine supply.
References
Hardin, G. (1968). The Tragedy of the Commons. Science, 162-1243-8
Gordon, H. S. (1954). The economic Theory of a Common - Property Resource: The
Fishery. Journal of Polical Economy, 62-124-42.
Ostrom, E. (2006). Governare i beni collettivi. Venezia: Marsilio
Ostrom, E. (1990). Governing the Commons: The Evolution of Institutions for
Collective Action, Cambridge University Press, 1990.
Dasgupta P.S., Heal G.M., Nisbet J., (1979). Economic theory and exhaustible
resources, Cambridge University Press, Cambridge, UK.
Olson M. (1965). The Logic of Collective Action. Harvard University Press
Poundstone W, (1992). Prisoner's Dilemma, Doubleday, New York.
Friedman, J. (1971), A non-cooperative equilibrium for supergames, Review of
Economic Studies, vol. 38, pp. 1–12.
Carlton D.W., Jeffrey M. Perloff J.M. (2005), Modern Industrial Organization, 4th ed.,
Pearson Higher Education.
Fudenberg D., Maskin E., (1986). The folk theorem in repeated games with discounting
or with incomplete information, Econometrica, Vol. 54, N. 3, pp. 533-554 16 So far, the authority for tasting wine is the Chamber of Commerce but it delegated Consortia to do these tests.

25
Hirschman A.O. (1970). Exit, Voice, and Loyalty: Responses to Decline in Firms,
Organizations, and States, Harvard UP, Cambridge Mass.
Tiebout C., (1954) A Pure Theory of Local Expenditures, Journal of Political Economy,
vol. LXIV, pp. 416-24.
Carlton D.W., Perloff J.M. (2005), Modern Industrial Organization, 4th ed., Pearson
Higher Education.
Stigler G. J. (1968). The Organization of Industry, Homewood.
Pesarin, F. (2001). Multivariate permutation tests with applications in biostatistics.
Chichester: Wiley.
Pesarin, F. (2002). Extending conditional inferences to unconditional ones. Journal of
the Italian Statistical Society. 11, 161-173
Salmaso L., Corain, L. (2004). Multivariate And Multistrata Nonparametric Tests: The
NonParametric Combination Tests. Journal of Modern Applied Statistical
Methods, 3 (2), 443-461
Barisan L., (2010), Strategie di sviluppo di un sistema vitivinicolo di successo: il caso
del Prosecco, Phd dissertation, Doctorate in Viculture, Oenology and Marketing
of viticultural and wine firms, University of Padova.
Demsetz H., (1967), Toward a Theory of Property Rights, The American Economic
Review, vol. 57, n. 2, pp. 347-359
Smith R.J., (1981). Resolving the tragedy of the commons by creating private property
rights in wildlife, The Cato Journal, vol. 1, n. 2, pp. 439 – 468.
G. Johnson G., Omotunde E., (1972). Economic Analysis, the Legal Framework and
Land Tenure Systems, The Journal of Law and Economics, vol. 15, pp. 259.
Caves R.E., 1992, American Industry: Structure, Conduct, Performance 7/E, Harvard
University, pag. 144.
Welch W.P., (1983). The Political Feasibility of Full Ownership Property Rights: The
Cases of Pollution and Fisheries. Policy Sciences, vol. 2, 165-180.
Buchanan J.M., (1965). An Economic Theory of Clubs, Economica, vol. 33, pp. 1–14.

26
Carruthers, I.D. Stoner R., (1981), Economic aspects and policy issues in groundwater
development, World Bank staff working paper n. 486, World Bank, Washington
DC.
Boatto V., Rossetto L., Galletto L., Barisan L. (2009a). An outlook of a successful
business: the controlled denomination of origin Conegliano Valdobbiadene –
Prosecco, poster presented at the 16th International Symposium GiESCO 2009,
July 12-16.
Boatto V., Balestrieri M., Barisan L. (2009b). Il Mercato della Denominazione
Conegliano Valdobbiadene. In: AA.VV. Rapporto 2009 – DOCG la Forza del
Distretto per Gestire il Futuro, p. 29-101, Treviso: Camera di Commercio di
Treviso.
Heilbroner, R. (1974). An inquiry into the human prospect. W. W. Norton, New York.
Rabobank International (2003). Wine is business, shifting demand and distribution:
major drivers reshaping the wine industry.: Food & Agribusiness Research,
Utrecht.
Baumol. W., (1982). Contestable markets: an uprising in the theory of industry
structure, The American Economic Review, vo. 72, n. 1, pp. 1-15.
Perloff J.M., Karp L.S., Golan A., (2007). Estimating market power and strategies,
Cambridge University Press.
Berglas E., (1976). On the Theory of Clubs, The American Economic Review, vol. 66, n.
2, pp. 116-121.