
Workforce 2031: the changing age profile of the workforce in the South West
63
Changing Employment Conditions of the Indian Workforce and Implications for Decent Work
Ravi Srivastava, Jawaharlal Nehru University ABSTRACT This paper analyses recent macro employment trends in India. Analysis of recent data shows increasing informalisation and flexibilisation of labour and challenges the notion that casualisation is the only manner in which flexibilisation and informalisation of labour is occurring in India. It argues that the concern with decent work has to be based on analysis of labour conditions in all major forms of employment. The paper also discusses the main strategies proposed for introducing labour standards and decent work in the Indian context. We argue that in the recent post economic crisis period, there is greater acceptability to improving labour standards and income distribution as a way of sustaining long term growth. This has raised the profile of those Indian initiatives which build upon social and economic rights. Although this paper is based on detailed Indian empirical evidence, the trends that it adduces and its policy implications are of much greater general significance. KEYWORDS decent work, employment structure, flexible labour, homeworkers, India, informal employment Changing Employment Conditions of the Indian Workforce and Implications for Decent Work 1. INTRODUCTION
For a long time, an important debate on changes in the Indian workforce have revolved around trends towards increasing ‘casualisation’ of the workforce and its implications for deterioration in the quality of work.1 On the other hand, ‘regular’ or salaried employment has been seen to be associated with better quality or decent work due to its general association with higher job security, better remuneration and conditions of work, and social security.
While studies for 1990s focused on higher numerical flexibility in the organized sector (Deshpande 2001), recent data on employment in India establishes that the Indian labour market is experiencing greater flexibility in all the respects mentioned by Standing (1999).2 This challenges the

64
notion that casualisation is the only way in which flexibilisation of labour is occurring. Moreover, it further establishes that the lack of decent work is not restricted to casual work (although casual/contract work does encompass the poorest conditions of work).
The trends towards greater labour flexibility and informalisation of all types of employment, driven by globalization, is not restricted to India alone. China, along with India, has also experienced greater labour flexibility and informalisation (Unni and Lu 2007). Chang (2009) also argues that with the emergence of the ‘global factory’, the formal is becoming informal in a variety of ways. Although driven by globalization, the trends in India also pervade the non-tradable sectors as well, pointing to wider tendencies at work.
As we shall see later the paths to labour flexibility and informalisation (both through ‘putting out’ petty production systems, and ‘regular’ wage employment) have been explored in several micro studies. This paper will instead focus on an analysis of recent macro employment trends and what they reveal viz. that self-employment and regular work (which refers to hiring for longer periods than a day, and the payment of wages at weekly or monthly durations) occupy an important niche in changing employment relations in India – the former because it incorporates growing trend towards putting-out, and the latter because it incorporates an ever growing proportion of flexible work at different skill levels required by the changing needs of the growing economy. These changes also have important gender dimensions as women form a large component of the most vulnerable lowest paid sub-contracted and regular workers. Thus, the paper argues, the concern with decent work has to be based on analysis of labour conditions in all major forms of employment.
The paper is structured in the following fashion. In the next section, we draw certain stylized facts about employment conditions in India and focus attention on how these are changing with market induced reform and globalization. We then discuss the main strategies proposed for introducing labour standards and decent work in the Indian context. In a globalising world, these strategies are closely connected to strategies being pursued elsewhere. We argue that in the recent post economic crisis period, there is greater acceptability to improving labour standards and income distribution as a way of sustaining long term growth. This has raised the profile of those Indian initiatives which build upon social and economic rights. Although this paper is based on detailed Indian empirical evidence, the trends that it adduces, and its policy implications, are of wider significance. 2. THE WORLD OF WORK IN INDIA AND HOW IT IS CHANGING
The purpose of this section is to delineate some of the important features of the Indian labour market and the changes taking place in it in the recent decades during which the Indian economy has undertaken market oriented reforms and has rapidly globalised. We base ourselves on the Employment-Unemployment surveys carried out by the National Sample Survey Organisation (NSSO) on a quinquennial basis. Individual level data from these surveys for the period 1983 to 2004-05 is analysed in this paper. The surveys carried out in 1999-00 and 2004-05 give us further details on formal and informal employment which is the main focus of this paper. In addition, the NSSO also carried out a survey on informal sector enterprises in 1999-00 which has been used to delineate the character of these enterprises.

65
The main results of the changes in employment and the labour market is that while the formal sector of the economy, particularly the services sector has grown rapidly, employment relations have become more informal and flexible, and informality and flexibility are experienced in relation to all forms of employment, including those forms not normally associated with informality/flexibility. Table 1. Structure of employment (percent to total workers), 1983 and 2004-05 Rural Urban Total Industrial Group 1983 2004-05 1983 2004-05 1983 2004-05
Agriculture 77.7 66.5 10.3 6.1 62.0 48.9
Mining & Quarrying 0.6 0.6 1.2 0.9 0.7 0.7
Manufacturing 7.5 7.9 29.7 23.5 12.7 12.5
Electricity, etc 0.2 0.2 1.1 0.8 0.4 0.4
Construction 2.3 6.8 5.1 9.2 2.9 7.5
Trade &hotels 4.4 8.3 20.5 28.0 8.1 14.1
Transport, etc 1.7 3.8 10.0 10.7 3.6 5.8
Services 5.6 5.9 22.1 20.8 9.5 10.3
Male
Total Non-Agriculture 22.3 33.5 89.7 93.9 38.0 51.1
Agriculture 87.7 83.3 31.2 18.1 81.0 72.5
Mining & Quarrying 0.3 0.3 0.7 0.2 0.4 0.3
Manufacturing 6.4 8.4 27.0 28.2 8.8 11.7
Electricity, etc 0.0 0.0 0.2 0.2 0.0 0.0
Construction 0.7 1.5 3.2 3.8 1.0 1.9
Trade &hotels 2.0 2.5 9.5 12.2 2.8 4.1
Transport, etc 0.0 0.2 1.5 1.4 0.2 0.4
Services 2.8 3.9 26.7 35.9 5.6 9.2
Female
Total Non-Agriculture 12.3 16.8 68.8 81.9 18.9 27.6
Agriculture 81.6 72.6 14.7 8.7 68.6 56.6
Mining & Quarrying 0.5 0.5 1.1 0.7 0.6 0.6
Manufacturing 7.1 8.1 29.3 24.5 11.4 12.2
Electricity, etc 0.2 0.1 0.9 0.7 0.3 0.3
Construction 1.7 4.9 4.7 8.0 2.3 5.7
Trade &hotels 3.5 6.2 18.4 24.6 6.4 10.8
Transport, etc 1.1 2.5 8.3 8.7 2.5 4.1
Services 4.6 5.2 23.2 24.0 8.2 9.9
Persons
Total Non-Agriculture 18.6 27.4 86.0 91.3 31.6 43.5
Source: Computed from individual level data, Various NSS Rounds on Employment –Unemployment

66
Industrial Structure of Employment
Employment in the Indian economy continues to exhibit a traditional structure with the overall dominance of agriculture and of petty commodity production within manufacturing. Even in 2004-05, 56.6 percent of total workers (combined rural and urban) were employed in agriculture, having declined from 68.6 percent in 1983. Table 1 shows that the percentage of total employment in mining, manufacturing, and electricity etc, has remained more or less constant over the years, with about one in eight workers being employed in manufacturing. The construction sector and the tertiary sector have experienced corresponding increases in employment share. Overall employment diversification is much more prominent for male workers, for whom agricultural employment now accounts for less than half the total male workforce. Interestingly, although females continue to be predominantly in agriculture, the share of female employment in manufacturing has increased over these years denoting the incorporation of female labour in manufacturing value chains. We revert to this in our discussion of homeworkers later in this paper. Within the industrial sector as a whole, the share of informal sector employment rose from 69.05 percent in 1999-00 to 70.4 percent in 2004-05 (NCEUS 2008: 31) showing the increasing dominance of petty commodity production in this sector.
Revival of Self-employment? Over the years, there was a gradual decline in self-employment along with increased
casualisation. This was more prominent in rural areas and for males (urban female workers were absorbed in regular work but at two ends of the job spectrum). However the 2004-05 survey round shows a change in this trend. The share of self-employed increased for both males and females and in both rural and urban areas. The increase in share of female rural self-employed workers was the highest. Self-employment increased both in agriculture and in manufacturing, but probably as a result of different processes. While agriculture is mainly a ‘fall back’ sector, in manufacturing, increase in sub-contracting in own account units appears to have increased. Second, the process of casualisation showed a slowdown in this period as the share of casual labourers declined. Third, regular employment showed a small increase in the rural areas, more in case of females. In urban areas the share of male regular workers slightly dipped while it increased for female workers. Both self-employment and regular employment show accentuation of new features which we comment upon later in this paper.

67
Table 2. Percentage of employment by type of employment, various years
Self-employed Regular Casual Labour Self-employed Regular Casual Labour Rural Male Rural Female 2004-05 58.1 9.0 32.9 63.7 3.7 32.6 1999-00 55.0 8.8 36.2 57.3 3.1 39.6 1993-94 57.7 8.5 33.8 58.6 2.7 38.7 1987-88 58.6 10.0 31.4 60.8 3.7 35.5 1983 60.5 10.3 29.2 61.9 2.8 35.3 Urban Male Urban Female 2004-05 44.8 40.6 14.6 47.7 35.6 16.7 1999-00 41.5 41.7 16.8 45.3 33.3 21.4 1993-94 41.7 42.0 16.3 45.8 28.4 25.8 1987-88 41.7 43.7 14.6 47.1 27.5 25.4 1983 40.9 43.7 15.4 45.8 25.8 28.4
Source: Computed from individual level data, various NSS Rounds on Employment –Unemployment Slow Down in the Rate of Growth of Employment
Despite some acceleration in the growth rate of the economy in recent years, available evidence (up to 2004-05) does not indicate an increase in the growth rate of employment. In fact, the total growth rate of employment declined from 2.1 percent during 1983/1993-94 to 1.9 percent during 1993/94-2004/05. This was mainly due to a slower growth of male rural employment (Table 3) in the agricultural sector (Table 4).
Table 3. Growth rate of employment, 1983 to 2004-05 Table 8: CAGR (%) of Work Force All India 1983-2005
Rural Urban Total Year
M F T M F T M F T
1983/1993-94 1.9 1.4 1.8 3.2 3.4 3.2 2.3 1.8 2.1 1993-94/2004-05 1.5 1.7 1.6 3.2 3.4 3.3 2.0 1.9 1.9 1983/2004-05 1.7 1.5 1.7 3.2 3.4 3.3 2.1 1.8 2.0
Source: Computed from, individual level data, NSS Rounds on Employment – Unemployment, 1983, 1993-94 and 2004-05

68
In fact, the growth of agricultural employment in the second period (1994/05) slowed down to 0.8 percent while non-agricultural employment grew at almost at the same pace during the two periods (slightly higher 3.7 percent in the second period). A slowdown in the rate of growth of agricultural employment can be anticipated but it should be accompanied by adequate growth of quality non-farm employment. However, the growth of non-agricultural employment has not only not been sufficient to compensate for the slowdown in agricultural employment, it also has been of an informal kind. Table 4. Growth rate of agricultural and non-agricultural employment, 1983 to 2004-05
1983/94 1994/05 1983/05
Agriculture 1.5 0.5 1.0 Male
Non-Agriculture 3.4 3.9 3.7
Agriculture 1.2 1.4 1.3 Female
Non-Agriculture 2.5 3.5 3.1
Agriculture 1.4 0.9 1.1
Rural
Total Non-Agriculture 3.2 3.8 3.5
Agriculture 1.9 -0.4 0.7 Male
Non-Agriculture 3.3 3.5 3.4
Agriculture 1.2 0.5 0.8 Female
Non-Agriculture 4.3 4.3 4.3
Agriculture 1.6 0.0 0.7
Urban
Total Non-Agriculture 3.5 3.6 3.6
Agriculture 1.2 1.3 1.3 Male
Non-Agriculture 3.3 3.9 3.6
Agriculture 1.5 0.5 1.0 Female
Non-Agriculture 3.4 3.7 3.5
Agriculture 1.4 0.8 1.1
Total
Total Non-Agriculture 3.4 3.7 3.5
Source: Computed from individual level data, NSS Rounds on Employment – Unemployment, 1983, 1993-94 and 2004-05 Increased informalisation
Estimates of the informal economy in India have until recently been based on organized employment data reported to the Director General of Employment and Training (DGET). These suffer from underreporting (NCEUS 2009, Sundaram 2008). Since 1999-00, the NSS Employment-Unemployment Surveys enable us to estimate the size of the unorganized sector directly but to do this, definitional issues need to be resolved. The NCEUS (2007, 2009) has

69
defined the unorganized/informal sector as all partnership/proprietary unincorporated enterprises employing less than ten persons in non-agriculture, whereas in agriculture, all private farming except plantation agriculture or large cooperatives are included in the informal/unorganized sector. The NCEUS (2007) has also separately defined informal/ formal employment, the former covering those workers who do not have employment security or employer provided social security.3
The two consecutive rounds of the Employment-Unemployment surveys (in 1999-00 and 2004-05) have enabled an examination of the relationship between the formal/informal sector and formal/informal employment. This is shown in Table 5. Table 5. Relationship between sector and type of employment, 1999-2000 and 2004-05
1999-2000 2004-2005 Sector Informal Worker
Formal Worker
Total Informal Worker
Formal Worker
Total
Unorganised Sector
341.28 (99.60)
1.36 (0.40)
342.64 (100)
393.47 (99.64)
1.43 (0.36)
394.90 (100)
Organised Sector
20.46 (37.80)
33.67 (62.20)
54.12 (100)
29.14 (46.58)
33.42 (53.42)
62.57 (100)
Total: 361.74 (91.17)
35.02 (8.83)
396.76 (100)
422.61 (92.38)
34.85 (7.46)
457.46 (100)
Note: Figures are in million. Figures in bracket indicate percentages. Source: NCEUS (2007), p. 6. Figures computed from NSSO 55th (1999-2000) and 61st (2004-05) Round Survey on Employment – Unemployment
Between 1999-00 and 2004-05, while the total workforce expanded from 397 m to 457 m, formal employment actually declined marginally from 35.02 m to 34.85 m. The formal/organised sector saw an increase in employment from 54.12 m to 62.57 m, but this entire increase was accounted for by informal employment.
Table 6 shows the sector wise change in formal and informal employment between 1999-00 and 2004-05. In each of the three sectors, agriculture, industry and services, virtually the entire increase in employment is in the form of informal employment. This is also shown in Table 7 which gives the sector-wise growth rate of formal and informal workers.

70
Table 6. Distribution of workers by type of employment and economic activity
1999-2000 2004-2005 Economic Activity Informal
Workers Formal Workers
Total Workers
Informal Workers
Formal Workers
Total Workers
Agriculture 234.79 (98.79)
2.89 (1.21)
237.67 (100)
256.07 (98.89)
2.86 (1.11)
258.93 (100)
Industry 55.52 (85.56)
9.37 (14.44)
64.89 (100)
76.64 (89.39)
9.09 (10.61)
85.73 (100)
Services 71.43 (75.83)
22.77 (24.17)
94.20 (100)
89.91 (79.70)
22.90 (20.30)
112.81 (100)
Total: 361.74 (91.17)
35.02 (8.83)
396.76 (100)
422.61 (92.38)
34.85 (7.62)
457.46 (100)
Note: Figures are in million. Figures in bracket indicate percentages. Source: Computed from NSSO 55th (1999-2000) and 61st (2004-05) Round Survey on Employment – Unemployment Table 7. Employment growth rates of informal and formal workers by economic activity in India, 1999-00 to 2004-05
Growth Rate (%) Economic Activity Informal
Workers Formal
Workers Total
Workers Agriculture 1.75 -0.18 1.73Industry 6.66 -0.60 5.73Services 4.71 0.12 3.67Total 3.16 -0.10 2.89
Source: Computed from individual level data, NSSO 55th (1999-2000) and 61st (2004-05) Round Surveys on Employment – Unemployment
Since formal employment can largely be expected to be created in the formal/organized sectors of the economy, it is not surprising that the overall decline in formal employment in the economy coexists with decline in formal employment in the organized sector. Between 1999-00 and 2004-05, formal employment in the organized non-agricultural sector declined overall at the rate of 0.32 percent per year. The decline took place across major industry groups such as manufacturing, trade and transport whereas some of the other industry groups such as electricity, finance, real estate and hotels experienced increase in formal employment (Table 8). Some increase also took place in the construction sector, but from a very low base. By comparison, all industry groups experienced increases in informal employment in the organized sector. It is evident that a major restructuring of

71
employment relations is under way in the formal sector of the economy, with new hiring typically being of an informal kind. Table 8. Annual growth rate (%) of informal and formal employment in the organised sector, 1999-00 and 2004-05
Major Industry Group Informal worker Formal worker Total
Manufacturing 9.98 -2.68 4.11
Electricity 5.53 2.82 3.16
construction 7.15 2.47 6.58
Trade 1.57 -10.98 -3.68
Hotels 12.96 1.64 8.44
Transport 4.96 -0.22 1.26
Finance 21.75 3.07 5.49
Real estate 17.5 14.97 15.94
Education 16.66 3.22 6.22
Health 15.66 1.69 4.89
Total Non-agriculture 8.05 -0.32 3.02 Source: Computed from individual level data. NSSO 55th (1999-2000) and 61st (2004-05) Round Survey on Employment – Unemployment Indications of increased Outsourcing and its Gender Implications
The NSS employment – unemployment surveys allow some sub-classification of the vast category of the self-employed workers. For example, these can be further categorized into employers, own account workers and helpers. Further they can be distinguished by place of work. The NSS informal sector enterprise of 1999-00 further allows us to classify self-employed workers who work from their homes into independent self-employed and homeworkers or dependent sub-contract workers. The latter are the homeworkers, also called industrial outworkers, as identified in the ILO Convention No. 177.
While the self-employed organise all facets of their production or service activity, the homeworker manufactures products based on the specifications of the parent enterprise or contractor, which also often supplies the raw material. Under the putting-out system, the

72
homeworkers often have to purchase, repair, and maintain their own tools or machines, bear the costs of some inputs (e.g., garment workers often have to buy their own thread), transportation to and from the contractor or firm, and infrastructure (space, utilities, etc.). Manufacturing or retail companies typically ‘put-out’ labour-intensive work that does not require heavy machinery. Homeworkers, like the self-employed, are not directly supervised, but like the wage workers they typically do not market final products, or negotiate prices.
Of the 68.4 million self-employed non-agricultural workers in the unorganised sector in 1999-2000 about 11 percent were homeworkers (see Table 9). The percentage of homeworkers was much higher among women. Out of nearly 16 million self-employed non-agricultural women about 27.4 percent were homeworkers (ibid.).
Table 9. Number (in million) and percentage of self-employed and homeworkers in non-agricultural unorganised and manufacturing sectors 1999-2000 Status Male Female Total All Workers Self Employed: Independent 49.6 (93.6) 11.1 (72.6) 60.8 (88.9)
Homeworkers 3.4 (6.4) 4.2 (27.4) 7.6 (11.1)
All Self-employed 53.0 (100.0) 15.4 (100.0) 68.4 (100.0) Manufacturing Sector Self-employed: Independent 10.0 (80.0) 4.6 (54.1) 14.6 (69.6)
Homeworkers 2.5 (20.0) 3.9 (45.9) 6.4 (30.4)
All Self-employed 12.5 (100.0) 8.4 (100.0) 21.0 (100.0)
Note: Figures in brackets denote percentage. Source: Computed from individual level data. NSSO 55th (1999-2000) Round Survey on Employment – Unemployment
The incidence of homeworkers was significantly higher in the manufacturing sector and that too among women workers. Homeworking in the manufacturing sector is what can be clearly identified as a system of production often within a global or domestic value chain. As Table 9 shows, among the nearly 21 million manufacturing sector self-employed workers about 32 percent were homeworkers, while among the 8.4 million women manufacturing workers, nearly 46 percent were homeworkers. The predominant mode of homeworking among the manufacturing sector self-employed workers is that of vertical sub-contracting or the most dependent relationship, accounting for about

73
70 percent of the total in 1999-00 (68 percent for men and 71 percent for women) (NCEUS 2007: 59).4
These macro results are well corroborated by industry-specific and micro studies which provide evidence of increased ‘home-workisation’ among female workers, especially in export oriented global value chains such as those in apparel manufacturing, which connects together different forms of waged labour and ‘self-employment’ across the value chain (Mezzadri 2008, Hirway 2010). Mehrotra (2003) summarising the results of a five country study (three in South-east Asia and two in South Asia including India) of homeworkers in selected industries notes an accelerated pace of sub-contracting and feminized home-work in export oriented value chains. Arguing that in clustering theory, there is a ‘high’ and a ‘low’ road to the development of local systems through micro, small and medium enterprises, Mehrotra characterises sub-contracting in the countries of Asia as the ‘dirt road’ as it is driven by the desire of firms to cut costs to bare minimum, and the desire of marginal workers to take up work at any cost. Regular Employment Ceases to be a Signifier of Quality Employment
Regular employment is normally regarded as a signifier of good quality employment since it is more associated with security of employment, higher incomes and social protection. But under the impact of labour market flexibility, this may have begun to change. Table 10. Size and Distribution of the organised and unorganised sector workers by industry and status 2004 – 05 Agriculture Non-agriculture All
Organised Unorganised Total Organised Unorganised Total Organised Unorganised Total
Number of Workers ( Million)
Self-employed 2.3 163.9 166.2 2.9 89.2 92.1 5.2 253.1 258.2
Regular wage employee 1.2 1.6 2.8 41.9 24.8 66.7 43.2 26.4 69.5
Casual labour 2.5 87.4 89.9 11.7 28.1 39.8 14.2 115.5 129.7
Total 6.1 252.8 258.9 56.5 142.1 198.5 62.6 394.9 457.5
Percentage Distribution of Workers
Self-employed 38.1 64.8 64.2 5.1 62.8 46.4 8.3 64.1 56.5
Regular wage employee 20.1 0.6 1.1 74.3 17.4 33.6 69.0 6.7 15.2
Casual labour 41.8 34.6 34.7 20.7 19.8 20.0 22.7 29.2 28.3
Total 100.0 100.0 100.0 100.0 100.0 100.0 100.0 100.0 100.0
Percentage to total 2.4 97.6 100.0 28.4 71.6 100.0 13.7 86.3 100.0
Source: Computed from individual level data. NSSO 55th (1999-2000) and 61st (2004-05) Round Survey on Employment – Unemployment

74
Table 10 shows that nearly 60 percent (43.2 m of 69.5 m) regular /salaried workers in India in 2004-05 were still in the organized sector, and principally in non-agriculture. In the organized non-agricultural sector, regular workers formed 74.3 percent of total employment. Regular employment expanded at an annual rate of 2.53 percent during 2000-2005. But formal employment among such workers contracted at an annual rate of 0.75 percent whereas informal employment expanded at an annual rate of 12.42 percent (Table 11). Table 11. Growth rate of formal and informal employment by type of employment, 1999-00 to 2004-05
Activity Status Informal workers
Formal workers Total
Increase in employment between 1999-2000 & 2004-05 (million)
Self-employed 0.23 0.59 0.82
Regular wage employee 6.01 -1.09 4.92
Casual labour 2.07 0 2.07
Total 8.31 -0.5 7.82
Growth Rate between 1999-2000 & 2004-05 (%)
Self-employed 8.95 6.46 7.01
Regular wage employee 12.42 -0.75 2.53
Casual labour 3.99 0 3.99
Total 8.05 -0.32 3.02 Source: Computed from individual level data. NSSO 55th (1999-2000) and 61st (2004-05) Round Survey on Employment – Unemployment
An analysis of the growth of regular employment in the formal/informal sectors (Table 12) shows that in the informal sector, there was growth of both informal and formal employment (the latter from a very low base) between 2000-2005, with a similar profile in the industries and services sectors. But in the formal/organized sector, formal employment contracted while informal regular employment expanded (at an annual rate of 12.42 percent per year). Thus informal regular employment increased at a rate much higher than the overall growth of employment. Kundu and Sarangi (2007) call this type of expansion of regular waged informal employment as ‘formal informalisation’ which they say was required to meet the demands of globalization on the production system.

75
Table 12. Growth of regular wage employment between 1999-00 and 2004-05 by type of employment and sector
Sector Industry Services Non-agriculture
Informal 5.25 6.19 5.94
Formal 6.55 5.7 5.99
Unorganised sector Total 5.34 6.17 5.94
Informal 13.74 11.39 12.42
Formal -1.81 -0.36 -0.75
Organised sector Total 3.65 2.01 2.53
Informal 8.96 7.61 8.06
Formal -1.39 -0.14 -0.48Total worker (non-agriculture) Total 4.2 3.51 3.72
Source: Computed from individual level data. NSSO 55th (1999-2000) and 61st (2004-05) Round Survey on Employment – Unemployment
The impact of informalisation of regular work has been felt in the form of decline in average real wages of regular/salaried workers as a whole, across rural and urban areas, and male as well as female workers (Table 13). While wages of male regular workers declined by one percent per year between 2000-2005, that of female wages declined at an annual rate of 4.7 percent, probably also reflecting increased female employment in low quality regular employment such as domestic services. Table 13. Growth in Real Wages (at 1993-94 prices) of Regular and Casual Workers, 1999-00 and 2004-05
Category Status Agriculture Non-Agriculture
Regular Salaried -1.44 -0.58
Rural Male Casual workers 1.74 1.04
Regular Salaried 0.32 -10.79
Rural Female Casual workers 1.4 1.89
Regular Salaried -10.92 -0.98
Urban Male Casual workers -1.3 -0.57
Regular Salaried 0.36 -4.7
Urban Female Casual workers -2.38 -0.82 Source: Computed from individual level data. NSSO 55th (1999-2000) and 61st (2004-05) Round Survey on Employment – Unemployment

76
Increased Labour Mobility and Flexible Labour The above changes that we have described are indicative of two types of major changes that
appear to be occurring recently in labour relations in the Indian economy: informalisation, on the one hand, principally of what would have been regular employment in non-farm employment in an earlier context, and incorporation of petty production especially by female homeworkers, in value chains. The third major aspect that we would like to focus upon is increased labour flexibility achieved through mobility of labour, which at the lowest end, could tie seasonal migrant labourers into ‘neobondage’.5
Data from a migration survey carried out by the National Sample Survey Organisation in 2007-08 has recently been released. The data confirms what we already know about migration trends and the deficiency of migration surveys. We have argued elsewhere that these surveys are very poor in capturing short duration and/or seasonal migration (Srivastava 2005a, 2011a, b). This is borne out by the latest survey according to which only 1.7 percent of the rural population and 0.4 percent of the urban population were short duration out-migrants. On the other hand, the survey shows increased seasonal as well as non-seasonal migration (Srivastava 2011b). It further shows increased urban-wards migration, including urban-urban migration; higher migration for employment; higher inter-state migration; positive association of migration both with the level of education and with higher consumption deciles (ibid.).
Data from a large number of field surveys, on the other hand, captures seasonal migration and labour circulation by poor laboring households. This migration differs significantly in terms of duration, distance, and source areas. Seasonal labour migrants predominate in a number of sectors in several states. Although the role of informal networks, voluntary movement and organized recruitment varies between migration streams, in many sectors migration is organized through intermediaries on the payment of advances which are used by the migrant workers to pay off past debts or for consumption needs of the family members left behind during the lean season. The conditions of work, described by us and a number of other authors are poor and coercive and approximate conditions of neo-bondage restricting the movement of workers during the period of contract, and not infrequently, over seasons (Srivastava 2005b, 2009). Thus constrained labour mobility achieves labour flexibility for capital by tying down ever increasing numbers of labourers to contractors and employers. 3. CHANGES IN THE EMPLOYMENT STRUCTURE BETWEEN 2004-05 AND 2009-10
The results of the National Sample Survey Round on Employment–Unemployment for 2009-10 (66th Round) became available when the final version of this paper was being sent for publication. Results from a preliminary analysis of this data have been discussed in this section. These confirm the main trends towards informalisation and flexibilisation brought out in the earlier sections while also indicating some changes in the labour market over this period.
Overall employment grew at only 0.21 percent per annum between 2004-05 and 2009-10, a period of high growth for the Indian economy when real GDP increased at an annual rate of 8.2 percent. The two largest sectors viz. agriculture and manufacturing experienced decline in employment. Agricultural employment declined at the annual rate of 1.71 percent per annum i.e.

77
from 257.8 m to 236.5 m. Manufacturing employment declined from 55.4 million to 52.7 million. On the other hand, employment in the construction sector grew at the rate of 11.27 percent per year between 2004-05 and 2009-10, i.e. from 25.9 million to 44.2 million.
The low rate of growth of employment occurred because of a decline in rural female employment (at a rate of 3.5 percent per year) and a stagnation in female urban employment. This could be accounted for by the decline in employment in both the two largest sectors employing women viz. agriculture and manufacturing.
But while employment stagnated, wages increased at a fairly high rate over this period, both for men and women, and for casual workers as well as regular wage/salaried employees. Urban and rural real wages/salaries for regular/salaried workers grew at the rate of 6.9 percent and 5.1 percent respectively, while urban and rural wages for casual workers grew at rates of 5.6 percent and 7.1 percent respectively over this period. These results needs further analysis but they could be a result of temporary shortages in some sectors as well as higher reservation rural wages due to the operation of the rural employment guarantee scheme, the Mahatma National Gandhi Rural Employment Guarantee Programme (MGNREGP).
However, despite the high GDP growth and wage trends, the trend towards informality continued unabated, as shown below. One of the factors contributing to this was increased casualisation of the workforce. The increase in self-employment noted in 2004-05, which reversed a long term trend towards casualisation, was reversed in 2009-10, with the percentage of casual to total workers in the workforce in increasing from 28.1 in 2004-05 to 32.7 in 2009-10, returning almost to the 1999-00 level (32.8). The re-casualisation of the workforce contributed to the greater flexilibisation and informal nature of employment over this period.
At the same time, however, regular wage/salaried employment increased further from 15.3 percent of the workforce in 2004-05 to 16.5 per cent of the workforce in 2009-10. But this did not help in creating formal employment, as more of this type of employment, too, became informal. The employment surveys of 2004-05 and 2009-10, provide us with two important indicators of informal employment. The first is the contractual status of wage employment. The other is the provision of social security to such workers.
On the basis of the first indicator, there is a clear trend towards increased informal employment with an increase in the percentage of the wage employed without any written job contract, or a job contract of less than one year duration. These results are summarized in Figure 1. The percentage of wage employees without any written job contract increased from 73.2 in 2005-05 to 77.3 in 2009-10. This percentage increased also for the segment of regular wage/salaried workers – from 59.2 to 63.2 over the corresponding period. The percentage of employees without written contracts increased even in those types of establishments or firms which would be expected to be associated with formal employment i.e. organized sector establishments, public limited companies and the government sector. In public limited companies, the percentage of workers without written wage contracts increased from 58 percent to 63.2 percent between 2004-05 and 2009-10, while in the government sector, the corresponding increase was from 26.7 percent to 38.3 percent.

78
Figure 1. Percentage of non-agricultural wage workers in specific segments without any written contract in India, 2004-05 and 2009-10
Source: Computed from individual level data, National Sample Survey Rounds on Employment-Unemployment, 2004-05 and 2009-10
The percentage of workers without contracts has grown both in the organised and organised segments of the economy, using the NCEUS definitions of organised and unorganised sectors (NCEUS 2007). In the organised sector, the percentage of workers without any written contract increased from 53.2 percent to 58.5 percent, while those with long-term contracts (for more than 3 years) declined from 41.7 percent to 33.6 percent.
With the latest round of results, the NSS now provides details of social security coverage for wage workers outside agriculture for three consecutive rounds (1999-00, 2004-05 and 2009-10). While these show an increase in the absolute numbers of workers covered under any social security provision, there is a decline in the percentage of workers so covered to total non-agricultural wage workers. The percentage of all wage workers covered under any social security provision declined from 32.6 in 1999-00 to 28.6 in 2004-05 and further to 26.4 percent in 2009-10 (Table 14). Between 1999-00 and 2004-05, this decline took place due to a decline in the percentage coverage of regular wage employees i.e. their greater informalisation. During 2004-05/2009-10, the further decline took place due to higher casualisation of the workforce, while there was a small increase in the percentage of regular workers covered under formal social security.

79
Table 14. Wage workers outside agriculture and Social Security Status, 1999-00, 2004-05 and 2009-10
Wage Workers* with social security by activity status
Have any Social Security (in 000) Percentage of Total (%)
Usual Status 1999-00 2004-05 2009-10
1999-00
2004-05
2009-10
Regular wage employee 28,370 29,840 33,937 50.88 44.7 45.8
Casual labour in public 19 36 165 2.91 5.5 3.6
Casual labour in others 517 540 991 1.60 1.4 1.8
Total 28,907 30,415 35,092 32.59 28.6 26.4
Source: 55th (1999-00), 61st (2004-05) and 66th (2009-10) rounds NSSO Unit Record Data Note: * Wage workers do not include Agriculture sector
But further disaggregation by enterprise type shows a complex picture. The percentage coverage of regular wage employees under social security provisions actually increased in partnership and proprietary firms, but declined in government owned firms and in public limited companies. In the government sector, the percentage of regular workers covered by social security provisions remained the highest among enterprise types but declined from 87.23 to 86.03 percent, while in public limited companies, the percentage share of regular employees under social security declined from 61.22 percent to 58.05 percent. Thus the decline in the percentage of wage workers in non-agriculture under any form of social security coverage has occurred both due to casualisation of the workforce and due to increased informalisation of the regular employees in government sector and in public limited companies. Trends in Employment as Homeworker, 1999-00 to 2009-10
The increased trend towards the incorporation of petty production in global or domestic value chains due to outsourcing and in order to take advantage of the structural vulnerability of such labour was noted earlier in Section 1.5 of this paper. The 2009-10 survey, like the 1999-00 survey, collected information on non-agricultural home-based self-employed workers producing wholly or mainly under given specification (i.e. homeworkers), enabling us to compare the changes in the
80
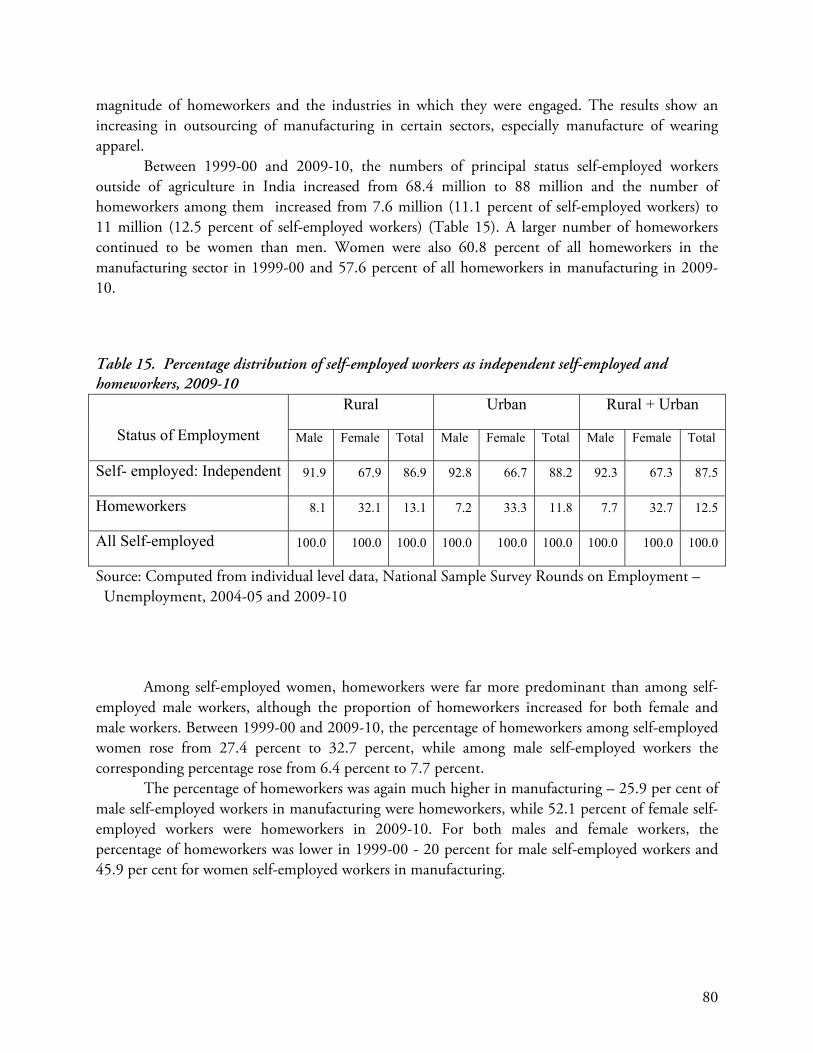
magnitude of homeworkers and the industries in which they were engaged. The results show an increasing in outsourcing of manufacturing in certain sectors, especially manufacture of wearing apparel.
Between 1999-00 and 2009-10, the numbers of principal status self-employed workers outside of agriculture in India increased from 68.4 million to 88 million and the number of homeworkers among them increased from 7.6 million (11.1 percent of self-employed workers) to 11 million (12.5 percent of self-employed workers) (Table 15). A larger number of homeworkers continued to be women than men. Women were also 60.8 percent of all homeworkers in the manufacturing sector in 1999-00 and 57.6 percent of all homeworkers in manufacturing in 2009-10. Table 15. Percentage distribution of self-employed workers as independent self-employed and homeworkers, 2009-10
Rural Urban Rural + Urban
Status of Employment Male Female Total Male Female Total Male Female Total
Self- employed: Independent 91.9 67.9 86.9 92.8 66.7 88.2 92.3 67.3 87.5
Homeworkers 8.1 32.1 13.1 7.2 33.3 11.8 7.7 32.7 12.5
All Self-employed 100.0 100.0 100.0 100.0 100.0 100.0 100.0 100.0 100.0
Source: Computed from individual level data, National Sample Survey Rounds on Employment –Unemployment, 2004-05 and 2009-10
Among self-employed women, homeworkers were far more predominant than among self-employed male workers, although the proportion of homeworkers increased for both female and male workers. Between 1999-00 and 2009-10, the percentage of homeworkers among self-employed women rose from 27.4 percent to 32.7 percent, while among male self-employed workers the corresponding percentage rose from 6.4 percent to 7.7 percent.
The percentage of homeworkers was again much higher in manufacturing – 25.9 per cent of male self-employed workers in manufacturing were homeworkers, while 52.1 percent of female self-employed workers were homeworkers in 2009-10. For both males and female workers, the percentage of homeworkers was lower in 1999-00 - 20 percent for male self-employed workers and 45.9 per cent for women self-employed workers in manufacturing.
81
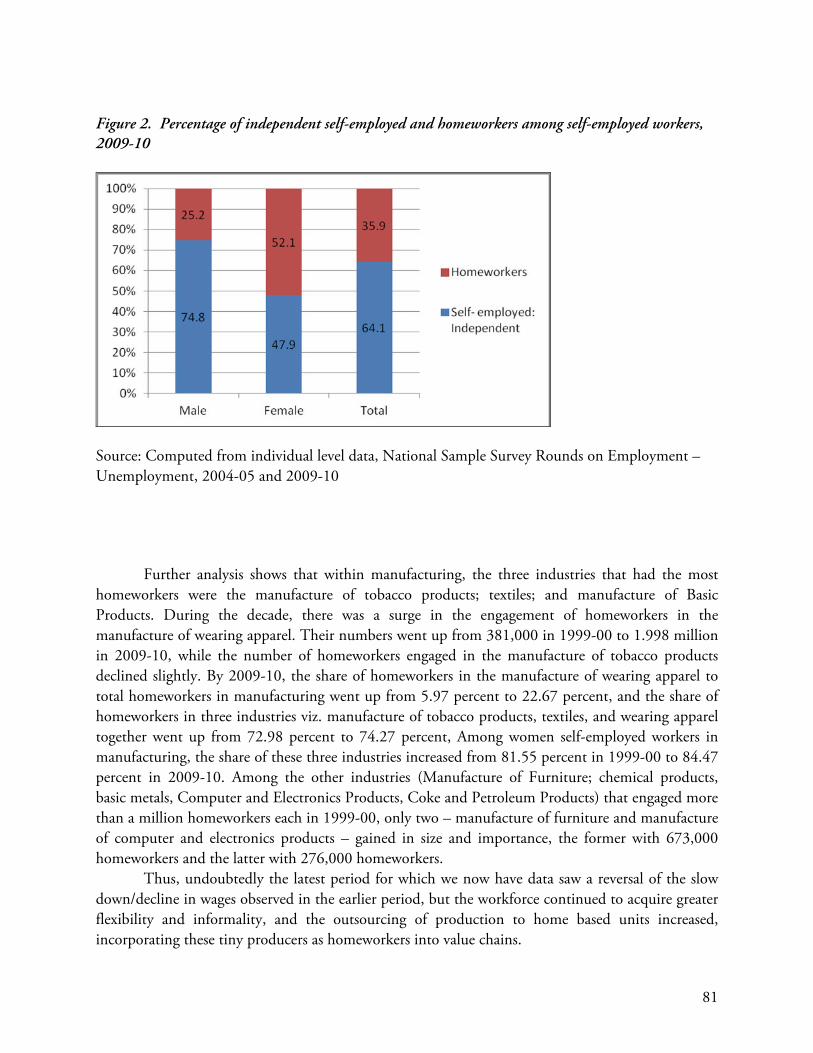
Figure 2. Percentage of independent self-employed and homeworkers among self-employed workers, 2009-10
Source: Computed from individual level data, National Sample Survey Rounds on Employment –Unemployment, 2004-05 and 2009-10
Further analysis shows that within manufacturing, the three industries that had the most homeworkers were the manufacture of tobacco products; textiles; and manufacture of Basic Products. During the decade, there was a surge in the engagement of homeworkers in the manufacture of wearing apparel. Their numbers went up from 381,000 in 1999-00 to 1.998 million in 2009-10, while the number of homeworkers engaged in the manufacture of tobacco products declined slightly. By 2009-10, the share of homeworkers in the manufacture of wearing apparel to total homeworkers in manufacturing went up from 5.97 percent to 22.67 percent, and the share of homeworkers in three industries viz. manufacture of tobacco products, textiles, and wearing apparel together went up from 72.98 percent to 74.27 percent, Among women self-employed workers in manufacturing, the share of these three industries increased from 81.55 percent in 1999-00 to 84.47 percent in 2009-10. Among the other industries (Manufacture of Furniture; chemical products, basic metals, Computer and Electronics Products, Coke and Petroleum Products) that engaged more than a million homeworkers each in 1999-00, only two – manufacture of furniture and manufacture of computer and electronics products – gained in size and importance, the former with 673,000 homeworkers and the latter with 276,000 homeworkers.
Thus, undoubtedly the latest period for which we now have data saw a reversal of the slow down/decline in wages observed in the earlier period, but the workforce continued to acquire greater flexibility and informality, and the outsourcing of production to home based units increased, incorporating these tiny producers as homeworkers into value chains.

82
4. IMPLICATIONS FOR DECENT WORK IN INDIA IN THE CURRENT GLOBAL SCENARIO
The detailed conditions of work of the different segment of workers in India have been discussed recently in the NCEUS Report on Conditions of Work (NCEUS 2007). The report has discussed the quality of work, including issues of employment security, remuneration, working hours, safety and health, and social security of waged and self-employed workers. NCEUS (2009) has further dwelt on dimensions of the quality of work in the Indian context.
As described by us above, and also discussed in the NCEUS (2007) report, there is a blurring of distinction between wage workers and the own account workers with growth in the category of the home workers, especially women workers in the manufacturing sector. The quality of work has also declined for regular workers. Increased informalisation has implied lack of social security and contractual security for even this category of workers. Thus, among workers, who are directly or indirectly linked to employers, vulnerability is no longer confined to casual or contract labourers but also encompasses home workers and the low paid informal regular workers. The increased flexibilisation of labour and extraction of surplus value through lengthening of working hours, greater seasonal mobility, poor working conditions, denial of social security, even where it is due under legislation, is part of capital’s global strategy, and portrays its increased assertiveness.
It is worth noting that the evidence presented in this paper is not confined to sectors directly incorporated in Global Value Chains (GVC) or directly competing with global production. Some amount of attention has been focused earlier on the possibility of what has been described as ‘social upgrading’ within Global Production Networks (GPN) (see, for example, studies in Nathan and Posthuma 2010a). Social upgrading is considered to incorporate the four key pillars of decent work viz. employment, standards and rights at work, social protection, and social dialogue (Gereffi and Guler, 2010). The question of a ‘high road’ versus a ‘low road’ can be examined both in the context of economic as well as social upgrading. In general, since outsourcing occurs in order to take advantage of low labour costs and the passing down of risks to the lower tier firms and eventually to labour, and since firms at the bottom of the ladder face cut-throat global competition, the possibility that GVC entails a ‘race to the bottom’ are very high. Even if economic upgrading takes place, it may not necessarily lead to the latter. This is shown by case studies across some of the major sectors such as garments, leather manufacture, and automotive components (Damodaran 2010, Suresh 2010, Gereffi and Guler 2010). Even in sectors such as ICT where economic upgrading occurs and a higher level of skills are required, ‘bad’ employment may still be produced, though to a lesser extent (Upadhya 2010, Sarkar and Mehta 2010). But outcomes can, and do, vary, and this depends upon a number of factors such as domestic policy, labour market structures and interventions, labour organization, consumer voice, and firm strategies influenced by some of the above (Nathan and Posthuma 2010b, Tewari 2010). Firms can move on the ‘high road’ and still be gainers (Tewari ibid.).
Various options and strategies are being attempted in order to upgrade labour in GPNs. The operation of ‘voluntary codes of conduct’ which include labour standards and which are subject to audits by buyers, NGOs and/or trade unions can succeed in stimulating discussion and awareness on comparable labour standards, but given the context of competition and long commodity chains,

83
ending in homework, can hardly succeed in enforcing these outside the larger enterprises which might employ labour under more decent condition (note the growth of sweat shops in developed countries themselves).6 While trying to influence the policies of the principal buyer firms towards upgrading of labour, and also influence states in taking a coordinated approach towards issues such as minimum working conditions, trade union strategies can also try to work directly with these workers and exert pressure on lower tier firms and contractors from below. Tewari (2010) shows that such a strategy has been adopted by the New Trade Union Initiative in India.
However, the challenge of decent work is not confined to the Global Production Networks. While alternative trajectories exist for firms and establishments outside the GPNs, both capital and the state in India reproduce the conditions through which social downgrading and the ‘low road’ predominate. One of the principal ways in which the Indian state has done this is to encourage further labour market deregulation. This has been done through a retreat of labour market regulation and has been discussed in detail in NCEUS (NCEUS 2007, chapter 11) and in a compendium of studies on labour regulation in India by the Institute for Studies in industrial Development (Papola, 2008). Low labour costs and flexible labour are seen to encourage foreign and domestic capital accumulation, but naturally this encourages capital to take the ‘low route’.
As a counter strategy, the NCEUS (2007, 2009) proposed a ‘social floor’, which cuts across all sectors, comprising a universal minimum wage linked to a subsistence norm, some minimum provisions for social security, and a comprehensive legislation for working conditions, which would include segments of disadvantaged workers such as migrants and women homeworkers.7 The principal strength of the NCEUS recommendations has been to show that such a strategy was administratively and financially feasible. The NCEUS strategy could be attractive to the large proportion of those workers who are below the proposed ‘social floor’ and has already become an important tool for advocacy and pressure with civil society and workers organizations who have been mobilizing on a decent work agenda. But worker unions need to develop consensus on the level and constituents of the ‘floor’ and strategise on how such a strategy would not be used to gradually push segments of workers above this ‘floor’ to the minimum level constituted by the social ‘floor’.8
However, the NCEUS strategy faces strong opposition from neoliberal advocates among academics and policy makers because they see the strategy striking at the heart of a cheap and flexible labour strategy, which in turn is believed to lie at the heart of global competitiveness.9
Given that the poverty and vulnerability of the working class in India also arises from the low productivity of petty commodity production, whether agriculture or non-agriculture, the NCEUS in its two major reports as well as its other reports has also proposed a set of measures which aim to increase economic space available to small producers while at the same time increase their productivity and bring benefits of scale economies to them wherever possible. These measures are summarized in the Commission’s final report (NCEUS, 2009). These supportive policies are to be complemented by a number of entitlements in the sphere of health, education, food, employment, social security and housing, which form the core of a rights based approach to development. In India, such an approach has taken root to some extent with legal entitlements being created in some areas. This has had implications for public expenditure, as pointed out by us elsewhere (Srivastava 2008). The movement towards the realization of these rights is positive but very slow and tortuous.

84
It has to be recognized that advances in building labour standards and social entitlements have generally not been acceptable to the Indian capitalist class and its global partners since it implies a much greater degree of social regulation and public expenditure and also, as discussed earlier, less flexible labour. Globally competitive conditions and rapid capital accumulation, it was and is widely believed by capital, is promoted by a ‘race to the bottom’. This has promoted ever increasing inequality. For the large part, till recently, global capital could continue to pursue its strategy of accumulation in this fashion as it was abetted by a speculative international financial regime. In this context, an alternative paradigm which would have greater international acceptability and which was built on new rules of the game was required.
Alternative discourses to the neo-liberal paradigm have however, gained much greater acceptability in the aftermath of the 2008 economic crisis and have reinforced the role of domestic demand in stimulating revival and long term growth. This has made measures to improve demand at the bottom of the pyramid through extension of social protection, as well income distribution measures more acceptable globally (ILO 2010, 2011, Stiglitz 2009). These changes have also come at a time when countries in the global South such as Brazil and others in South America, and South Africa, had already begun to undertake significant social welfare measures which partly diluted neoliberal orthodoxy. Even countries like China, which were pursuing a model of classical capitalist accumulation had begun to change their stance.10
The challenge to neoliberal orthodoxy, although not deeply radical, is certainly deeper today than at any time in the past quarter of a century and this gives greater space to the laboring classes and provides a greater possibility of improving labour’s prospects for decent work and a decent life.
ACKOWLEDGEMENTS
This paper was initially presented in the panel on ‘Contemporary and Historical Aspects of Labour Regulations and Labour Standards’ at the 21st European Conference on Modern South Asian Studies, Bonn. July 2010. Comments from participants in the Conference, Jens Lerche, and the referees are gratefully acknowledged. NOTES 1. The argument that increased casualisation implies deterioration in the quality of work is, however, not universally accepted, at least when examined from the prism of wages and earnings. For example, according to Sundaram (2001), increased casualisation in the 1990s was accompanied by increase in productivity and wages, and reduction in poverty. Of course, this and similar analysis are restricted to only one dimension of quality viz. remuneration.

85
2. Standing divides global labour flexibility into five main categories: wage system flexibility, labour cost flexibility, employment (numerical) flexibility, work process flexibility and job structure flexibility. Each of them may be subdivided, e.g. ‘employment flexibility’ includes employment of migrant labour, labour circulants, labour contract workers, outworkers, sub-contractors and employed labour reserves (Standing 1999). 3. Studies in India do not use a standard definition of the informal sector or of informal employment. The NSS, in its 1999-00 informal sector survey has defined the sector as consisting of all proprietary and partnership unincorporated enterprises, with no employment ceiling. Individual studies of informal employment such as those of Sundaram (2008) and Kundu and Sarangi (2007) use definitions of informal employment which differ in detail from that employed by the NCEUS. However, the NCEUS definition represents the most careful effort in harmonizing the ILO definitions to Indian conditions and this definition has also been used in this paper. 4. The employment status of the self-employed workers and the homeworkers can be considered to be along a continuum of dependence, from being completely independent to being fully dependent on the contractor/middleman for design, raw material and equipment and being unable to negotiate the price of the product. Within this continuum of dependence, the literature on industrial subcontracting distinguishes between two types of ‘business arrangements’, one that contracts out production without providing raw materials and the other that provides raw materials etc. (Watanabe 1983). The latter is called ‘vertical subcontracting’, and tends to create more of a dependent relationship and, except for lack of supervision, the homeworker is closer to a wage worker. 5. Conditions of labour in which the degree of unfreedom and adversity facing the labourers may vary, but features of labour bondage can be identified, have been referred to as ‘neo-bondage’. These conditions often exist among seasonal migrants due to advances and debt taken from contractors (see Srivastava 2009). 6. See NCEUS (2007), Barrientos, Mathur and Sood (2010) and Mezzadri (this volume). 7. This is analogous to the concept of socio-economic floor comprising a certain minimum level of social protection advocated by the World Commission on the Social Dimension of Globalization (ILO 2004). See also, van Ginneken (2009). 8. The implications of extension of social protection for the poor in the informal sector are similar to those noted by Barrientos (2009) in the case of Brazil. 9. See, for example, Deepak Lal (2007), ‘Economic Atavism’, Business Standard, April 17. 10. The extension of social protection in these countries and in several other developing countries is documented in a number of studies, which also note how this extension is seen as a macro-

86
developmental strategy. See, for instance, Barrientos and Hulme (2008), Chen and Barrientos (2006), Zhu and Lin (2010), Barrientos and Santibanez (2009). At an information session organized by the International Social Security Association during the 100th International Labour Conference in Geneva in 2011, representatives of BRICS countries noted the extension of social protection undertaken in their countries through various flagship programmes. BRICS countries lead the way in social security extension (ISSA, 15 June 2011, News, http://www.issa.int/News-Events/News2/BRICS-countries-lead-the-way-in-social-security-extension, accessed June 30, 2011). REFERENCES Barrientos, A. (2009) ‘Labour Markets and the (Hyphenated) Welfare Regime in Latin America’,
Economy and Society 38(1): 87-108. Barrientos, S., Mathur, K. and Sood, A. (2010) ‘Decent Work in Global Production Networks:
Challenges for Vulnerable Workers in the Indian Garment Sector’, in A. Posthuma and D. Nathan (eds) (2010a) Labour in Global Production Networks in India (pp. 127-145). New Delhi: Oxford University Press.
Barrientos, A. and Claudio, S. (2009) ‘New Forms of Social assistance and the Evolution of Social
Protection in Latin America’, Journal of Latin American Studies 41(1): 87-108. Barrientos, A. and Hulme, D. (2008) ‘Social Protection for the Poor and Poorest in Developing
Countries: Reflections on a Quiet Revolution’, BWPI Working Paper 30, The University of Manchester: Brooks World Poverty Institute.
Chang, D. (2009) ‘Informalising Labour in Asia’s Global Factory’, Journal of Contemporary Asia
39:2: 161-179. Chen, J. and Barrientos, A. (2006) ‘Extending Social Assistance in China: Lessons from the
Minimum Living Standard Scheme’, CPRC Working Paper 67, Chronic Poverty Research Centre, University of Manchester.
Damodaran, S. (2010) ‘Upgradation or Flexible Casualisation? Exploring the Dynamics of Global
Value Chain Incorporation in Indian Leather Industry’, in A. Posthuma and D. Nathan (eds) (2010a) Labour in Global Production Networks in India (pp. 231-250). New Delhi: Oxford University Press.
Deshpande, L. K. (2001) ‘Labour Flexibility in India’, The Indian Journal of Labour Economics
44(3): 389-412.

87
Gereffi, G. and Guler, E. (2010) ‘Global Production Networks and Decent Work in India and
China: Evidence from the Apparel, Automotive, and Information Technology Industries’, in A. Posthuma and D. Nathan (eds) (2010a) Labour in Global Production Networks in India (pp. 103-126). New Delhi: Oxford University Press.
ILO (2011) World Social Security Report 2010/11: Providing Coverage in Times of Crisis and Beyond.
Geneva: ILO. ILO (2010) ‘Employment and Social Protection Policies From Crisis to Recovery and Beyond: A
Review of Experience’, An ILO Report to the G20 Labour and Employment Ministers Meeting, Washington, DC, 20-21 April 2010. Geneva: ILO.
ILO (2004) ‘A Fair Globalization: Creating Opportunities for All’, Report of the World
Commission on the Social Dimension of Globalization. Geneva: ILO. Kundu, A. and Sarangi, N. (2007) ‘Dynamics of Labour Market under Globalisation: Changing
Characteristics of Informal Employment in India’, The Indian Journal of Labour Economics 50(2): 201-216.
Mahadevia, D. (1998) ‘Informalisation of Employment and Incidence of Poverty in Ahmedabad’,
The Indian Journal of Labour Economics 41(3): 515-530. Mehrotra, S. (2003) ‘Protecting Labour Locally Against Capital Investing Globally: Informalisation,
Feminisation and Sub-contracted Home Work’, The Indian Journal of Labour Economics 46(3): 421-446.
Mezzadri, A. (2008) ‘The Rise of Neo-Liberal Globalisation and the “New Old” Social Regulation
of Labour: A Case of Delhi Garment Sector’, The Indian Journal of Labour Economics 51(4): 603-618.
NCEUS (National Commission for Enterprises in the Unorganised Sector) (2009) The Challenge of
Employment in India (Parts 1 and 2). New Delhi: Government of India, and New Delhi: Academic Foundation.
NCEUS (National Commission for Enterprises in the Unorganised Sector) (2008) Report on
Definitional and Statistical Issues Relating to the Informal Economy. New Delhi: Government of India, October.
NCEUS (National Commission for Enterprises in the Unorganised Sector) (2007) Conditions of
Work and Promotion of Livelihoods in the Unorganised Sector. New Delhi: Government of India and New Delhi: Academic Foundation, August.

88
Papola, T.S. (ed.) (2008) Labour Regulation in Indian Industry, vols 1 to 10. New Delhi: Bookwell
Publishers. Posthuma, A. and Nathan, D. (eds.) (2010a) Labour in Global Production Networks in India. New
Delhi: Oxford University Press. Posthuma, A. and Nathan, D. (2010b) ‘Conclusion’, in A. Posthuma and D. Nathan (eds) (2010a)
Labour in Global Production Networks in India (pp. 348-371). New Delhi: Oxford University Press.
Sarkar, S. and Singh Mehta, B. (2010) ‘Global Production Networks and Decent Work: Recent
Experience in India and Global Trends’, in A. Posthuma and D. Nathan (eds) (2010a) Labour in Global Production Networks in India (pp. 321-347). New Delhi: Oxford University Press.
Srivastava, R. (2005a) ‘India: Internal Migration and its links with Poverty and Development’, in I.
Pinto-Dobernig (ed) Migration, Development and Poverty Reduction in Asia (pp. 109-126). Geneva: International Organization for Migration.
Srivastava, R. and Saskikumar, S.K. (2005b) ‘An Overview of Migration in India, Its Impacts and Key
Issues’, in T. Siddiqui (ed) Migration and Development: Pro-poor Policy Choices (pp. 157-216). Dhaka: The University Press.
Srivastava, R. (2008) ‘Towards Universal Social Protection in India in a Rights Based Paradigm’, Indian
Journal of Human Development 2(1): 111-132. Srivastava, R. (2009) ‘Conceptualising Continuity and Change in Emerging Forms of Labour Bondage
in India’, in J. Breman, I. Guerin and A. Prakash (eds.) India’s Unfree Workforce: Of Bondage Old and New (pp. 129-146). New Delhi: Oxford University Press.
Srivastava, R. (2011a) ‘Labour Migration in India: Recent Trends, Patterns and Policy Issues’, The
Indian Journal of Labour Economics 54 (3): 411-440. Srivastava, R. (2011b) Internal Migration in India: An Overview of its Features, Trends, and Policy
Challenges. New Delhi: UNESCO, Social and Human Sciences Sector and UNICEF. Standing, G. (1999) Global Labour Flexibility: Seeking Redistributive Justice. London: Macmillan
Press. Stiglitz, J. (2009) ‘The Global Crisis, Social Protection and Jobs’, International Labour Review
148(1-2): 1-13.
89
Sundaram, K. (2001) ‘Employment and Poverty in 1990s: Further Results from NSS 55th Round
Employment-Unemployment Survey, 1999-2000’, Economic and Political Weekly, August 11: 3039-3049.
Sundaram, K. (2008) ‘Employment, Wages and Poverty in the Non-Agricultural Sector: All-India,
2000-05’, Economic and Political Weekly, May 31: 91-99. Suresh T.G. (2010). ‘Cost Cutting Pressures and Labour Relations in Tamil Nadu’s Automobile
Components Supply Chain’, in A. Posthuma and D. Nathan (eds) (2010a) Labour in Global Production Networks in India (pp. 251-271). New Delhi: Oxford University Press.
Tewari, M. (2010) ‘Footloose Capital, Intermediation, and the Search for the High Road in Low-
wage Industries’, in A. Posthuma and D. Nathan (eds) (2010a) Labour in Global Production Networks in India (pp. 146-166). New Delhi: Oxford University Press.
Unni, J. and Lu, M. (2007) ‘Informal Employment in India and China’, The Indian Journal of
Labour Economics 50(3): 531-540. Upadhya, C. (2010) ‘Taking the High Road? Labour in the Indian Software Outsourcing Industry’,
in A. Posthuma and D. Nathan (eds) (2010a) Labour in Global Production Networks in India (pp. 300-322). New Delhi: Oxford University Press.
Van Ginneken, Wouter (2009) ‘Social Security and the Global Socio-economic Floor: Towards a
Human Rights-based Approach’, Global Social Policy 9(2): 228-245 Watanabe, S. (ed.) (1983) Technology, Marketing and Industrialisation: Linkages Between Large and
Small Enterprises. Delhi: Macmillan. Zhu, Y. and Lin, L. (2010) ‘The Mobility Patterns of Rural-urban Migrants and Their Social
Protection in China: Beyond the Extension of Urban-based Approaches’, SPA Working Papers 2010, IDS, Sussex.
BIOGRAPHICAL NOTE RAVI SRIVASTAVA is Professor of Economics at the Centre of Regional Development, Jawaharlal Nehru University, New Delhi, India. His major areas of research are labour and employment, migration, poverty, and human development. He was member of the National Commission for Enterprises in the Unorganised Sector (NCEUS), an independent advisory Commission set up by

90
the government of India between 2004 and 2009 to study the informal economy and informal employment and to make appropriate recommendations.