Changing audience preferences : the Indian experience
26
This document is downloaded from DR‑NTU (https://dr.ntu.edu.sg) Nanyang Technological University, Singapore. Changing audience preferences : the Indian experience Chandrasekhar, B. S. 1998 Chandrasekhar, B. S. (1998). Changing audience preferences : the Indian experience. In AMIC‑CBA‑SCS/NTU Conference on Public Service Broadcasting: Thriving in a Diverse Broadcasting Environment, Singapore, Feb 20‑21, 1998. Singapore: Asian Media Information and Communication Centre. https://hdl.handle.net/10356/80013 Downloaded on 17 Mar 2022 05:20:12 SGT
Transcript of Changing audience preferences : the Indian experience

This document is downloaded from DR‑NTU (https://dr.ntu.edu.sg)Nanyang Technological University, Singapore.
Changing audience preferences : the Indianexperience
Chandrasekhar, B. S.
1998
Chandrasekhar, B. S. (1998). Changing audience preferences : the Indian experience. InAMIC‑CBA‑SCS/NTU Conference on Public Service Broadcasting: Thriving in a DiverseBroadcasting Environment, Singapore, Feb 20‑21, 1998. Singapore: Asian MediaInformation and Communication Centre.
https://hdl.handle.net/10356/80013
Downloaded on 17 Mar 2022 05:20:12 SGT

CHANGING AUDIENCE PREFERENCES: THE INDIAN EXPERIENCE
By
B.S. CHANDRASEKHAR
Paper No. 16
ATTENTION: The Singapore Copyright Act applies to the use of this document. Nanyang Technological University Library
Thriving in a Diverse Broadcasting Environment
Changing Audience Preferences - The Indian Experience - B.S.Chandrasekhar
Television came to India in a very small way in 1959. In the 1960s and 1970s the expansion was very slow and by 1982 the terrestrial signals covered only 25 percent of the population living in and around the four metropolitan cities and three other big cities and the television ownership was limited to few urban upper middle class families. Using an Indian Satellite (INSAT-1A) for networking a National service was started in 1982 and this also heralded faster expansion through low power transmitters. In the next five years the coverage increased to 70 percent of the population. In 1980 there were just 1.5 million TV homes, by 1985 it had increased to 6.8 million and by 1990 to 27.8 million. Now there are about 60 million TV homes in the country.
Language Diversity
India is a country of diversity and Anthropologists have identified more than 50 different ethno-linguistic regions within the country. These differences to some extent are being narrowed down by education and modernisation. But language is the vehicle of communication and there are many distinct and well developed languages each spoken in a particular geographical region. Hindi, the national language, with its many regional ariations. is the mother tongue of only 40 percent or 337 million people and the number speaking some of the other languages (according to 1991 census) are:
Bengali 70 million
Telugu 66 million
Marathi 62 million
Tamil 53 million
Gujarati 41 million
Kannada 33 million Malayalam 30 million
Oriya 28 million
Punjabi 23 million
Assamese 13 million
Hindi speakers are spread over six states but each of the ouier language is the dominant language of a single state. There is no doubt 'unity in diversity' as our first Prime Minister described which has been further strengthened by national institutions like the Parliament, the Judiciary, the Bureaucracy and the Railways. But still the fact is that there is no such thing as a 'national audience' which could be reached by a mass medium like television.
* Director. Audience Research. Doordarshan India. New Delhi.
ATTENTION: The Singapore Copyright Act applies to the use of this document. Nanyang Technological University Library

The English and the Regional language newspapers have clearly defined areas of influence. A newspaper published from Delhi may have some readers in other regions but the newspaper readers in each region in general will patronise the one that is published in that region and covers news of that region. Radio has larger reach than the print medium but each radio station relays only some news bulletins from Delhi and concentrates on programmes which are locally relevant and which will appeal to the audience of that area.
National and Regional Television
Television in the early years followed the radio pattern of a few fully autonomous services catering to the needs of local audiences. The terrestrial broadcasts restricted the reach of any single service and creation of sufficient number of such services to cover die entire country would have required large investments. So priority was given to developing a single all India service which could be available to the largest number. This service included Hindi feature films, mythological serials and sports (especially cricket) which could cut across all language barriers, but in respect of other programmes major sections of the television viewing populations were left out.
The television networks the world over have been catering to diverse tastes and preferences. Such diversity comes from socio-demographic factors like sex. age. education, social status and occupation and a properly planned programme schedule could take care of these diverse tastes. But in India the region or the language spoken at home adds a new dimension. This central versus the regional dilemma is comparable to the imported versus the local programmes problem many other countries face.
Economic Development
India is described as a developing country. There has been sustained efforts at economic development over the last five decades and a large section of the population has moved from the rural to the urban areas and in the urban areas and to some extent even in the rural areas there is a fast growing middle class.
As a result of mis urbanisation and improvements in the educational and economic status of a large section of die population mere is an emergence of three distinct classes in each region. Market researchers identify these classes as traditional, upwardly mobile and modern. These are not water-tight compartments and there are no clear boundary walls and one class easily merges into another. Traditional and modern may not be the correct descriptions but for the limited purpose of understanding the audience for television this classification may be useful.
ATTENTION: The Singapore Copyright Act applies to the use of this document. Nanyang Technological University Library
These percentages are rough indicators as of 1998 but in the early 1980s there could have been a larger percentage in the first group.
Regional Services
In the eighties there was only one National television service which attempted to cater to all these three sections. The focus was on information and education and entertainment programmes were limited to a single fiction based programme each day and feature films on week ends. There were no separate programmes for the non-Hindi speaking areas except for isolated telecasts which could be received in and around a limited number of state capitals. In the second stage of television development studios were established in the state capitals and independent programmes including news bulletins were introduced in all die major languages. But diese telecasts were still limited to die capital cities and other areas in the same state continued to receive programmes originated from Delhi. Uplinking facilities were provided to Regional services in a phased manner so mat all the transmitters in a particular state could receive die programmes in the language of diat area. This process was completed by die early nineties. The same terrestrial transmitters have to be used for both the National and Regional telecasts and the later were limited to telecasts for 3-4 hours a day in the early evenings. With diis arrangement die traditional segment was mosdy covered diough die quantum of entertainment programmes in non-Hindi languages continued to be on a low side.
Second Channel
The need for a parallel service for the urban audience was realised around 1985 and to begin with a second channel was provided at the four metropolitan cities of Delhi, Mumbai, Chennai and Calcutta. But these services have to depend mostly on in-house productions as
Traditional
Hindi (30)
No Hindi (30)
Upwardly Mobile
Hindi & English (20)
Hindi but No English (10)
Modern
English (10)
In brief the traditional segment has very strong regional or language identities. The upwardly mobile are more comfortable in the language of the area but can understand another language - Hindi and/or English. The modern is characterised by English education and the interest of this group extend beyond the area of residence.
The total television audience which could be put at 400 million now and which may increase to 500 million in less than five years could be roughly distributed among these three groups in terms of knowledge of Hindi and English in the following way:
ATTENTION: The Singapore Copyright Act applies to the use of this document. Nanyang Technological University Library

There were increasing demands for entertainment programmes as distinct from the public service programmes specially from the audience in the urban areas and these demands could not be met in the then existing setup.
Cable Services
Local cable services exploited this situation with many enterprising people starting cable networks, particularly in the densely populated middle class localities where the cost of cabling could be kept at the minimum. India is the largest producer of feature films and in some regions, particularly in South, these films have always enjoyed great popularity. In Hindi about 160 films are being produced in a year on the average and in Tamil and Telugu also almost an equal number of films are produced. The production in the other two South Indian languages, Malayalam and Kannada, averages to 80 films in a year. The local cable channels depended mostly on these films to increase their reach and with pirated cassettes there was very little expenditure on software. These cable channels again catered mostly to the traditional and to a small extent to the upwardly mobile entertainment hungry sections of the population. This also left out many sections which could not get the type of programmes they wanted to watch.
Satellite Channels
This was the situation when trans-national broadcasters came to India in 1991. These channels saw a large market in India and there was already an infrastructure of cable operators to distribute the channels. The English services could target the modern segment but soon it was found that this was not large enough to attract advertisers' interest and to make the channel commercially viable. When another channel catering to the middle class or the upwardly mobile segment was started, it was an immediate success. This channel had programmes in Hindi or a peculiar type of Hindi with a large mix of English words which the channel thought was nearer to the language spoken by this target group. This channel became extremely popular in the Western and the Northern Indian cities but could not make much headway in the East or the South. The upwardly mobile segment in mis truncated area might have been smaller than the traditional segment in absolute numbers but in terms of the consumers who were being wooed by me producers of premium goods and services in the post-liberation era this was the most important segment of the population. This channel not only got viewership but more importantly it was successful in convincing the advertisers that me channel is reaching the type of viewers they were interested in.
The Hindi channel was followed by channels in the South Indian languages and the Tamil channel was an immediate success. The Tamils have always resisted Hindi and the
ATTENTION: The Singapore Copyright Act applies to the use of this document. Nanyang Technological University Library

people .associated with Tamil films have dominated the politics of Tamil Nadu. Any programme based on Tamil films was sure to attract a large audience in both the urban and rural areas. The Telugu and Kannada channels took some time to attract viewers and advertisers. In some other languages like Malayalam and Bengali there is a demand for programmes but the market in these languages is not big enough to support such a channel.
The success of some channels has naturally brought in competition and the new channels are playing safe bringing in more and more of the same type of film-based and fiction-based programmes with a mix of news and current affairs.
Facing the Challenge
As could be seen, the real challenge for Doordarshan was to reach the upwardly mobile and the modern segments of the population apart from providing more entertainment to the traditional segment. The starting of DD-2 Metro Entertainment Channel was an attempt to reach the middle segment and it was an immediate success as in the very first year of operation it could attract around Rs one billion of advertising. The trans-national satellite channels had to depend on the cable operators but the Metro Channel had die advantage of using terrestrial transmissions. When the channel was started in 1993 in only four cities such facilities were available but within a short time the terrestrial transmissions were expanded to over 40 major cities. However, the programmes on this channel were also in Hindi and the other language segments could not be reached by this channel. Simultaneous telecasts in Tamil helped to some extent increase the reach of the channel.
Another strategy of Doordarshan was to start a number of Regional Language Satellite Services with entertainment programmes targeting both the traditional and the upwardly mobile segments in these language areas. The time sharing arrangement between the National and Regional services severely restricted the time available for entertainment programmes in die regional languages. The satellite transponders allotted to regional services remained idle once the Regional programmes began. The idea was to use these transponders to provide more entertainment programmes in these languages in the prime and non-prime time. The channels are available through cable operators but it has not been possible to persuade the cable operators in many areas to distribute these channels. Only a few of diese channels have been fairly successful.
Thematic Channels
The general interest channels are losing audiences in me West wim die emergence of thematic channels. Some thematic channels have already entered India. Hockey, Football and Cricket have always been popular games in the country and Doordarshan had created mass
ATTENTION: The Singapore Copyright Act applies to the use of this document. Nanyang Technological University Library

interest in Tennis by bringing live the major events like Wimbeldon and the French Opens. However, Doordarshan could not telecast as much sports as the viewers demanded and the Sports channels could exploit this situation.
The international news channels have limited viewership but have niche audience consisting of opinion makers. The Natural History and Geography channel has also loyal viwers among the younger age groups. The Music channels with popular western music albums are reaching another niche group.
It is to be noted that all these channels have to introduce a number of India-based programmes to increase their reach. Only these India-based programmes top the popularity ratings of these channels and they contribute to the major portion of the channels' revenue.
Emergence of the Rural Audience
All the discussions on television centres round the tastes and preferences of the audiences in a few metropolitan cities. There is a high level of cable infiltration in these cities and the cable networks here are capable of carrying a large number of channels. In the recent years there is a wider dispersion of television sets in the rural areas resulting in an emergence of a large rural audience. The growth of television in the rural areas in comparision to urban areas could be seen below:
Television Sets
(in millions)
Urban Rural Total
B&W Colour B&W Colour B&W Colour
1989-90 11.69 4.73 6.07 0.97 17.76 5.70
1995-96 21.46 (Source:
9.89 National Cou
18.43 ncil of Applie
3.11 :d Economic
39.89 Research)
13.0
It is also to be noted mat the Black & White television sets still dominate not just in die rural areas (86%) but even in the urban areas (68%) also. The multi channel homes are still the exception man tlje rule in villages in general but in some states in die South die interest in the regional language satellite programmes have percolated to the rural areas. The following are some figures of cable infiltration in some states:
(source: National council or Applied tconomic Kesearcnj
ATTENTION: The Singapore Copyright Act applies to the use of this document. Nanyang Technological University Library

Cable Homes as percentage of TV homes
Tamil Nadu
Andhra Pradesh
Karnataka
31.6 Uttar Pradesh 8.1
30.1 Rajasthan 7.8
21.8 Bihar 8.7
Conclusions
The Public Service Broadcasting in India started with a chain of television centres each with a measure of autonomy in programming to take into account the regional diversity. The technological developments opened up an alternative which could provide a basic television service over a wide area reaching a large population. But this model could not provide for the diversity of tastes and preferences in a multi-linguistic country. In me later year a balance is being struck between the regional needs, the national priorities and the compulsions of a large market, but this cannot fully satisfy the interests of a large section of the viewers.
The fruits of economic developments have been unevently distributed which has resulted in a large section continuing in the traditional mould, a small section being upwardly mobile and a still smaller section becoming modern.
The public service model gave a lower priority for entertainment which forced a large number to search for alternative sources and this situation was exploited by the cable operators.
The trans-national channels found a large potential market in India but the English language channels could not make much headway. Channels catering to the upwardly mobile sections of the population telecasting in the language spoken by such people have been successful but the success has also brought in competition.
There are niche audiences which could be catered to by thematic channels but even such channels can be successful only with India-based programmes.
There is an emerging rural audience which at present can be catered to by terrestrial channels only.
ATTENTION: The Singapore Copyright Act applies to the use of this document. Nanyang Technological University Library

Thriving in a Diverse
Broadcasting Environment
Cha
ngin
g A
ud
ien
ce P
refe
renc
e
The
Ind
ian
Exp
erie
nce
ATTENTION: The Singapore Copyright Act applies to the use of this document. Nanyang Technological University Library

Div
ersi
ty
The
Co
un
try 3,28
7,00
0 km
2
950
m
846
m)
27 p
erce
nt
Are
a Po
pula
tion
1998
(1
991
Urb
an p
opul
atio
n
Vill
ages
5,
80,7
02
Citi
es
3,60
9
Pol
itica
l D
ivis
ions
D
istr
icts
46
6 U
Ts
7 S
tate
s 25
4m
+ 6
1 m
to
4 m
17
Citi
es 50
T t
o 1
m
614
10 T
to 5
0 T
2,
062
ATTENTION: The Singapore Copyright Act applies to the use of this document. Nanyang Technological University Library

Div
ersi
ty
Lan
gu
ages
(R
epo
rted
Mot
her
To
ng
ue)
Urd
u 43
H
indi
33
7
Punj
abi
Kas
hmiri
M
arat
hi
Guj
arat
i
23
NA
62
41
Telu
gu
Tam
il K
anna
da
Mai
ayal
am
66
53
33
30
Ben
gali
Oriy
a A
ssam
ese
Oth
ers
70
28
13
50
(All
figur
es in
mill
ions
) To
tal
num
ber
of L
angu
ages
: 1,
700
ATTENTION: The Singapore Copyright Act applies to the use of this document. Nanyang Technological University Library
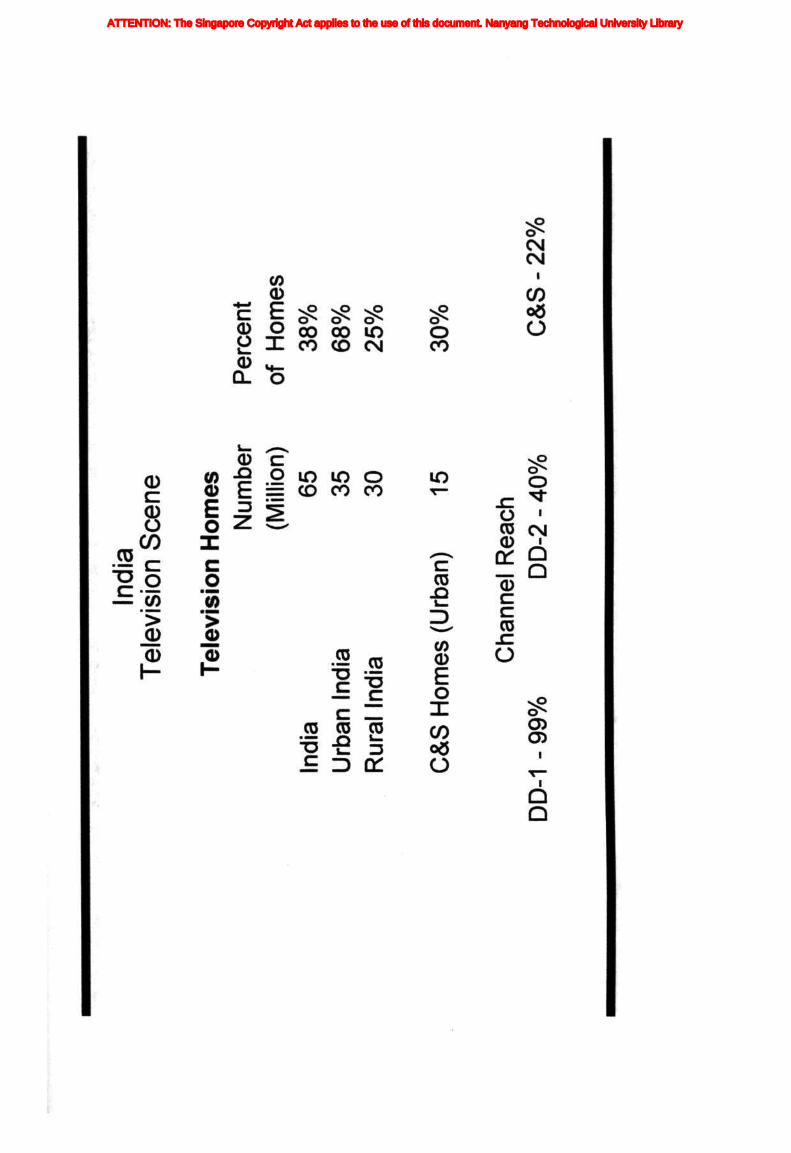
Indi
a Te
levi
sion
Sce
ne
Tele
visi
on H
omes
N
umbe
r (M
illion
) 65
35
30
Indi
a U
rban
Ind
ia
Rur
al I
ndia
Per
cent
of
H
omes
38
%
68%
25
%
C&
S H
omes
(U
rban
) 15
30%
Cha
nnel
Rea
ch
C&
S -
22%
D
D-2
- 4
0%
DD
-1 -
99%
ATTENTION: The Singapore Copyright Act applies to the use of this document. Nanyang Technological University Library

(mill
ions
) 6.
8 27
.8
52.3
65
.0
0.06
0.
24
0.45
1.
55
1965
19
70
1975
19
80
1985
19
90
1995
19
98
TV H
omes
G
row
th
ATTENTION: The Singapore Copyright Act applies to the use of this document. Nanyang Technological University Library

Sig
nal
Rea
ch
(Pri
mar
y S
ervi
ce)
Per
cent
25
25
31
40
36
75
10
Pro
gram
mes
O
nly
Reg
iona
l
Nat
iona
l &
Reg
iona
l O
nly
Nat
iona
l
Nat
iona
l &
Reg
iona
l O
nly
Nat
iona
l
Nat
iona
l &
Reg
iona
l O
nly
Nat
iona
l
Year
1980
1985
1990
1995
(Per
cent
to th
e to
tal p
opul
atio
n)
ATTENTION: The Singapore Copyright Act applies to the use of this document. Nanyang Technological University Library

Div
ersi
ty
Kno
wle
dge
of H
ind
i/En
glis
h
Trad
ition
al
Upw
ardl
y M
obile
M
oder
n
1982
H
indi
(35
) H
indi
& E
nglis
h (1
2)
Eng
lish
(5)
No
Hin
di (
40)
Hin
di -
no
Eng
lish
(8)
1997
H
indi
(30
) H
indi
& E
nglis
h (2
0)
Eng
lish
(10)
N
o H
indi
(30
) H
indi
- N
o E
nglis
h (1
0)
(Per
cent
to to
tal p
opul
atio
n)
ATTENTION: The Singapore Copyright Act applies to the use of this document. Nanyang Technological University Library

Prim
ary
Ser
vice
P
rogr
amm
e P
atte
rn
Lan
gu
age
Co
nte
nt
Nat
iona
l H
indi
(80
%)
New
s &
Cur
rent
Affa
irs,
Par
liam
ent,
Info
rmat
ion,
E
nglis
h (
20%
) D
ram
a, M
usic
, Film
s, S
ports
, S
ocia
l In
form
atio
n, U
nive
rsity
Edu
catio
n.
Reg
iona
l La
ngua
ge o
f N
ews
& C
urre
nt A
ffairs
, S
tate
Leg
isla
ture
, th
e R
egio
n In
form
atio
n, D
evel
opm
ent,
Spe
cial
Aud
ienc
e,
(90%
) D
ram
a, M
usic
, Fi
lms,
Sch
ool E
duca
tion.
Loca
l La
ngua
ge/
Info
rmat
ion,
Dev
elop
men
t, Lo
cal
Issu
es,
dial
ect
of th
e re
gion
(10
0%)
(Per
cent
to tot
al p
rogr
amm
e o
utpu
t)
ATTENTION: The Singapore Copyright Act applies to the use of this document. Nanyang Technological University Library

The E
mer
ging
R
ura
l Audie
nce
Tele
visi
on S
ets
(milli
ons)
U
rban
R
ural
T
otal
1989
16
.42
7.04
23
.46
(70)
(3
0)
1995
31.8
2
21.5
4
53.3
6 (6
0)
(40)
G
row
th
94%
20
6%
127%
(Fig
ures
in b
rack
ets
- pe
rcen
tage
of t
otal
TV
set
s)
(Sou
rce:
NC
AE
R)
ATTENTION: The Singapore Copyright Act applies to the use of this document. Nanyang Technological University Library

B&
Wv
s C
olou
r
Urb
an
Rur
al
B&
W
Col
our
B&
W
Col
our
1989
11
.69
4.73
6.0
7 0.
97
(71)
(2
9)
(86)
(1
4)
1995
21
.93
9.89
18
.43
3.11
(6
9)
(31)
(8
6)
(14)
(Fig
ures
In b
rack
ets
- Pe
rcen
tage
s of
tota
l TV
set
s)
(Sou
rce:
NC
AE
R)
ATTENTION: The Singapore Copyright Act applies to the use of this document. Nanyang Technological University Library

Indi
a C
able
& S
atel
lite
Ch
ann
els
Gen
eral
Ent
erta
inm
ent
Hin
di
Tam
il T
elug
u O
ther
Lan
guag
es
4 3
2 2
Them
atic
Cha
nnel
s S
ports
N
ews
(Indi
an)
New
s (In
tern
atio
nal)
Mov
ies
2 3
2 5
Mus
ic
Chi
ldre
n N
atur
e 2
1 1
ATTENTION: The Singapore Copyright Act applies to the use of this document. Nanyang Technological University Library

Pro
gram
me
Opt
ions
(P
erce
nt o
f TV
Vie
wer
s)
Urb
an
Rur
al
Urb
an+R
ural
45
80
58
25
10
18
5 5
5 25
5
17
(RLS
C -
Reg
iona
l La
ngua
ge S
atel
lite
Cha
nnel
s in
Sou
th I
ndia
n la
ngua
ges.
)
(Est
imat
es f
or J
anua
ry 1
998)
DD
-1 o
nly
DD
-1 &
DD
-2 o
nly
DD
& R
LSC
.
All
maj
or c
hann
els
ATTENTION: The Singapore Copyright Act applies to the use of this document. Nanyang Technological University Library

Cab
le &
Sat
ellit
e in
R
ural
Are
as
15 p
erce
nt a
nd a
bove
T
amil
Nad
u K
arna
taka
A
ndhr
a P
rade
sh
Guj
arat
10
-15
perc
ent
Pun
jab
Ker
ala
Mah
aras
htra
W
est
Ben
gal
Less
tha
n 1
0 pe
rcen
t B
ihar
O
rissa
R
ajas
than
U
ttar
Pra
desh
(Per
cent
of T
V h
omes
-
DD
Aud
ienc
e R
esea
rch
estim
ates
)
ATTENTION: The Singapore Copyright Act applies to the use of this document. Nanyang Technological University Library

(Sou
rce:
Cab
le W
aves
)
Cha
nnel
Sha
re in
al
l TV
Ho
mes
-199
7 M
umba
i
23.4
%
DD
-2
11.6
% Z
ee C
hann
els
7.4%
Cab
le M
ovie
3.
8% S
ony
TV
6.6%
Sta
r C
hann
els
14.4
% O
ther
s
32.9
% D
D-1
ATTENTION: The Singapore Copyright Act applies to the use of this document. Nanyang Technological University Library

Indi
an
Adv
ertis
ing
Vol
ume
51,4
65
31,2
80
1,21
0 4,
800
1,10
0 7,
897
5,17
8
42,6
01
27,2
00
1,10
0 4,
000
1,00
0 5,
801
3,50
0
37,2
49
24,5
00
1,00
0 3,
000
900
5,23
0 2,
619
29,8
02
20,1
00
900
2,50
0 80
0 4,
480
1,02
2
Tota
l P
ress
R
adio
O
utdo
or
Cin
ema
TV
(DD
) TV
(S
at.)
1994
19
95
1996
19
97
(Rs
milli
on)
(Sou
rce:
CA
RA
T I
ndia
)
ATTENTION: The Singapore Copyright Act applies to the use of this document. Nanyang Technological University Library

1997
61
2 9 2 15
10
1994
67
3 9 2 14 7
1985
75
4 6 3 12
Pres
s R
adio
O
utdo
ors
Cin
ema
TV (
Terr
estr
ial)
TV (
Sate
llite
)
Adv
ertis
ing
Sha
re
(Per
cent
ages
) (S
ourc
e: C
AR
AT
Indi
a)
ATTENTION: The Singapore Copyright Act applies to the use of this document. Nanyang Technological University Library
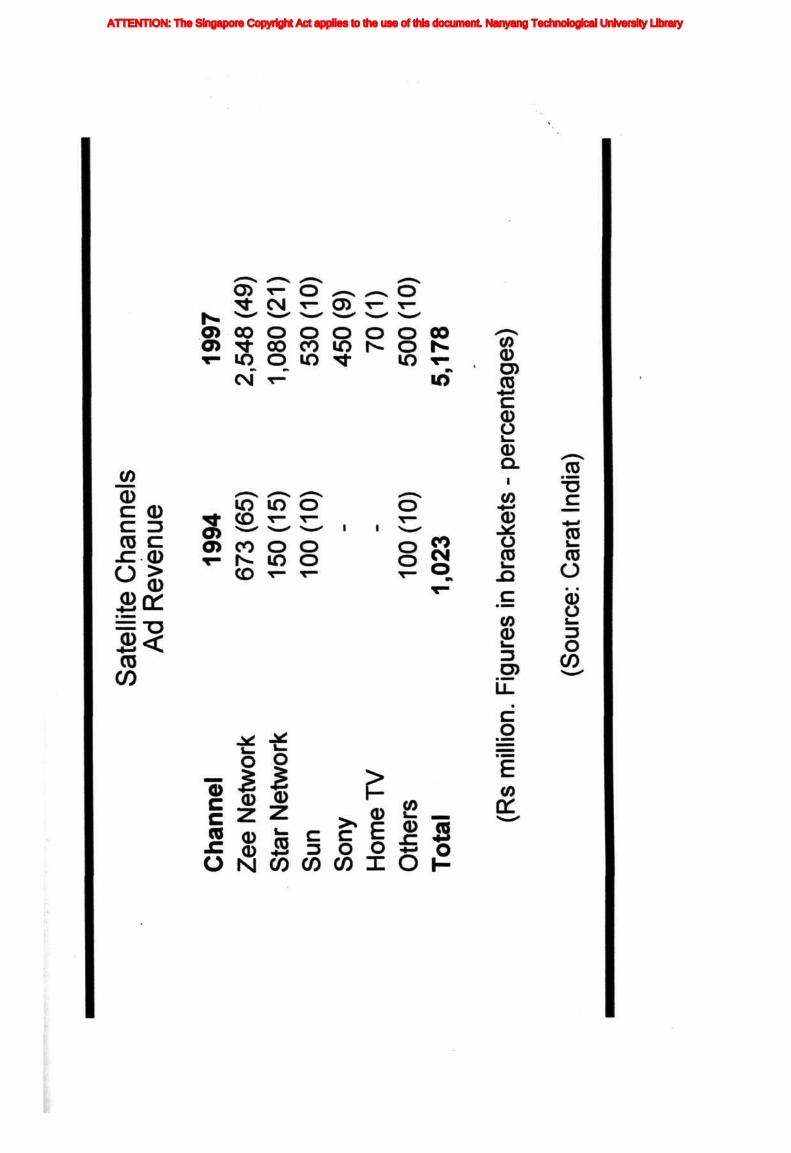
Sat
ellit
e C
han
nel
s A
d R
even
ue
Cha
nnel
Ze
e N
etw
ork
Star
Net
wor
k Su
n So
ny
Hom
e T
V
Oth
ers
Tota
l
1994
67
3 (
65)
150(
15)
100(
10)
100(
10)
1,02
3
1997
2,
548
(49)
1,
080(
21)
530(
10)
450
(9)
70
(1)
500(
10)
5,17
8
(Rs
mill
ion.
Fig
ures
in b
rack
ets
- pe
rcen
tage
s)
(Sou
rce:
Car
at I
ndia
)
ATTENTION: The Singapore Copyright Act applies to the use of this document. Nanyang Technological University Library