Changes to the Energy Mix by 2020 – Medium Term Outlook on Energy Trends
29
Changes to the Energy Mix by 2020 – Medium Term Outlook on Energy Trends Jonathan Robinson, Senior Consultant Enguerran Ripert, Consultant Energy & Power July 13 th , 2010
-
Upload
frost-sullivan -
Category
Business
-
view
5.123 -
download
0
Transcript of Changes to the Energy Mix by 2020 – Medium Term Outlook on Energy Trends
Changes to the Energy Mix by 2020 –Medium Term Outlook on Energy Trends
Jonathan Robinson, Senior Consultant
Enguerran Ripert, Consultant
Energy & Power
July 13th, 2010

2
Focus Points
� Projected Infrastructure Investment
� Timeline of Major Market Issues
� Electricity Generation & Fuel Growth Trends
� Key Gas Trends
� Nuclear Development
� Top 10 Technologies to Watch for in 2020
� Smart Grids
� CCS
� Biogas

3
Projected World Infrastructure Investment 2005-2030
North America
Asia/Oceania
Europe
Source: Morgan Stanley
Middle East
Latin/South America Africa
Water
Power
Road & Rail
Air/Seaports
$22,610bn
$9,000bn
$7,800bn
$1,590bn
Total
0
1,000
2,000
3,000
4,000
0
1,000
2,000
3,000
4,000
5,000
0
100
200
300
400
0
2,000
4,000
6,000
0
200
400
600
800
0
2,000
4,000
6,000
8,000
10,000

4
2010 20202015
Fuel SupplyAnd Costs
Major Issue
World EnergyDemand
Timeline for Major Market Issues
China overtakes the US as the world’s biggest emitter
of CO2
2025 2030
World energy demandalmost double 2000 levels
Growth dominatedby India & China
WorldCO2 emissions
reach 40 Gt
20% renewableenergy in Europe
Demand for liquid fuel falling after 2015
Stationary fuel cellscontribute to
distributed generation
Accelerated investmentin carbon capture
and storage
Electricity generation passes 30,000 billion kWh
Continued accelerationof coal-fired power
Acceleration ofnatural gas
Coal reachesalmost 45% of energy consumption, following
growth in India and China
World Electricity
Generation(billion kWrh)
Source: EIA & Frost & Sullivan
10,000
EnvironmentIssues
20,000
30,000
0
Resurgenceof nuclear
Oil passes$100 per
barrel Growth of natural gaskept in check by high
gas prices
Deceleration andmaturation of EU
Long-runningboom in Russia
2010 20202015 2025
Growth resumedin all regions
Developing economiespass 40% of electricity
demand
Oil dropsto $35 per
barrel
World renewablesgrowth
Potable waterconsumption up
50% on 1995
Boom in ROdesalination
Energy from waste in emerging
markets

5
Source: International Energy Agency, Frost & Sullivan
Growth in Electricity Generation by Region
Chinese = 5.2%.
Indian = 4.3%.
Middle East = 3.5%.
EU + North American = 1%.
0
5,000
10,000
15,000
20,000
25,000
30,000
35,000
2007 2020 2030
Ele
ctri
city
Ge
ne
rati
on
(TW
h)
North America Latin America EU CEE/CIS
Middle East Africa China India
ASEAN OECD Pacific Other
19,756
26,620
32,600

6
Source: International Energy Agency, Frost & Sullivan
Growth in Electricity Generation by Fuel
0
5,000
10,000
15,000
20,000
25,000
30,000
35,000
2007 2020 2030
Ele
ctri
city
Ge
ne
rati
on
(T
Wh
)
Coal Oil Gas Nuclear Hydro Wind Other renewables

7
Source: International Energy Agency, Frost & Sullivan
CAGR Growth of Key Fuels
7.2%
5.0%
2.2%
2.9%
1.5%
-1.8%
1.3%
7.7%
15.2%
2.2%
1.8%
2.4%
-3.3%
2.1%
-5% 0% 5% 10% 15% 20%
Other renewables
Wind
Hydro
Nuclear
Gas
Coal
Compound Annual Growth Rate
2007-2020
2020-2030
Oil

8
Source: Lambert Energy Advisory
Coal-Bed Methane (CBM) Potential, barrels of oil equivalent
Shale Gas Potential, barrels of oil equivalent
US Shale Gas 100bn
US CBM 15bn+
Latin America Shale Gas 50-100bn
China Shale Gas 50-100bn
Europe Shale Gas 90bnCanada Shale Gas 20bn+
China CBM 75bn
Indonesia CBM 75bn
Australia CBM 40bn
Growth of Unconventional Gas

9
UK
10.2
LNG Exports and Imports
Source: BP Statistical Review of World Energy, 2010
Brunei
8.8
Trinidad
19.7
LNG Exporter (bcm)
LNG Importer (bcm)
USA
12.8Japan
85.9
Australia
24.2
Nigeria
16.0
Algeria
20.9
Indonesia
26.0
Malaysia
29.5
Qatar
49.4Egypt
12.8
UAE
7.0
Oman
11.5
Turkey
5.7
India
12.6Taiwan
11.8
France
13.1
China
7.6
Spain
27.1 Korea
34.3
Eq.G.
4.7
Mexico
3.6
Belgium
6.5
10
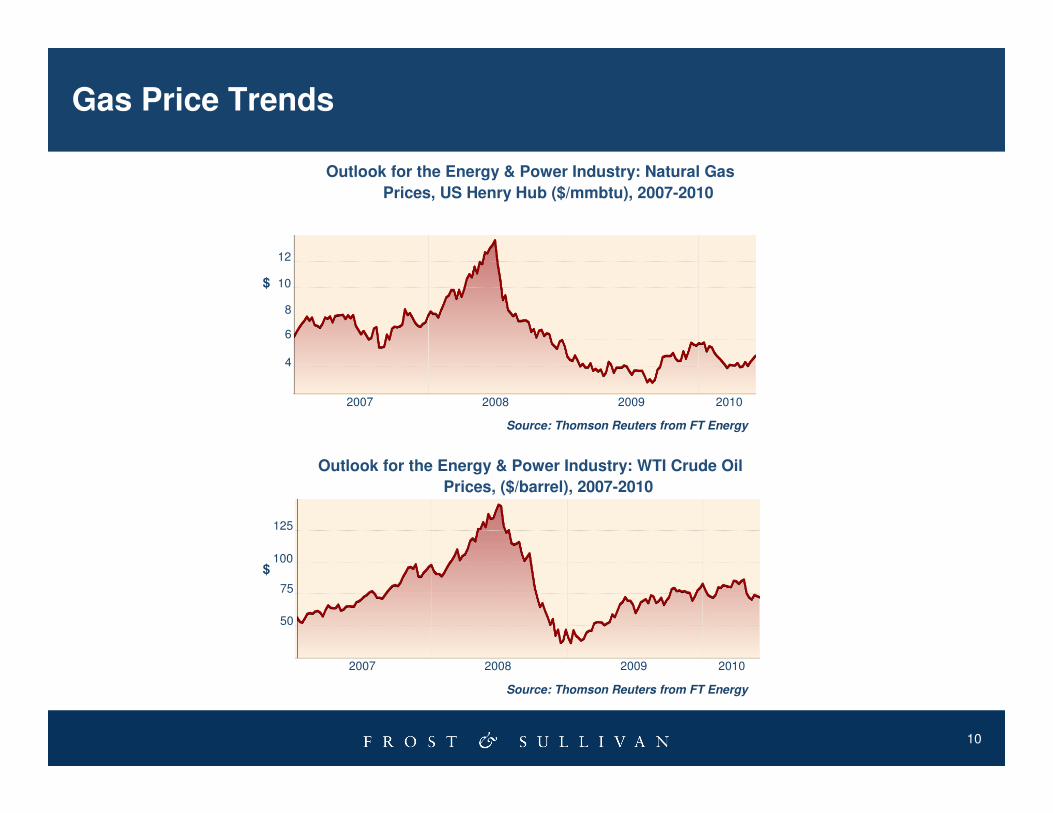
Gas Price Trends
Outlook for the Energy & Power Industry: Natural Gas
Prices, US Henry Hub ($/mmbtu), 2007-2010
Outlook for the Energy & Power Industry: WTI Crude Oil
Prices, ($/barrel), 2007-2010
4
6
8
10
12
2007 2008 2009 2010
100
75
50
125
2007 2008 2009 2010
Source: Thomson Reuters from FT Energy
Source: Thomson Reuters from FT Energy
$
$

11
Countries/Regions Planning for Nuclear Power
Countries/Regions Using Nuclear Power
USUnits = 23
EuropeUnits = 30
Russia & CISUnits = 73
IndiaUnits = 23
ChinaUnits = 54
Asia (Other)Units = 33
Middle EastUnits = 5
1 14
8
Nuclear Power Plants Under Construction
Nuclear Power Plants PlannedNuclear Power Plants Proposed
6 10
14
1 0
4
10 18
45
6 10
7
5 16
7
11 20
23
Source: IAEA PRIS
Nuclear - Expansion and Development

12
Nuclear - Current and New to Market Technologies
PWR, 225GW
BWR, 94GW
PHWR, 40GW
LWGR, 10GW
GCR+FBR, 2GW
GW Installed,
2010
<15 years
<20 years
<25 years
<30 years
<35 years
<40 years
HiPER, JET, ITER
-25yMany typesFusion
DFR, PFR
8yFast Breeding Reactor
FBR
-30yGas Cooled reactor
GCR
-40yLight Water Graphite Reactor
LWGR
-40yPressurised Heavy Water
Reactor
PHWR
ABWR60yBoiling Water Reactor
BWR
EPR, AP1000
60yPressurised Water Reactor
PWR
Latest models
AgeDescription
Source: Frost & Sullivan

13
32
45
2
6
3
6
4 43
6
45
9
6
4
1011
14
22
24
3233
21
18
22
19
7
1314
16
11
22
15
10
12
5
7
1 1
0
5
10
15
20
25
30
35
2 3 4 5 6 7 8 9 10 11 12 13 14 15 16 17 18 19 20 21 22 23 24 25 26 27 28 29 30 31 32 33 34 35 36 37 38 39 40 41 42
Age of Units
Nu
mb
er
of
Un
its
� Worldwide = 371GW of installed nuclear capacity = 471 units. Currently there are 44 plants in construction, 11 of which are
in China and 25 in Asia-Pacific including China.
� Europe = 198 installed units = 171GW installed. However, nuclear plant age is an issue which needs to be analysed
carefully, as NuPLEx (Nuclear Plant License Extensions) can only be granted for a certain number of years beyond design life.
The average design life for installed capacity is 34 years, however, Nuplex can be granted for up to 10 years. Newer models
such as the EPR from Areva, and the AP1000 from Toshiba Westinghouse, have design lives of 60 years, however, none are
yet in production.
� At present, there are over 160 plants which await their detailed reviews and maintenance schedule, an obligatory check
performed every 10 years.
Number of worldwide nuclear plants distributed by age, 2009 Q1
Nuclear - Significant Refurbishment Market
14
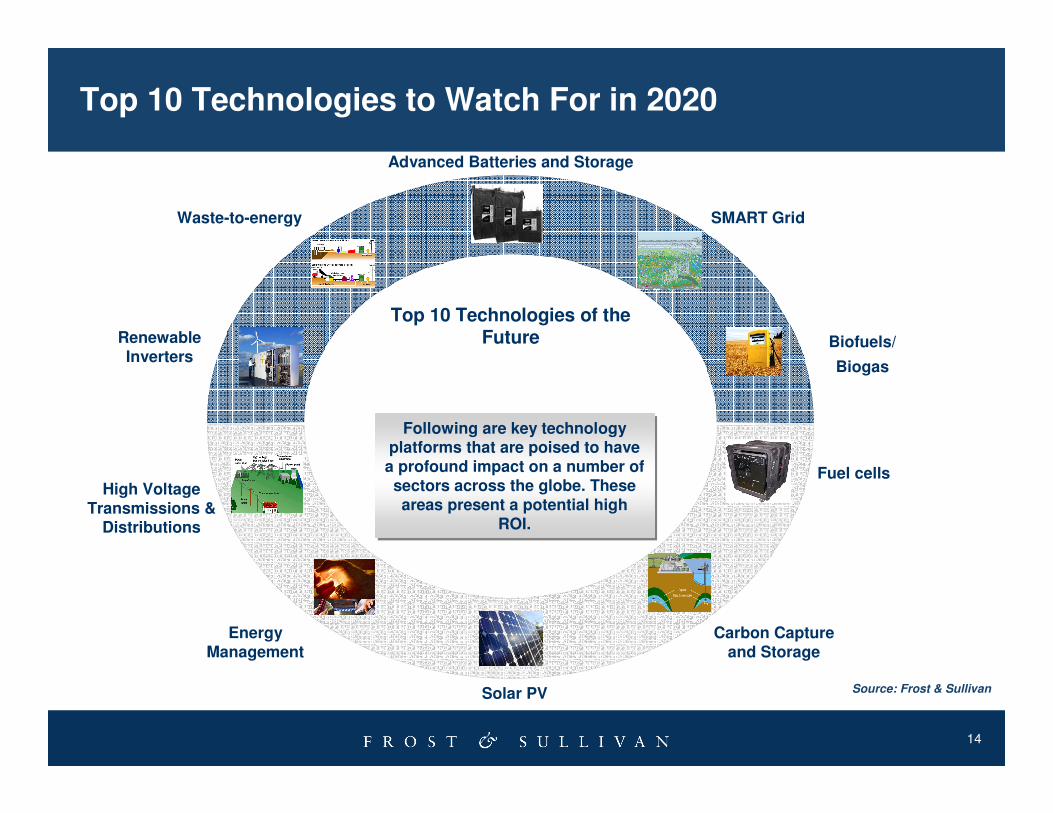
Top 10 Technologies to Watch For in 2020
Renewable Inverters
Waste-to-energy
Advanced Batteries and Storage
SMART Grid
Biofuels/
Biogas
Fuel cellsHigh Voltage
Transmissions & Distributions
Energy Management
Solar PV
Carbon Capture and Storage
Top 10 Technologies of the Future
Following are key technology platforms that are poised to have a profound impact on a number of sectors across the globe. These areas present a potential high
ROI.
Following are key technology platforms that are poised to have a profound impact on a number of sectors across the globe. These areas present a potential high
ROI.
Source: Frost & Sullivan

15
Smart House with EV car generator
Smart Grid Control Centre
Wind Power
Solar Power
Energy Storage
Hospital
Pre 2010
2010 – 2020
Conventional Grid and Infrastructure
Houses
Power Station
Office Building
Factory
Transformation of Conventional Grid ����Energy Internet (Smart Grid)
Distributed Generation
Smart Grid – Change from Today

16
Smart Grid
Advanced Metering Infrastructure
Demand Response Power T&DEmerging
Technologies
Smart Meters
Network and Connectivity
In-home Displays T&D Automation
High Voltage Transmission
Energy Storage
Power Load Services
Smart Thermostats
HAN Appliances
PHEV Chargers
What makes up a “Smart Grid”
Source: Frost & Sullivan
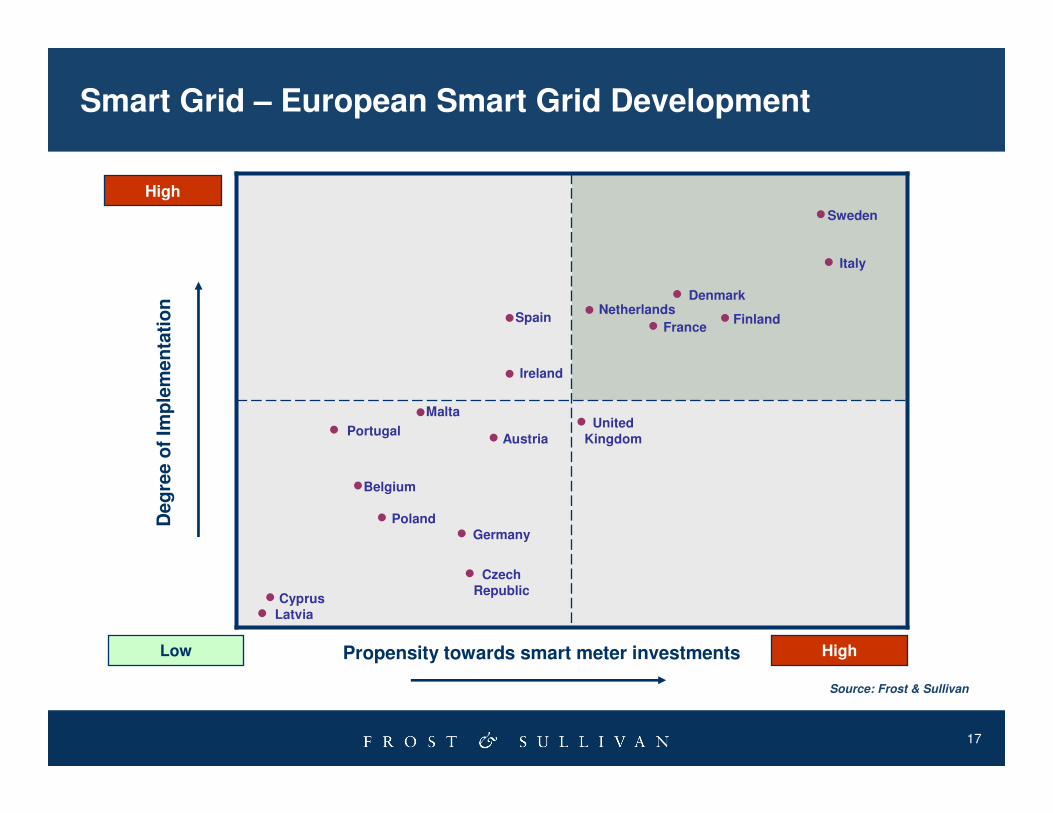
17
Propensity towards smart meter investments
Deg
ree o
f Im
ple
men
tati
on
Low
High
High
Sweden
Italy
Netherlands
France
Denmark
Finland
United Kingdom
Germany
Austria
Spain
CyprusLatvia
Czech Republic
Portugal
Belgium
Poland
Ireland
Malta
Source: Frost & Sullivan
Smart Grid – European Smart Grid Development

18
Smart Grid – Energy Storage Technologies
Lithium-ion
NiCad
Fuel Cells
MaturityDevelopment Growth
Flywheels
Ultracapacitors
Decline
Time
Mark
et
Valu
e (
$ B
illio
n)
Lead Acid
NiMH
Carbon ZincAlkaline
Flow batteries, CAES, SMES, Thermal batteries, Thin film
Zinc air
Primary Lithium

19
Smart Grid – Voltage Regulation
Source: Frost & Sullivan
-15%
-10%
-5%
0%
5%
10%
15%
20%
25%
30%
35%
40%
0
50
100
150
200
250
300
350
400
2009 2010 2011 2012 2013 2014 2015 2016 2017 2018 2019 2020
Units Growth Rate (%)
Distribution-Static Var Compensators

20
Smart Meter Market Participants – A Snapshot
ManufacturersRemote
Monitoring & Automation
Network Companies
Utilities ICT Firms
Source: Frost & Sullivan

21
Three Main Approaches to CO2 Capture
Post-combustion systems - separate CO2 gas produced by ‘air-blown’ combustion of fossil fuel or biomass.
Post-combustion systems - separate CO2 gas produced by ‘air-blown’ combustion of fossil fuel or biomass.
Oxy-fuel combustion systems produce a flue gas from ‘oxygen-blown’ combustion, they have a much higher concentration of CO2 than conventional ‘air-blown’ combustion.
Oxy-fuel combustion systems produce a flue gas from ‘oxygen-blown’ combustion, they have a much higher concentration of CO2 than conventional ‘air-blown’ combustion.
Pre-combustion systems process the primary fuel in a reactor to produce synthesis gas (syngas), which is then converted and separated into gas streams – CO2 for storage and hydrogen as fuel for a gas turbine or as chemical feedstock.
Pre-combustion systems process the primary fuel in a reactor to produce synthesis gas (syngas), which is then converted and separated into gas streams – CO2 for storage and hydrogen as fuel for a gas turbine or as chemical feedstock.
Carbon Capture and Storage Technologies
22
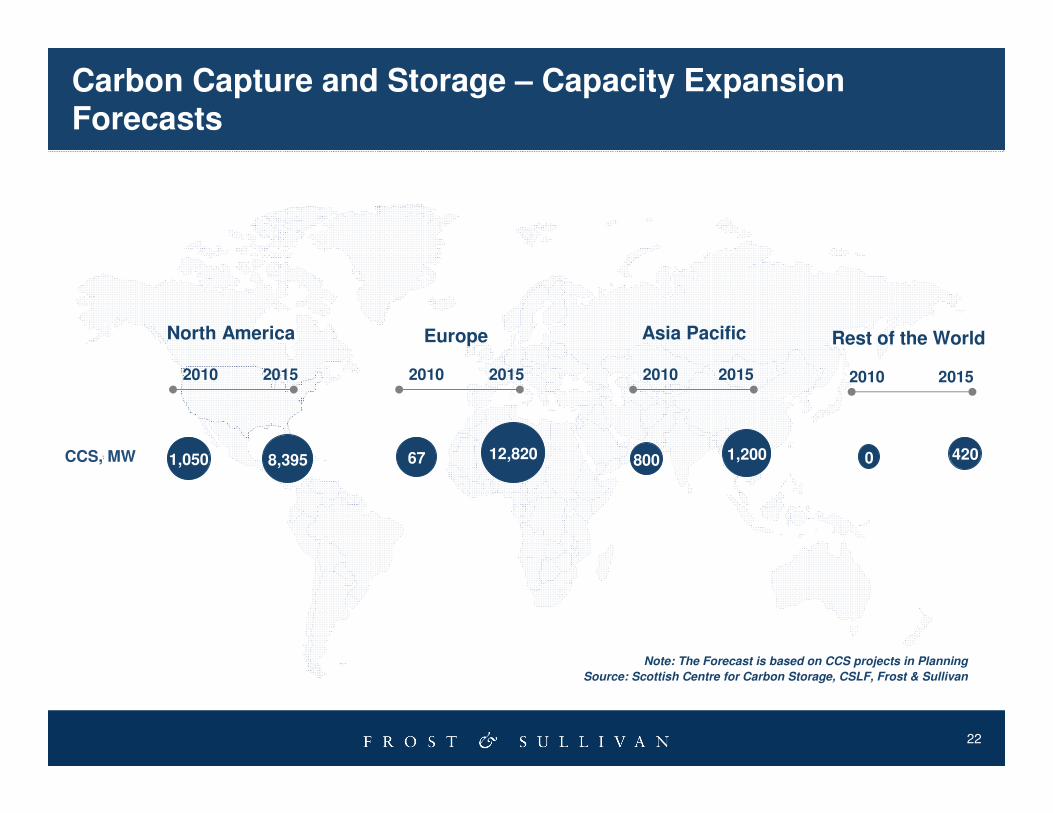
Carbon Capture and Storage – Capacity Expansion Forecasts
North America Asia PacificEurope
2010 2015 2010 2015 2010 2015
1,050 8,395 67 12,820 800 1,200
Rest of the World
2010 2015
0 420CCS, MW
Note: The Forecast is based on CCS projects in Planning
Source: Scottish Centre for Carbon Storage, CSLF, Frost & Sullivan

23
0%
25%
50%
75%
100%
2007 2015
Other
Wastewater(sludge)
Landfill
Source: Frost & Sullivan
Biogas Market in Europe
Biogas Plan Market: Market Shares of Biogas Produced
by Type of (Europe), 2007
Biogas Market in Europe – 5,347 ktoe*
Landfill gas Other biogas
Sewage sludge gas
3,116 ktoe
58%
1,281 ktoe
24%
950 ktoe
18%
Decentralised Agricultural Plants
Municipal solid waste methanisation plants
Centralised Co-digestion Plants
Biogas Plan Market: Market Shares of Biogas Produced
by Type of (Europe), 2007-2015

24
Source: Frost & Sullivan
Biogas - Market Revenue Forecasts
Biogas Plant Market: Revenue Growth Forecasts (Europe), 2005-2015
Revenues ($Billion)
Growth per annum (%)
2005 2006 2007 2008 2009 2010 2011 2012 2013 2014
Year
Revenues Base Case Scenario
Growth rate Base Case Scenario
Revenues Optimistic Scenario
2015
Growth rateOptimistic Scenario
- 00,25
0,50
0,75
1,0
1,2
1,5
1,7
2,0
2,2
2,5
5
10
15
20
25
30
2,256
1,283
2015
1,8801,5531,2631,027855.8690.2580.0Optimistic
1,1561,041930.1829.7734.2644.1580.0Base Case
2014201320122011201020092008Scenario Analysis (in million Euros)

25
Key Regional Markets for Biogas in Europe
Source: Frost & Sullivan
Germany
Opportunity indicator
Low
High
Opportunity indicator
Low
High
Low
High
Austria
Switzerland
The Netherlands
France
ItalySpain
CEE
Sweden
Note:
Size of bubbles indicates market size
Color of bubbles indicates current growth
26
Next Steps
� Request a strategic approach document for a Growth Partnership Service or Growth Consulting Service to support you and your team to accelerate the growth of your company.
([email protected]) +44 (0)20 7343 8383
� Join us at our annual Growth, Innovation and Leadership 2011: A Frost & Sullivan Global Congress on Corporate Growth (www.gil-global.com)
� Register for the next Chairman’s Series on Growth: The CEO’s Perspective on Innovation: How Creativity Fosters Growth14 July 2010 10:00 AM BST (www.frost.com/growthEU)
� Register for Frost & Sullivan’s Growth Opportunity Newsletter and keepabreast of innovative growth opportunities (www.frost.com/news)

27
Your Feedback is Important to Us
Growth Forecasts?
Competitive Structure?
Emerging Trends?
Strategic Recommendations?
Other?
Please inform us by taking our survey.
What would you like to see from Frost & Sullivan?

28
Find us @Frost_Sullivan on Twitter
Frost & Sullivan on Twitter and Facebook
Become a fan of Frost & Sullivan on Facebook

29
For Additional Information
Chiara Carella
Head of Corporate Communications
Europe, Middle East & Africa
+44 (0)20 7343 8314
Juliet Shaw
Sales Director
Energy and Environment
+44 (0)20 7343 8363
John Raspin
Practice & Research DirectorEnergy and Environment +44 (0)20 7915 7814