Changes in microbial communities in coastal sediments ... · Changes in microbial communities in...
14
Changes in microbial communities in coastal sediments along natural CO 2 gradients at a volcanic vent in Papua New Guinea Felix F. Raulf, 1 Katharina Fabricius, 2 Sven Uthicke, 2 Dirk de Beer, 3 Raeid M. M. Abed 4 and Alban Ramette 1 * 1 HGF-MPG Joint Research Group on Deep Sea Ecology and Technology and 3 Microsensor Group, Max Planck Institute for Marine Microbiology, Bremen, Germany. 2 Water Quality and Ecosystem Health, Australian Institute of Marine Science, Townsville, Australia. 4 Department of Biology, Sultan Qaboos University, Muscat, Oman. Summary Natural CO2 venting systems can mimic conditions that resemble intermediate to high pCO2 levels as predicted for our future oceans. They represent ideal sites to investigate potential long-term effects of ocean acidification on marine life. To test whether microbes are affected by prolonged exposure to pCO2 levels, we examined the composition and diversity of microbial communities in oxic sandy sediments along a natural CO2 gradient. Increasing pCO2 was accompanied by higher bacterial richness and by a strong increase in rare members in both bacterial and archaeal communities. Microbial communities from sites with CO2 concentrations close to today’s conditions had different structures than those of sites with elevated CO2 levels. We also observed increasing sequence abundance of several organic matter degrading types of Flavobacteriaceae and Rhodobacteraceae, which paralleled concurrent shifts in benthic cover and enhanced primary produc- tivity. With increasing pCO2, sequences related to bacterial nitrifying organisms such as Nitrosococcus and Nitrospirales decreased, and sequences affiliated to the archaeal ammonia-oxidizing Thaumarchaeota Nitrosopumilus maritimus increased. Our study sug- gests that microbial community structure and diver- sity, and likely key ecosystem functions, may be altered in coastal sediments by long-term CO 2 expo- sure to levels predicted for the end of the century. Introduction Two hundred years of anthropogenic activities, such as deforestation, agricultural land use and most prominently the use of fossil carbon as energy source, have led to an increase in atmospheric CO2 concentrations, from long- term stable levels of around 280 μatm pCO2(atm) to pres- ently > 400 atm (Stocker et al., 2013). The dissolution of atmospheric CO2 in seawater significantly increases con- centrations of dissolved inorganic carbon in the ocean and has reduced mean surface seawater pH by 0.1 units, a process commonly known as ocean acidification (OA). Realistic CO2 emission scenarios of the Intergovernmen- tal Panel for Climate Change (Stocker et al., 2013) predict atmospheric CO2 levels of 750 atm and higher by the end of the century, which will result in a further pH drop of up to 0.4 units (Raven et al., 2005; Andersson et al., 2007). This change would be accompanied by a significant decrease in seawater carbonate ion con- centrations and a lower saturation state for calcium car- bonate minerals, directly affecting marine calcareous organisms such as coccolithophorids, foraminifera, scleractinian corals and coralline algae (Hall-Spencer et al., 2008; Fabricius et al., 2011; Uthicke et al., 2013). Current OA has already measurable negative impacts on coral ecosystems and this trend will worsen in the future (Pandolfi et al., 2011). Benthic microbial communities, especially in the oxic layer of the surface of coastal marine sediments, may also be directly influenced by changes in seawater chemistry, potentially leading to different functional responses. Microbial communities play a critical role for ecosystems by supporting the main biogeochemical cycles, such as primary production and remineralization of organic material (Decho, 2000; Thompson et al., 2004; Hewson et al., 2007), by providing protection to larger organisms as biofilms (Mouchka et al., 2010), and/or by influencing the settlement of faunal larvae on benthic substrata Received 27 June, 2014; revised 12 November, 2014; accepted 23 November, 2014. *For correspondence. E-mail alban.ramette@ ispm.unibe.ch, Institute of Social and Preventive Medicine, University of Bern, Finkenhubelweg 11, 3012 Bern, Switzerland; Tel. +41 31 631 5975; Fax +41 31 631 3648. Environmental Microbiology (2015) 17(10), 3678–3691 doi:10.1111/1462-2920.12729 © 2014 The Authors. Environmental Microbiology published by Society for Applied Microbiology and John Wiley & Sons Ltd. This is an open access article under the terms of the Creative Commons Attribution-NonCommercial-NoDerivs License, which permits use and distribution in any medium, provided the original work is properly cited, the use is non-commercial and no modifications or adaptations are made. source: https://doi.org/10.7892/boris.91358 | downloaded: 13.3.2017
Transcript of Changes in microbial communities in coastal sediments ... · Changes in microbial communities in...

Changes in microbial communities in coastalsediments along natural CO2 gradients at a volcanicvent in Papua New Guinea
Felix F. Raulf,1 Katharina Fabricius,2 Sven Uthicke,2
Dirk de Beer,3 Raeid M. M. Abed4 andAlban Ramette1*1HGF-MPG Joint Research Group on Deep SeaEcology and Technology and 3Microsensor Group, MaxPlanck Institute for Marine Microbiology, Bremen,Germany.2Water Quality and Ecosystem Health, AustralianInstitute of Marine Science, Townsville, Australia.4Department of Biology, Sultan Qaboos University,Muscat, Oman.
Summary
Natural CO2 venting systems can mimic conditionsthat resemble intermediate to high pCO2 levels aspredicted for our future oceans. They represent idealsites to investigate potential long-term effects ofocean acidification on marine life. To test whethermicrobes are affected by prolonged exposure to pCO2
levels, we examined the composition and diversityof microbial communities in oxic sandy sedimentsalong a natural CO2 gradient. Increasing pCO2 wasaccompanied by higher bacterial richness and by astrong increase in rare members in both bacterialand archaeal communities. Microbial communitiesfrom sites with CO2 concentrations close to today’sconditions had different structures than those ofsites with elevated CO2 levels. We also observedincreasing sequence abundance of several organicmatter degrading types of Flavobacteriaceae andRhodobacteraceae, which paralleled concurrentshifts in benthic cover and enhanced primary produc-tivity. With increasing pCO2, sequences related tobacterial nitrifying organisms such as Nitrosococcusand Nitrospirales decreased, and sequences affiliatedto the archaeal ammonia-oxidizing ThaumarchaeotaNitrosopumilus maritimus increased. Our study sug-
gests that microbial community structure and diver-sity, and likely key ecosystem functions, may bealtered in coastal sediments by long-term CO2 expo-sure to levels predicted for the end of the century.
Introduction
Two hundred years of anthropogenic activities, such asdeforestation, agricultural land use and most prominentlythe use of fossil carbon as energy source, have led to anincrease in atmospheric CO2 concentrations, from long-term stable levels of around 280 μatm pCO2(atm) to pres-ently > 400 μatm (Stocker et al., 2013). The dissolution ofatmospheric CO2 in seawater significantly increases con-centrations of dissolved inorganic carbon in the oceanand has reduced mean surface seawater pH by 0.1 units,a process commonly known as ocean acidification (OA).Realistic CO2 emission scenarios of the Intergovernmen-tal Panel for Climate Change (Stocker et al., 2013)predict atmospheric CO2 levels of 750 μatm and higherby the end of the century, which will result in a further pHdrop of up to 0.4 units (Raven et al., 2005; Anderssonet al., 2007). This change would be accompanied by asignificant decrease in seawater carbonate ion con-centrations and a lower saturation state for calcium car-bonate minerals, directly affecting marine calcareousorganisms such as coccolithophorids, foraminifera,scleractinian corals and coralline algae (Hall-Spenceret al., 2008; Fabricius et al., 2011; Uthicke et al., 2013).Current OA has already measurable negative impacts oncoral ecosystems and this trend will worsen in the future(Pandolfi et al., 2011).
Benthic microbial communities, especially in the oxiclayer of the surface of coastal marine sediments, may alsobe directly influenced by changes in seawater chemistry,potentially leading to different functional responses.Microbial communities play a critical role for ecosystemsby supporting the main biogeochemical cycles, suchas primary production and remineralization of organicmaterial (Decho, 2000; Thompson et al., 2004; Hewsonet al., 2007), by providing protection to larger organismsas biofilms (Mouchka et al., 2010), and/or by influencingthe settlement of faunal larvae on benthic substrata
Received 27 June, 2014; revised 12 November, 2014; accepted23 November, 2014. *For correspondence. E-mail [email protected], Institute of Social and Preventive Medicine, Universityof Bern, Finkenhubelweg 11, 3012 Bern, Switzerland; Tel.+41 31 631 5975; Fax +41 31 631 3648.
bs_bs_banner
Environmental Microbiology (2015) 17(10), 3678–3691 doi:10.1111/1462-2920.12729
© 2014 The Authors. Environmental Microbiology published by Society for Applied Microbiology and John Wiley & Sons Ltd.This is an open access article under the terms of the Creative Commons Attribution-NonCommercial-NoDerivs License, which permitsuse and distribution in any medium, provided the original work is properly cited, the use is non-commercial and no modifications oradaptations are made.
source: https://doi.org/10.7892/boris.91358 | downloaded: 13.3.2017

(Webster et al., 2004). Despite a growing understandingof the structure of shallow sediment microbiota and oftheir role in the dynamics of coastal sediment ecosystems(e.g. Böer et al., 2009), responses of benthic microbialcommunities to environmental changes such as OA arestill poorly understood.
Recent experimental studies on bacterioplanktonand open water microbial assemblages indicated thatincreased OA might affect microbial processes such asnitrification rates (Beman et al., 2011) or activities ofcertain extracellular enzymes (Piontek et al., 2009) andcould significantly alter bacterial community structure inthe water column (Krause et al., 2012). Yet, all existingexperiments and studies related to OA effects onmicrobial communities have, so far, only investigatedresponses to exposure that lasted days to weeks, andonly one study exists on long-term effects on communitycomposition and structure in coastal sediments (Kitidiset al., 2011). Community responses to increased pCO2
observed in short-term experiments obviously do notreflect long-term acclimatization, evolutionary adapta-tions, complex feedbacks or indirect effects (e.g. changesin local geochemistry, faunal and floral composition),which occur within a natural marine system subjected todecennia or centuries of exposure. To obtain a realisticdescription of future impacts of chronic OA, ecosystemsthat are naturally exposed to high pCO2 must therefore bestudied.
Here, we examined the composition and diversity ofbacterial and archaeal communities associated withbenthic sediments along a natural pCO2 gradient, formedby volcanic CO2 venting. The local conditions providelong-term pCO2 gradients in the range of acidificationprojections for the next century, a high purity of theemitted volcanic gas as well as limited confoundingeffects caused by fluctuations in temperature, salinity orstrong currents (Fabricius et al., 2011). Although manycoastal systems experience natural pH fluctuations due toseasonal or annual changes or to microbial activities suchas respiration or nitrification (Harley et al., 2006; Jointet al., 2010), any general increase in OA due to changesin atmospheric composition will ultimately lift the wholebaseline of ecosystems to higher acidification level withpeaks above today’s maxima. The natural laboratory thatwe chose here is defined by long-term acidificationthrough CO2 vents that have been active for at least acentury (Fabricius et al., 2011). We use this system tocharacterize potentially adapted microbial communities toOA peak levels expected at the end of this century andbeyond (700–1500 μatm pCO2). Our main hypothesis isthat long-term exposure to higher CO2 significantly affectsthe diversity of bacterial and archaeal communities.We focused on changes in local (sample) richness(α-diversity) and on community turnover between
samples (β-diversity) while also taking into considerationeffects on rare community members. Our second hypoth-esis is that it is possible to identify bacterial or archaealtaxa mostly affected by increased pCO2 and that suchtaxa may be indicators of important biogeochemical pro-cesses such as the carbon, nitrogen or sulfur cycles react-ing sensitively to OA.
Results and discussion
Sampling sites consisted of three geographically sepa-rated natural CO2-seeping areas called Upa-Upasina,Esa’Ala and Dobu, and of adjacent control sites(Table S1, Fig. S1) (Fabricius et al., 2011). Because wecould not find any significant location-based difference inoverall community structure among the three samplingareas, but mostly CO2 effects, we considered the foundCO2 effects on changes in microbial diversity of generalrelevance.
Diversity
α-Diversity. Both observed and estimated bacterialoperational taxonomic unit (OTU) richness, as deter-mined by 454 massively parallel tag sequencing (MPTS),increased with increasing pCO2 levels (linear regres-sion slope coefficients = 324.7, P = 0.0012, and 105.6,P = 0.021 respectively; Fig. 1, Table S2). No increase inbacterial richness was, however, detected by the com-munity fingerprinting technique automated ribosomalintergenic spacer analysis (ARISA) (Fig. S2, Table S2),which is known to offer lower resolving power as com-pared with MPTS (Gobet et al., 2013). For archaealcommunities, a similar, yet weaker trend of increasingrichness was found when comparing communities fromsites with high pCO2 with those with medium and controlpCO2 (Mann–Whitney two-tailed test, U = 0.0, P = 0.03)(Fig. 1, Table S2). Thorough denoising of MPTS dataenabled us to include MPTS OTUs originating from therare biosphere into our ecological analysis. We defined‘rare’ OTUs as in (Gobet et al., 2012), i.e. OTU occurringeither as (i) one sequence in the whole data set (i.e.single sequence OTU absolute; SSOabs), (ii) onesequence in at least one sample (i.e. single sequenceOTU relative to a sample; SSOrel), or (iii) two sequencesin the whole data set (i.e. double sequence OTU abso-lute; DSOabs). Based on that definition, 67% and 68% ofall bacterial and all archaeal MPTS OTUs, respectively,were considered rare (Table S2). At all those levels ofrarity, a significantly lower percentage of rare bacterialand archaeal OTUs was found at control sites whencompared with medium or high pCO2 sites. Althoughsharing a higher proportion of rare OTUs, medium andhigh pCO2 sites could not be significantly distinguished
Impact of ocean acidification on microbial diversity 3679
© 2014 The Authors. Environmental Microbiology published by Society for Applied Microbiology and John Wiley & Sons Ltd,Environmental Microbiology, 17, 3678–3691

Fig
.1.
Obs
erve
dan
dpr
edic
ted
(Cha
o1
richn
ess
estim
ator
)di
vers
ityof
bact
eria
l(A
,B
)an
dar
chae
al(D
,E
)co
mm
uniti
esat
alls
ampl
ing
site
s,so
rted
byin
crea
sing
pCO
2.R
ichn
ess
estim
ator
sw
ere
calc
ulat
edby
subs
ampl
ing
atth
elo
wes
tnu
mbe
rof
sequ
ence
sin
the
who
leda
tase
t(n
=85
6an
d91
8fo
rba
cter
iaan
dar
chae
are
spec
tivel
y).
The
aver
age
perc
enta
ges
per
sam
ple
ofra
reba
cter
iala
ndar
chae
alM
PT
SO
TU
s 3%
(as
com
pare
dw
ithth
eto
taln
umbe
rof
sequ
ence
spe
rsa
mpl
e)at
thre
epC
O2
impa
ctgr
oups
(see
lege
nd)
are
show
nin
Can
dF
resp
ectiv
ely.
SS
Oab
s,si
ngle
sequ
ence
OT
Uab
solu
te;
SS
Ore
l,si
ngle
sequ
ence
OT
Ure
lativ
e;D
SO
abs,
doub
lese
quen
ceO
TU
abso
lute
.S
eete
xtfo
rm
ore
deta
il.
3680 F. F. Raulf et al.
© 2014 The Authors. Environmental Microbiology published by Society for Applied Microbiology and John Wiley & Sons Ltd,Environmental Microbiology, 17, 3678–3691
from each other in terms of community structure(Fig. 1).
At the studied sites, Fabricius and colleagues (2011)observed a shift from coral to algal and seagrass species,and Russell and colleagues (2013) observed anincreased productivity and biomass production of certainseagrass species at the CO2 seep sites as compared withcontrol sites. Despite those changes in the communitiesof primary producers, sediment organic carbon (OC) andnitrogen (N) concentrations remained at the low valuestypically found for coral reef environments, and did notcorrelate with local CO2 effects (Uthicke et al., 2013).Nevertheless, the different types of OC (coral versusalgae and seagrass) could affect microbial communitiesby being more or less accessible for uptake. Additionally,because a benthic cover with fast-growing primary pro-ducers is expected to have a much higher growth ratecompared with coral species, this shift could have led toan increased turnover of organic matter reaching the sedi-ments, which would then be available as carbon andnutrient source for the reef communities. For complexbacterial communities in oligotrophic arctic sediments, apositive energy-diversity relationship has been described(Bienhold et al., 2012). Thus, under the assumption that ahigher turnover of carbon sources leads to more carbon-based processes in the system, the increase of bacterialand archaeal richness with pCO2 in the studied sites could
reflect changes in both energy source and availability. Adifferent composition of carbon sources could be an addi-tional factor favouring a richer community. Studies in ter-restrial soils further support the theory that a pCO2-induced plant growth could lead to increased bacterialbiomass (Diaz et al., 1993; Zak et al., 1993) and morediverse communities (Berntson and Bazzaz, 1997).
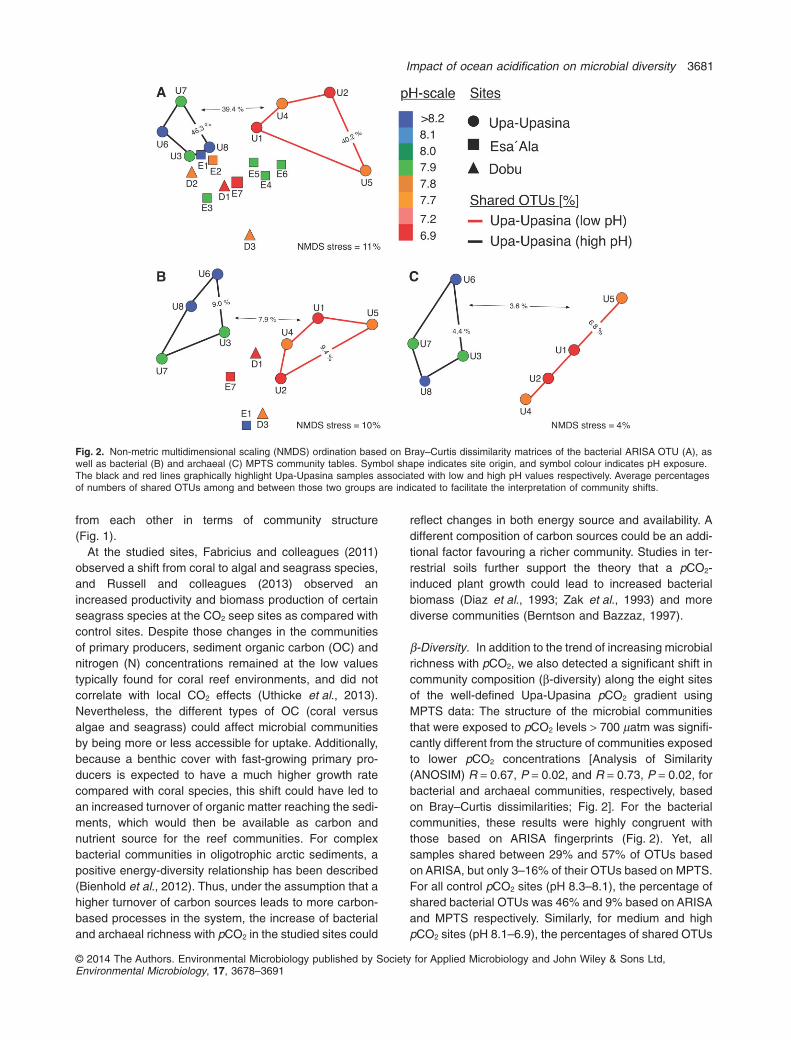
β-Diversity. In addition to the trend of increasing microbialrichness with pCO2, we also detected a significant shift incommunity composition (β-diversity) along the eight sitesof the well-defined Upa-Upasina pCO2 gradient usingMPTS data: The structure of the microbial communitiesthat were exposed to pCO2 levels > 700 μatm was signifi-cantly different from the structure of communities exposedto lower pCO2 concentrations [Analysis of Similarity(ANOSIM) R = 0.67, P = 0.02, and R = 0.73, P = 0.02, forbacterial and archaeal communities, respectively, basedon Bray–Curtis dissimilarities; Fig. 2]. For the bacterialcommunities, these results were highly congruent withthose based on ARISA fingerprints (Fig. 2). Yet, allsamples shared between 29% and 57% of OTUs basedon ARISA, but only 3–16% of their OTUs based on MPTS.For all control pCO2 sites (pH 8.3–8.1), the percentage ofshared bacterial OTUs was 46% and 9% based on ARISAand MPTS respectively. Similarly, for medium and highpCO2 sites (pH 8.1–6.9), the percentages of shared OTUs
Fig. 2. Non-metric multidimensional scaling (NMDS) ordination based on Bray–Curtis dissimilarity matrices of the bacterial ARISA OTU (A), aswell as bacterial (B) and archaeal (C) MPTS community tables. Symbol shape indicates site origin, and symbol colour indicates pH exposure.The black and red lines graphically highlight Upa-Upasina samples associated with low and high pH values respectively. Average percentagesof numbers of shared OTUs among and between those two groups are indicated to facilitate the interpretation of community shifts.
Impact of ocean acidification on microbial diversity 3681
© 2014 The Authors. Environmental Microbiology published by Society for Applied Microbiology and John Wiley & Sons Ltd,Environmental Microbiology, 17, 3678–3691

were 40% and 9% for each technique respectively. Whencomparing all control sites with medium and high pCO2
sites, microbial communities shared only 39% of ARISAand 8% of MPTS bacterial OTUs. Archaeal communitiesshared between 2% and 11% of MPTS OTUs among allsites. Control sites shared 4% of archaeal MPTS OTUs,whereas sites with medium and high pCO2 shared 7% ofarchaeal MPTS OTUs. Control and high pCO2 sitesshared only 4% of archaeal MPTS OTUs.
A multivariate analysis with all available environmentaldata further supported the importance of CO2 effects onchanges in microbial community structure. The bestredundancy analysis (RDA) model, which included thefactors pCO2/pH, carbon content and nitrogen content,explained 49% of bacterial community structure variation(F5,6 = 1.2, P = 0.018, based on 1000 permutations),whereas the level of acidification (pH) alone significantlycontributed with 9% (F1,10 = 1.04, P = 0.030). The modelfor archaea explained 67% of community structure varia-tion, whereas the level of acidification alone was margin-ally significant and explained 18% (F1,6 = 1.3, P = 0.060)of the total community structure variation.
Besides community shifts directly related to environ-mental parameters, we also assessed possible time-related shifts. For this analysis only, we included bacterialMPTS data from Dobu sites, based on samples taken 1year after the first sampling (referred to Dobu in 2010 andin 2011 respectively). We found the bacterial communitystructures of year 2011 to be significantly different fromthose of 2010 (ANOSIM R = 0.74, P < 0.001). Neverthe-less, when communities from all three sites and bothsampling years were analysed together, we found bacte-rial communities from control sites to be significantly dif-ferent from those at high pCO2 sites (R = 0.34, P = 0.017)(Fig. S3). Communities from medium pCO2 sites could notbe statistically differentiated from those of the control or ofthe high CO2 groups when 2010 and 2011 communitieswere compared.
Overall, these results indicate that high pCO2 sites notonly favour a richer community, in terms of α-diversity,but also select for different dominant microbial types.Although the aforementioned changes in ecosystemstructure, such as increased benthic cover and highernutrient availability, could be responsible for such arestructuring of microbial communities, there could alsobe pCO2 effects on specific processes via enzyme kinet-ics (Piontek et al., 2013) or cell homeostasis (Krulwichet al., 2011). It has been experimentally shown thata change in seawater chemistry (the stress factor)results in higher abundance and production of complexbacterioplankton communities (Bouvier et al., 2012), andsimilar observations have been made in other studies(Boles et al., 2004; Girvan et al., 2005). At our study sites,we do not expect such microbial responses to short-term
variations in a stress factor as being typical for the ana-lysed communities because the investigated ventingareas are supposed to have been stable for severaldecades (Fabricius et al., 2011). Ecologically speaking,the observed increase in microbial species diversity andthe larger proportion of rare microbial types at high pCO2
sites could potentially have a stabilizing effect on localbiological processes and ecosystem functioning: Espe-cially, a richer community of rare types might offer a res-ervoir of new or interchangeable functions (Gobet et al.,2012) that might be able to replace those that could belost or weakened by environmental pressure.
Identification of key microbial types affectedby CO2 effects
General compositional changes. From a total of 39 535bacterial sequences in our main data set, we taxonomi-cally identified 4892 (out of 7443) bacterial OTUs, amongwhich 1.5% occurred in at least 50% of all sites and two ofthe three sampling areas. From these 1.5%, 27% had asignificant positive and 21% a significant negative linearrelationship with increasing pCO2, corresponding to 41%and 18% of bacterial sequences in the data set respec-tively. From a total of 21 021 archaeal sequences, wetaxonomically identified 2749 (out of 3367) archaealOTUs, among which 1.9% occurred in at least 50% of allsites in the Upa-Upasina sampling area. From these1.9%, 15% had a significant positive and 2% a significantnegative linear relationship with increasing pCO2, corre-sponding to 25% and 37% of archaeal sequences in thedata set respectively.
To further identify the microbial types that contributedthe most to the observed changes in microbial richnessand community composition at high pCO2 sites, we per-formed a detailed taxonomic analysis of the 16S rRNAgene libraries: From all taxonomically identified bacterialMPTS OTUs, taxonomic information could be assigned to98.5% on the phylum, 96.7% on the class level and 80.9%on the family level. From all taxonomically identifiedarchaeal OTUs, 96.5% could be taxonomically assignedto the phylum level, 91.3% to the class level and 48.6% tothe family level. At all sites, the communities weredominated by the bacterial classes Alphaproteobacteria,Deltaproteobacteria, Gammaproteobacteria, Actino-bacteria, Flavobacteria, Acidobacteria and Plancto-mycetacia (Fig. S4). The archaeal communities weredominated at all sites by the Crenarchaeota classesMarine Group I, Thermoprotei and pSL12 as well asthe Euryarchaeota classes Thermoplasmata, Methano-microbia and Halobacteria (Fig. S5).
Among the bacterial types (here considering variouslevels of taxonomic resolution) that only occurred atcontrol, medium or high pCO2 sites, none could be
3682 F. F. Raulf et al.
© 2014 The Authors. Environmental Microbiology published by Society for Applied Microbiology and John Wiley & Sons Ltd,Environmental Microbiology, 17, 3678–3691

conspicuously associated to a known microbial function(Table S3). One explanation could be that a pCO2
increase of approximately 1000 μatm is not extremeenough to favour the development of completely differentor endemic microbial communities when compared withlocal background (control) conditions, but rather leads togradual shifts among the coexisting communities. Sup-porting this hypothesis, we found significant linearincreases in relative sequence abundances with decreas-ing pH for a large number of bacterial and archaealsequences when the P values of the partial multipleregression models were set to < 0.1.
At broad taxonomic resolution levels, we found signifi-cant linear increases in relative sequence abundance withdecreasing pH for the bacterial phyla Bacteroidetes(R 2 = 0.47, P = 0.014) and Proteobacteria (R 2 = 0.35,P = 0.042), as well for the dominant archaeal Crenar-chaeota class Thermoprotei (R 2 = 0.43, P = 0.078)(Table S4). An overall significant decrease of sequenceabundances with decreasing pH was found for thebacterial phyla Nitrospirae (R 2 = 0.38, P = 0.032) andActinobacteria (R 2 = 0.28, P = 0.079) as well as for theCrenarchaeota class Marine Group I (R 2 = 0.49,P = 0.052; Fig. 3) (Table S5).
Taxa potentially associated with the nitrogen cycle.Marine Group I are suspected to be among the mostabundant marine microorganisms (DeLong, 1992) andmade up to 37% of all archaeal sequences in our data set.Nevertheless, one prominent OTU, whose representativesequence was identified as Nitrosopumilus maritimus[99% nucleotide (nt) identity], made up to 13% of allarchaeal sequences and increased in relative sequenceabundance with seawater acidification (R2 = 0.51,P = 0.046; Fig. 3; Table S5). As a member of the newlydefined phylum Thaumarchaeota, which consists of amajor group of ammonia-oxidizing archaea (AOA), previ-ously assigned to the diverse Marine Group I (Könnekeet al., 2005), N. maritimus is known for its high affinityto oxygen and for growing chemoautotrophically onammonia with inorganic carbon as sole carbon source(Walker et al., 2010). Concomitantly, the only sequences ofammonia-oxidizing bacteria (AOB) identified in our datasignificantly decreased with increasing seawater acidi-fication and were identified as GammaproteobacteriaNitrosococcus sp. (R2 = 0.32, P = 0.057; Fig. 3; Table S4),representing 1% of all bacterial sequences.
It is known that many AOA, in contrast to AOB, seemto be adapted to thrive even under oligotrophic ammoniaconcentrations, with N. maritimus even showing thehighest substrate affinity to ammonia among all micro-organisms known to date (Martens-Habbena et al.,2009). Another very distinctive property of manyThaumarchaeota, which is of special relevance to OA, is
their ability to perform nitrification at neutral or lower pH:Lehtovirta-Morley and colleagues (2011) even reported anacidophilic nitrifying Thaumarchaeota, isolated from soil,with an optimum pH < 5. Despite the ratios of ammoniaoxidation to nitrite being in the range of known AOB, it hastherefore been suggested that AOA might use a differentnitrification mechanism (Martens-Habbena et al., 2009;Walker et al., 2010; Stahl and de la Torre, 2012).
Although most strains of nitrifying bacteria are known tobe pH sensitive with an optimal growth range between pH7 and pH 8 (Tarre et al., 2004), there is evidence for theexistence of acid-tolerant AOB communities (De Boer andKowalchuk, 2001; Gieseke et al., 2006). Acid tolerancedoes not seem to be connected to any uncommon AOBtaxa, but clearly requires physiological adaptations, suchas ammonium ion transporters (Gieseke et al., 2006)because AOB require NH3 for their ammonia mono-oxygenase. Because NH3 is decreasing 10-fold with any1-unit reduction in pH through protonation to NH4
+, non-acid-tolerant communities may become substrate limitedin acidified seawater (Stahl and de la Torre, 2012). It is notyet clear how common acid-tolerant AOB communitiesare in marine coastal sediments. Our observation of adecrease in AOB sequences therefore tends to support aprevious study that reported a decrease in bacterialammonia oxidation rates as a common response to acidi-fication in marine environments (Beman et al., 2011),while keeping in mind that changes in sequence relativeabundance do not necessarily translate directly tochanges in process rates.
Although AOA seem to dominate ammonia-depletedregions of the ocean, there are many environments, suchas coastal ecosystems, where they are outcompeted bysubstrate competition with AOB and phytoplankton forammonia (Martens-Habbena et al., 2009; Stahl and de laTorre, 2012). Although we could not find any significantchange in sequence abundances of major nitrogen-fixingbacteria or archaea in the sediment, Hutchins andcolleagues (2009) reported evidence for elevated nitrogenfixation rates in the water column, based on a fertilizingeffect of CO2 as well as the range expansion of tempera-ture sensitive nitrogen-fixing organisms, in a warmerocean. Potentially higher availability of ammonium, fromnitrogen fixation in the water column, which was not meas-ured in this study, might offer an advantage to AOB,whereas AOA, which generally seem better adapted tooligotrophic ammonium levels (Stahl and de la Torre,2012), could profit from lower pH levels and from thedepletion of AOB in an acidified future ocean. In a short-term incubation experiment with coastal arctic sediment,Tait and colleagues (2014) could show that 2 weeks ofincreased pCO2 exposure at 760 μatm leads to adecreased transcription of bacterial ammonia-oxidizinggenes (amoA), whereas archaeal amoA transcript
Impact of ocean acidification on microbial diversity 3683
© 2014 The Authors. Environmental Microbiology published by Society for Applied Microbiology and John Wiley & Sons Ltd,Environmental Microbiology, 17, 3678–3691
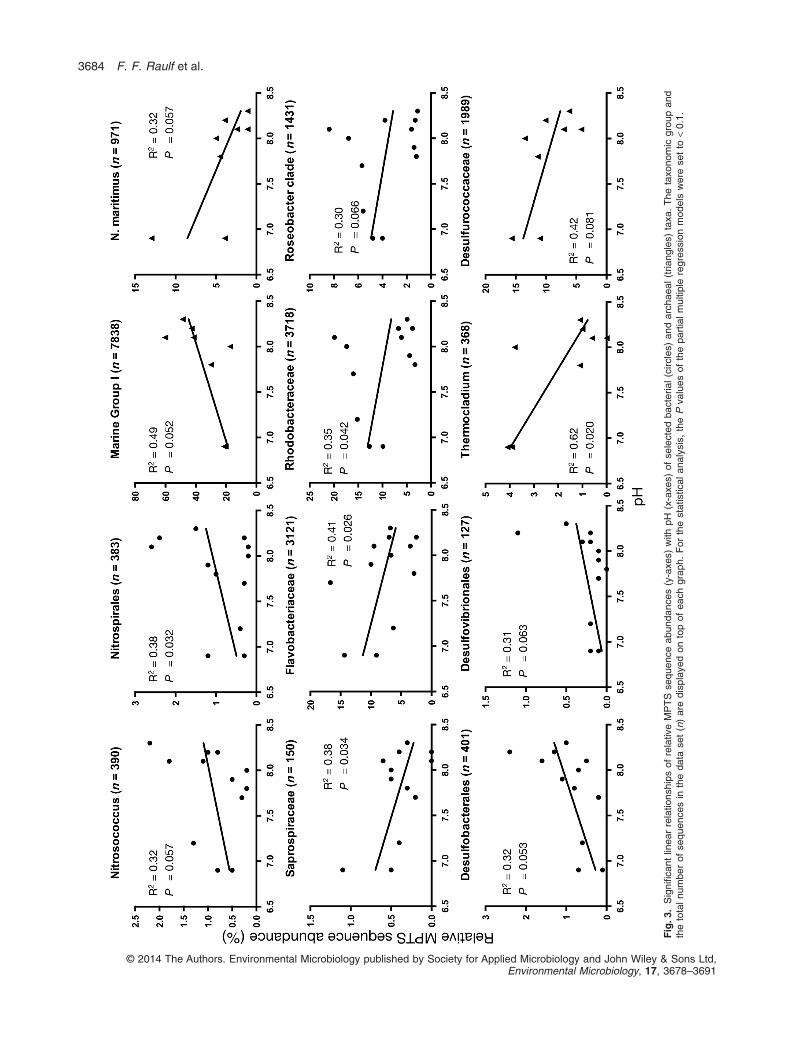
Fig
.3.
Sig
nific
ant
linea
rre
latio
nshi
psof
rela
tive
MP
TS
sequ
ence
abun
danc
es(y
-axe
s)w
ithpH
(x-a
xes)
ofse
lect
edba
cter
ial(
circ
les)
and
arch
aeal
(tria
ngle
s)ta
xa.
The
taxo
nom
icgr
oup
and
the
tota
lnum
ber
ofse
quen
ces
inth
eda
tase
t(n
)ar
edi
spla
yed
onto
pof
each
grap
h.F
orth
est
atis
tical
anal
ysis
,th
eP
valu
esof
the
part
ialm
ultip
lere
gres
sion
mod
els
wer
ese
tto
<0.
1.
3684 F. F. Raulf et al.
© 2014 The Authors. Environmental Microbiology published by Society for Applied Microbiology and John Wiley & Sons Ltd,Environmental Microbiology, 17, 3678–3691

numbers seemed not to be affected. At such acidificationlevels, Gazeau and colleagues (2014) could not detect anyeffect on the simultaneously measured sediment nitrogenfluxes within the limited time frame of this experiment,suggesting that AOA could, up to a certain point, compen-sate for putatively lower AOB activity. Such an activity shiftfrom AOB to AOA could also explain the finding by Kitidisand colleagues (2011), who detected no effect on ammoniaoxidation in coastal sediments with a history of long-termexposure to increased CO2 from vents off the island ofIschia in the Mediterranean Sea.
Although in our data set, the increased occurrence ofN. maritimus sequences with acidification was accompa-nied by a decrease in AOB sequences, it is interesting tonote that sequences of all identified Nitrospirales, whichmade up 49% of all nitrite-oxidizing bacteria (NOB) iden-tified in our data set, decreased with lower pH values(R2 = 0.38, P = 0.032; Fig. 3; Table S4). This couldsuggest that ammonia oxidation rates might in fact belower in communities that have an increased proportion inAOA, and this hypothesis should be tested in future work.Nevertheless, the quantitative aspect of the trendsreported in our study should be taken with caution as it isthe case with any polymerase chain reaction (PCR)-based methods, which do not represent true changes inorganism abundances.
Taxa potentially related to the sulfur cycle. It is notexpected that seawater acidification directly affects sulfuror sulfate reduction in sediments (Koschorreck, 2008), butamong the sulfate-reducing bacteria, we found sequencesof two obligate anaerobic deltaproteobacterial groups, theacetate-oxidizing Desulfobacterales and the non-acetate-oxidizing Desulfovibrionales with a significant negativelinear relationship with increasing seawater acidification(R2 = 0.32, P = 0.053; and R2 = 0.31, P = 0.063 respec-tively; Fig. 3; Table S4). Together, they represent 14% of allbacterial sequences in the data set that could be identifiedas potential sulfate reducers. In contrast to bacterial sulfatereducers, we found a linear increase with acidification forsequences of the sulfate-reducing Crenarchaeota familyThermocladium (R2 = 0.62, P = 0.020; Fig. 3; Table S5),which represented 22% of all putative sulfate-reducingarchaea in our data set as well as the sulfur-reducingCrenarchaeota order Desulfurococcaceae (R 2 = 0.42,P = 0.081; Fig. 3; Table S5). Their OTUs were distantlyrelated to Thermocladium modestius (74% nt identity),which has been shown to grow optimally at pH 4.0 andIgnicoccus pacificus (74% nt identity) that can growbetween pH 4.5–7.0 respectively (Itoh et al., 1998; Huberet al., 2000).
Taxa potentially related to extreme conditions.Thermocladium species and Desulfurococcaceae species
seem to be limited to extreme temperatures from 60 to100°C (Madigan et al., 1997; Huber et al., 2000). BesidesThermocladium, we found sequences of other putativelyextremophilic microorganisms with positive linear relation-ships to decreasing pH, such as sequences of theEuryarchaeota class of Thermoplasmatales, which con-tains three thermophilic and extremely acidophilic genera,including the most acidophilic of all known organisms witha favoured growth range at pH 0.5–4.0 (Cowan, 2000).We found bacterial sequences associated with the genusRhodothermus, which is currently assigned to theRhodothermaceae of the phylum Bacteroidetes, to signifi-cantly increase in abundance with increasing CO2 effect(R2 = 0.30, P = 0.065; Table S4). Species described so fargrow at a pH range of 6.0–8.0 and temperatures range of55–80°C (Marteinsson et al., 2010). Also, an increase insequences of the order Flavobacteriaceae, which isknown to have very limited tolerance to elevated tempera-tures above 50°C and which is one of the most dominantbacterial groups found at our high pCO2 sites, questionsthe occurrence of an active extremophilic community inthe sampled sediments. Because the seeping is of vol-canic origin, one explanation could be that extremophilicmembers actually grow in the deeper hot subsurface andare transported to the surface through CO2 seepages. Assuch, they might be considered as contaminants of thesurface sedimentary communities.
Taxa related to the carbon cycle. Among the dominantbacterial phyla, Bacteroidetes (10% of all bacterialsequences), we found sequences associated with theorder Saprospiraceae, which significantly increased withincreasing pCO2 (R2 = 0.38, P = 0.034; Fig. 3; Table S4).Saprospiraceae are well known as major heterotrophicconsumers of plant biomass and are common in marinelittoral sand and coastal zones in various locationsworldwide (Delk and Dekker, 1972; Saw et al., 2012).Sequences of the dominant family Flavobacteriaceae(8% of all bacterial sequences) significantly increasedwith seawater acidification (R2 = 0.41, P = 0.026; Fig. 3;Table S4), with the most dominant OTUs being closelyrelated to Aquimarina species, especially one prominentOTU (R2 = 0.53, P = 0.007; Table S4), which made up to14% of all Flavobacteriaceae sequences and was closelyrelated to Aquimarina mytili (95% nt identity). This specieswas recently isolated and described to grow optimally atpH 7.0 and 25–30°C (Park et al., 2012). Another promi-nent Flavobacteriaceae OTU (R2 = 0.33, P = 0.051, rep-resenting 26% of all Flavobacteriaceae; Table S4) wasfound to be closely related to Actibacter sediminis (96% ntidentity) with an optimum growth at at pH 6.0 and 37°C(Kim et al., 2008). Generally, most members of theFlavobacteriaceae are all widely distributed in oxic marineenvironments and are aerobic chemoheterotrophs.
Impact of ocean acidification on microbial diversity 3685
© 2014 The Authors. Environmental Microbiology published by Society for Applied Microbiology and John Wiley & Sons Ltd,Environmental Microbiology, 17, 3678–3691

Typically, they abundantly occur in sediments when suffi-cient oxygen is available, for instance within surfacemixed layers with oxygenating influence by bioturbationor oceanic currents (Bowman, 2006). Similar toSaprospiraceae, Flavobacteriaceae play a prominent rolein the degradation of complex polymeric substrates inmarine environments and are often associated with theoccurrence of large amounts of plant detrital biomass(Bowman, 2006; Klippel et al., 2011). The higher cover ofalgae and seagrass at the high pCO2 sites might thereforebe an even more relevant reason for the observedincrease in both Flavobacteriaceae and Saprospiraceaesequences.
Another major group of bacteria that significantlyincreased in sequence abundance with pCO2 was theAlphaproteobacteria order Rhodobacteraceae (R2 = 0.35,P = 0.042, representing 9% of all bacterial sequences;Fig. 3; Table S4). These are known to include acidophilictypes, with a growth optimum at pH 6.0 (Madigan et al.,1997). But among the Rhodobacteraceae bacteria, thegroup of the so-called Roseobacter clade seemed to mostprominently profit from low pH conditions (linear increaseR2 = 0.30, P = 0.066; Fig. 3; Table S4), making up to 39%of all Rhodobacteraceae sequences. Two very prominentOTUs with positive linear relationships to decreasing pHwere closely related to Phaeobacter daeponensis (100%nt identity), which was isolated from a tidal flat in theYellow Sea, Korea, and to Phaeobacter gallaeciensis(92% nt identity), which was isolated from the GermanWadden Sea. Both species have been reported togrow optimally at seawater pH < 7.0–8.0 and have achemoheterotrophic and obligate aerobic metabolism(Martens et al., 2006; Yoon et al., 2007). Generally, bac-teria of this group have been isolated from habitats allover the world and are known to be one of the mostabundant groups in marine environments (Martens et al.,2006).
Many Flavobacteriaceae, Saprospiraceae andRoseobacter types are often found associated withmarine algae, seagrasses and coastal biofilms (Buchanet al., 2005). Interestingly, Teira and colleagues(2012) observed no direct effect on cell numbers orbiomass of Rhodobacteraceae strain MED165 andFlavobacteriaceae strain MED217 when experimentallytreated with increased pCO2 alone. This supports ourhypothesis that those bacterial groups could profit from apCO2-induced increase in algal and seagrass biomassinstead of being directly influenced by the seawater chem-istry. CO2 effects of increased seawater acidification onAlphaproteobacteria and Rhodobacteraceae as well asBacteroidetes and Flavobacteriaceae have been reportedbefore: At Upa-Upasina, also one of our study sites,Morrow and colleagues (2014) observed that increasingCO2 in the seawater was accompanied by an increase in
relative MPTS sequence abundance of Flavobacteriaassociated with the hard coral Porites cylindrica. AlsoVega Thurber and colleagues (2009) experimentallyshowed that numbers of Flavobacteriaceae on coralsurfaces increased under low pH conditions, whereasMeron and colleagues (2010) reported a positive effectof acidified seawater on the occurrence of Rhodo-bacteraceae on coral tissue. Nevertheless, becausemany Flavobacteriaceae and Rhodobacteraceae are alsoassociated with coral diseases (Cooney et al., 2002;Meron et al., 2010), the reason for an increase in abun-dances could, in those cases, be related to the coralsthemselves, which may be stressed by acidification andtherefore more prone to infections.
In biofilms developing on glass slides and exposed toacidified seawater from the Great Barrier Reef, someFlavobacteriaceae were reported to increase in relativeabundances with decreasing pH, whereas, in contrast toour results, members of the Roseobacter clade showed adecreasing trend with rising pCO2 (Witt et al., 2011). Inaddition, Krause and colleagues (2012) experimentallyshowed that the community composition of microbialbatch cultures, originating from the North Sea watercolumn, significantly changed under the influence of smallreductions in seawater pH and was accompanied bypH-dependent dissimilarities mostly caused by changesin Flavobacteriaceae and by a higher proportion ofRhodobacteraceae at ambient seawater pCO2.
For some bacterial and archaeal taxa, which generallyshowed significant linear relationships with decreasingpH, we found sequence occurrences of subgroups, whichcould better be described by quadratic relationships,which suggests modal distributions rather than linearchanges along the pH gradient. Nevertheless, with theexception of sequences related to unidentified MarineGroup I OTUs, quadratic relationships of sequence occur-rences with pH were scarce in our data set and seemed torepresent rather complex relationships, for which it mightbe too speculative to discuss functional ecologicalpatterns apart from possible niche differentiations. Neve-rtheless, we provide the results based on quadratic rela-tionships and those related to microbial taxa withoutobvious ecological functions in the Supporting Informationsection (Text S1 and Tables S6 and S7).
Conclusions
Our results strongly support the hypothesis that the nitro-gen cycle might be directly affected by rising oceanicpCO2, with possible disadvantages for AOB and advan-tages for better adapted AOA. At our study sites, CO2-induced seawater acidification leads to a gradual increasein the cover of benthic primary producers, namely algaeand seagrasses. The expected increase in biomass turno-
3686 F. F. Raulf et al.
© 2014 The Authors. Environmental Microbiology published by Society for Applied Microbiology and John Wiley & Sons Ltd,Environmental Microbiology, 17, 3678–3691

ver may explain the observed increase in organic matterdegrading bacterial groups from the Flavobacteriaceae,Roseobacter clade or Saprospiraceae. Besides thesechanges in taxonomic groups, we clearly evidenced anincrease in bacterial and archaeal richness and anincrease in rare OTUs along the acidification gradient.Even after factoring out the temporal shift in communitiesbetween two sampling years, we still observed a strongstructuring effect of increased pCO2 on bacterial andarchaeal communities. Therefore, our study clearlyreveals the sensitivity of complex natural bacterial andarchaeal communities to seawater acidification, asexpected for our future oceans, and identified the micro-bial components that are most likely to be affected.
Experimental procedures
Samples and sites
The three natural CO2-seeping areas, called Upa-Upasina,Esa’Ala and Dobu, are located around the D’EntrecasteauxIslands in the Milne Bay Province of Papua New Guinea(Fig. S1) and were first described by Fabricius andcolleagues (2011). The gas composition at the studied siteshas been measured by Fabricius and colleagues (2011). At allthree venting areas, the gas consists of over 99% CO2, withtraces of O2, N2 and CH4, whereas no C2H2 or N2O could bedetected. The gas emitted at Upa-Upasina and Esa’Ala isH2S-free, whereas the gas at Dobu contains about 163 ppmH2S. Arsenic and 10 heavy metals (V, Cr, Co, Ni, Cu, Ga, Mo,Cd, Pb and U) were measured in the seawater above thebenthos at all control and seep areas by Uthicke andcolleagues (2013). They found no significant differencebetween seep and non-seep sites, and all concentrationswere in ranges expected for pristine seawater. All seepsinvestigated in this study are assumed to have existed for atleast seven decades (Fabricius et al., 2011).
Our study was based on 18 samples taken in 2010 and 6samples taken in 2011, of the upper three centimetres of theoxic zone of sandy sediment at a water depth of 1–4 m(Table S1). All samples were immediately frozen and storedat −20°C until analysis. Control sites consisted of fivesediment-sampling sites in 2010 and two in 2011, which werelocated at proximity of the seeps with very similar environ-mental settings, but not directly affected by CO2 emissions.Their seawater pH levels ranged from 8.3 to 8.1 (NBS scale),corresponding to typical ambient pCO2 concentrations of360–400 μatm. The 13 sediment-sampling sites from 2010with increased seawater acidification levels were sampled torepresent a gradient, ranging from pH 8.0 to pH 6.9 (pCO2
concentrations of 620–1500 μatm). The most continuous pHgradient was found at the site Upa-Upasina, from which eightsamples were taken in 2010, including two control areas atopposite sites from the venting area along the coast. In 2011,two additional samples were taken from a CO2-seeping sitenear Dobu with an average pH of 7.7, as well as two samplesfrom a close-by venting area with an average pH of 6.8, andtwo from the Dobu control site (pH 8.2). Although the samplesfrom 2010 represent the main data set for this study, the sixsamples from 2011 were used to get an estimate of commu-
nity shift over time. The pH values in the overlaying water andin the upper sediment layer were measured during the fieldexpeditions in 2010 and 2011, when the samples for thisstudy were taken.
In terms of benthic cover, Fabricius and colleagues (2011)observed that with decreasing seawater pH, structurallycomplex coral communities gradually shift to assemblagesdominated by slow-growing, long-lived and structurallysimple Porites. Despite this change in community composi-tion, coral cover remained stable in the range of pH 8.1–7.8,whereas no reef development was found at sites with> 1000 μatm pCO2. For plant and algal cover, a loss of cor-alline species with decreasing pH was accompanied by anincrease in seagrass and non-calcareous macroalgae(Fabricius et al., 2011; Russell et al., 2013). In surface sedi-ments, concentrations of OC, nitrogen and siliceous spiculesdid not change along the gradient, whereas inorganic carbon,for instance in form of the remains of calcareous species,was only found in relevant amounts at sites with pCO2
< 1000 μatm (Uthicke et al., 2013).
DNA extraction and microbial community fingerprinting
Total community DNA from each sample was isolated from1 g well-mixed sediment using UltraClean Soil DNA Isolationkits (MoBio Laboratories, Carlsbad, CA, USA). Two aliquotswith a final volume of 50 μl of Tris-EDTA buffer were stored at−20°C until analysis. DNA concentrations were determinedspectrophotometrically using a NanoQuant infinite M2000(Tecan Group, Männedorf, Switzerland). The DNA of all 18sediment samples from 2010 was analysed via the molecularfingerprinting technique ARISA (Fisher and Triplett, 1999)using a triplicate PCR approach. For each PCR, the amountof DNA was adjusted to 25 ng. PCR amplification, analysis ofamplified fragments via capillary electrophoresis and subse-quent binning into OTUs were done as described previously(Ramette, 2009). An OTU was considered present in asample only if it appeared in at least two out of the three PCRreplicates for that sample.
MPTS
The combination of the molecular techniques ARISA andMPTS, used in this study, has been successfully appliedbefore (Bienhold et al., 2012; Gobet et al., 2013; Jacob et al.,2013), because it allows an extensive assessment of overallα- and β-diversity, while leaving the opportunity of targetingspecific samples via MPTS for a deeper diversity analysisand for taxonomic identification of key microbial indicators.Samples for which complete and comparable environmentalparameters were available were chosen for MPTS. Thesequencing was done via the Roche 454 FLX+ system(Roche, Basel, Switzerland) at the Research and TestingLaboratory (Lubbock, Texas, USA). For bacterial communi-ties, DNA of 12 samples from 2010 and all 6 samples from2011 were amplified with primers targeting the bacterialV1-V3 region (Gray28F 5′-TTTGATCNTGGCTCAG-3′). Forthe archaeal community, eight samples from 2010 from siteUpa-Upasina were amplified with primers targeting thearchaeal V6 region (Arch349F 5′-GYGCASCAGKCGMGAAW-3′). Sequences were deposited with the European
Impact of ocean acidification on microbial diversity 3687
© 2014 The Authors. Environmental Microbiology published by Society for Applied Microbiology and John Wiley & Sons Ltd,Environmental Microbiology, 17, 3678–3691

Nucleotide Archive under study accession numberPRJEB7705 and sample accession numbers ERS580491-ERS580498 for archaeal samples U1 to U8, respectively, andsample accession numbers ERS580473- ERS580490 forbacterial samples U1-U8, E1, E7, D1, D3, CST, CSB, BST,BSB, ST and SB respectively.
Denoising (i.e. pyrosequencing noise removal), trimming,error correction (chimera and PCR errors) of the MPTSsequences were implemented with the mothur pipeline(version 1.23.1; Schloss et al., 2009). For alignment andtaxonomic assignment of the bacterial and archaealsequences, SILVA reference databases (both, version 115)provided with the mothur pipeline were used. MPTS OTUswere defined at the 3% nt difference level. OTU richness wasestimated with the Chao1 richness estimator, which takesinto consideration the number of rare sequences while cor-recting for the estimated undiscovered species being presentin a sample (Chao, 1984). Chao1 richness was only calcu-lated after re-sampling every sample to the lowest number ofsequences found in any sample. The inverse Simpson’sindex (Simpson, 1949) was used to measure the evenness ofthe diversity in each sample as the index is maximized whenall OTUs are equally represented. For all bacterial andarchaeal OTUs significantly changing with the pCO2 gradient,we performed a systematic search for described microbialnucleotide sequences via the BASIC LOCAL ALIGNMENT SEARCH
TOOL (BLAST; standard nucleotide data base for bacterial andarchaeal 16S rRNA genes; Altschul et al., 1990) using thebest representative sequences for each OTU, followed byfiltering of the results for sequences matching with > 90% ntidentity, > 98% query coverage and E-value < 10−6.
Statistical analysis
The multivariate statistical analyses of all molecular data fromARISA and MPTS, along with the measured environmentalparameters, were performed with the R statistical language(version 2.15.0; R Core Team, 2013, URL: http://www.R-project.org), using the R packages ‘MASS’ (Venables andRipley, 2002) and ‘vegan’ (Oksanen et al., 2013) to performnon-metric multidimensional scaling, one-way ANOSIM,stepwise model selection, canonical RDA and associatedpermutation tests (reviewed in Ramette, 2007). For the singleOTU analysis, changes in the sequence abundance of anOTU were considered to be significant when the P values ofthe partial multiple regression model (1000 permutations)were < 0.1, after false discovery rate correction (Benjaminiand Hochberg, 1995). To quantify the specific pCO2 effects oncommunity variation while disentangling the effects of othermeasured parameters, we performed RDA with modelsincluding the environmental parameters pCO2/pH, totalcarbon content, nitrogen content, as well as geographic dis-tances between the sampling sites (Table S1, partly pub-lished by Uthicke et al., 2013). Scripts of the MULTICOLA
software (version 1.5, available at URL: http://www.mpi-bremen.de/Software_2.html; Gobet et al., 2010) were used toassess the effects of rare MPTS OTUs on the reported eco-logical interpretations. For some statistical analysis, siteswere grouped into the three categories (control, medium andhigh pCO2), corresponding to the pH ranges of 8.3–8.1, 8.1–7.7 and 7.7–6.9 respectively. Statistical tests to compare
models of linear and quadratic relationships of relative MPTSsequence abundances with environmental parameters wereperformed as described in Makarenkov and Legendre (2002).Significant linear relationships of taxa and OTUs were onlyconsidered if there was no significantly better quadraticmodel found.
Acknowledgements
We thank the Australian Institute of Marine Science (AIMS)for funding the field work, the owners of the Upa-Upasina,Dobu and Esa’Ala reefs for allowing us to study their reefs,and the crew and Captain of the Chertan (Milton Bay Enter-prises). We also thank the Dobu RLLG, the Milne BayProvince Research Committee, and the Department of Envi-ronment and Conservation of Papua New Guinea for deliv-ering permits and for the logistic support. The study wassupported by the Deutsche Forschungsgemeinschaft and theFederal Ministry of Education and Research (BMBF) in theframework of the BIOACID project, and by the Max PlanckSociety.
References
Altschul, S.F., Gish, W., Miller, W., Myers, E.W., and Lipman,D.J. (1990) Basic local alignment search tool. J Mol Biol215: 403–410.
Andersson, A.J., Bates, N.R., and Mackenzie, F.T. (2007)Dissolution of carbonate sediments under rising pCO2 andocean acidification: observations from Devil’s Hole,Bermuda. Aquat Geochem 13: 237–264. doi:10.1007/s10498-007-9018-8.
Beman, J.M., Chow, C.E., King, A.L., Feng, Y., Fuhrman,J.A., Andersson, A., et al. (2011) Global declines in oceanicnitrification rates as a consequence of ocean acidification.Proc Natl Acad Sci USA 108: 208–213. doi:10.1073/pnas.1011053108.
Benjamini, Y., and Hochberg, Y. (1995) Controlling the falsediscovery rate: a practical and powerful approach to multi-ple testing. J Roy Stat Soc B 57: 289–300.
Berntson, G.M., and Bazzaz, F.A. (1997) Nitrogen cycling inmicrocosms of yellow birch exposed to elevated CO2:simultaneous positive and negative below-ground feed-backs. Glob Change Biol 3: 247–258.
Bienhold, C., Boetius, A., and Ramette, A. (2012) Theenergy-diversity relationship of complex bacterial commu-nities in Arctic deep-sea sediments. ISME J 6: 724–732.doi:10.1038/ismej.2011.140.
Böer, S.I., Hedtkamp, S.I.C., van Beusekom, J.E.E.,Fuhrman, J.A., Boetius, A., and Ramette, A. (2009) Time-and sediment depth-related variations in bacterial diversityand community structure in subtidal sands. ISME J 3:780–791. doi:10.1038/ismej.2009.29.
Boles, B.R., Thoendel, M., and Singh, P.K. (2004) Self-generated diversity produces insurance effects in biofilmcommunities. Proc Natl Acad Sci USA 101: 16630–16635.
Bouvier, T., Venail, P., Pommier, T., Bouvier, C., Barbera, C.,and Mouquet, N. (2012) Contrasted effects of diversityand immigration on ecological insurance in marinebacterioplankton communities. PLoS ONE 7: e37620.doi:10.1371/journal.pone.0037620.
3688 F. F. Raulf et al.
© 2014 The Authors. Environmental Microbiology published by Society for Applied Microbiology and John Wiley & Sons Ltd,Environmental Microbiology, 17, 3678–3691

Bowman, J.P. (2006) The Marine Clade of the FamilyFlavobacteriaceae: The Genera Aequorivita, Arenibacter,Cellulophaga, Croceibacter, Formosa, Gelidibacter,Gillisia, Maribacter, Mesonia, Muricauda, Polaribacter,Psychroflexus, Psychroserpens, Robiginitalea,Salegentibacter, Tenacibaculum, Ulvibacter, Vitellibacterand Zobellia. In The Prokaryotes. Dworkin, M., Falkow, S.,Rosenberg, E., Schleifer, K., and Stackebrandt, E. (eds).New York, NY, USA: Springer New York, pp. 677–694.
Buchan, A., González, J.M., and Moran, M.A. (2005) Over-view of the marine Roseobacter lineage. Appl EnvironMicrobiol 71: 5665–5677. doi:10.1128/AEM.71.10.5665-5677.2005.
Chao, A. (1984) Nonparametric estimation of the number ofclasses in a population. Scand J Stat 11: 265–270.
Cooney, R.P., Pantos, O., Le Tissier, M.D., Barer, M.R.,O’Donnell, A.G., and Bythell, J.C. (2002) Characterizationof the bacterial consortium associated with black banddisease in coral using molecular microbiological tech-niques. Environ Microbiol 4: 401–413.
Cowan, D. (2000) Use your neighbour’s genes. Nature 407:466–467. doi:10.1038/35035195.
De Boer, W., and Kowalchuk, G.A. (2001) Nitrification in acidsoils: micro-organisms and mechanisms. Soil Biol Biochem33: 853–866.
Decho, A.W. (2000) Microbial biofilms in intertidal systems:an overview. Cont Shelf Res 20: 1257–1273.
Delk, A.S., and Dekker, C.A. (1972) Characterization ofrhapidosomes of Saprospira grandis. J Mol Biol 64: 287–295.
DeLong, E.F. (1992) Archaea in coastal marine environ-ments. Proc Natl Acad Sci USA 89: 5685–5689.
Diaz, S., Grime, J.P., Harris, J., and McPherson, E. (1993)Evidence of a feedback mechanism limiting plant responseto elevated carbon dioxide. Nature 364: 616–617.
Fabricius, K.E., Langdon, C., Uthicke, S., Humphrey, C.,Noonan, S., Death, G., et al. (2011) Losers and winners incoral reefs acclimatized to elevated carbon dioxide con-centrations. Nat Clim Change 1: 165–169. doi:10.1038/NCLIMATE1122.
Fisher, M.M., and Triplett, E.W. (1999) Automated approachfor ribosomal intergenic spacer analysis of microbial diver-sity and its application to freshwater bacterial communities.Appl Environ Microbiol 65: 4630–4636.
Gazeau, F., van Rijswijk, P., Pozzato, L., and Middelburg, J.J.(2014) Impacts of ocean acidification on sediment pro-cesses in shallow waters of the Arctic Ocean. PLoS ONE 9:e94068. doi:10.1371/journal.pone.0094068.
Gieseke, A., Tarre, S., Green, M., and de Beer, D. (2006)Nitrification in a biofilm at low pH values: role of in situmicroenvironments and acid tolerance. Appl EnvironMicrobiol 72: 4283–4292. doi:10.1128/AEM.00241-06.
Girvan, M.S., Campbell, C.D., Killham, K., Prosser, J.I., andGlover, L.A. (2005) Bacterial diversity promotes communitystability and functional resilience after perturbation.Environ Microbiol 7: 301–313.
Gobet, A., Quince, C., and Ramette, A. (2010) MultivariateCutoff Level Analysis (MultiCoLA) of large community datasets. Nucleic Acids Res 38: e155. doi:10.1093/nar/gkq545.
Gobet, A., Böer, S.I., Huse, S.M., van Beusekom, J.E.,Quince, C., Sogin, M.L., et al. (2012) Diversity and dynam-
ics of rare and of resident bacterial populations in coastalsands. ISME J 6: 542–553. doi:10.1038/ismej.2011.132.
Gobet, A., Boetius, A., and Ramette, A. (2013) Ecologicalcoherence of diversity patterns derived from classical fin-gerprinting and Next Generation Sequencing techniques.Environ Microbiol 16: 2672–2681. doi:10.1111/1462-2920.12308.
Hall-Spencer, J.M., Rodolfo-Metalpa, R., Martin, S.,Ransome, E., Fine, M., Turner, S.M., et al. (2008) Volcaniccarbon dioxide vents show ecosystem effects of oceanacidification. Nature. doi:10.1038/nature07051.
Harley, C.D., Randall Hughes, A., Hultgren, K.M., Miner,B.G., Sorte, C.J., Thornber, C.S., et al. (2006) The impactsof climate change in coastal marine systems. Ecol Lett 9:228–241. doi:10.1111/j.1461-0248.2005.00871.x.
Hewson, I., Jacobson Meyers, M.E., and Fuhrman, J.A.(2007) Diversity and biogeography of bacterial assem-blages in surface sediments across the San Pedro Basin,Southern California Borderlands. Environ Microbiol 9: 923–933. doi:10.1111/j.1462-2920.2006.01214.x.
Huber, H., Burggraf, S., Mayer, T., Wyschkony, I., Rachel, R.,and Stetter, K.O. (2000) Ignicoccus gen. nov., a novelgenus of hyperthermophilic, chemolithoautotrophicArchaea, represented by two new species, Ignicoccusislandicus sp nov and Ignicoccus pacificus sp nov. andIgnicoccus pacificus sp. nov. Int J Syst Evol Microbiol 50(Part 6): 2093–2100.
Hutchins, D.A., Mulholland, M.R., and Fu, F. (2009) Nutrientcycles and Marine Microbes in a CO2-Enriched Ocean.Oceanography 22: 128–145.
Itoh, T., Suzuki, K., and Nakase, T. (1998) Thermocladiummodestius gen. nov., sp. nov., a new genus of rod-shaped,extremely thermophilic crenarchaeote. Int J Syst Bacteriol48 (Part 3): 879–887.
Jacob, M., Soltwedel, T., Boetius, A., and Ramette, A. (2013)Biogeography of Deep-sea benthic bacteria at regionalscale (LTER HAUSGARTEN, Fram Strait, Arctic). PLoSONE 8: e72779. doi:10.1371/journal.pone.0072779.
Joint, I., Doney, S.C., and Karl, D.M. (2010) Will ocean acidi-fication affect marine microbes? ISME J 5: 1–7.doi:10.1038/ismej.2010.79.
Kim, J.H., Kim, K.Y., Hahm, Y.T., Kim, B.S., Chun, J., andCha, C.J. (2008) Actibacter sediminis gen. nov., sp. nov., amarine bacterium of the family Flavobacteriaceae isolatedfrom tidal flat sediment. Int J Syst Evol Microbiol 58: 139–143. doi:10.1099/ijs.0.65346-0.
Kitidis, V., Laverock, B., McNeill, L.C., Beesley, A.,Cummings, D., Tait, K., et al. (2011) Impact of ocean acidi-fication on benthic and water column ammonia oxidation.Geophys Res Lett 38: L21603. doi:10.1029/2011GL049095.
Klippel, B., Lochner, A., Bruce, D.C., Davenport, K.W.,Detter, C., Goodwin, L.A., et al. (2011) Complete genomesequences of Krokinobacter sp. strain 4H-3-7-5 andLacinutrix sp. strain 5H-3-7-4, polysaccharide-degradingmembers of the family Flavobacteriaceae. J Bacteriol 193:4545–4546. doi:10.1128/JB.05518-11.
Könneke, M., Bernhard, A.E., de la Torre, J.R., Walker, C.B.,Waterbury, J.B., and Stahl, D.A. (2005) Isolation of anautotrophic ammonia-oxidizing marine archaeon. Nature437: 543–546. doi:10.1038/nature03911.
Impact of ocean acidification on microbial diversity 3689
© 2014 The Authors. Environmental Microbiology published by Society for Applied Microbiology and John Wiley & Sons Ltd,Environmental Microbiology, 17, 3678–3691

Koschorreck, M. (2008) Microbial sulphate reduction at a lowpH. FEMS Microbiol Ecol 64: 329–342. doi:10.1111/j.1574-6941.2008.00482.x.
Krause, E., Wichels, A., Giménez, L., Lunau, M., Schilhabel,M.B., and Gerdts, G. (2012) Small Changes in pH HaveDirect Effects on Marine Bacterial Community Composi-tion: A Microcosm Approach. PLoS ONE 7: e47035.doi:10.1371/journal.pone.0047035.
Krulwich, T.A., Sachs, G., and Padan, E. (2011) Molecularaspects of bacterial pH sensing and homeostasis. Nat RevMicrobiol 9: 330–343.
Lehtovirta-Morley, L.E., Stoecker, K., Vilcinskas, A., Prosser,J.I., and Nicol, G.W. (2011) Cultivation of an obligateacidophilic ammonia oxidizer from a nitrifying acid soil.Proc Natl Acad Sci USA 108: 15892–15897. doi:10.1073/pnas.1107196108.
Madigan, M.T., Martinko, J.M., Parker, J., and Brock, T.D.(1997) Biology of microorganisms. Upper Saddle River, NJ,USA: Prentice Hall.
Makarenkov, V., and Legendre, P. (2002) Nonlinear redun-dancy analysis and canonical correspondence analysisbased on polynomial regression. Ecology 83: 1146–1161.
Marteinsson, V.T., Bjornsdottir, S.H., Bienvenu, N.,Kristjansson, J.K., and Birrien, J.L. (2010) Rhodothermusprofundi sp. nov., a thermophilic bacterium isolated from adeep-sea hydrothermal vent in the Pacific Ocean. Int J SystEvol Microbiol 60: 2729–2734. doi:10.1099/ijs.0.012724-0.
Martens, T., Heidorn, T., Pukall, R., Simon, M., Tindall, B.J.,and Brinkhoff, T. (2006) Reclassification of Roseobactergallaeciensis Ruiz-Ponte et al. 1998 as Phaeobactergallaeciensis gen. nov., comb. nov., description ofPhaeobacter inhibens sp. nov., reclassification of Ruegeriaalgicola (Lafay et al. 1995) Uchino et al. 1999 asMarinovum algicola gen. nov., comb. nov., and emendeddescriptions of the genera Roseobacter, Ruegeria andLeisingera. Int J Syst Evol Microbiol 56: 1293–1304.doi:10.1099/ijs.0.63724-0.
Martens-Habbena, W., Berube, P.M., Urakawa, H., de laTorre, J.R., and Stahl, D.A. (2009) Ammonia oxidationkinetics determine niche separation of nitrifying Archaeaand Bacteria. Nature 461: 976–979. doi:10.1038/nature08465.
Meron, D., Atias, E., Iasur Kruh, L., Elifantz, H., Minz, D.,Fine, M., and Banin, E. (2010) The impact of reduced pHon the microbial community of the coral Acroporaeurystoma. ISME J 5: 51–60. doi:10.1038/ismej.2010.102.
Morrow, K.M., Bourne, D.G., Humphrey, C., Botté, E.S.,Laffy, P., Zaneveld, J., et al. (2014) Natural volcanic CO2
seeps reveal future trajectories for host–microbial associa-tions in corals and sponges. ISME J: Advanced onlinepublication. doi:10.1038/ismej.2014.188.
Mouchka, M.E., Hewson, I., and Harvell, C.D. (2010) Coral-associated bacterial assemblages: current Knowledge andthe potential for climate-driven impacts. Integr Comp Biol50: 662–674. doi:10.1093/icb/icq061.
Oksanen, J., Blanchet, F.G., Kindt, R., Legendre, P., Minchin,P.R., O’Hara, R.B., et al. (2013) vegan: community ecologypackage. URL http://CRAN.R-project.org/package=vegan.
Pandolfi, J.M., Connolly, S.R., Marshall, D.J., and Cohen,A.L. (2011) Projecting coral reef futures under global
warming and ocean acidification. Science 333: 418–422.doi:10.1126/science.1204794.
Park, S.C., Choe, H.N., Baik, K.S., and Seong, C.N. (2012)Aquimarina mytili sp. nov., isolated from the gut microfloraof a mussel, Mytilus coruscus, and emended description ofAquimarina macrocephali. Int J Syst Evol Microbiol 62:1974–1979. doi:10.1099/ijs.0.032904-0.
Piontek, J., Lunau, M., Händel, N., Borchard, C., Wurst, M.,and Engel, A. (2009) Acidification increases microbialpolysaccharide degradation in the ocean. BiogeosciDiscuss 6: 11377–11400.
Piontek, J., Borchard, C., Sperling, M., Schulz, K.G.,Riebesell, U., and Engel, A. (2013) Response ofbacterioplankton activity in an Arctic fjord system toelevated pCO2: results from a mesocosm perturbationstudy. Biogeosciences 10: 297–314. doi:10.5194/bg-10-297-2013.
R Core Team (2013) R: A language and environment forstatistical computing. R Foundation for Statistical Comput-ing. Vienna: Austria. R Foundation for Statistical Comput-ing. URL: http://www.R-project.org/.
Ramette, A. (2007) Multivariate analyses in microbialecology. FEMS Microbiol Ecol 62: 142–160. doi:10.1111/j.1574-6941.2007.00375.x.
Ramette, A. (2009) Quantitative community fingerprintingmethods for estimating the abundance of operational taxo-nomic units in natural microbial communities. Appl EnvironMicrobiol 75: 2495–2505. doi:10.1128/AEM.02409-08.
Raven, J., Caldeira, K., Elderfield, H., Hoegh-Guldberg, O.,Liss, P., Riebesell, U., et al. (2005) Ocean Acidification Dueto Increasing Atmospheric Carbon Dioxide. London, UK:The Royal Society. Policy document 12/05.
Russell, B.D., Connell, S.D., Uthicke, S., Muehllehner, N.,Fabricius, K.E., and Hall-Spencer, J.M. (2013) Futureseagrass beds: can increased productivity lead toincreased carbon storage? Mar Pollut Bull 73: 463–469.doi:10.1016/j.marpolbul.2013.01.031.
Saw, J.H., Yuryev, A., Kanbe, M., Hou, S., Young, A.G.,Aizawa, S., and Alam, M. (2012) Complete genomesequencing and analysis of Saprospira grandis str. Lewin,a predatory marine bacterium. Stand Genomic Sci 6:84–93. doi:10.4056/sigs.2445005.
Schloss, P.D., Westcott, S.L., Ryabin, T., Hall, J.R.,Hartmann, M., Hollister, E.B., et al. (2009) Introducingmothur: open-source, platform-independent, community-supported software for describing and comparing microbialcommunities. Appl Environ Microbiol 75: 7537–7541.doi:10.1128/AEM.01541-09.
Simpson, E.H. (1949) Measurement of diversity. Nature 163:688.
Stahl, D.A., and de la Torre, J.R. (2012) Physiology anddiversity of ammonia-oxidizing archaea. Annu RevMicrobiol 66: 83–101. doi:10.1146/annurev-micro-092611-150128.
Stocker, T.F., Dahe, Q., and Plattner, G.-K. (2013) ClimateChange 2013: The Physical Science Basis. Working GroupI Contribution to the Fifth Assessment Report of the Inter-governmental Panel on Climate Change. Summary forPolicymakers (IPCC, 2013).
Tait, K., Laverock, B., and Widdicombe, S. (2014) Responseof an Arctic sediment nitrogen cycling community to
3690 F. F. Raulf et al.
© 2014 The Authors. Environmental Microbiology published by Society for Applied Microbiology and John Wiley & Sons Ltd,Environmental Microbiology, 17, 3678–3691
increased CO2. Estuaries Coast 37: 724–735. doi:10.1007/s12237-013-9709-x.
Tarre, S., Beliavski, M., Denekamp, N., Gieseke, A., de Beer,D., and Green, M. (2004) High nitrification rate at low pH ina fluidized bed reactor with chalk as the biofilm carrier.Water Sci Technol 49: 99–105.
Teira, E., Fernández, A., Álvarez-Salgado, X.A.,García-Martín, E.E., Serret, P., and Sobrino, C. (2012)Response of two marine bacterial isolates to high CO2
concentration. Mar Ecol Prog Ser 453: 27–36.Thompson, R.C., Norton, T.A., and Hawkins, S.J. (2004)
Physical stress and biological control regulate theproducer-consumer balance in intertidal biofilms. Ecology85: 1372–1382.
Uthicke, S., Momigliano, P., and Fabricius, K.E. (2013) Highrisk of extinction of benthic foraminifera in this century due toocean acidification. Sci Rep 3: 1–5. doi:10.1038/srep01769.
Vega Thurber, R., Willner-Hall, D., Rodriguez-Mueller, B.,Desnues, C., Edwards, R.A., Angly, F., et al. (2009)Metagenomic analysis of stressed coral holobionts.Environ Microbiol 11: 2148–2163. doi:10.1111/j.1462-2920.2009.01935.x.
Venables, W.N., and Ripley, B.D. (2002) Modern AppliedStatistics with S, 4th edn. New York, NY, USA: Springer.ISBN 0-387-95457-0.
Walker, C.B., de la Torre, J.R., Klotz, M.G., Urakawa, H.,Pinel, N., Arp, D.J., et al. (2010) Nitrosopumilus maritimusgenome reveals unique mechanisms for nitrification andautotrophy in globally distributed marine crenarchaea. ProcNatl Acad Sci USA 107: 8818–8823. doi:10.1073/pnas.0913533107.
Webster, N.S., Smith, L.D., Heyward, A.J., Watts, J.E., Webb,R.I., Blackall, L.L., and Negri, A.P. (2004) Metamorphosisof a Scleractinian coral in response to microbial biofilms.Appl Environ Microbiol 70: 1213–1221. doi:10.1128/AEM.70.2.1213-1221.2004.
Witt, V., Wild, C., Anthony, K.R., Diaz-Pulido, G., and Uthicke,S. (2011) Effects of ocean acidification on microbial com-munity composition of, and oxygen fluxes through, biofilmsfrom the Great Barrier Reef. Environ Microbiol 13: 2976–2989. doi:10.1111/j.1462-2920.2011.02571.x.
Yoon, J.H., Kang, S.J., Lee, S.Y., and Oh, T.K. (2007)Phaeobacter daeponensis sp. nov., isolated from a tidal flatof the Yellow Sea in Korea. Int J Syst Evol Microbiol 57:856–861. doi:10.1099/ijs.0.64779-0.
Zak, D.R., Grigal, D.F., and Ohmann, L.F. (1993) Kinetics ofmicrobial respiration and nitrogen mineralization in GreatLakes forests. Soil Sci Soc Am J 57: 1100–1106.
Supporting information
Additional Supporting Information may be found in the onlineversion of this article at the publisher’s web-site:
Fig. S1. Map of sampling area (map from Google 2014), withthe seeping sites Upa-Upasina (A), Esa’Ala (B) and Dobu(C). The coordinates for each sample can be found inTable S1.Fig. S2. Numbers of bacterial ARISA OTU per seawater pHcategory, i.e. control (pH 8.3–8.1), medium (pH 8.1–7.7) andhigh (pH 7.7–6.9) pCO2 sites.Fig. S3. Non-metric multidimensional scaling ordination ofBray–Curtis dissimilarity matrices based on bacterial commu-nity data (MPTS OTU3%) from samples of 2010 and 2011(dotted line). The size of the symbol dots is a (non-linear)representation of differences in pCO2 exposure at the respec-tive sites. Coloured shapes highlight the three CO2 impactgroups ‘control’ (grey), ‘medium pCO2’ (blue) and ‘high pCO2’(red).Fig. S4. Dominant bacterial phyla (A) and classes (B) at thestudied sites. The taxonomic assignments are based onMPTS sequences using the SILVA 16S rRNA reference data-base. At the top the site names with the respective seawaterpH are indicated.Fig. S5. Dominant archaeal phyla (A) and classes (B) at thestudied sites. The taxonomic assignment is based on MPTSsequences using the SILVA 16S rRNA reference database. Atthe top the site names with the respective seawater pH areindicated.Table S1. Overview of all 24 samples with time ofsampling, sampling location, sampling depth, type ofmolecular analysis and measurements of environmentalparameters.Table S2. Summary of bacterial and archaeal sample diver-sity, based on ARISA and MPTS and abundance of rarebacterial and archaeal MPTS OTUs.Table S3. Number of bacterial and archaeal OTUs and taxa,characterized by MPTS sequences which either uniquelyoccur at samples from the categories ‘high’, ‘medium’ and‘control pCO2’ or show linear or quadratic relationshipswith pH.Table S4. Bacterial taxa and MPTS OTUs, which were foundto significantly increase in terms of relative sequence abun-dances with increasing seawater pCO2.Table S5. Archaeal taxa and MPTS OTUs, which were foundto significantly increase in terms of relative sequence abun-dances with increasing seawater pCO2.Table S6. Bacterial taxa and MPTS OTUs, which were foundto have a significant quadratic relationship with increasingpCO2.Table S7. Archaeal taxa and MPTS OTUs, which were foundto have a significant quadratic relationship with increasingpCO2.Text S1. Taxa with no obvious ecological functions, Quad-ratic relationships of microbial MPTS sequence occurrencewith pH.
Impact of ocean acidification on microbial diversity 3691
© 2014 The Authors. Environmental Microbiology published by Society for Applied Microbiology and John Wiley & Sons Ltd,Environmental Microbiology, 17, 3678–3691


![[Elearnica] -Diversity and Distribution of Bacterial Community in the Coastal Sediments](https://static.fdocuments.us/doc/165x107/577c828e1a28abe054b14420/elearnica-diversity-and-distribution-of-bacterial-community-in-the-coastal.jpg)