Changes in fin whale (Balaenoptera physalus) song over a forty
33
Changes in fin whale (Balaenoptera physalus) song over a forty-four year period in New England waters Amanda M. Koltz Honors Thesis in Biological Sciences Advisor: Dr. Christopher Clark Honors Group Advisor: Dr. Christiane Linster 11 May 2007
Transcript of Changes in fin whale (Balaenoptera physalus) song over a forty
Changes in fin whale (Balaenoptera physalus) song over a forty-four
year period in New England waters Amanda M. Koltz Honors Thesis in Biological Sciences Advisor: Dr. Christopher Clark Honors Group Advisor: Dr. Christiane Linster11 May 2007
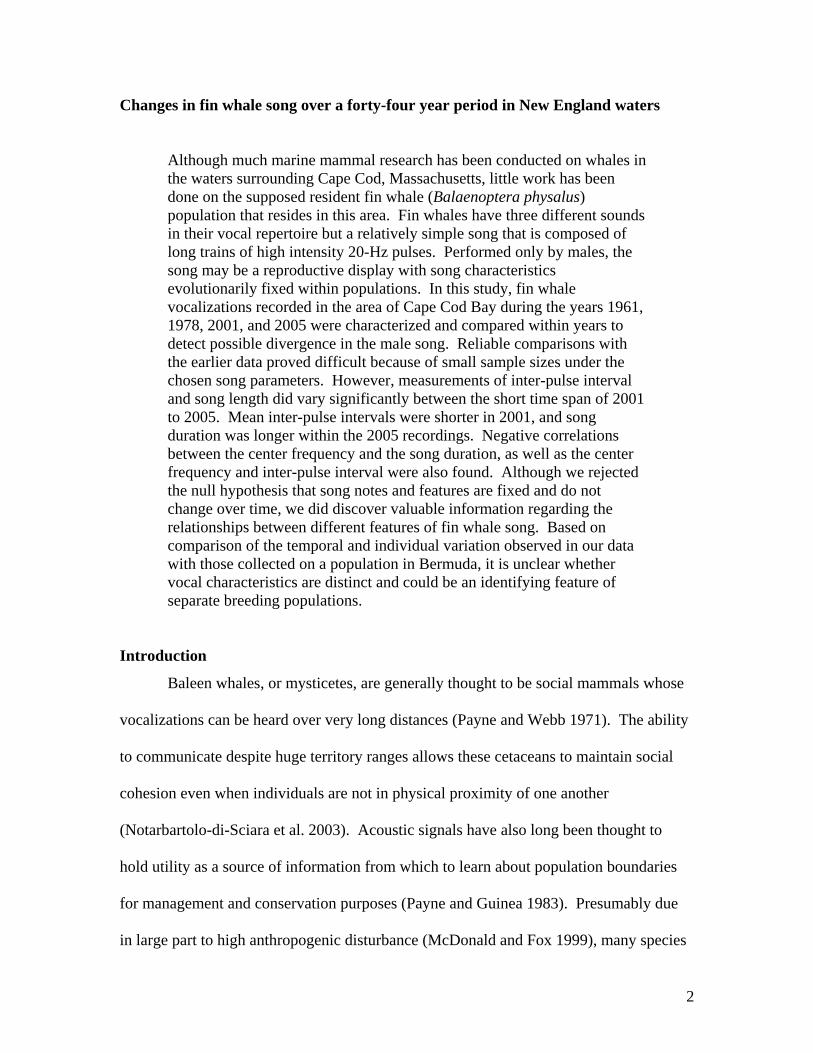
Changes in fin whale song over a forty-four year period in New England waters
Although much marine mammal research has been conducted on whales in the waters surrounding Cape Cod, Massachusetts, little work has been done on the supposed resident fin whale (Balaenoptera physalus) population that resides in this area. Fin whales have three different sounds in their vocal repertoire but a relatively simple song that is composed of long trains of high intensity 20-Hz pulses. Performed only by males, the song may be a reproductive display with song characteristics evolutionarily fixed within populations. In this study, fin whale vocalizations recorded in the area of Cape Cod Bay during the years 1961, 1978, 2001, and 2005 were characterized and compared within years to detect possible divergence in the male song. Reliable comparisons with the earlier data proved difficult because of small sample sizes under the chosen song parameters. However, measurements of inter-pulse interval and song length did vary significantly between the short time span of 2001 to 2005. Mean inter-pulse intervals were shorter in 2001, and song duration was longer within the 2005 recordings. Negative correlations between the center frequency and the song duration, as well as the center frequency and inter-pulse interval were also found. Although we rejected the null hypothesis that song notes and features are fixed and do not change over time, we did discover valuable information regarding the relationships between different features of fin whale song. Based on comparison of the temporal and individual variation observed in our data with those collected on a population in Bermuda, it is unclear whether vocal characteristics are distinct and could be an identifying feature of separate breeding populations.
Introduction
Baleen whales, or mysticetes, are generally thought to be social mammals whose
vocalizations can be heard over very long distances (Payne and Webb 1971). The ability
to communicate despite huge territory ranges allows these cetaceans to maintain social
cohesion even when individuals are not in physical proximity of one another
(Notarbartolo-di-Sciara et al. 2003). Acoustic signals have also long been thought to
hold utility as a source of information from which to learn about population boundaries
for management and conservation purposes (Payne and Guinea 1983). Presumably due
in large part to high anthropogenic disturbance (McDonald and Fox 1999), many species
2
of large cetaceans have been deemed endangered or vulnerable and face a very high risk
of extinction in the wild (IUCN 2006). To accurately assess the status of large cetaceans
and work towards their preservation, it has become increasingly important to have
reliable methods of estimating the size, density, and distribution of various populations
(Hayes et al. 2000).
Traditional methods of population estimates have relied almost exclusively upon
visual surveys, which are expensive, labor intensive and not always accurate due to
temporal and spatial sampling constraints (Moore et al. 1999). Visual survey counts of
sighted animals in a particular area of open ocean may also not be indicative of the
overall population. In addition, the presence of vessels and the noise associated with
them have been shown to disturb natural cetacean behavior (Watkins 1986). Underwater
passive acoustics offers an alternative method of gathering data on cetaceans that can be
combined with other sources of information to provide a better overall understanding of
the animals and the viability of their populations (Moore et al. 1998). Of particular
interest here are the baleen whales who reside mostly in pelagic environments and have
proven difficult to assess through traditional means, such as the fin whale (Balaenoptera
physalus) and blue whale (Balaenoptera musculus) (McDonald and Fox 1999). The use
of long range passive acoustics has the potential to reveal valuable information regarding
their natural ecology, behavior, and population dynamics (Moore et al. 1998).
As little as twenty-five years ago, fin whales were thought to be nearly impossible
to study because of the animals’ strongly negative reactions to approaching vessels
(Watkins 1986). Since then, fin whales have apparently become more accustomed to
anthropogenic presence. They are now more likely to “ignore” vessels that are thirty or
3
more meters away, although vocalizations still cease when the animals are disturbed
(Watkins 1986). Although this behavioral change has allowed scientists to gain a better
perspective through direct observation on the ecology of fin whales, anthropogenic
disturbance still seems to interrupt normal fin behavior (Watkins 1986). However, of all
cetaceans, fin whales and blue whales are known to produce the lowest frequency
vocalizations at the highest source levels (Payne and Webb 1971, Charif et al. 2002),
which provides ample opportunity to study these species through long-range passive
acoustics without disturbing their natural behavior.
Next to most other baleen species, fin whales make relatively simple sounds
(Thompson et al. 1992). Their song note repertoire is composed of three different note
types which are arranged in long patterned sequences, referred to as “songs” (Clark et al.
2002, Hatch 2004). Note types include 20-Hz pulses, “backbeats,” and “upsweeps”
(Hatch 2004). Backbeats, which are produced at 15-18 Hz and the rarely seen upsweeps
that occur between 134-142 Hz have lower source levels than the 20-Hz pulses and are
also less well documented (Clark et al. 2002, unpublished data).
Most typically, fin whales produce series of high-intensity notes within the 18 –
25 frequency band (Watkins et al. 1987, Notarbartolo-di-Sciara et al. 2003). Referred to
as “20-Hz pulses,” these note sequences are composed of downsweeps that have constant
inter-pulse intervals and an almost mechanical regularity (Watkins 1981, Watkins et al.
1987). Sequences of 20-Hz pulses usually occur in long bouts or “trains” and can
continue for more than 32 hours (Watkins et al. 1987) at source levels of 159 to 185 dB
(Charif et al. 2002, Notarbartolo-di-Sciara et al. 2003). Characteristics of 20-Hz
sequences can differ in the inter-note interval, number of notes per song, number of songs
4
within a bout, the song duration, number of note types per song, and note clustering
patterns.
The functional significance of fin call variability is unknown (Clark et al. 2002).
However, the many advantages to producing calls at 20 Hz make fin whale songs
extremely well suited to long-distance communication in deep ocean environments
(Payne and Webb 1971). Advantages to vocalizing in the narrow frequency band around
20 Hz include the fact that such calls lie below storm-generated noise, lose little to no
energy from reflection off the seafloor or sea surface, have low attenuation with distance,
and are within the most optimal octave band for long-range sound propagation in polar
ocean conditions (Payne and Webb 1971).
The prevalence of 20-Hz pulses over temperate latitude ranges is highest during
the winter and early spring months and lowest in the late spring through the early summer
(Thompson and Friedl 1982, Watkins et al. 1987, Moore et al. 1998). Watkins et al.
(1987) proposed that the 20-Hz sounds were male reproductive displays through a
synthesis of acoustic records from Bermuda, and because it was deduced that the
breeding season was coincided with these peaks in stereotypic vocal behavior. This
hypothesis of male vocal breeding displays was supported by Croll et al. (2002), who
determined through the specific correlation of singing behavior and molecular data that
only male fin whales sing. Confusion exists as to the full function of these patterned 20-
Hz vocalizations by male fins, however, since fin whales have been noted singing during
the feeding season in high latitudes in late summer (Clark 1995), as well as in late winter
(Clark et al. 1999). It has been suggested that while long song bouts may serve as
reproductive displays (Moore et al. 1998), shorter irregular pulse sequences of less than
5
five minutes could simply be associated with feeding, socializing, or transiting animals
(Watkins 1981, McDonald et al. 1995). However, both long and short sequences are
produced by fin whales during feeding times in the late summer months and in high
latitudes (Clark et al. 2002, Clark unpubl. data).
Overviews by Payne and Webb (1971) and Tyack (2000) suggested that the
whales disperse widely during their mating season, with movements possibly also
dictated by prey availability (Croll et al. 2002). Through their observations in the field,
Watkins and Schevill (1979) noted that groups of fin whales from distances of ten
kilometers away or more will travel to the same feeding area as other groups of whales.
They speculated that fin whales vocalizing while feeding may alert other whales within
proximity to locations of high prey concentration (Watkins and Schevill 1979). Since fin
whales do not appear to have specific breeding grounds, Croll et al. (2002) proposed that
vocal displays by males at feeding grounds may serve to attract females to prey
aggregations from long distances.
Some populations of fin whales are thought to be residents of certain areas, such
as in the Mediterranean Sea (Notarbartolo-di-Sciara et al. 2003) or the New England
region. As shown by Seipt et al. (1990) and Clapham and Seipt (1991) with populations
in the North Atlantic and Massachusetts Bay area, residency could be in part due to
matrilineally determined site fidelity to specific feeding areas. Most of the work that has
been done to define the population boundaries of fin whales has focused on both the
distribution and the relatedness of individuals within their summer feeding aggregations
(Agler et al. 1991, Bérubé et al. 1998). Thompson et al. (1992) suggested that specific
acoustic features of vocalizations, specifically those from male reproductive displays,
6
could serve as a tool to indicate population identity in fin whales. The fact that fin whale
song shows less inter-annual, inter-individual, and intra-individual variability than the
song of other baleen species (Clark and Ellison 2003) has provided further optimism for
learning about fin whale populations from acoustic data. This idea was further supported
through work by Hatch (2004), who found that the measurement of time between notes
during fin song is a highly significant predictor of the region from which the song was
recorded, even if the males vocalizing are not necessarily closely related. If songs sung
by males are a reproductive display, it would provide evidence that song characteristics
may be relatively fixed on an evolutionary scale within populations (Croll et al. 2002).
Such findings could have important implications for conservation purposes, as the song
characteristics of individual whales could then be used to attribute them to particular
populations even over large time scales.
As members of the Western North Atlantic population, fin whales from Cape Cod
Bay, Massachusetts are believed to be resident to the New England region. In this study,
I compared several song characteristics between different bouts of 20-Hz vocalizations
by fin whales in Cape Cod Bay during the years 1961, 1978, 2001, and 2005.
Measurements of the 20-Hz notes and songs included note center frequency, time
between successive pulses, and song duration. Both inter-year comparisons and intra-
year correlation tests were conducted to investigate whether acoustic song features were
constant over this relatively short time period. My hypothesis regarding these fin whale
song characteristics was that there would be no significant differences between the
historical and more recent song data, which would suggest that song characteristics are
uniform within distinct populations of fin whales. This prediction stemmed from the
7
basis that qualities utilized in reproductive displays within a population should be fixed
on an evolutionary scale. In addition, there should be little selection pressure on fins to
change their song, since it is already very well suited to long-distance propagation in
deep ocean environments (Payne and Webb 1971). Any significant changes in the fin
whales song might suggest that song characteristics are not fixed but potentially
influenced by individuals from other populations or environmental conditions, including
anthropogenic noise. The characterization of fin whale song within this presumed
resident population over a period of forty-four years has the potential to reveal valuable
information about the male song, the factors that influence it, and the next steps in
effective acoustic monitoring of fin whale populations.
Methods Acoustic data collection
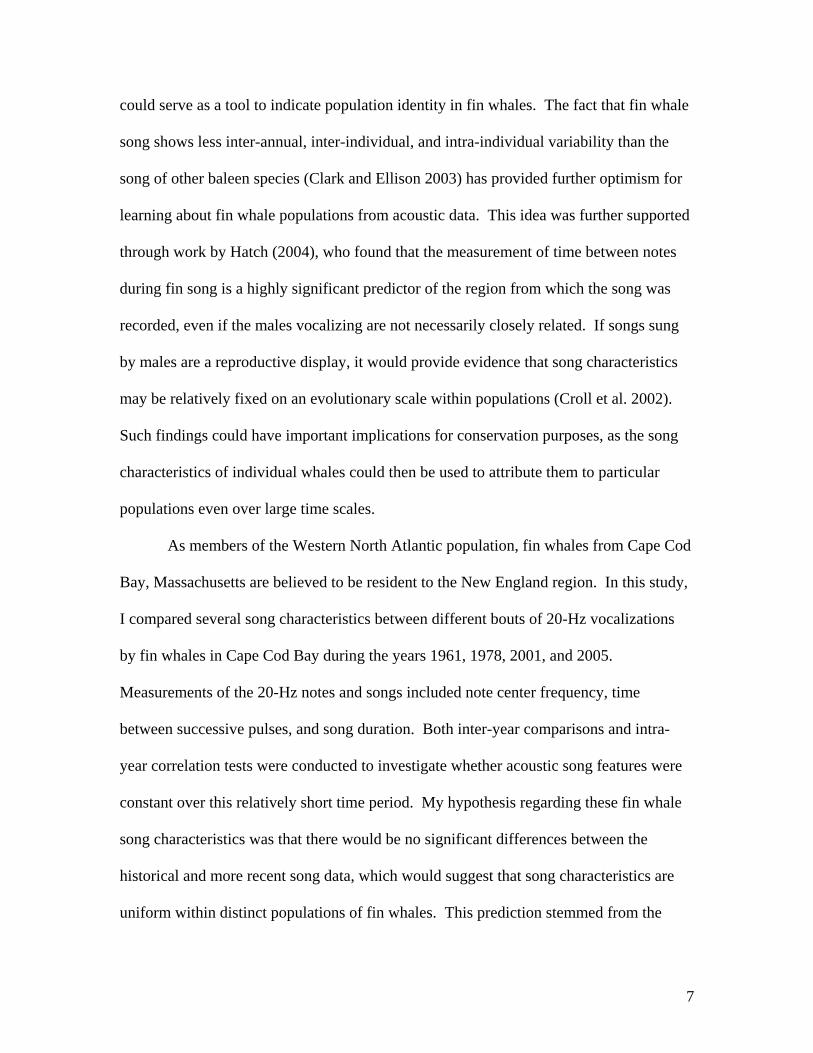
Data from eight days in mid-March 2001 and five days in early April 2005 were
chosen for acoustic analysis, as well as two recordings from the winter months of 1961
and one short recording from 1978. The fin whale acoustic data from 2001 and 2005
were recorded in the area of Cape Cod Bay, Massachusetts (Figure 1) by scientists
associated with the Cornell Bioacoustics Program. Originally for use in the monitoring
of area right whales, data were collected using several autonomous sea floor recording
devices, referred to as “pop-ups” (Clark et al. 2002, Clark and Clapham 2004. Arrays of
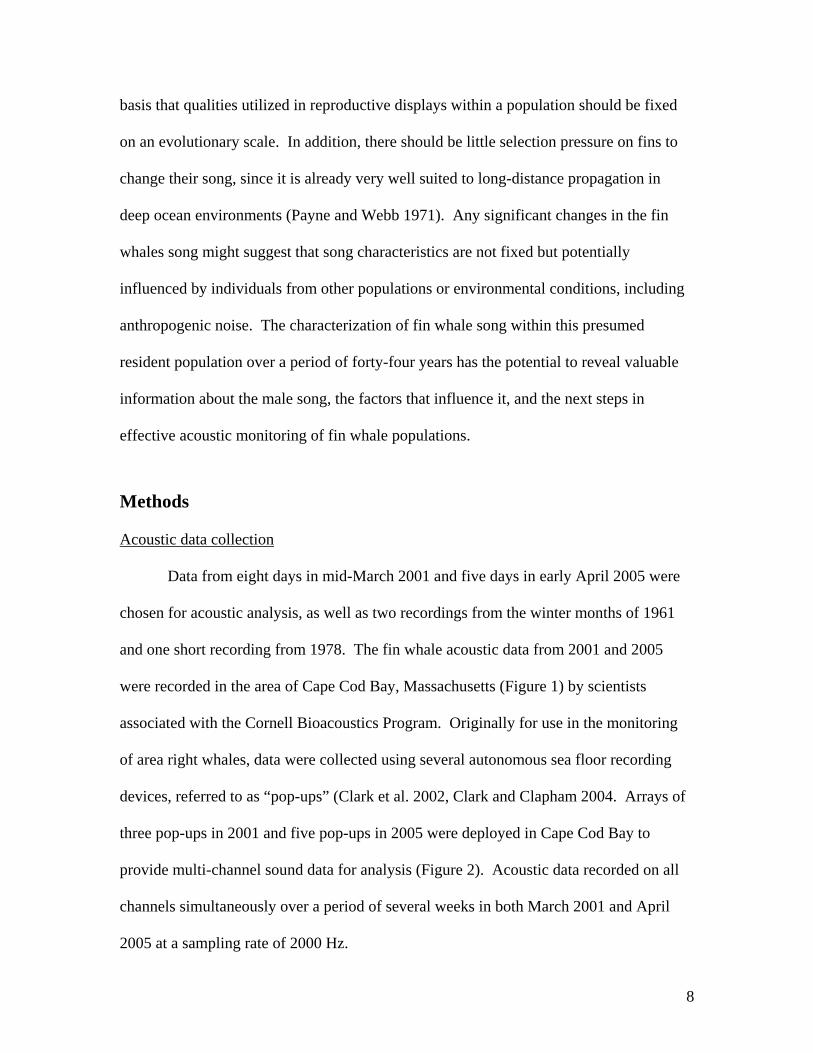
three pop-ups in 2001 and five pop-ups in 2005 were deployed in Cape Cod Bay to
provide multi-channel sound data for analysis (Figure 2). Acoustic data recorded on all
channels simultaneously over a period of several weeks in both March 2001 and April
2005 at a sampling rate of 2000 Hz.
8
The small amount of fin whale acoustic data from 1961 and 1978 were generously
provided by W.E. Watkins from the Woods Hole Oceanographic Institution (WHOI).
These data were recorded in the Nantucket Shoals region by Drs. Schevill and Watkins
during the early winter months of 1961 and 1978, although the exact dates of collection
are unknown. Recordings totaled 340 hours of sound in which fin whale vocalizations
were either known or expected to be present (Table 1). All sound samples are archived
within the Cornell Laboratory of Ornithology’s Bioacoustics Research Program
(http://www.birds.cornell.edu/brp/). For this inter-year study, it would have been
preferable to compare acoustic data from several years and one location during the exact
same time of year. However, this was not possible, as there were no recordings available
from early spring in 1961 or 1978. Recordings in 2001 were only made during the month
of March, and in 2005, a complete array of pop-ups was not arranged until the first days
of April.
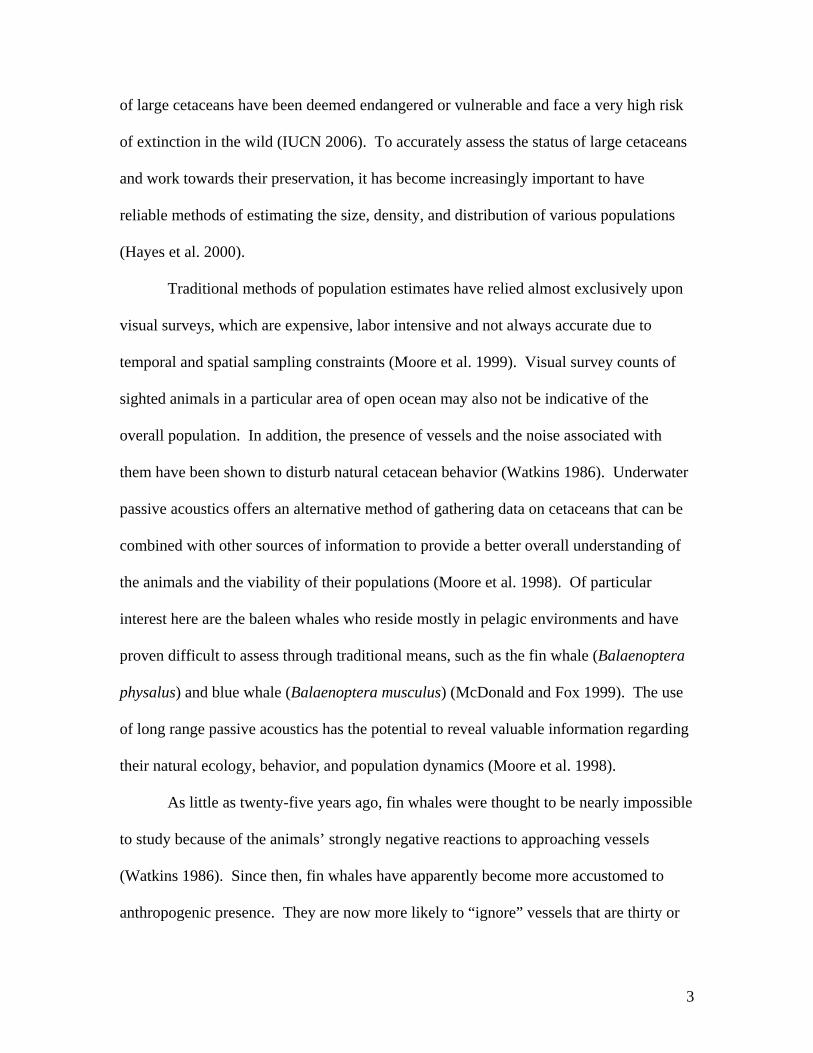
Figure 1. Map of Cape Cod Bay and Nantucket Shoals region, location from which acoustic data were recorded in years 1961, 1978, 2001, and 2005.
9
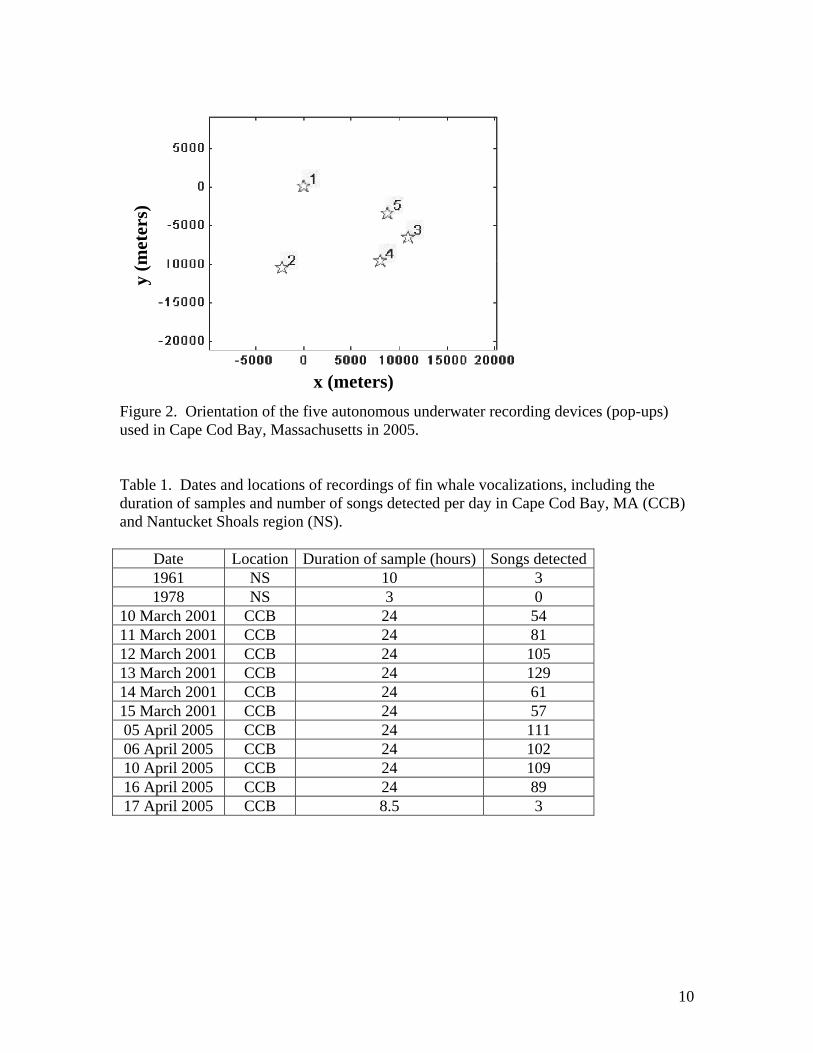
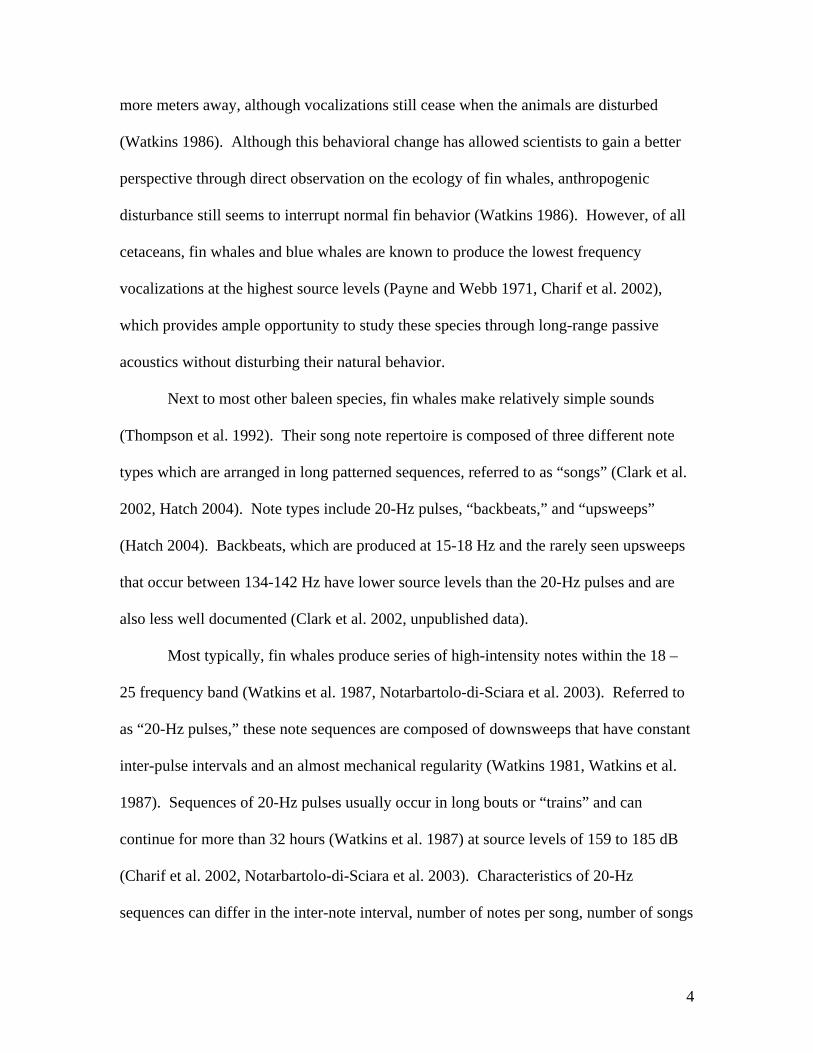
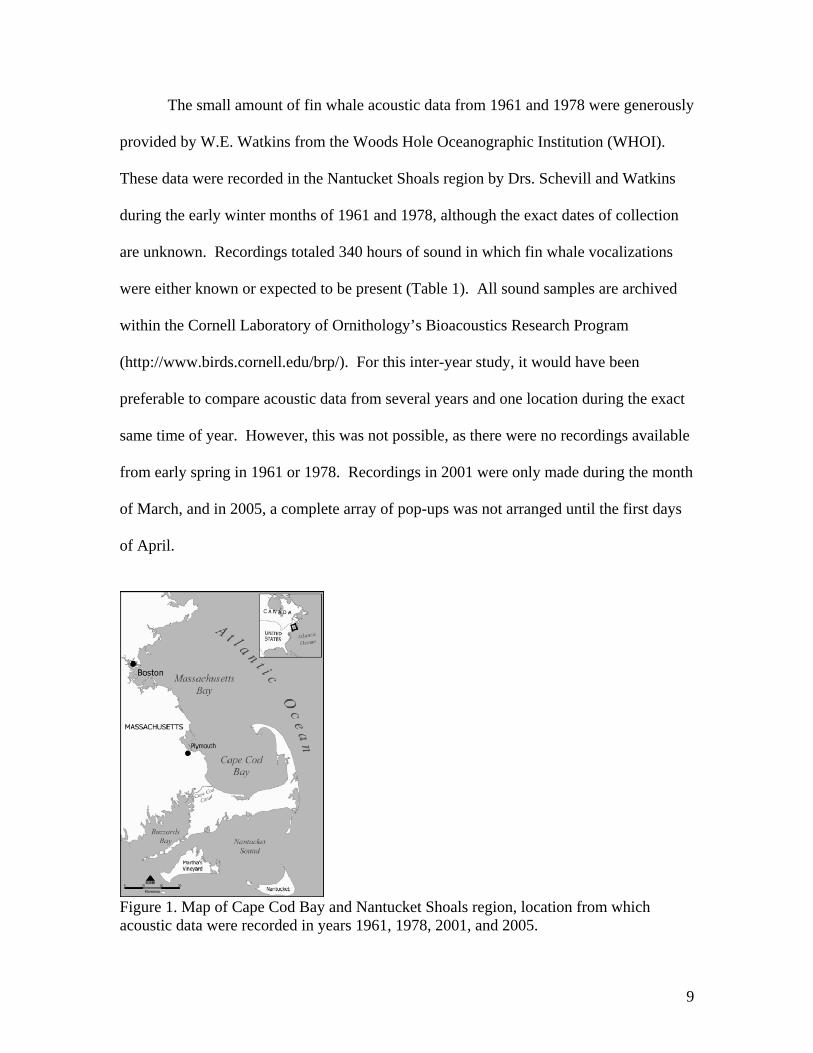
Figure 2. Orientation of the five autonomous underwater recording devices (pop-ups) used in Cape Cod Bay, Massachusetts in 2005. Table 1. Dates and locations of recordings of fin whale vocalizations, including the duration of samples and number of songs detected per day in Cape Cod Bay, MA (CCB) and Nantucket Shoals region (NS).
Date Location Duration of sample (hours) Songs detected 1961 NS 10 3 1978 NS 3 0
10 March 2001 CCB 24 54 11 March 2001 CCB 24 81 12 March 2001 CCB 24 105 13 March 2001 CCB 24 129 14 March 2001 CCB 24 61 15 March 2001 CCB 24 57 05 April 2005 CCB 24 111 06 April 2005 CCB 24 102 10 April 2005 CCB 24 109 16 April 2005 CCB 24 89 17 April 2005 CCB 8.5 3
x (meters)
y (m
eter
s)
10
Fin whale data collection
Acoustic data were visualized using the Cornell-developed sound display and
measurement program XBAT (www.xbat.org), written by Harold Figueroa and
augmented by measurement sub-routines by Kathy Cortopassi of the bio-engineering
staff at the Cornell Bioacoustics Research Program and run within MATLAB (The
Mathworks, Inc., 1999). To maintain standard spectrogram frequency and time
resolution for the data display among the different recordings, a Fast Fourier Transform
(FFT) of 4096 and an overlap (hop length) of 0.5 seconds were kept constant when
browsing data. Sound recordings were browsed manually for the years 1961, 1978, and
2005 to locate fin whale vocalizations and make general observations. All notes within
the 20-Hz frequency range that were determined to be fin whale vocalizations were
manually marked and labeled (i.e., annotated). Automatic detection, a special feature
within XBAT (www.xbat.org), was used to locate and mark the 20-Hz pulses in the 2001
data. Automatic detection parameters were determined through the application of a 20-
Hz pulse as the detection “template.” Sounds similar enough in shape and frequency
range to the template were automatically marked as fin whale vocalizations. Data from
2001 were then browsed manually to make any necessary corrections to the automatic
detections.
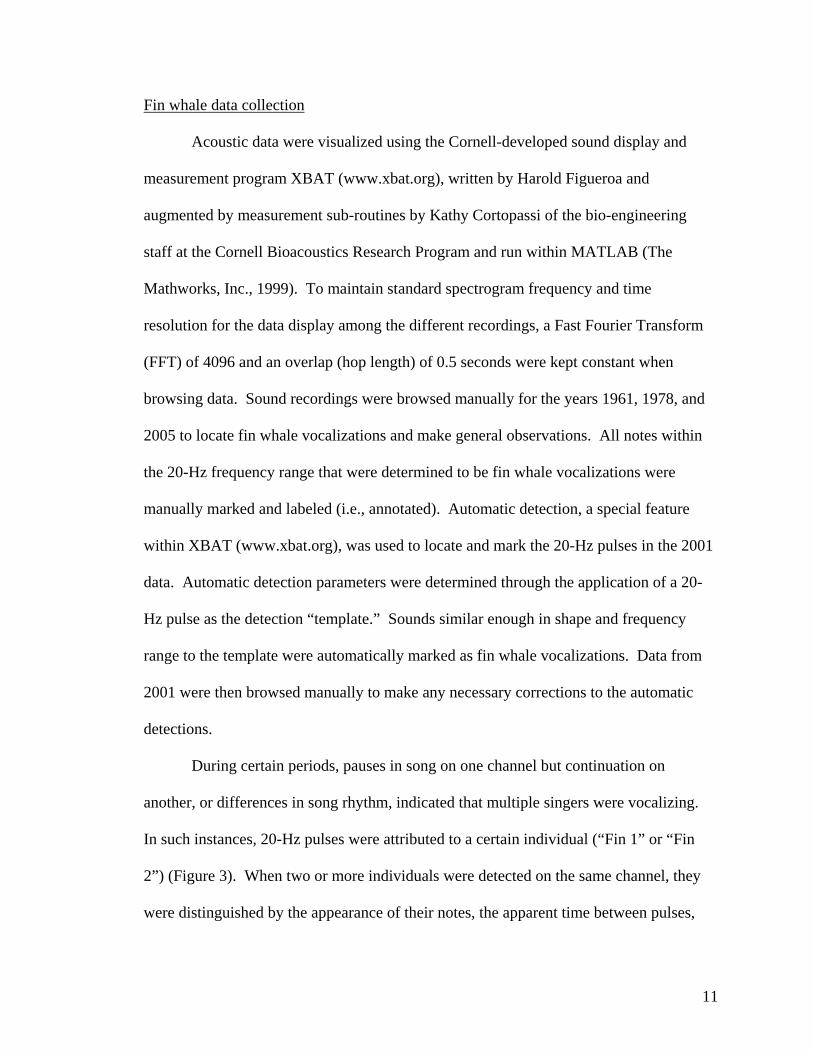
During certain periods, pauses in song on one channel but continuation on
another, or differences in song rhythm, indicated that multiple singers were vocalizing.
In such instances, 20-Hz pulses were attributed to a certain individual (“Fin 1” or “Fin
2”) (Figure 3). When two or more individuals were detected on the same channel, they
were distinguished by the appearance of their notes, the apparent time between pulses,
11
the beginning and end frequency patterns, and through listening and comparing the
acoustic qualities of the vocalizations. Periods of time during which individuals could
not be objectively differentiated from one another were omitted from all analysis, as were
periods of very low signal to noise ratios. While the presence of backbeats and 40-Hz
downsweeps were noted occasionally, in this study, analysis was limited strictly to the
more typical 20-Hz pulses. A total of 13,695 notes in the 20-Hz frequency range were
either manually or automatically detected, marked, and attributed to individual animals
from the recordings over all four years (Table 1). Unfortunately, because acoustic data
were originally collected for use in right whale study, documentation of fin whale
sightings in the area are limited for April 2005 and are not available for years 1961, 1978,
and 2001. Without more accurate visual data or identification data on individual animals,
it is difficult to make an estimation of the number of vocalizing fin whales that were in
the area or the number of times the same individual was recorded.
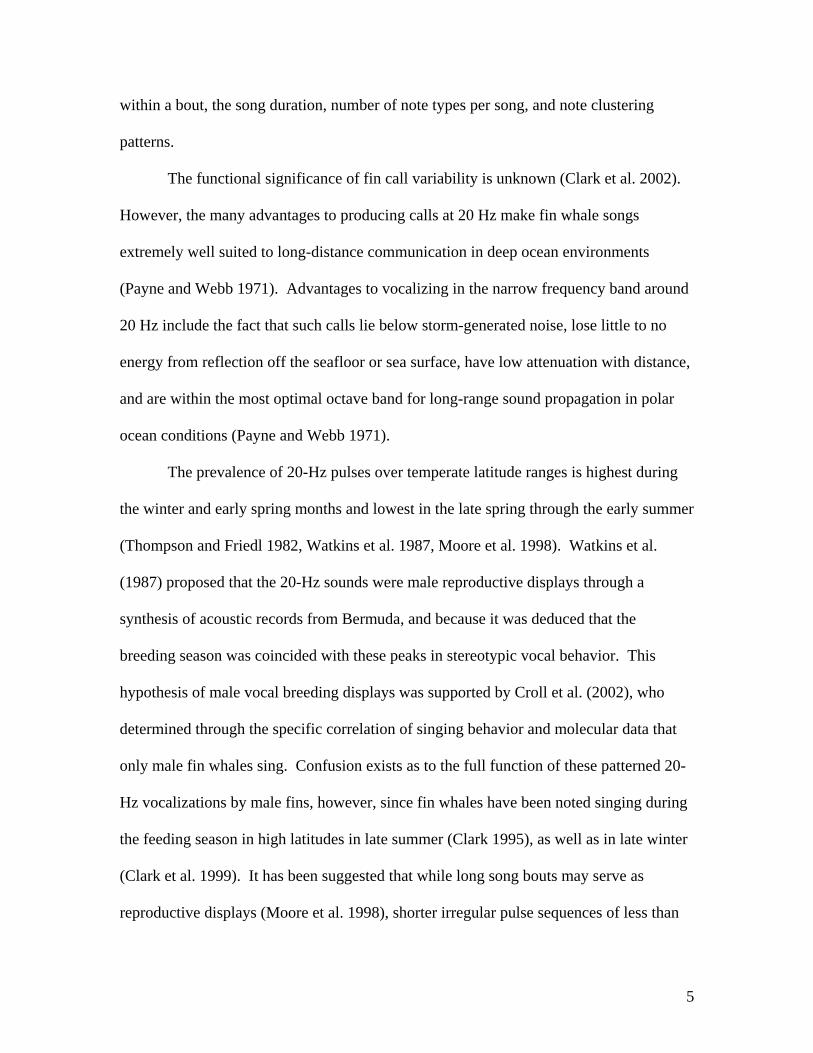
Figure 3. Spectrogram of two different fin whale singers on channels one and three at 20-Hz. X-axis is time, y-axis is frequency in kHz. Boxes are drawn around selected notes on each channel to emphasize the presence of two singers.
12
Fin whale data analysis
Three measures were used to compare fin whale song between and within years,
including center frequency (Hz), inter-pulse interval (seconds), and the number of notes
per song, as an indication of song duration. Center frequency was chosen as a
comparative measurement, since it is presumably an adaptation for long-range
communication by fin whales and should not change much over time. Inter-pulse
interval, or the time between successive notes in a song, is one of the more variable and
traditionally measured features in fin whale vocalizations. Song duration was chosen
because of its potential to undergo yearly changes and because it may be an indication of
a singer’s endurance and mate quality. Other possible measurements, such as note
duration or total energy, were not included in analysis, since the length and strength of
the vocalizations can vary depending on the singer’s distance from the recorder.
Similarly, upper, lower, and peak note frequencies were not compared, as acoustic signals
deteriorate with distance.
Each note’s center frequency (Hz) and center time (seconds) were measured
within XBAT (www.xbat.org), using ninety-five percent of the note’s total energy.
Measurements were exported from XBAT (www.xbat.org,
http://www.birds.cornell.edu/brp/research/algorithm/energy-distribution-measurement)
and MATLAB (The Mathworks, Inc., 1999) as tables into EXCEL (Microsoft Office,
Inc. 1998). Here the inter-pulse interval was calculated for each note by subtracting the
center time of the note preceding it from its own center time. In order to compare songs
between the four years, data were organized by separating the sequences of 20-Hz pulses
into distinct songs through a program written and run through MATLAB (The
13
Mathworks, Inc., 1999) by Carlos Botero (Dept. Neurobiology and Behavior, Cornell
University). A song was defined as a sequence of no less than 3 pulses, each with an
inter-pulse interval of no more than 15 seconds. For each song, the number of notes
contained within the song was determined, and the measurements from each of these
notes were averaged.
A total of 904 songs were differentiated from one another, and mean
measurements corresponding to each song were organized and stored as a text file to be
analyzed in MINITAB version 14.20 for Windows. While 487 and 414 songs were
identified within the recordings from 2001 and 2005, respectively, no songs were
identified for the 1978 sample, and only three songs were found in the two samples from
1961 using the aforementioned parameters (Table 1).
The matrix of the 904 songs and each of their mean measurements was used to
perform inter-year comparisons and intra-year correlation tests within MINITAB (version
14.20 for Windows). Pair-wise comparisons for center frequency, inter-pulse interval,
and song duration were done between each of the years that contained songs (1961, 2001,
2005) using a one-way analysis of variance with Tukey 95% simultaneous confidence
intervals. Pearson correlation tests were then conducted to identify any relationships
between the chosen song characteristics within each of the years 1961, 2001, and 2005.
14
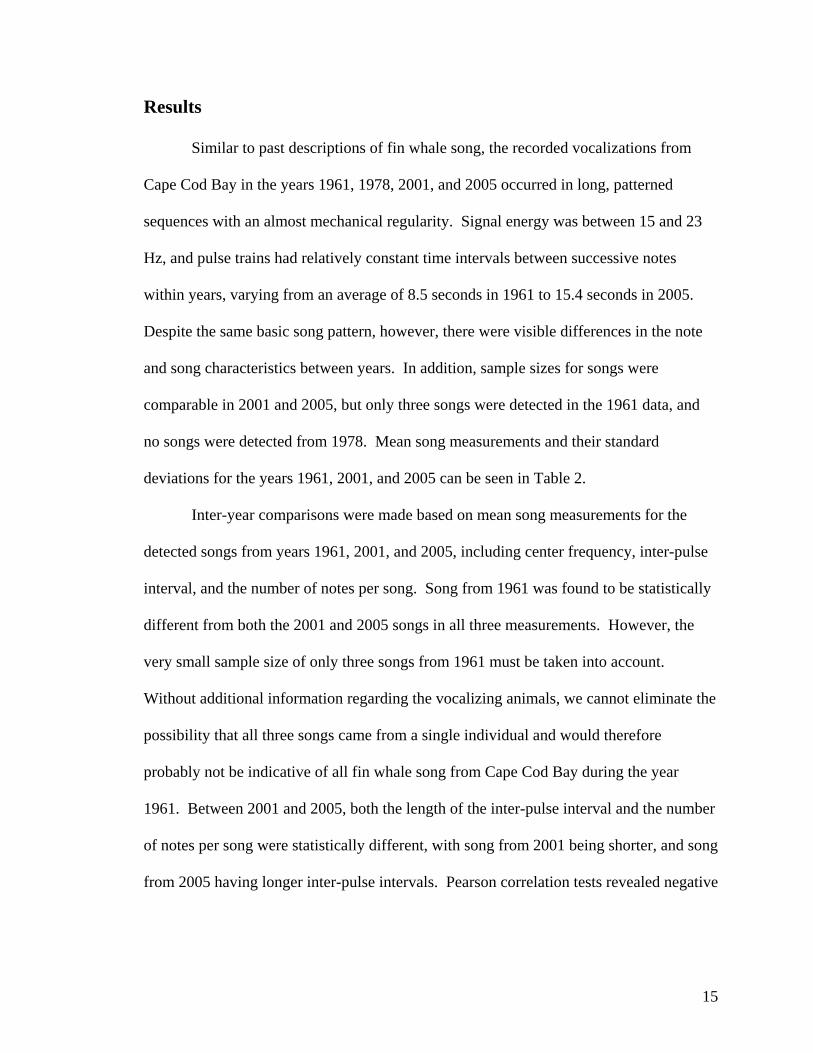
Results
Similar to past descriptions of fin whale song, the recorded vocalizations from
Cape Cod Bay in the years 1961, 1978, 2001, and 2005 occurred in long, patterned
sequences with an almost mechanical regularity. Signal energy was between 15 and 23
Hz, and pulse trains had relatively constant time intervals between successive notes
within years, varying from an average of 8.5 seconds in 1961 to 15.4 seconds in 2005.
Despite the same basic song pattern, however, there were visible differences in the note
and song characteristics between years. In addition, sample sizes for songs were
comparable in 2001 and 2005, but only three songs were detected in the 1961 data, and
no songs were detected from 1978. Mean song measurements and their standard
deviations for the years 1961, 2001, and 2005 can be seen in Table 2.
Inter-year comparisons were made based on mean song measurements for the
detected songs from years 1961, 2001, and 2005, including center frequency, inter-pulse
interval, and the number of notes per song. Song from 1961 was found to be statistically
different from both the 2001 and 2005 songs in all three measurements. However, the
very small sample size of only three songs from 1961 must be taken into account.
Without additional information regarding the vocalizing animals, we cannot eliminate the
possibility that all three songs came from a single individual and would therefore
probably not be indicative of all fin whale song from Cape Cod Bay during the year
1961. Between 2001 and 2005, both the length of the inter-pulse interval and the number
of notes per song were statistically different, with song from 2001 being shorter, and song
from 2005 having longer inter-pulse intervals. Pearson correlation tests revealed negative
15
relationships between the center frequency and song length, as well as between center
frequency and inter-pulse interval in the years 2001 and 2005.
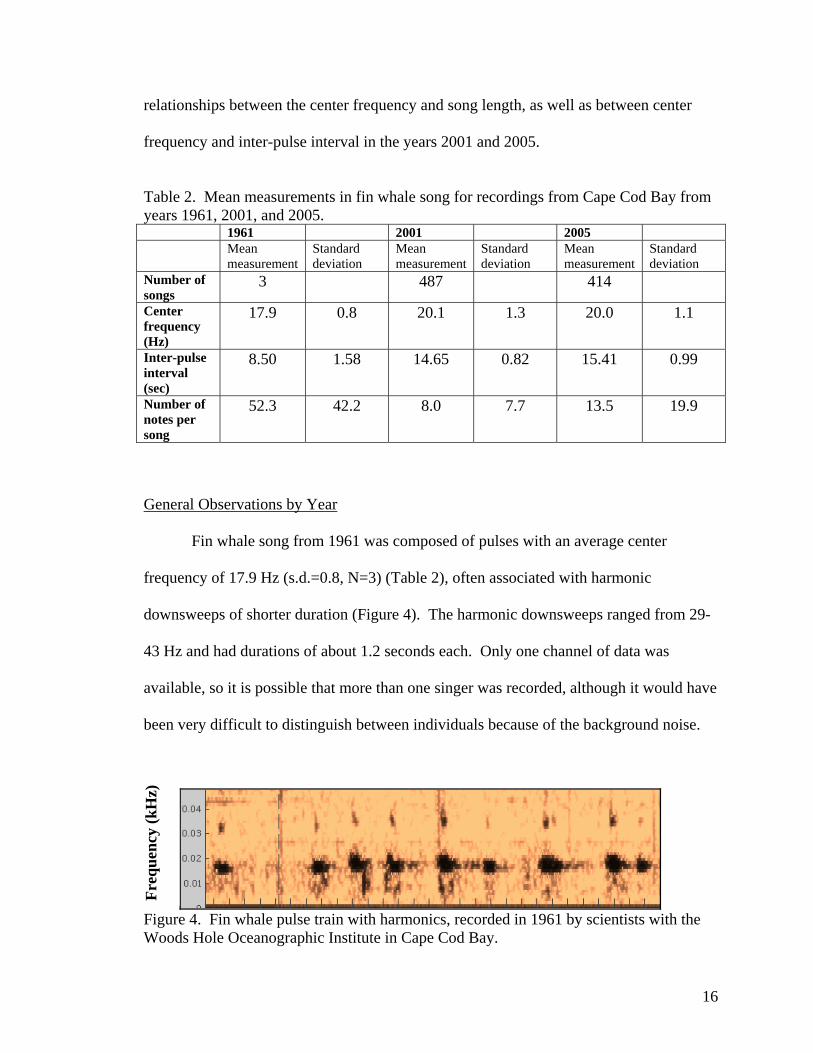
Table 2. Mean measurements in fin whale song for recordings from Cape Cod Bay from years 1961, 2001, and 2005. 1961 2001 2005 Mean
measurement Standard deviation
Mean measurement
Standard deviation
Mean measurement
Standard deviation
Number of songs
3 487 414
Center frequency (Hz)
17.9 0.8 20.1 1.3 20.0 1.1
Inter-pulse interval (sec)
8.50 1.58 14.65 0.82 15.41 0.99
Number of notes per song
52.3 42.2 8.0 7.7 13.5 19.9
General Observations by Year
Fin whale song from 1961 was composed of pulses with an average center
frequency of 17.9 Hz (s.d.=0.8, N=3) (Table 2), often associated with harmonic
downsweeps of shorter duration (Figure 4). The harmonic downsweeps ranged from 29-
43 Hz and had durations of about 1.2 seconds each. Only one channel of data was
available, so it is possible that more than one singer was recorded, although it would have
been very difficult to distinguish between individuals because of the background noise.
Freq
uenc
y (k
Hz)
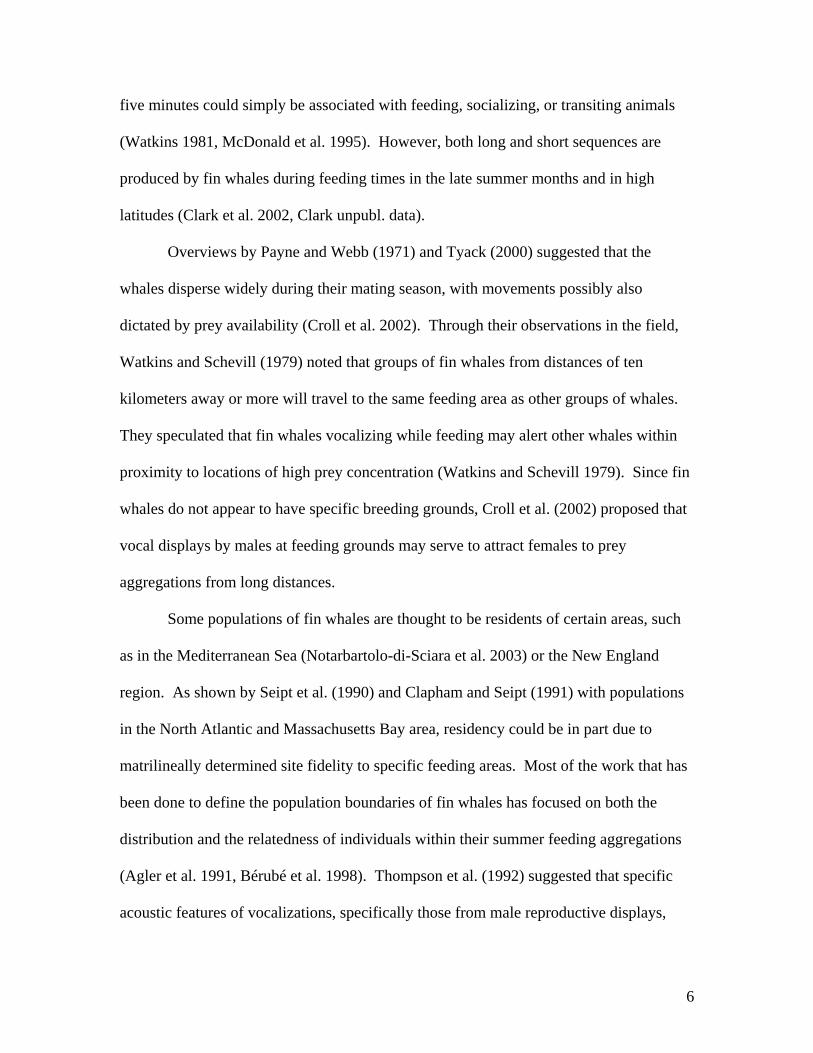
Figure 4. Fin whale pulse train with harmonics, recorded in 1961 by scientists with the Woods Hole Oceanographic Institute in Cape Cod Bay.
16
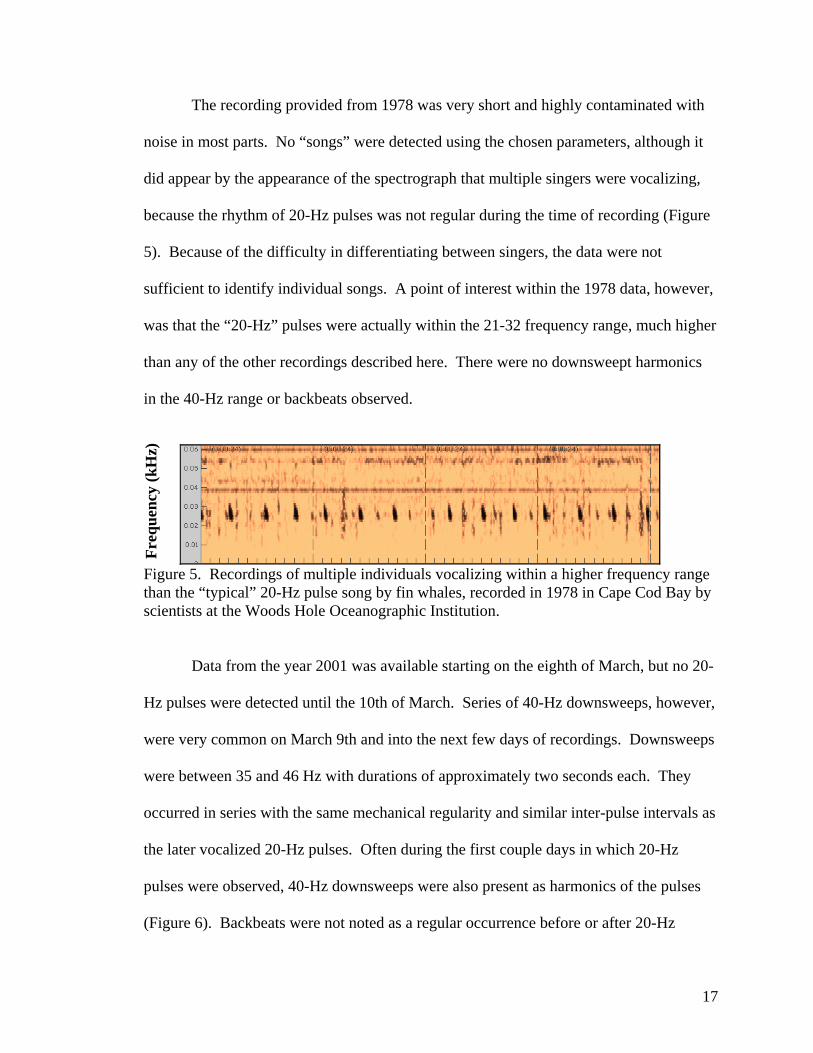
The recording provided from 1978 was very short and highly contaminated with
noise in most parts. No “songs” were detected using the chosen parameters, although it
did appear by the appearance of the spectrograph that multiple singers were vocalizing,
because the rhythm of 20-Hz pulses was not regular during the time of recording (Figure
5). Because of the difficulty in differentiating between singers, the data were not
sufficient to identify individual songs. A point of interest within the 1978 data, however,
was that the “20-Hz” pulses were actually within the 21-32 frequency range, much higher
than any of the other recordings described here. There were no downsweept harmonics
in the 40-Hz range or backbeats observed.
Figure 5. Recordings of multiple individuals vocalizing within a higher frequency range than the “typical” 20-Hz pulse song by fin whales, recorded in 1978 in Cape Cod Bay by scientists at the Woods Hole Oceanographic Institution.
Freq
uenc
y (k
Hz)
Data from the year 2001 was available starting on the eighth of March, but no 20-
Hz pulses were detected until the 10th of March. Series of 40-Hz downsweeps, however,
were very common on March 9th and into the next few days of recordings. Downsweeps
were between 35 and 46 Hz with durations of approximately two seconds each. They
occurred in series with the same mechanical regularity and similar inter-pulse intervals as
the later vocalized 20-Hz pulses. Often during the first couple days in which 20-Hz
pulses were observed, 40-Hz downsweeps were also present as harmonics of the pulses
(Figure 6). Backbeats were not noted as a regular occurrence before or after 20-Hz
17
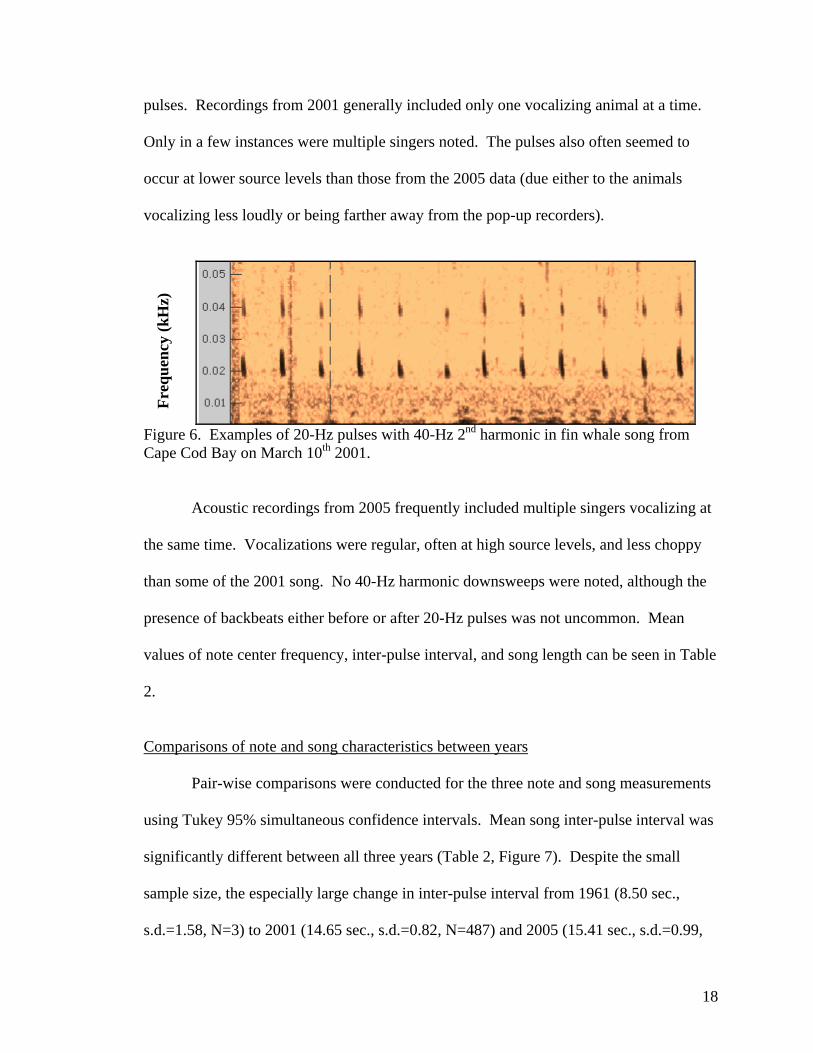
pulses. Recordings from 2001 generally included only one vocalizing animal at a time.
Only in a few instances were multiple singers noted. The pulses also often seemed to
occur at lower source levels than those from the 2005 data (due either to the animals
vocalizing less loudly or being farther away from the pop-up recorders).
Freq
uenc
y (k
Hz)
Figure 6. Examples of 20-Hz pulses with 40-Hz 2nd harmonic in fin whale song from Cape Cod Bay on March 10th 2001.
Acoustic recordings from 2005 frequently included multiple singers vocalizing at
the same time. Vocalizations were regular, often at high source levels, and less choppy
than some of the 2001 song. No 40-Hz harmonic downsweeps were noted, although the
presence of backbeats either before or after 20-Hz pulses was not uncommon. Mean
values of note center frequency, inter-pulse interval, and song length can be seen in Table
2.
Comparisons of note and song characteristics between years
Pair-wise comparisons were conducted for the three note and song measurements
using Tukey 95% simultaneous confidence intervals. Mean song inter-pulse interval was
significantly different between all three years (Table 2, Figure 7). Despite the small
sample size, the especially large change in inter-pulse interval from 1961 (8.50 sec.,
s.d.=1.58, N=3) to 2001 (14.65 sec., s.d.=0.82, N=487) and 2005 (15.41 sec., s.d.=0.99,
18
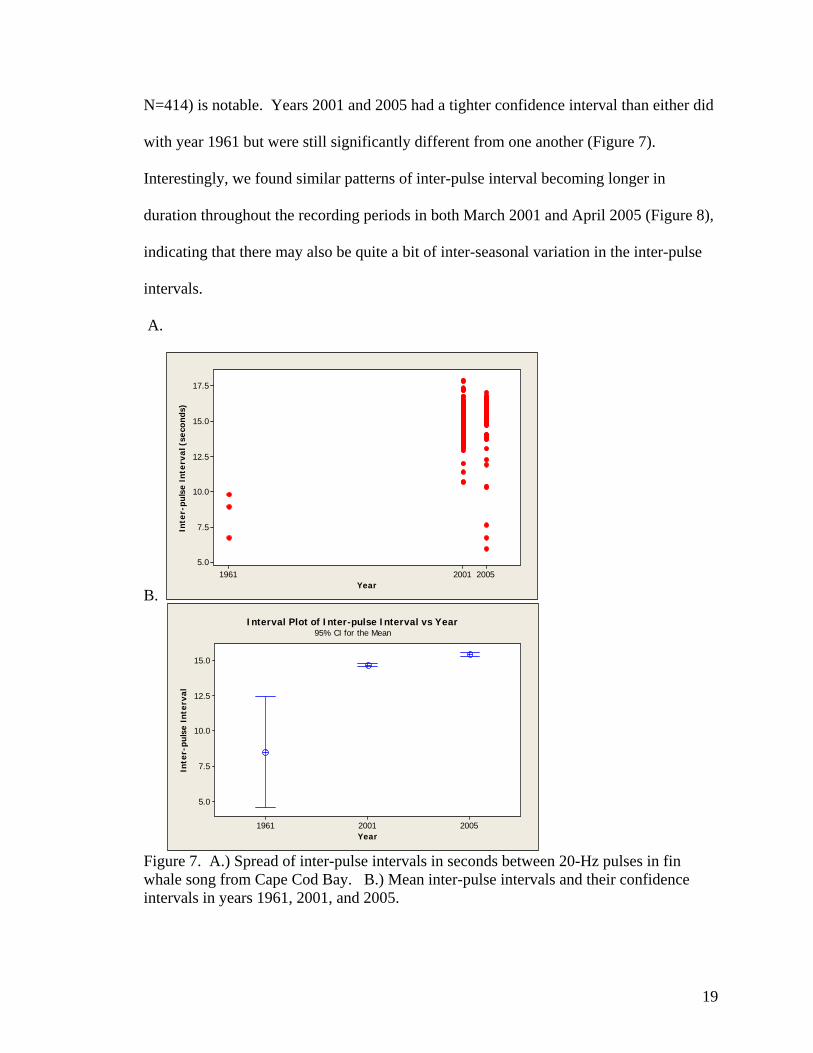
N=414) is notable. Years 2001 and 2005 had a tighter confidence interval than either did
with year 1961 but were still significantly different from one another (Figure 7).
Interestingly, we found similar patterns of inter-pulse interval becoming longer in
duration throughout the recording periods in both March 2001 and April 2005 (Figure 8),
indicating that there may also be quite a bit of inter-seasonal variation in the inter-pulse
intervals.
A.
B. Year
Inte
r-pu
lse
Inte
rval
(se
cond
s)
200520011961
17.5
15.0
12.5
10.0
7.5
5.0
Year
Inte
r-pu
lse
Inte
rval
200520011961
15.0
12.5
10.0
7.5
5.0
95% CI for the MeanInterval Plot of Inter-pulse Interval vs Year
Figure 7. A.) Spread of inter-pulse intervals in seconds between 20-Hz pulses in fin whale song from Cape Cod Bay. B.) Mean inter-pulse intervals and their confidence intervals in years 1961, 2001, and 2005.
19
Index
Inte
r-pu
lse
Inte
rval
(se
cond
s)
8135422711
17.5
15.0
12.5
10.0
7.5
5.0
8135422711
8135422711
1961 2001 2005196120012005
Year
Time Series Plot of Inter-pulse Interval
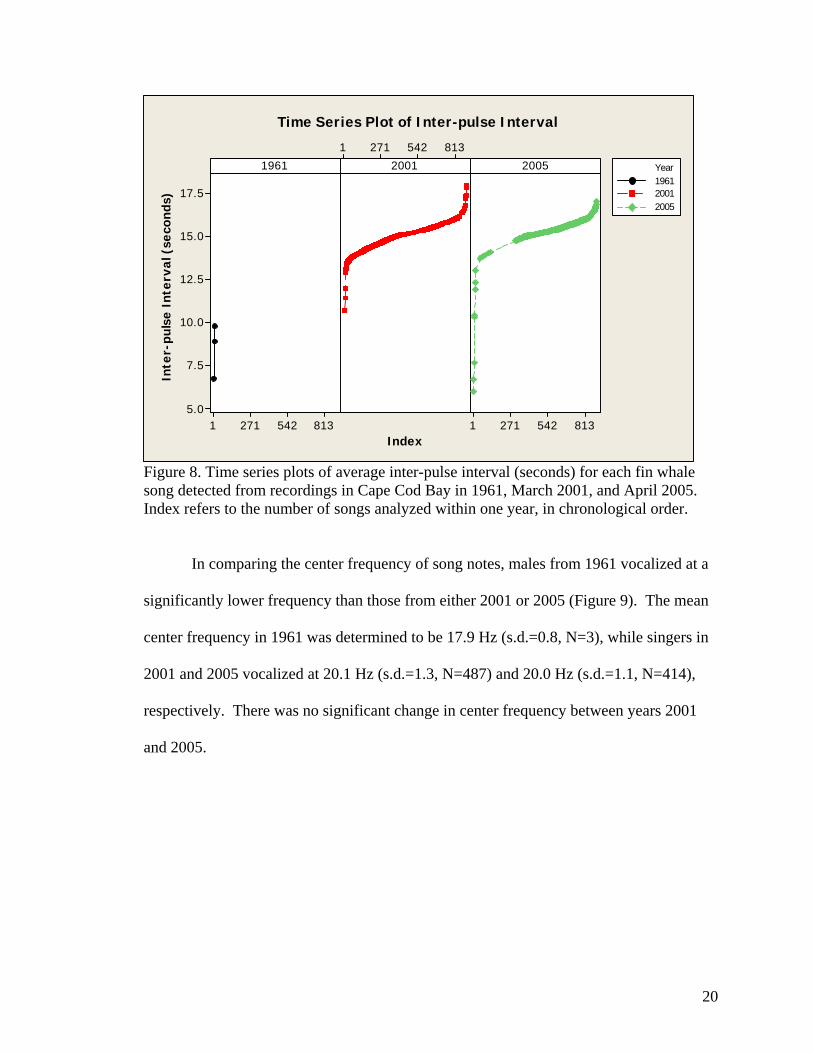
Figure 8. Time series plots of average inter-pulse interval (seconds) for each fin whale song detected from recordings in Cape Cod Bay in 1961, March 2001, and April 2005. Index refers to the number of songs analyzed within one year, in chronological order.
In comparing the center frequency of song notes, males from 1961 vocalized at a
significantly lower frequency than those from either 2001 or 2005 (Figure 9). The mean
center frequency in 1961 was determined to be 17.9 Hz (s.d.=0.8, N=3), while singers in
2001 and 2005 vocalized at 20.1 Hz (s.d.=1.3, N=487) and 20.0 Hz (s.d.=1.1, N=414),
respectively. There was no significant change in center frequency between years 2001
and 2005.
20
A.
B. Year
Cent
er F
requ
ency
(H
z)
200520011961
25
24
23
22
21
20
19
18
17
Year
Cent
er F
requ
ency
(H
z)
200520011961
20
19
18
17
16
95% CI for the MeanInterval Plot of Year vs Note Center Frequency
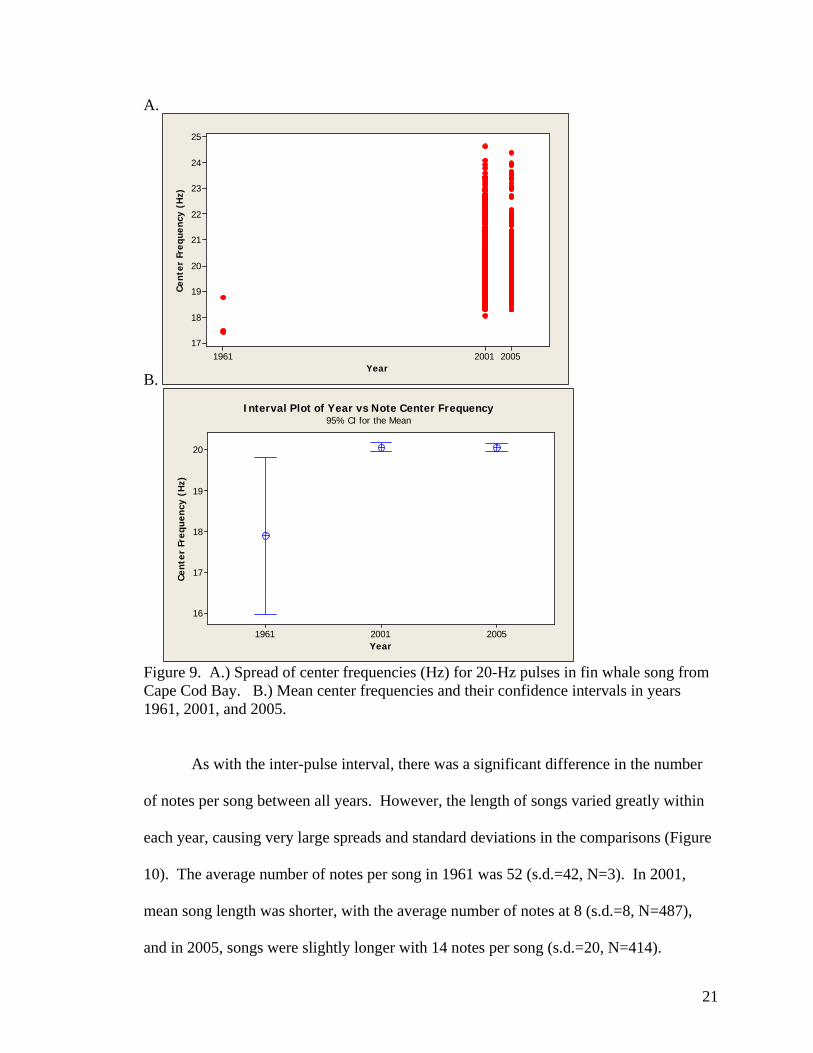
Figure 9. A.) Spread of center frequencies (Hz) for 20-Hz pulses in fin whale song from Cape Cod Bay. B.) Mean center frequencies and their confidence intervals in years 1961, 2001, and 2005.
As with the inter-pulse interval, there was a significant difference in the number
of notes per song between all years. However, the length of songs varied greatly within
each year, causing very large spreads and standard deviations in the comparisons (Figure
10). The average number of notes per song in 1961 was 52 (s.d.=42, N=3). In 2001,
mean song length was shorter, with the average number of notes at 8 (s.d.=8, N=487),
and in 2005, songs were slightly longer with 14 notes per song (s.d.=20, N=414).
21
A.
B. Year
Num
ber
of E
vent
s pe
r So
ng
200520011961
180
160
140
120
100
80
60
40
20
0
Year
Note
s pe
r So
ng
200520011961
150
100
50
0
-50
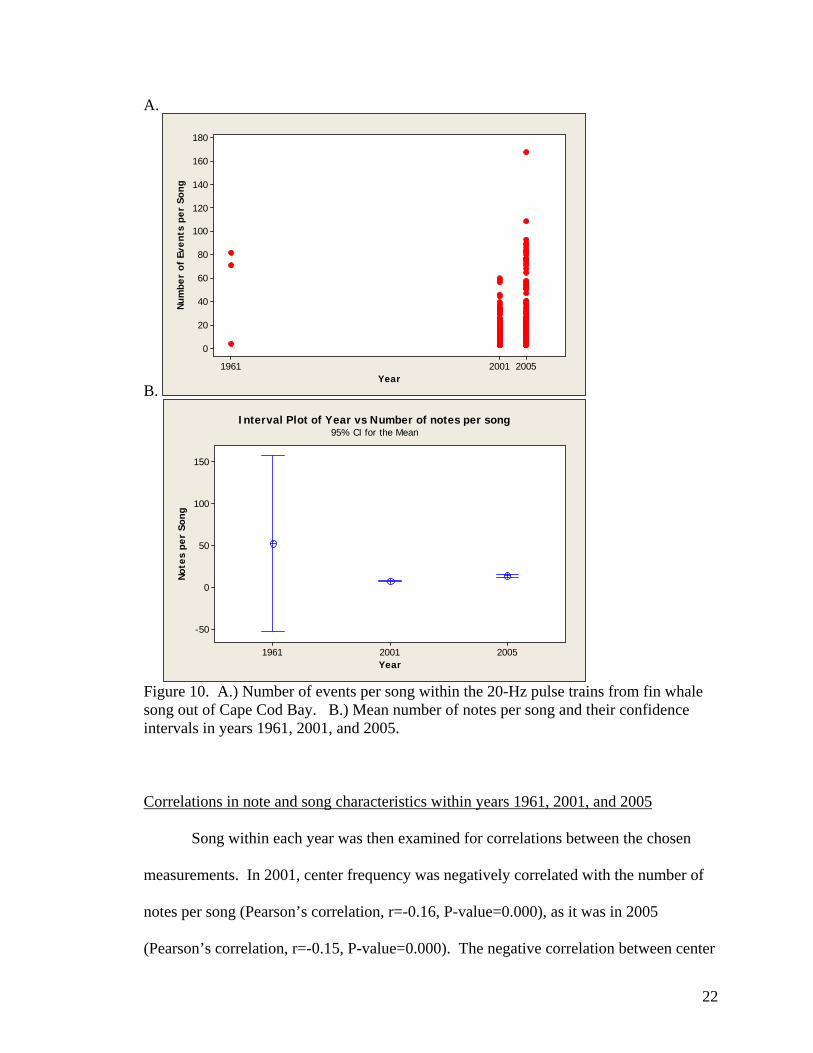
Interval Plot of Year vs Number of notes per song95% CI for the Mean
Figure 10. A.) Number of events per song within the 20-Hz pulse trains from fin whale song out of Cape Cod Bay. B.) Mean number of notes per song and their confidence intervals in years 1961, 2001, and 2005. Correlations in note and song characteristics within years 1961, 2001, and 2005
Song within each year was then examined for correlations between the chosen
measurements. In 2001, center frequency was negatively correlated with the number of
notes per song (Pearson’s correlation, r=-0.16, P-value=0.000), as it was in 2005
(Pearson’s correlation, r=-0.15, P-value=0.000). The negative correlation between center
22
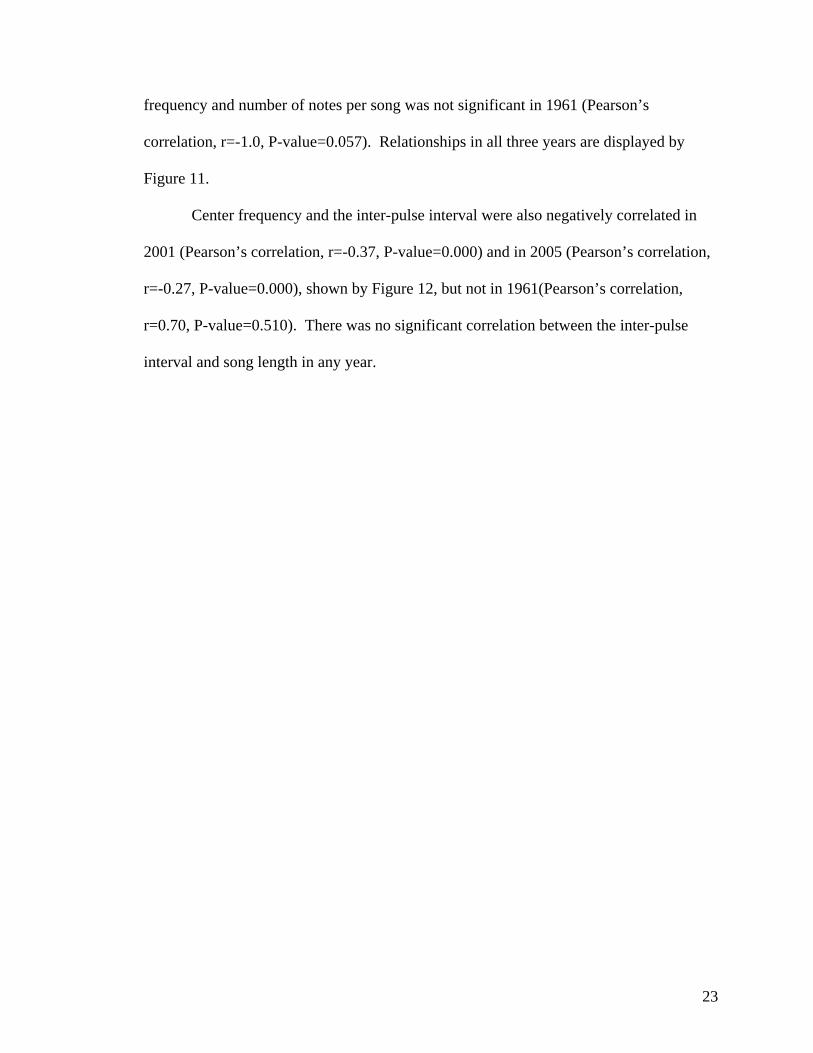
frequency and number of notes per song was not significant in 1961 (Pearson’s
correlation, r=-1.0, P-value=0.057). Relationships in all three years are displayed by
Figure 11.
Center frequency and the inter-pulse interval were also negatively correlated in
2001 (Pearson’s correlation, r=-0.37, P-value=0.000) and in 2005 (Pearson’s correlation,
r=-0.27, P-value=0.000), shown by Figure 12, but not in 1961(Pearson’s correlation,
r=0.70, P-value=0.510). There was no significant correlation between the inter-pulse
interval and song length in any year.
23
Mean center frequency of notes in song (Hz)
Num
ber
of n
otes
per
son
g
24.022.521.019.518.0
100
75
50
25
0
Center frequency vs. notes per song (1961)
Mean center frequency of notes in song (Hz)
Num
ber
of n
otes
per
son
g
24.022.521.019.518.0
100
75
50
25
0
Center frequency vs. notes per song (2001)
Mean center frequency of notes in song (Hz)
Num
ber
of n
otes
per
son
g
2524232221201918
100
75
50
25
0
Center frequency vs. notes per song (2005)
Figure 11. Correlation between the mean center frequency (Hz) and number of notes per fin whale song recorded in 1961, 2001, and 2005 in Cape Cod Bay. Each dot represents one song.
24

Mean center frequency of notes in song (Hz)
Mea
n in
ter-
puls
e in
terv
al (
seco
nds)
2524232221201918
18
16
14
12
10
8
Center frequency vs Inter-pulse interval (2001)
Mean center frequency of notes in song (Hz)
Mea
n in
ter-
puls
e in
terv
al (
seco
nds)
2524232221201918
18
16
14
12
10
8
Center frequency vs Inter-pulse interval (2005)
Figure 12. Correlation between the mean center frequency (Hz) and inter-pulse interval (seconds) for fin whale songs recorded in 2001 and 2005 in Cape Cod Bay. Each dot represents one song.
25
Discussion
In this study, fin whale vocalizations recorded in the area of Cape Cod Bay,
Massachusetts during the years 1961, 1978, 2001, and 2005 were characterized. Song
was compared among the 2001 and 2005 data, as well as between years 1961, 2001, and
2005 where possible. The aims of this study were two-fold, (1) to detect changes in male
fin whale song over this forty-four year period and (2) to examine the relationship of
song center frequency with both song length and inter-pulse interval within each year.
Rejecting the null hypothesis of no significant changes in song characteristics between
years would be inconsistent with the presumption that vocalizations meant for
reproductive displays would be constant over short time scales. Comparison between the
earlier and later data was proven difficult, as no songs were detected in 1978 under the
parameters chosen. Fin whale song from 1961 had an average inter-pulse interval, center
frequency, and song duration that differed from 2001 and 2005 song, although these
differences could be due to a small sample size. Acoustic data in March 2001 and April
2005 were sampled in a similar fashion and during the same time of year. Songs from
March 2001 were significantly shorter in duration and had smaller inter-pulse intervals
than song from April 2005. Negative correlations were found both between the center
frequencies and inter-pulse intervals and between the center frequencies and number of
notes per song in the years 2001 and 2005.
The steady inter-pulse interval of fin whale song has proven in the past to be a
reliable predictor of the region from which the song was recorded (Watkins et al. 1987,
Thompson et al. 1992, Hatch 2004), despite some seasonal variation (Watkins et al. 1987,
Moore et al. 1998). Fin whale song tends to be most prevalent in the winter and early
26
spring months (Thompson and Friedl 1982, Watkins et al. 1987, Moore et al. 1998), so
for the purpose of this study, we thought that acoustic displays within the same season
(i.e. March 2001 and April 2005) would be similar, even between years. However, the
results presented here show that inter-pulse intervals from early spring of 2001 were
significantly shorter than those of 2005. Rejection of the null hypothesis that song
features would not change, these results are actually consistent with previous findings by
Watkins et al. (1987). In their research, Watkins et al. (1987) found that the inter-pulse
interval progressively increased over the course of the late winter months and varied
largely over the rest of the season. Inter-pulse intervals remained somewhat constant
during their study period of two decades for the Bermuda area, although there was
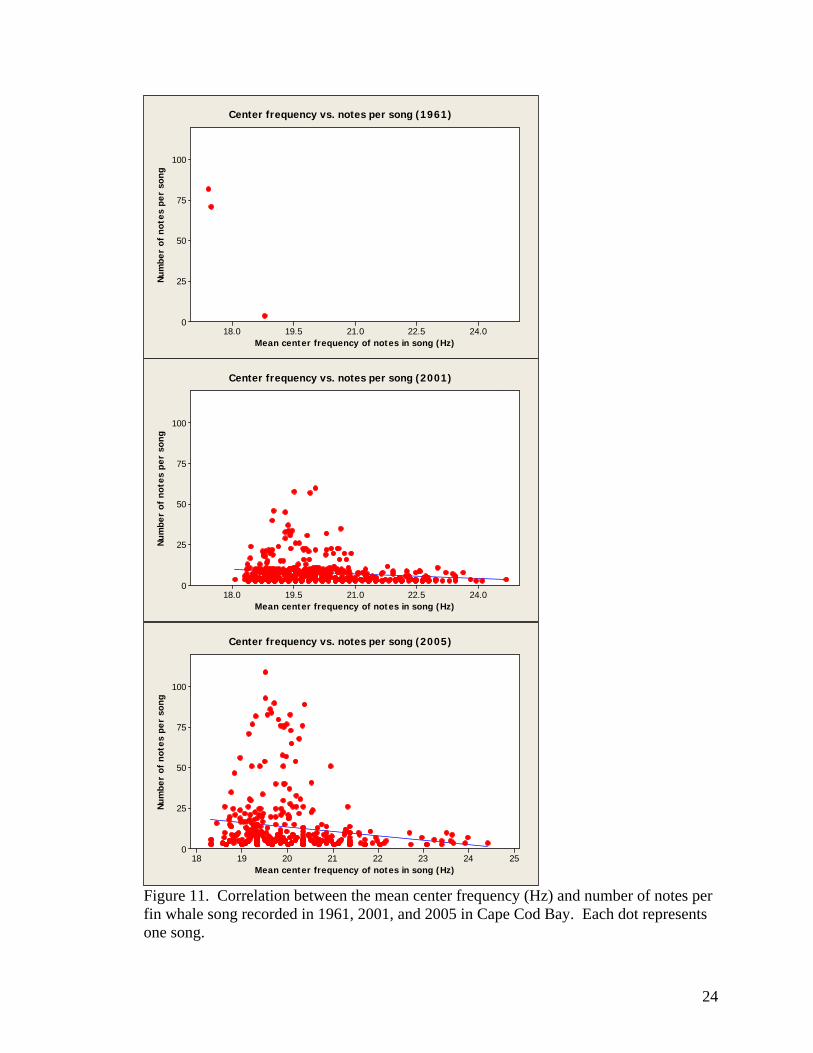
significant variation from year to year and within seasons (Watkins et al. 1987). Figure
13 displays the seasonal pattern of inter-pulse interval lengths found by Watkins et al.
(1987) from fin whale songs from Bermuda over a five year period (July to June 1958-59,
1959-60, 1967-68, and 1978-79, January to June 1967, and July to December 1968).
Figure 13. Monthly averages of inter-pulse intervals within fin whale song from Bermuda over a five-year period (July to June 1958-59, 1959-60, 1967-68, and 1978-79, January to June 1967, and July to December 1968) by Watkins et al. (1987). Pulse intervals were tallied for the month in which the bout began. Horizontal bars denote the average inter-pulse interval for the month, and the vertical bars mark the standard error of the monthly sample (Watkins et al. 1987).
27

In comparing the acoustic data from Bermuda to those from Cape Cod Bay, we
find that the inter-pulse intervals in Bermuda are longer during the same time of year than
those from song in Cape Cod Bay. Although not significantly different, Bermuda fin
whale song in April had a mean inter-pulse interval about a second longer than in March
(Figure 13, Watkins et al. 1987). The seasonal difference from Bermuda during Watkins
et al.’s (1987) study period is similar to the increase of approximately one second in
mean inter-pulse interval that we see between March 2001 and April 2005 in Cape Cod
Bay. These results are consistent with the results from Watkins et al. (1987) that the
inter-pulse interval varies seasonally. With the possibility for such a large change in
inter-pulse interval between months and despite recordings having been from the same
season, inter-year comparisons of this vocal characteristic between the months of March
2001 to April 2005 may not be reliable. Hatch (2004) found that different patterns of
inter-pulse intervals can arise over the course of several years. She suggested that a
dominant pattern may last several years before changing to a different pattern that will
last another few years (Hatch 2004). Whether seasonal variation remains consistent over
long periods of time relative to changes in mean inter-pulse intervals between years is
unknown, although it would be interesting to compare recordings from mid-March and
early April in Cape Cod Bay over the course of several years.
It is also important to consider that the ability of certain song features may vary
seasonally in its reliability of assigning individuals to regions (Hatch 2004). For
example, song from the northwest North Atlantic and western tropical North Atlantic had
higher distinction and showed less variance between individuals in the late fall and early
winter as opposed to the springtime (Hatch 2004). It would be useful to characterize
28
continual fin whale song over the course of a few years in several locations, to document
and compare patterns of seasonal change within each region, as well as identify how song
changes in one location might influence the song of another area. Inter-pulse intervals
are thought to be the best song feature for differentiating fin whale populations, and it
may be possible in the future to assign individuals to particular populations based on
comparisons of inter-pulse intervals. However, it is important that we understand the
regional patterns of seasonal and yearly change before prematurely attempting to define
populations based on such specific song parameters.
The center frequency of fin whale song is a defining characteristic presumably
because of the many advantages that vocalizing at 20 Hz has for long-range
communication. Vocalizations recorded in 1961 were found to have an average center
frequency of more than two Hertz less than in 2001 or 2005, and those from 1978 were
considerably higher in frequency than any other year. Producing high intensity infrasonic
calls probably requires a large body size, as animals most effectively produce sounds that
have wavelengths equal to or smaller than their own body sizes (Bradbury and
Vehrencamp 1998). Larger animals are therefore most likely better able to vocalize at
lower frequencies (Bradbury and Vehrencamp 1998), so it is possible that the songs
recorded in 1961 were produced by a larger animal or animals than those in 1978, 2001,
or 2005. Center frequencies between 2001 and 2005 were not significantly different, so
we might expect that vocalizing males within these time periods were of similar sizes.
If center frequency is indicative of body size, it may reveal information about the
quality of vocalizing individuals to listeners. Especially in species with little or no male
parental investment, costs of reproduction for females are very high, so it is not unlikely
29
that females would choose potential mates based upon certain defining criteria that would
confer higher reproductive success on their offspring (Clapham 1996). Heritable
qualities such as larger size, higher stamina, and better competitive abilities have been
shown to increase the mating success of males in many other taxa (LeBoeuf 1974,
Gosling and Petrie 1981, Clutton-Brock et al. 1982, Clapham 1996).
Song length may contain information relating to the fitness of singing humpback
whales, as it could be indicative of diving ability and stamina (Chu and Harcourt 1986,
Chu 1988). The number of notes per song, or song duration, in fin whales may reveal
similar information regarding the stamina of a specific whale or group of individuals. Fin
whale song from April 2005 was significantly longer in duration than song from March
2001. If singers from this supposed resident population were the same between both
years, the change in mean song duration could indicate that with age, the males had
become more experienced singers with higher stamina. The ability to maintain high
regularity within a song for long periods of time could also be an indication of male
quality (Clark pers. comm.). However, as with humpback whales, it may prove difficult
to assign male quality to specific song lengths in fin whales, as mean song length within a
population evidently varies between years (Payne et al. 1983). In terms of seasonality,
the results found here are not in accordance with those of Watkins et al. (1987), who
found off Bermuda that fin whale song became shorter over the course of the season.
Clark (pers. comm.) has also noted that fin whale song normally tends to lesson and
deteriorate through the course of the springtime in Cape Cod Bay.
Songs of different lengths could relay several types of information between
communicating whales. Longer song bouts may serve as reproductive displays (Moore et
30
al. 1998), but shorter, irregular pulse trains could be associated with feeding, socializing,
or transiting animals (Watkins 1981, McDonald et al. 1995). During peak feeding
periods in the late summer months, both long and short sequences are heard, which has
led to the hypothesis that vocal displays serve to attract females from long distances to
prey aggregations (Croll et al. 2002). The vocalizations from March 2001 analyzed here
were significantly shorter than those from April 2005. During the first few days of data
collection in 2001, no 20-Hz pulses were detected. When songs were observed, they did
not immediately have the mechanical regularity of the 20-Hz pulse trains observed in
April 2005. The earlier vocalizations in March 2001 could possibly have offered
different information to females or conspecifics than those from April 2005. They may
also have been the result of newly vocalizing males or the recording of only a few
individuals that were not necessarily representative of all resident males.
A negative correlation between mean center frequency and the number of notes
per song was found in both 2001 and 2005. This relationship could be due to the actual
physical constraints of a singing fin whale. If it is the larger animals that are able to
vocalize at lower frequencies, these males may also have higher stamina and be more
capable of singing for longer periods of time. Fin whales grow continually with age, so
larger body size might also go hand in hand with more experience as a singer. Short song
at a higher frequency may be an indication of a younger, smaller, and more inexperienced
individual, whereas song of long duration sung at lower frequencies could be a sign of a
larger, older male who has the ability to maintain regularity in his vocalizations for
longer periods of time.
31
The negative correlation between center frequency and inter-pulse interval in
years 2001 and 2005 may also be due to some sort of physical constraint. If smaller
males are somehow able to disguise their size by singing at lower frequencies, the higher
energy demand could limit how quickly they are able to vocalize again. It would be
helpful to have accurate information on the corresponding song intensities, because if
males sing very loudly at lower frequencies, the high amounts of energy invested into
each note might require a longer recuperation period before the output of the next note.
The allowance of more time between each pulse would also make the pulses more
distinct to listeners at further distances from the singer.
The exact function of fin whale song remains unknown, but acoustic data have
proven useful in preliminary attempts to understand their behavior and differentiate
between regional fin whale populations. Although fin whale song may be an acoustic
mating display by males, results of this study suggest that specific note and song features,
such as center frequency, inter-pulse interval, and song duration, can differ significantly
over a relatively short period of time. One explanation for the changing patterns in fin
whale song from Cape Cod Bay may be the animals’ contact with vocalizing whales from
other populations, as there is evidence of vocal learning in several other cetacean species
(Tyack 2000). A study by Rhen and Crews (2002) also reported that mammals seem to
be particularly sensitive to environmental perturbations that influence intrasexual changes
in behavior. It is currently unclear as to whether shifting fin whale song is due to the
incorporation of the different song features to which they are exposed, or if it is simply a
result of differing environmental influences on the singers, including seasonal effects.
The goal of defining population boundaries based on acoustic data requires a much better
32

understanding of seasonal and yearly song variation within and between regions. It is
also important to consider that population boundaries are likely to be dynamic (Hatch
2004). Spatial overlap in populations is expected to vary in response to oceanographic
cyclic fluctuations (Greene and Pershing 2000) and other environmental variables that
would affect the availability and location of prey (Hatch 2004). Anthropogenic effects
also no doubt might have a large influence on fin whale distributions and may affect the
degree to which individuals from different populations come into contact with one
another, either physically or acoustically (Hatch 2004). A thorough study of continuous
fin whale acoustic data over the course of several years in adjacent regions would prove
extremely useful to characterize seasonal and annual variability in song, as well as to help
identify anthropogenic, environmental, and inter-population influences on song patterns.
33