Changes in consumer financial status during the early ...
47
CONSUMER FINANCIAL PROTECTION BUREAU | APRIL 2021 Changes in consumer financial status during the early months of the pandemic Evidence from the second wave of the Making Ends Meet survey Data Point No. 2021-2 Scott Fulford, Marie Rush, and Eric Wilson prepared this report. Data points are an occasional series of publications from the Consumer Financial Protection Bureau’s Office of Research. These publications are intended to further the Bureau’s objective of providing an evidence-based perspective on consumer financial markets, consumer behavior, and regulations to inform the public discourse.
Transcript of Changes in consumer financial status during the early ...

CONSUMER FINANCIAL PROTECTION BUREAU | APRIL 2021
Changes in consumer financial status during the early months of the pandemic Evidence from the second wave of the Making Ends Meet survey Data Point No. 2021-2 Scott Fulford, Marie Rush, and Eric Wilson prepared this report. Data points are an occasional series of publications from the Consumer Financial Protection Bureau’s Office of Research. These publications are intended to further the Bureau’s objective of providing an evidence-based perspective on consumer financial markets, consumer behavior, and regulations to inform the public discourse.

1 CHANGES IN CONSUMER FINANCIAL STATUS DURING THE EARLY MONTHS OF THE PANDEMIC
Table of contents 1. Introduction ................................................................................................................2
2. The Making Ends Meet survey.................................................................................5
3. Overall improvement in consumer financial status .............................................7
3.1 CFPB Financial Well-Being Scores ........................................................... 8
3.2 Difficulty paying a bill or expense ............................................................12
3.3 Credit scores..............................................................................................15
4. Consumers whose finances have worsened ......................................................23
4.1 Demographic characteristics of those worse off in June 2020 .............. 23
4.2 Job loss, cash flows, and forbearance ..................................................... 25
5. Conclusion................................................................................................................29
Appendix A: Sampling and weighting ....................................................................30
Appendix B: Comparison to other surveys............................................................32
Appendix C: Regressions .........................................................................................38

2 CHANGES IN CONSUMER FINANCIAL STATUS DURING THE EARLY MONTHS OF THE PANDEMIC
1. Introduction Beginning in March 2020, the novel coronavirus and efforts to reduce its spread sent the U.S. economy into one of the sharpest recessions in recent history. State governments imposed restrictions on gatherings and businesses closed. Millions were laid off, either temporarily or permanently. By June 2020, the unemployment rate had risen to 11.1 percent, with almost 31 million people claiming unemployment insurance benefits.1
Despite these volatile economic conditions, the average consumer’s financial status improved between June 2019 and June 2020, even as some consumers’ status deteriorated. We use the 2019 and 2020 waves of the Bureau’s Making Ends Meet Survey and its connection to credit bureau data to examine this improvement across three measures of consumer financial status.2 Compared to a year earlier, in June 2020 fewer consumers had difficulty paying a bill or expense, credit scores increased, and subjective financial well-being increased.
Although financial status increased on average early in the pandemic, some consumers were financially worse off. Declines in financial status were most concentrated among consumers whose incomes or available cash declined, rather than the unemployed. Forbearance appears to have helped consumers who were having difficulty paying bills avoid a decline in financial well-being. While the combination of consumers’ spending choices, forbearance, and government transfers early in the pandemic may have prevented more widespread financial difficulties, these gains may not have lasted as policies have expired and many consumers face persistent reductions in cash flows. Other research examining the first several months of the pandemic has reached similar conclusions: delinquencies as reported in credit bureau data declined,3 credit card debt fell even for financially vulnerable consumers,4 bank account balances rose,5 and survey-based measures of financial conditions rose.6 Overall, consumers’ cash balances
1 Bureau of Labor Statistics, “Economics News Release: Employment Situation Summary,” July 2020. Available: https://www.bls.gov/news.release/archives/laus_07172020.pdf. Bureau of Labor Statistics, “Unemployment Insurance Weekly Claims,” June 25, 2020. Available: https://oui.doleta.gov/press/2020/062520.pdf. 2 Section 2 provides a description of these data. 3 Ryan Sandler and Judith Ricks, “The Early Effects of the COVID-19 Pandemic on Consumer Credit,” August 2020. Available: https://files.consumerfinance.gov/f/documents/cfpb_early-effects-covid-19-consumer-credit_issue-brief.pdf. 4 Scott Fulford and Marie Rush, “Credit card debt fell even for consumers who were having financial difficulties before the pandemic”, December 17, 2020. Available: https://www.consumerfinance.gov/about-us/blog/credit-card-debt-fell-even-consumers-having-financial-difficulties-before-pandemic/ 5 JP Morgan Chase Institute, “Initial Impacts of the Pandemic Reflect that Families Changed their Saving and Spending Behavior,” June 2020. Available: https://www.jpmorganchase.com/institute/research/household-income-spending/jpmorgan-chase-institute-take. 6 Thea Garon, Andrew Dunn, Necati Celik, and Helen Robb, “US Financial Health Pulse: 2020 Trends Report”, October 2020. Available: https://s3.amazonaws.com/cfsi-innovation-files-2018/wp-content/uploads/2020/10/26135655/2020PulseTrendsReport-Final-1016201.pdf.

3 CHANGES IN CONSUMER FINANCIAL STATUS DURING THE EARLY MONTHS OF THE PANDEMIC
improved substantially because average incomes did not decline, helped by unemployment benefits and other transfers, while consumer spending fell dramatically in the first months of the pandemic. This report adds to these studies because the survey’s connection to credit bureau data allows us to examine both subjective survey-based measures and objective measures from the credit bureau. In addition, by looking at the same consumers across survey waves, we can better understand the kinds of consumers who were not doing as well and who might be helped by additional policies.
The improvements we observed were widespread across race, ethnicity, age, rural status, and income level. In June 2019, there were large, pre-existing differences in financial status by race, ethnicity, age, rural status, and income group. As of June 2020, these differences do not appear to have increased or decreased substantially, within the statistical confidence range allowed by the survey. The one exception is that financial status improvements were concentrated among consumers under age 40. Our analysis suggests that consumers age 62 and older were doing no better or worse financially than before the pandemic.
The financial status of some consumers worsened, even as the average consumer was more financially secure. Consumers who became unemployed were much more likely to have a decline in subjective financial well-being or to have new difficulty paying bills. However, newly unemployed consumers did not have lower credit scores in June 2020. This disconnect suggests that forbearance and assistance from financial institutions, as well as government policies to provide unemployment benefits and one-time cash payments, were effective at keeping unemployment from causing default on loans reported to credit bureaus.
The combination of these policies meant that many unemployed consumers did not necessarily face a large decline in income. In the survey, consumers whose cash flows declined were much more likely to experience a decrease in financial status, regardless of whether they also became unemployed. Consumers whose incomes or savings declined were much more likely to have a drop in subjective financial well-being, to be newly unable to pay a bill, and to have a decline in credit score. Individuals who received forbearance were less likely than those who did not to have a decline in financial well-being, equally likely to have a decline in credit score, and more likely to have had new difficulties paying bill.
While the financial status of the average consumer improved early in the pandemic, those gains may not have lasted, and not everyone’s financial status improved. This report focuses on the first several months of the pandemic and consumers’ financial status may have changed since then. Policies that kept sufficient cash in the hands of those who needed it may have helped reduce or eliminate financial distress, yet such policies have been inconsistent. Financial distress may have increased after the extra $600 weekly unemployment benefit under the

4 CHANGES IN CONSUMER FINANCIAL STATUS DURING THE EARLY MONTHS OF THE PANDEMIC
CARES Act7 stopped on July 31, 2020, and consumers started to draw down savings.8 More recent unemployment supports did not fully restore the relief that the CARES Act provided. Limited payments under the Lost Wage Assistance program occurred for several weeks starting in August, and the Consolidated Appropriations Act and American Rescue Plan Act provided $300 benefits from January through August 2021.
At the same time, unemployment has been steadily declining, though it remains higher than before the pandemic, especially for Black and Hispanic consumers.9 One reason why the improvements in financial status we observe appear widespread across racial and ethnic groups may be that transfer policies have been effective at reaching the most affected groups. The Bureau is conducting a third wave of the Making Ends Meet survey to understand how these changes have affected consumers since June 2020.
An overall improvement in financial status does not imply more general improvement in consumers’ lives, especially against the tragedy of so much illness and death. The combination of consumers’ spending choices, forbearance, and government transfers may have prevented more widespread financial difficulties, but consumers drastically reduced many activities to limit the spread of the virus. Financial status improved in part because consumers spent less, as they avoided going out to restaurants, taking vacations, or visiting family, among other limitations. To the extent that average financial status improved because consumers were unable or unwilling to spend money on things they enjoy, the improvement may have come at the cost of these lost opportunities.
7 Coronavirus Aid, Relief, and Economic Security Act, Pub. L. 116-136 (2020). 8 Diana Farrell, Peter Ganong, Fiona Greig, Max Liebeskind, Pascal Noel, Daniel Sullivan, and Joseph Vavra, “The unemployment benefit boost: Trends in spending and saving when the $600 supplement ended,” October 2020, JPMorgan Chase Institute Policy Brief. Available: https://www.jpmorganchase.com/content/dam/jpmc/jpmorgan-chase-and-co/institute/pdf/Institute-UI-Benefits-Boost-Policy-Brief_ADA.pdf. 9 For the latest statistics see: Bureau of Labor Statistics, 2021, “Civilian unemployment rate” Available: https://www.bls.gov/charts/employment-situation/civilian-unemployment-rate.htm#.

5 CHANGES IN CONSUMER FINANCIAL STATUS DURING THE EARLY MONTHS OF THE PANDEMIC
2. The Making Ends Meet survey
We use the first two waves of the Making Ends Meet survey to understand changes in consumers’ financial status. The survey results provide a deeper understanding of how often U.S. consumers have difficulty making ends meet, how they cope with these shortfalls, and the consequences of the shortfalls. The Bureau conducted Wave 1 of the survey starting in May 2019 and Wave 2 starting in May 2020. Most respondents took several weeks to respond, so typical responses occurred in June in each year. In this brief, we refer to June as the month the surveys occurred.
The initial Wave 2 sample consisted of all respondents, including partial respondents, to Wave 1.10 Repeated surveying of the same consumers allows us to examine how the same individuals’ economic circumstances changed and how they react to those changes.
Ultimately, 2,990 consumers responded to Wave 1 either on paper or online. Of those, 1,834—or about 61 percent—responded to at least the first questions in Wave 2. Because we focus on the change over time in three separate measures of financial status—subjective Financial Well-Being score, difficulty paying for a bill or expense, and credit score—we drop consumers who were missing values for at least one of these measures in either year, yielding a final analysis sample size of 1,742 for this report (about 58 percent of Wave 1 respondents).
The survey sample is drawn from the Bureau’s Consumer Credit Panel (CCP), a 1-in-48 random and de-identified sample of credit records maintained by one of the three nationwide credit reporting agencies.11 This connection to the CCP is a key advantage of the survey and allows us to understand how consumers’ credit and debts evolve before, during, and after the survey waves. In addition, the survey results include information about race, ethnicity, income, gender, education, and other demographic variables which are not typically known by the credit bureau.
10 In addition, the Bureau mailed a survey to a small sample of non-respondents from Wave 1 to better understand non-response. The relatively few responses to these non-Wave-1-respondents are not included in the analysis of this report. 11 The CCP excludes any information that might reveal consumers’ identities, such as names, addresses, and Social Security numbers. For more information on the privacy protections associated with this survey, see the Consumer Experience Research Privacy Impact Assessment, available at http://files.consumerfinance.gov/f/201406_cfpb_consumer-experience-research_pia.pdf and System of Records Notice CFPB.022, Market and Consumer Research Records, available at http://www.consumerfinance.gov/privacy/system-records-notices/market-and-consumer-research-records-2/.

6 CHANGES IN CONSUMER FINANCIAL STATUS DURING THE EARLY MONTHS OF THE PANDEMIC
The Wave 1 survey oversampled consumers with lower credit scores, with recent credit delinquencies, and those living in rural areas to help give enough representation to allow analyses among these groups. Using the CCP strengthens the survey by allowing this kind of oversampling. Additional details on the Wave 1 sampling methodology and survey protocol are in the initial report on Wave 1.12
The combined Wave 1 and Wave 2 survey is weighted align with the CCP, a comprehensive national sample of consumers with a credit record. More precisely, Wave 1 is weighted to be representative of consumers in the CCP, as described in the initial report. The combined Wave 1 and Wave 2 data are weighted to match Wave 1 along several dimensions (including income, gender, marital status, rural status, credit score and whether the respondent had difficulty paying a bill) and changes in credit score and delinquency status between Wave 1 and Wave 2. Because the survey sample is drawn from the CCP, we can observe changes in the financial status of both respondents and non-respondents and use those changes in developing weights that adjust for attrition between Wave 1 and Wave 2. The ability to adjust for attrition between Wave 1 and Wave 2, using not just Wave 1 variables but also observable changes in the CCP between Wave 1 and Wave 2, is another key advantage of the survey and makes the survey results generally reflect the range of consumers’ experiences since Wave 1. Additional details on the weighting methodology and a comparison to Wave 1 responses and other surveys are contained in Appendices A and B.
12 Scott Fulford and Marie Rush, “Insights from the Making Ends Meet Survey,” July 13, 2020. Available: https://www.consumerfinance.gov/documents/8990/cfpb_making-ends-meet_survey-results_2020-07.pdf.

7 CHANGES IN CONSUMER FINANCIAL STATUS DURING THE EARLY MONTHS OF THE PANDEMIC
3. Overall improvement in consumer financial status
COVID-19 brought about a severe economic recession, including a major spike in unemployment. Nevertheless, during the turmoil surrounding the early stages of the pandemic, consumer financial status improved across a range of measures. We examined the average changes in three measures of financial status over the year between June 2019 and June 2020:
1) The CFPB’s five-question Financial Well-Being Scale: Between 2015 and 2017, the CFPB produced a consumer-driven definition of financial well-being and a validated scale for measuring it. This measure broadly gauges consumers’ subjective financial outlook. The survey items that make up this scale include questions to determine the extent to which statements like “My finances control my life” and “I am just getting by financially” apply to respondents.13
2) Reported difficulty paying a bill or expense: Both waves of the Making Ends Meet survey include questions about whether the respondent had difficulty paying a bill or expense in the previous year. These questions capture whether the consumer is in a financial situation requiring her or him to make choices in order to “make ends meet.”
3) Credit Scores: Consumers’ credit scores provide an objective measure of whether information reported to a credit reporting agency indicates the consumer may not pay all debts as agreed. However, credit scores do not reflect other important elements of a consumer’s financial condition.14
13 See Section 3.1 for a full list of items and how they shifted from year to year. For a detailed description of how this scale is constructed and its distribution from a national survey, see: “Financial well-being in America,” September 2017, CFPB report. Available: https://s3.amazonaws.com/files.consumerfinance.gov/f/documents/201709_cfpb_financial-well-being-in-America.pdf. 14 We use VantageScore 3.0, a commercially available credit score.

8 CHANGES IN CONSUMER FINANCIAL STATUS DURING THE EARLY MONTHS OF THE PANDEMIC
TABLE 1: AVERAGE IMPROVEMENT IN CONSUMERS’ FINANCIAL STATUS BETWEEN JUNE 2019 AND JUNE 2020
Metric June 2019
June 2020
Difference15
CFPB Financial Well-Being Score 51.1 52.1 +1*
Percentage of individuals who had difficulty paying for a bill or expense in the previous year
40 36 -4*
Credit Score 699 710 +11*
Across all three measures, consumers were better off, on average, in June 2020 than in June 2019, as shown in Table 1. Each of these measures captures a different aspect of consumers’ financial lives, so the improvements are not restricted to a single measure of financial status. These findings overlap with those documented in other studies: overall debt balances and delinquencies declined from February through June 2020;16 credit card balances fell even for consumers who were financially insecure before the crisis;17 credit reporting agencies reported increases in credit scores;18 and other survey-based financial well-being measures have ticked upwards as well. 19
In the sections that follow, we discuss the improvements in each measure and some of the factors that may be behind them.
3.1 CFPB Financial Well-Being Scores In 2015, the CFPB developed a definition of financial well-being from a consumer perspective in order to provide practitioners and researchers with a standard, reliable, and broadly available
15 Asterisks indicate that the difference between 2019 and 2020 was statistically significant at the five percent level. 16 Sandler and Ricks, “The Early Effects.” The decline in delinquencies may reflect forbearance and other accommodations which limit whether a consumer is reported delinquent, not whether the consumer is having difficulty. 17 Fulford and Rush, “Credit card debt fell.” 18 Stefan Lembo Stolba, “COVID-19 Impact: Changes to Consumer Debt and Credit,” July 8, 2020. Available: https://www.experian.com/blogs/ask-experian/research/covid-19-impact-on-consumer-debt-and-credit/. Note that our average credit scores are somewhat higher than the average scores reported by Experian. Experian calculates its average based on all credit records, including records that are fragments or otherwise incomplete and as a result typically receive lower credit scores, if they are scored at all. The credit scores we use in our calculations are for consumers, not data fragments, and will tend to be higher as a result. The change in scores between June 2019 and June 2020 is nearly the same, after correcting for the expected age drift from observing a consistent sample for a year. see Appendix B. 19 For example, the Financial Health Network (FHN) reports that the percentage of individuals for whom the FHN scale (the FinHealth Score) categorizes as “Financially Healthy” increased from 29 percent to 33 percent between April 2019 and August 2020. Likewise, the percentage of individuals who would pay for a $400 expense using cash or an equivalent (a longstanding benchmark for the status of household finances in the US) was unchanged between October 2019 and April 2020, according Federal Reserve’s Report on the Economic Well-Being of U.S. Households.

9 CHANGES IN CONSUMER FINANCIAL STATUS DURING THE EARLY MONTHS OF THE PANDEMIC
way to measure individual financial well-being. According to that definition, financial well-being “is a state of being wherein a person can fully meet current and ongoing financial obligations, can feel secure in their financial future, and is able to make choices that allow them to enjoy life.” In 2017, the CFPB released the Financial Well-Being Scale, a method of quantifying financial well-being by that definition. The scale, which can be calculated from a five- or ten-question survey, gives a consumer a score from zero to 100, where higher scores represent higher levels of financial well-being. We included the five-question version of the survey among the questions we asked in both 2019 and 2020.20
Previous researchers have found that, on average, CFPB Financial Well-Being scores remain steady over time.21 Between June 2019 and June 2020, however, they improved from an average of 51.1 to 52.1. This increase is substantial. For comparison, across consumers, a one-point increase is associated with an increase of household income by approximately $15,000, a five-year age increase, or a 20-point increase in credit score (see Table 3). Table 2 shows that most components of the scale improved as well. Many of the components ask how well a consumer agrees with a statement of negative financial status, so improving financial status decreases the component average.
20 See the CFPB’s “Measuring financial well-being” page for more details: https://www.consumerfinance.gov/data-research/research-reports/financial-well-being-scale/. 21 See, Jeremy Burke and Francisco Perez-Arce, “Longitudinal Changes in Financial Well-Being, Financial Behaviors, and Life Events”. Available: https://files.consumerfinance.gov/f/documents/cfpb_financial-well-being_burke-perez-arce_brief.pdf. Burke and Perez-Arce found that the median change in Financial Well-Being Scores between May 2018 and May 2019 was zero, and that the distribution of changes was approximately normal. They found similar results for consumers for whom the time between an earlier survey and May 2018 varied (with a median of 2.5 years). Our median change is an increase of one, and our mean change is approximately one.

10 CHANGES IN CONSUMER FINANCIAL STATUS DURING THE EARLY MONTHS OF THE PANDEMIC
TABLE 2: CHANGE IN THE PERCENTAGE REPORTING THAT STATEMENTS IN THE CFPB FINANCIAL WELL-BEING SCALE DESCRIBES THEMSELVES EITHER “COMPLETELY” OR “VERY WELL” OR THAT STATEMENTS OCCUR “ALWAYS” OR “OFTEN”
Percentage reporting that statement describes themselves “Completely” or “Very Well”
June 2019
June 2020 Difference22
I am just getting by financially 34.7 34.8 0.1
I am concerned that the money I have or will save won’t last 43.1 37.7 -5.4*
Because of my money situation, I feel like I will never have the things I want in life
31.9 28.6 -3.2
Percentage reporting that the statement occurs “Always” or “Often” - - -
I have money left over at the end of the month 42.7 46.6 3.9*
My finances control my life 42.7 34.7 -8.0*
Consumers responded more favorably in June 2020 to each item in the scale, though changes in the first and third items were not statistically significant. There was a large and statistically significant drop in the number who felt their finances controlled their lives and the number concerned their money would not last. More stated that they had leftover money at month’s end.
3.1.1 Financial Well-Being score changes by demographics Demographics such as race, ethnicity, and income are strongly correlated with levels of financial well-being in both June 2019 and June 2020 survey waves. Table 3 shows the Financial Well-Being score by demographic group in June 2019, June 2020, and the change between them. The survey included questions on race, ethnicity, income, gender, and education, which are not generally available in credit bureau data. In both survey waves, Black and Hispanic consumers had lower Financial Well-Being scores than Non-Hispanic White consumers, and women had lower scores than men. Younger consumers and those with less education have lower Financial Well-Being scores than their older and more educated counterparts in both years as well. And those with lower incomes had lower Financial Well-Being scores in both years than those with higher incomes.23
22 Asterisks indicate that the difference between 2019 and 2020 was statistically significant at the five percent level. 23 Many demographic characteristics, such as income and race, are closely related. After controlling for each of the demographic factors in Table 3 by including them in a regression, income and age are the only characteristics along which group differences remain significant in both years. Gender is only significant in 2019, and education is only significant in 2020. The remaining factors are not significant in either year. See Figure 8 in Appendix C for more information.

11 CHANGES IN CONSUMER FINANCIAL STATUS DURING THE EARLY MONTHS OF THE PANDEMIC
TABLE 3: CHANGES IN FINANCIAL WELL-BEING SCORE BY DEMOGRAPHIC FACTORS
Group
Financial Well-Being
Score (June 2019)
Financial Well-Being
Score (June 2020)
Difference 95%
Confidence Interval
Overall 51.09 52.13 1.04 0.18 to 1.91 Race/Ethnicity - - - -
Non-Hispanic White 52.29 53.41 1.12 0.29 to 1.94 Black 47.79 48.21 0.42 -2.47 to 3.31 Hispanic 47.75 48.93 1.18 -2.99 to 5.34
Other 24 50.44 51.68 1.23 -2.68 to 5.14 Household Income in 2018 - - - - $40,000 or less 44.75 46.42 1.67 0.02 to 3.31
$40,001 to $70,000 51.08 52.15 1.06 -0.22 to 2.34 $70,001 to $100,000 53.24 55.36 2.12 0.61 to 3.63 More than $100,000 58.62 58.71 0.09 -2.24 to 2.42
Geographic Group25 - - - - Metro 51.21 52.13 0.92 -0.07 to 1.91 Some urban 50.07 51.97 1.9 0.52 to 3.28 Rural 51.05 52.57 1.52 0.23 to 2.81
Gender - - - - Male 53.32 53.71 0.4 -1.01 to 1.8 Female 48.97 50.89 1.92 0.94 to 2.89
Education level in 2019 - - - - High school or less or vocational 47.8 48.49 0.7 -0.98 to 2.37 Some college 50.25 51.24 0.98 -0.86 to 2.83
College or post-graduate 54.34 56.03 1.69 0.7 to 2.69 Age Group - - - - Age <40 48.05 50.56 2.51 0.41 to 4.61
Age 40-61 48.95 49.64 0.69 -0.49 to 1.87
Age 62+ 57.38 57.31 -0.07 -1.18 to 1.04
Despite large pre-existing differences, we generally cannot confidently rule out the possibility that all demographic groups had similar changes in Financial Well-Being scores between June 2019 and June 2020. The last column of Table 3 shows a 95 percent confidence interval, a statistical calculation that indicates the degree of uncertainty of the estimate. In general, the
24 “Other” includes non-Hispanic Asian respondents, non-Hispanic American Indian or Alaska Natives, and non-Hispanic Native Hawaiian or other Pacific Islanders. We lacked sufficient sample size among these groups to break them out individually. 25 Metro and non-metro areas are based on whether the respondent’s county contains an urban area of 50,000 or more population. The definitions are based on the Department of Agriculture’s 2013 Rural-Urban Continuum Codes (RUCC) with Metro counties containing a metro area (defined as RUCC 1, 2 and 3); some urban counties containing a smaller urban area or adjacent to a metro area (defined as RUCC 4, 5, and 6); and fully rural counties lacking any substantial urban area and not adjacent to a metro area (defined as RUCC 7, 8, and 9). RUCC are discussed more here: https://www.ers.usda.gov/data-products/rural-urban-continuum-codes/.

12 CHANGES IN CONSUMER FINANCIAL STATUS DURING THE EARLY MONTHS OF THE PANDEMIC
considerable uncertainty—reflected in wide confidence intervals for our estimate of a group’s change in Financial Well-Being score—comes from our limited sample size, as larger sample sizes generally provide more precise estimates.26 In addition, differences in over-time changes in Financial Well-Being scores between demographic groups were generally not statistically significant either.27 In a regression controlling for each factor in Table 3, the only factor with a statistically significant difference between groups was age. Consumers younger than 40 years old had a significantly greater improvement than those 62 and older.28 As we discuss in Section 4, factors related to consumers’ cash flows and employment status were generally more strongly associated with overall changes in financial status than demographics.
3.2 Difficulty paying a bill or expense The proportion of people reporting difficulty paying for a bill or expense decreased from 39.9 percent to 35.8 percent, as shown in Table 4. However, frequent and recent difficulties were no less common: Neither the number of people who had more than one instance of difficulty nor the number of people who had difficulty in the past three months dropped significantly between the June 2019 and June 2020.
TABLE 4: INCIDENCE AND SEVERITY OF DIFFICULTY PAYING FOR A BILL OR EXPENSE29
Incidence/Severity June 2019
June 2020
Difference 95% Confidence
Interval
Had any difficulty paying for a bill or expense
39.9 35.9 -4.0 -7.8 to -0.3
Had more than one instance of difficulty
31.2 29.7 -1.5 -5.3 to 2.3
Had difficulty in the past three months
22.1 23.3 1.2 -2.4 to 4.8
26 For estimated changes in Financial Well-Being scores (and other quantities), confidence intervals that include zero for a given group indicate that there may have been no change for that group at all. 27 For example, looking at the estimates for Black consumers, we can say with 95 percent confidence that the true difference in Financial Well-Being score between 2019 and 2020 is somewhere in the range between -2.47 and 3.31. Since this range also includes zero, we cannot confidently say that the true difference is not zero. Additionally, since the confidence interval range for Black consumers includes the difference estimate for Non-Hispanic White consumers, we cannot say with confidence that the changes in Financial Well-Being score were different for Black and Non-Hispanic White consumers. 28 See Figures 8 and 9 in the Appendix C for regression results and Appendix C more generally for a discussion of how regressions help us understand differences between groups. 29 For all percentages in this table, the denominator is the entire population.

13 CHANGES IN CONSUMER FINANCIAL STATUS DURING THE EARLY MONTHS OF THE PANDEMIC
Table 5 shows that the reasons for reported difficulties have shifted. Table 5 is sorted by the most common reason in 2020. Medical expenses were the most common reason consumers pointed to as a cause for difficulty paying a bill or expense in both years. The frequency of reporting medical expenses decreased amid the pandemic, a possible result of delayed or forgone medical care.30 In June 2020, job loss or limited work became much more important. The Wave 2 survey added two new answer options, “Less work available because of actions to limit coronavirus” and “Could not work because your workplace was closed because of actions to limit coronavirus.” Overall, 11.1 percent of consumers experienced difficulty due to general job loss, the unavailability of work due to coronavirus, or coronavirus-related workplace closures.31 Yet even in June 2020, expenses that could have happened any year, such as auto and home repair, medical expenses, and helping family members remain among the most common reasons consumer report having difficulty.
TABLE 5: PERCENTAGE OF INDIVIDUALS WHO EXPERIENCED DIFFICULTY DUE TO COMMON EVENTS OR EXPENSES
Reason for experiencing difficulty June 2019
June 2020
Medical expenses or fees 12.3 8.3 Less work available because of actions to limit coronavirus N/A 7.1
Auto repair 8.4 6.9 Could not work because your workplace was closed because of actions to limit coronavirus
N/A 5.7
Helping children, parents, or other family members 6.4 4.8 Taxes or fees 5.0 3.6
Home repair 5.6 3.3 Other loss of income 3.8 2.9
Student loan, school, or tuition costs 4.3 2.3 Loss of income from illness 4.0 2.3
Loss of job 6.1 2.1
3.2.1 Difficulty paying for a bill or expense by demographics As with Financial Well-Being score, we observe considerable differences in the rate at which consumers experience these difficulties among different demographic groups. Table 6 examines the differences in difficulty paying a bill or expense across various demographic groups, again
30 See, for example, Edith Mitchel, “Declines in Cancer Screening During COVID-19 Pandemic”, December 2020. Available: https://www.ncbi.nlm.nih.gov/pmc/articles/PMC7738274/. 31 Respondents could select every option that applied to them. These response options were added to the second wave of the survey. In addition, the wording of this question changed slightly between Wave 1 and Wave 2 of the survey.

14 CHANGES IN CONSUMER FINANCIAL STATUS DURING THE EARLY MONTHS OF THE PANDEMIC
showing the levels in June 2019 and June 2020 as well as the difference and its 95 percent confidence interval.
TABLE 6: PERCENTAGE OF CONSUMERS WHO REPORTED HAVING HAD DIFFICULTY PAYING FOR A BILL OR EXPENSE BY DEMOGRAPHIC FACTORS
Group Had Difficulty
(June 2019) Had Difficulty (June 2020) Difference
95% Confidence Interval
Overall 39.9 35.9 -4.0 -7.8 to -0.3
Race/Ethnicity - - - -
Non-Hispanic White 36.7 29.9 -6.8 -10.8 to -2.7
Black 64.6 66.5 1.9 -10.2 to 13.9
Hispanic 38.8 43.9 5.1 -8.0 to 18.1
Other 32 29.9 27.9 -2.0 -19.8 to 15.9
Household Income in 2018 - - - -
$40,000 or less 60.0 56.9 -3.1 -9.9 to 3.8
$40,001 to $70,000 37.7 33.7 -3.9 -10.9 to 3.0
$70,001 to $100,000 32.5 2.6 -6.5 -15.7 to 2.6
More than $100,000 16.5 14.4 -2.1 -9.3 to 5.2
Geographic Group33 - - - -
Metro 39.4 36.0 -3.4 -7.7 to 0.9
Some urban 44.3 34.6 -9.7 -16.0 to -3.3
Rural 41.1 36.9 -4.1 -9.0 to 0.8
Gender - - - -
Male 34.3 29.0 -4.8 -10.4 to 0.8
Female 45.5 41.7 -3.8 -9.5 to 0.9
Education level in 2019 - - - -
High school or less or vocational
53.7 51.2 -2.5 -9.2 to 4.3
Some college 36.9 35.3 -1.6 -8.7 to 5.6
College or post-graduate 32.1 24.1 -8.0 -13.2 to -2.8
Age Group - - - -
Age <40 46.3 37.9 -8.4 -17.6 to 0.7
Age 40-61 45.4 42.5 -2.9 -8.2 to 2.3
Age 62+ 25.3 24.5 -0.8 -5.2 to 3.7
32 “Other” includes non-Hispanic Asian respondents, non-Hispanic American Indian or Alaska Natives, and non-Hispanic Native Hawaiian or other Pacific Islanders. We lacked sufficient sample size among these groups to break them out individually. 33 Metro and non-metro areas are based on whether the respondent’s county contains an urban area of 50,000 or more population. The definitions are based on the Department of Agriculture’s 2013 Rural-Urban Continuum Codes (RUCC) with Metro counties containing a metro area (defined as RUCC 1, 2 and 3); some urban counties containing a smaller urban area or adjacent to a metro area (defined as RUCC 4, 5, and 6); and fully rural counties lacking any substantial urban area and not adjacent to a metro area (defined as RUCC 7, 8, and 9). RUCC are discussed more here: https://www.ers.usda.gov/data-products/rural-urban-continuum-codes/.

15 CHANGES IN CONSUMER FINANCIAL STATUS DURING THE EARLY MONTHS OF THE PANDEMIC
In both June 2020 and June 2019, Black consumers, Hispanic consumers, women, those making under $40,000, and those with a high school degree or less (or a vocational degree) were each more likely to have experienced some difficulty, relative to Non-Hispanic White consumers, men, and those making more than $40,000.34
Yet we do not find evidence that these underlying disparities have narrowed or increased during the first several months of the pandemic. Between June 2019 and June 2020, the frequency of experiencing a difficulty declined for most groups. When we include all groups together in a regression, we cannot reject that all groups had similar declines, except for consumers age 62 and older. These consumers were still less likely to have difficulty, but their likelihood declined less than for younger consumers (see Figure 9 in Appendix C). Given the size of the survey and the similarities across groups, while most groups had an average decline in the frequency of experiencing a difficulty, the confidence interval for most groups includes no change in the frequency. The frequency increased slightly for Black and Hispanic consumers, but the confidence interval for both groups includes a decline as well as an increase.35
3.3 Credit scores Amid the adverse economic conditions of the early pandemic, average credit scores increased between June 2019 and June 2020, from an average of 699 to an average of 710. Figure 1 shows the trend in average credit scores in the CCP from June 2018 to June 2020 with values indexed to June 2019 to match Wave 1. Credit scores increased steeply during the pandemic relative to the same period one year before.36
34 Differences between Black and Non-Hispanic White consumers and between those making less than $40,000 and those making more persist even after controlling for other demographic factors in both years in a common regression. Differences between those with less than some collegiate education and others only persist after adding these controls in May 2020 but not in 2019. 35 This result is similar to what we observe for changes in Financial Well-Being score in Section 3.1.1. We discuss the limitations of our sample size in more detail in that section. 36 Many of the measures designed to address the pandemic took effect in mid-March, so the month of March may capture the beginning of this trend.

16 CHANGES IN CONSUMER FINANCIAL STATUS DURING THE EARLY MONTHS OF THE PANDEMIC
FIGURE 1: CHANGE IN AVERAGE CREDIT SCORE (VALUES INDEXED TO JUNE 2019)
Although this trend may seem counterintuitive, the components of a credit score provide some explanation. Both credit card utilization and delinquencies play an important role in credit score calculations.37 Figure 2 shows that over the same time period, average credit card utilization declined by 2.4 percentage points (down to 26.7 percent from 29.1 percent) and the share with at least one delinquency on their credit report decreased by 2.2 percentage points (down to 22.2 percent from 24.4 percent). Credit scores may also have improved because consumers who might otherwise have had delinquencies instead entered some sort of forbearance or assistance.
37 Credit card utilization is the share of available credit on all of a consumer’s credit cards, calculated by dividing the total amount of credit card debt currently held by the consumer by the total amount of credit available to the consumer.

17 CHANGES IN CONSUMER FINANCIAL STATUS DURING THE EARLY MONTHS OF THE PANDEMIC
FIGURE 2: CHANGE IN UTILIZATION AND DELINQUENCY (VALUES INDEXED TO JUNE 2019)
Credit card utilization is closely tied to consumer spending, which declined substantially during the pandemic. Figure 2 shows that the declines in utilization during the pandemic were larger than the usual fluctuations over the course of a normal year.38 Figure 2 also shows that the declines in delinquencies were steepest between March and April 2020.
38 Credit card utilization varies significantly over the course of the year, often in predictable seasonal patterns. For example, credit card debt increases during the holiday season, then gets paid down in the beginning of the new year. See Leonel Drukker and Scott Nelson, “Aggregate credit card borrowing exhibits end-of-year seasonal patterns which vary across different sets of consumers”, June 2018. Available: https://www.consumerfinance.gov/about-us/blog/aggregate-credit-card-borrowing-exhibits-end-year-seasonal-patterns-which-vary-across-different-sets-consumers/.

18 CHANGES IN CONSUMER FINANCIAL STATUS DURING THE EARLY MONTHS OF THE PANDEMIC
FIGURE 3: SHARE WITH ONE OR MORE NON-STUDENT LOAN TRADELINE IN FORBEARANCE
Delinquencies likely fell because many consumers have entered some sort of forbearance program rather than going delinquent. Prior to the pandemic, about three percent of consumers in the survey had a non-student loan tradeline in forbearance. We focus on non-student loan forbearances because all federally held student loans, which account for more than 80 percent of the market, had principal and interest payments suspended in March 2020 by default. In May 2020, as Figure 3 shows, the share of consumers with at least one tradeline in forbearance increased to eight percent. This jump is largely due to the CARES Act.39 Among other provisions, the CARES Act allowed mortgage borrowers whose loans are backed by the federal government to request forbearance.
3.3.1 Credit score changes by demographics The average increase in credit scores holds true across demographic groups. The ability to observe race, ethnicity, and other demographic characteristics from the survey allows us to examine how credit score varies by these characteristics, which are not directly measured in the CCP (except for age and rural status). Although there are significant differences in levels across groups, almost all groups experienced increases in average credit score between June 2019 and June 2020, with much of the increase concentrated in the first few months of the pandemic.
39 See Sandler and Ricks, “The Early effects” for a discussion. They define an account with “assistance” as “an account being reported with zero scheduled payment due despite a positive balance.” Our definition of forbearance at the consumer level is consumers who are receiving this type of “assistance” on any account.

19 CHANGES IN CONSUMER FINANCIAL STATUS DURING THE EARLY MONTHS OF THE PANDEMIC
The figures below show the trends in credit score by race and ethnicity, gender, and age group. Other groupings, including by education, income, and rural status, had similar increases. In most cases, we cannot reject that the increase in credit score was the same for each group as it was in Figure 1. When we include all groups together in a regression (Figure 10 in Appendix C), the only significant differences among groups are that women had a larger increase than men and consumers 62 and older had a smaller increase than those under age 40.
FIGURE 4: AVERAGE CREDIT SCORE CHANGE SINCE JUNE 2019 BY RACE AND ETHNICITY40
Figure 4 shows that increases in credit scores among Black and Hispanic consumers are important for the overall increase in credit scores, although the changes in credit score across racial and ethnic groups between June 2019 and June 2020 were not statistically significantly different. An important factor in understanding these differences across racial and ethnic groups is that the average credit scores among Non-Hispanic White consumers prior to the pandemic were about 100 points above those of Black consumers and about 60 points above those of Hispanic consumers.
Additionally, Black and Hispanic consumers experienced the largest declines in delinquencies (not shown). The declines were concentrated around April 2020, when most stimulus payments were distributed. Previous Bureau research has found that consumers in majority-Black and majority-Hispanic areas were more likely to receive accommodations from lenders, which may
40 “Other” includes non-Hispanic Asian respondents, non-Hispanic American Indian or Alaska Natives, and non-Hispanic Native Hawaiian or other Pacific Islanders. We lacked sufficient sample size among these groups to break them out individually.

20 CHANGES IN CONSUMER FINANCIAL STATUS DURING THE EARLY MONTHS OF THE PANDEMIC
contribute to the decrease in delinquency among these groups.41 However, both Black and Hispanic consumers had much higher levels of delinquency over the entire time period, and delinquencies among both groups ticked back upward in June.
FIGURE 5: AVERAGE CREDIT SCORE CHANGE SINCE JUNE 2019 BY GENDER
Credit scores among women increased more than those among men since June 2019. These differences are statistically significant even when controlling for other characteristics (see Figure 10 in Appendix C). As with the racial differences, the group with lower average credit scores experienced larger increases. Average credit scores among women consumers were 30 points lower than that of males in June 2019 at 684. Both men and women experienced decreases in delinquencies and credit card utilization (not shown), though women experienced larger declines in both. The decrease in utilization among women appears to be a principal driver of their improvement relative to men: Between June 2019 and June 2020, women’s credit card utilization declined from 31.6 percent to 25.9 percent, while men’s moved from 25.6 percent to 24.2 percent.42
41 Sandler and Ricks, “The Early Effects.” 42 The difference in the size of the decrease in utilization between men and women was statistically significant at the five percent level. The difference in utilization was calculated only among those who had a credit card limit greater than zero in both June 2019 and June 2020.

21 CHANGES IN CONSUMER FINANCIAL STATUS DURING THE EARLY MONTHS OF THE PANDEMIC
FIGURE 6: AVERAGE CREDIT SCORE CHANGE SINCE JUNE 2019 BY AGE
Figure 6 shows that the credit scores of consumers younger than 40 improved more than the credit scores of older consumers during the pandemic. The difference between consumers younger than 40 and 62 and older is significant even when we control for other characteristics (see Figure 10 in Appendix C). The group with lower scores again experienced the largest increases. As of June 2019, the average credit score among those 62 and older was 67 points higher than that of those younger than 40.

22 CHANGES IN CONSUMER FINANCIAL STATUS DURING THE EARLY MONTHS OF THE PANDEMIC
FIGURE 7: AVERAGE CREDIT SCORE CHANGE SINCE JUNE 2019 BY ANNUAL HOUSEHOLD INCOME IN 2018
All income groups experienced an increase in credit scores following the onset of the pandemic, a stark contrast to the trends seen in the previous year. Those in the lowest income groups experienced the largest increase in average credit score between June 2019 and June 2020, although these differences are not significant. As with the previous breakdowns above, the lowest income group also had the lowest credit scores throughout the year.

23 CHANGES IN CONSUMER FINANCIAL STATUS DURING THE EARLY MONTHS OF THE PANDEMIC
4. Consumers whose finances have worsened
Despite general improvements in consumers’ average financial status, many consumers were worse off in June 2020 than in June 2019. Forty-one percent of consumers saw a decline in their Financial Well-Being scores, while 34 percent experienced a dip in credit scores. Ten percent of all consumers had difficulty paying for a bill or expense between May 2019 and May 2020 when they had not experienced any difficulty the year before.43
Individual consumers’ financial conditions change from year to year, sometimes improving and sometimes deteriorating, so we would expect some consumers’ financial status to decline after a year, even without a pandemic. Fewer consumers saw a reduction in financial status in between June 2019 and June 2020 than in previous years, although direct comparisons are not always possible. Between 2016 and 2019, the fraction of consumers facing a year-over-year decline in credit scores ranged from 39 percent to 55 percent. One estimate suggests that the median change in Financial Well-Being scores for the same consumer between May 2018 and May 2019 was zero and the Financial Well-Being score increased for approximately the same proportion of consumers as it decreased.44
In June 2020, some consumers pointed to pandemic issues causing financial difficulty, but many also pointed to issues, such as auto repair, that could happen in any year. In this section, we discuss the factors associated with lower Financial Well-Being score, credit score, and greater difficulty paying a bill or expense.
4.1 Demographic characteristics of those worse off in June 2020
Table 7 shows the percentage of consumers with a decline in the three measures of financial status between June 2019 and June 2020 by racial and ethnic group, income, gender, education,
43 The consumers newly in difficulty represent approximately 16 percent of consumers who did not report any difficulty in June 2019 and over a quarter (27 percent) of all of those who reported difficulty in June 2020. 44 Burke and Perez-Arce, “Longitudinal Changes in Financial Well-Being.”

24 CHANGES IN CONSUMER FINANCIAL STATUS DURING THE EARLY MONTHS OF THE PANDEMIC
and geography.45 Consumers whose financial status declined during a period when the average financial status improved are doing notably worse than average.
For credit scores and Financial Well-Being scores, the financial status of a similar percentage of consumers in most demographic groups worsened. With very few exceptions, about 40 percent of each demographic group experienced a decline in Financial Well-Being score, and about 35 percent experienced a decline in their credit scores.
However, Non-Hispanic White consumers were less likely than Black consumers to have had difficulty paying for a bill or expense in June 2020 despite having no difficulty as of June 2019.46 Incidence of these difficulties were also lower among consumers making over $100,000, those with at least a college education, and consumers in areas outside of areas considered neither fully metropolitan nor fully rural.
45 We consider any consumer who did not have difficulty in 2019 but did have difficulty in 2020 to have a reduction in financial status by the “Had difficulty paying for a bill or expense” metric in 2020. 46 Differences between Non-Hispanic White consumers and other racial/ethnic groups were not statistically significant.

25 CHANGES IN CONSUMER FINANCIAL STATUS DURING THE EARLY MONTHS OF THE PANDEMIC
TABLE 7: PERCENTAGE WITH DECLINING FINANCIAL STATUS BETWEEN JUNE 2019 AND JUNE 2020 BY DEMOGRAPHICS
Group Percent with Decline in
Financial Well-Being Score
Percent with Decline in Credit
Score
Percent with difficulty as of June 2020 but not
June 2019 Overall 41.5 34.0 9.8
Race/Ethnicity - - -
Non-Hispanic White 41.4 34.4 7.4
Black 44.1 32.8 14.5
Hispanic 34.9 34.6 16.3
Other 47 46.8 32.4 14.8
Household Income in 2018
- - -
$40,000 or less 39.8 33.3 12.0
$40,001 to $70,000 41.9 35.4 9.1
$70,001 to $100,000 32.6 37.4 10.2
More than $100,000 46.1 29.2 7.0
Gender - - -
Male 41.3 36.8 9.3
Female 40.9 31.8 9.5 Education level in 2019
- - -
High school or less or i l
43.4 37.0 11.5
Some college 41.6 32.4 11.2 College or post-
d 38.6 33.9 6.3
Geographic Group - - -
Metro 41.8 34.0 10.3
Some urban 40.0 32.8 6.4
Rural 39.9 38.4 8.5
Age Group - - -
Age <40 35.1 27.4 9.3
Age 40-61 44.0 35.5 10.7
Age 62+ 45.1 39.3 9.2
4.2 Job loss, cash flows, and forbearance Consumers who were unemployed as of June 2020 but employed as of June 2019 were much more likely to experience a decline in Financial Well-Being score and to have difficulty paying a bill or expense when they had not had difficulty the year before (Table 8). We label survey
47 “Other” includes non-Hispanic Asian respondents, non-Hispanic American Indian or Alaska Natives, and non-Hispanic Native Hawaiian or other Pacific Islanders. We lacked sufficient sample size among these groups to break them out individually.

26 CHANGES IN CONSUMER FINANCIAL STATUS DURING THE EARLY MONTHS OF THE PANDEMIC
respondents as having become unemployed if they were full-time employees, part-time employees, or self-employed in June 2019 and they were unemployed, temporarily laid off for reasons related to COVID-19, or temporarily laid off for other reasons in June 2020. Among those who became unemployed, over one-fifth had newly experienced difficulty paying for a bill or expense. This share with difficulty is close to three times greater than the share (8.4 percent) of those who were employed at the time of both surveys. Individuals who became unemployed were also 10.5 percentage points more likely to have lower Financial Well-Being scores in June 2020 than in June 2019 than those whose employment status was similar or improved between the two time periods.48
TABLE 8: PERCENTAGE WITH DECLINING FINANCIAL STATUS BY JOB LOSS, CASH FLOWS, AND FORBEARANCE BETWEEN 2019 AND 2020
Job Loss/Cash Flows/Forbearance Financial Well-
Being score declined
Credit score
declined
Had a difficulty in 2020 but not in 2019
Overall 41.5 34.0 9.8 Change in employment status - - - Individual did not become unemployed between June 2019 and June 2020
40.5 34.2 8.4
Individual became unemployed between June 2019 and June 2020 49
51.0 32.2 23.3
Change in income - - - Income went up 35.4 29.7 9.0 Income stayed the same 40.8 34.5 8.4 Income went down 53.4 39.5 15.8 Change in savings - - - Savings went up 31.1 29.0 3.3 Savings stayed about the same 42.8 33.1 9.7 Savings went down 51.5 41.5 17.1 Change in expenses - - - Expenses went up 46.3 38.9 13.3 Expenses stayed about the same 37.1 30.0 6.4 Expenses went down 39.1 28.3 11.6 Receipt of forbearance - - - Individual did not receive forbearance on a non-student tradeline during the pandemic.
42.8 33.7 9.4
Individual received forbearance on a non-student tradeline during the pandemic.
28.4 37.7 14.6
48 This group includes anyone who does not meet our definition of “becoming unemployed” between June 2019 and June 2020. For example, an individual who was employed part-time in 2019 and employed full-time in 2020 would fall into this group, as would an individual who was unemployed in 2019 and self-employed in 2020. Individuals who were retired in both years would also be included in this group, as would individuals who were unemployed in 2019 and laid off for reasons related to coronavirus in 2020. 49 Survey respondents were labeled as having become newly unemployed if they were full-time employees, part-time employees, or self-employed in June 2019 and they were unemployed, temporarily laid off for reasons related to COVID-19, or temporarily laid off for other reasons in June 2020.

27 CHANGES IN CONSUMER FINANCIAL STATUS DURING THE EARLY MONTHS OF THE PANDEMIC
Consumers who became unemployed were no more likely than their counterparts to have a decline in credit score, despite the correlation between job loss and the two survey-based measures. This disconnect may have occurred for several reasons: (1) Individuals who lost their jobs may also have reduced their expenses so that the aspects of their finances that affect their credit scores (such as utilization and delinquency) did not worsen more, on average, than other consumers; (2) As a result of forbearance or other assistance from lenders, financial difficulties that might have led to more prevalent score declines among those who were unemployed in June 2020 may not be reflected in credit report data; (3) Additional financial support, such as extended unemployment and Economic Impact Payments, may have allowed unemployed consumers to avoid many negative financial consequences; and (4) Many of those who were laid off as of June 2020 could have lost their jobs too recently for the impact of the job loss to have impacted their credit.
Individuals who received forbearance were less likely to have a decline in Financial Well-Being score, equally likely to have a decline in credit score, and more likely to have had difficulties in the 12 months before June 2020 but not in the year leading up to June 2019. These relationships with financial status hold even after controlling for demographics as well as changes in unemployment, income, savings, and expenses.50 This evidence is consistent with use of forbearance policies by those newly having difficulty, which in turn helped prevent declines in Financial Well-being scores. For accommodations (including forbearance) provided pursuant to the CARES Act, the Act provides protections so that consumers receiving accommodations do not have their credit negatively impacted.
A reduction in a consumer’s cash flow or savings, meanwhile, is closely related to decline in financial status by all three measures. Consumers whose incomes decreased between June 2019 and June 2020 were 18 percentage points more likely to have a decline in Financial Well-Being score than consumers whose incomes increased, 10 percentage points more likely to have a decline in credit scores, and six percentage points more likely to have a newfound difficulty paying for bills or expenses. The differences in financial status by savings were even more pronounced: compared to consumers whose savings increased, consumers whose savings decreased were 20.4 percentage points more likely to have a dip in Financial Well-Being score, 12.5 percentage points more likely to have a decline in credit score, and 14 percentage points more likely to have a newfound difficulty paying for bills or expenses.
Consumers whose expenses went up were more likely to have a decline in financial status by all three measures than consumers whose expenses stayed the same. However, consumers whose expenses decreased were more likely to have a decline in Financial Well-Being score and have newfound difficulty paying a bill or expense, although they were slightly less likely to have a
50 See Appendix C: Figure 11.

28 CHANGES IN CONSUMER FINANCIAL STATUS DURING THE EARLY MONTHS OF THE PANDEMIC
decline in credit score. Increases in expenses may be related to both positive and negative events in consumers’ lives. An individual whose income increases may increase their spending to match. Likewise, decreases in expenses may indicate a positive change, which leaves the household with more available cash (such as making the last payment on a mortgage), or a negative event that forced the consumer to cut back on expenses.
Notably, many of the relationships between these cash flow variables and worsening financial situations hold even after controlling for demographics, employment status, and forbearance in a common regression.51 Reductions in both income and savings are still significantly associated with dips in Financial Well-Being scores. Increases in expenses, meanwhile, remain associated with drops in credit scores, and reductions in savings remain associated with newfound difficulties.
The CARES Act, with its expanded unemployment and economic impact payments, meant that, for a brief time, unemployment did not lead to a reduction in income for many consumers. However, many consumers did still face significant shocks to their cash flows, which are closely related to declines in financial status. These relationships suggest that understanding of consumers’ cash flows is particularly important for understanding their financial status during the pandemic.
51 See Appendix C, Figure 11.

29 CHANGES IN CONSUMER FINANCIAL STATUS DURING THE EARLY MONTHS OF THE PANDEMIC
5. Conclusion Through the first several months of the pandemic, consumers’ financial status improved, on average, along several dimensions. These improvements were widespread among many different types of consumers, although consumers under age 40 experienced the biggest gains. The survey’s statistical confidence intervals do not allow us to reject declines for many consumer subgroups.
Not all consumers’ financial status improved during the pandemic. Consumers who became unemployed since June 2019 were much more likely to have experienced a decline in Financial Well-Being score and experienced new difficulties paying for bills or expenses. Yet credit scores for consumers who became unemployed did not decline. Forbearance appears to have helped some unemployed consumers avoid having unemployment lead to delinquency on loans reported to credit bureaus. Consumers who had declines in income and savings were much more likely to have experienced a decline in Financial Well-Being score, to have newly experienced difficulty paying a bill, and to have declines in credit scores. Additional weekly $600 unemployment benefits under the CARES Act—which expired on July 31, 2020—and Economic Impact Payments—mostly deposited in April 2020—channeled a large amount of cash support to many consumers. Without these and later cash infusions, many more consumers might have had financial difficulty.

30 CHANGES IN CONSUMER FINANCIAL STATUS DURING THE EARLY MONTHS OF THE PANDEMIC
APPENDIX A: SAMPLING AND WEIGHTING The survey consists of two waves. Wave 1 was conducted starting in May 2019 and Wave 2 starting in May 2020. The sample for Wave 1 of the survey was selected from the Bureau’s Consumer Credit Panel (CCP), a 1-in-48 random and deidentified sample of credit records maintained by one of the three nationwide credit reporting agencies (NCRAs).
Wave 1 was mailed to 15,000 consumers starting on May 22, 2019. Ultimately, 2,990 consumers responded for a response rate of approximately 20 percent. Wave 2 was mailed to all consumers who responded to Wave 1, plus a small additional sample of consumers who had not responded to Wave 1, starting on May 7, 2020. These additional consumers who did not respond to Wave 1 are not part of the analysis for this report, yielding a final analysis sample size of 1,742 for this report (about 58 percent of Wave 1 respondents).
For both waves of the survey, the NCRA associated the survey responses to CCP information through a process that preserved the confidentiality of consumers in the survey sample, survey responses, and credit record information. The Bureau selected the survey sample and informed the NCRA which anonymized credit records were selected. The NCRA mailed the surveys using its database of addresses. Survey responses were collected by the NCRA’s subcontractor, who removed any direct personally identifying information and other potentially identifying information that respondents may have inadvertently included before returning the results to the Bureau. The Wave 1 report contains additional details on the survey development process and survey protocol.52
The primary focus of the surveys is on consumers who may have recently had financial difficulty, so the sample for Wave 1 disproportionately included records in the lowest quartile of credit scores and with a recent delinquency. The Bureau also devoted one third of the sample to consumers living in rural areas or on Native American trusts, tribal lands, or reservations.
All analysis in this report uses weights for the combined Wave 1 and Wave 2 (“combined weights”) to be representative of the CCP and thus, roughly representative of adults in the U.S. with a credit record. Combined weights adjust for non-response from Wave 1 using Wave 1 weights as a basis. Wave 1 weights combine selection weights (to account for the fact that certain sets of credit records were sampled at higher rates than others) and nonresponse adjustment weights (to account for systematic differences in response rates). The report on Wave 1 contains additional details on Wave 1 weighting. The combined weights adjust for non-response from Wave 1 by modelling responses based on: (1) the criteria used to sample in Wave 1 including delinquency and credit score; (2) responses to questions on gender, difficulty paying a bill or
52 Fulford and Rush, “Insights from the Making Ends Meet Survey.”

31 CHANGES IN CONSUMER FINANCIAL STATUS DURING THE EARLY MONTHS OF THE PANDEMIC
expense, having a partner in the household, income, and the amount a household has in checking and savings; (3) changes in delinquency and credit score between June 2019 and June 2020. 53
The last weighting step takes advantage of the association to the CCP by weighting not just on financial status in June 2019, but on changes in financial status. This step would not be possible without associated administrative data. For example, this step might matter if consumers who had a new delinquency were less likely to respond. Weighting only using step (1) and (2) would tend to underrepresent consumers who had trouble between survey waves, an important focus of the surveys.
53 As in Wave 1, the Bureau also employed a weight smoothing method to reduce the influence of very large weights. Excessive weight variation can lead to instability of estimates and large estimate variances because some individual records receive far more weight than others. The Bureau employed a weight smoothing method to average weights within quintiles of adjustment cells. See Fulford and Rush (2020) for details.

32 CHANGES IN CONSUMER FINANCIAL STATUS DURING THE EARLY MONTHS OF THE PANDEMIC
APPENDIX B: COMPARISON TO OTHER SURVEYS To understand the accuracy of the collection protocol and weighting process for the combined Wave 1 and Wave 2 survey, this section compares the weighted Making Ends Meet (MEM) estimates from Wave 2 to previously reported Wave 1 estimates as well as publicly reported estimates from similar questions from other surveys. As discussed in the section on weighting, an important distinction between the MEM survey and other surveys is the CCP sample frame. The MEM survey is weighted to be representative of the CCP which does not include people without a credit record. The results from the MEM survey may differ based on the sample population as well as differences in the underlying questions.
Table 9 and Table 10 show demographic comparisons between the two waves of the Making Ends Meet (MEM) survey and the 2018 and 2019 American Community Survey (ACS), as well as Census population estimates. The table displays the question and answer options from the Making Ends Meet survey, along with the weighted percentage of respondents selecting each answer, and the comparable statistic from the ACS. Demographic questions were only asked in Wave 1, not Wave 2. The MEM Wave 2 column in each table reflects the answers selected in Wave 1 of those who also responded to Wave 2. This comparison allows us to see any potential changes in respondent demographics between Waves 1 and 2 after weighting for non-response. For several questions, the categories for MEM and the ACS are not identical, so this comparison provides general insight into comparability, rather than an exact benchmark.
Overall, MEM estimates are comparable between survey waves and remains comparable to the ACS across levels of age, education, race, and income. The largest differences occur when ACS categories and MEM categories do not precisely align or when the population under consideration differs. MEM is sampled from the CCP and is weighted to be representative of the CCP, while the ACS is designed and weighted to match the population estimates from the Census Bureau population estimates program.54
The gender balance is almost identical across years and between the two surveys.55 This close relationship occurs because the weighting process for Wave 1 included a calibration step to adjust for gender-imbalanced response patterns to match the ACS and the combined weights model non-response between waves based including gender in Wave 1.
The MEM population in Wave 2 remained slightly older than the ACS population, although some of the individual age-range discrepancies are due to differences in categorization.
54 See: p. 135 in United States Census Bureau, “American Community Survey Design and Methodology,” January 2014. Available: https://www2.census.gov/programs-surveys/acs/methodology/design_and_methodology/acs_design_methodology_report_2014.pdf. 55 The gender balance reported by the ACS did not change between 2018 and 2019.

33 CHANGES IN CONSUMER FINANCIAL STATUS DURING THE EARLY MONTHS OF THE PANDEMIC
Compared to Wave 1, the age distribution in Wave 2 was slightly more concentrated among middle ages, from 25-54.
The MEM sample continued to be more highly educated than the ACS. Three percent of the weighted MEM Wave 2 sample has less than a high school degree, compared to 12 percent in the ACS. The Wave 2 MEM sample is slightly more educated than the Wave 1 sample, although differences between waves are generally one percentage point or less. The differences relative to the ACS are much larger. Also, the ACS educational attainment measures only represent those aged 25 or older, which could account for some of the differences.
The Wave 2 sample displays almost the same racial and ethnic breakdown as Wave 1, with a slight decrease in the “Other” group. Therefore, the Wave 2 sample continues to match the Census population estimates from 2010 closely on race and ethnicity. We use the Census population estimates because they allow a similar characterization by race and ethnicity for the adult population. Following a similar approach used by the FDIC unbanked/underbanked study56 and others, the MEM racial and ethnic categorization is exclusive so that analysis can cleanly compare groups. The categorization is: if a respondent self-identifies as “Black or African American,” she is included in the Black or African American category regardless of other responses. If the respondent self-identifies as “Hispanic,” she is included in the Hispanic category unless she self-identifies as Black or African American. The “Non-Hispanic White” group includes respondents who only selected the White category. “Asian” includes respondents who selected Asian, but not Black or Hispanic. “Other” include respondents who did not answer the question and Native American and Pacific Islanders. We follow the same construction using the national population estimates, grouping more than one race with “Other.”
56 Federal Deposit Insurance Corporation, “FDIC National Survey of Unbanked and Underbanked Households,” 2017: 73. Available: https://www.fdic.gov/analysis/household-survey/2017/2017report.pdf.

34 CHANGES IN CONSUMER FINANCIAL STATUS DURING THE EARLY MONTHS OF THE PANDEMIC
TABLE 9: DEMOGRAPHIC COMPARISONS BETWEEN MAKING ENDS MEET AND THE AMERICAN COMMUNITY SURVEY (PERCENT)
Question MEM W1 MEM W2 ACS 201857
ACS 201958
What is your gender? - - - -
Male 50.7 49.1 49.2 49.2
Female 49.3 50.9 50.8 50.8
How old are you? - - - -
Less than 25 years (18-24) 6.6 5.5 9.3 9.1
25-34 years 15.7 16.5 18.5 18.6
35-44 years 17.3 18.5 16.9 16.9
45-54 years 17.9 18.7 17.7 17.3
55-61 years 12.9 12.9 17.2 17.2
62 years or older 29.7 27.9 20.5 20.9 What is your highest level of education? - - - -
Less than a high school degree 3.9 2.9 12.6 12.0
High school degree 19.1 19.4 27.3 27.0
Technical or vocational degree 7.0 7.9 - -
Some college, but no degree 21.4 22.2 20.8 20.4
Two-year college degree 8.7 8.9 8.3 8.5
Four-year college degree 23.6 22.3 19.1 19.8
Postgraduate degree (for example, MA, PhD, JD, MBA, MD) 16.3 16.5 11.8 12.4
Percent high school graduate or higher 96.1 97.1 87.3 88.0
Percent bachelor's degree or higher 39.9 38.7 30.9 32.1
Race and ethnicity - - - -
Non-Hispanic White 68.3 68.6 67.5 67.5
Black 12.1 12.8 12.2 12.2
Hispanic 10.3 10.6 12.5 12.5
Asian 4.7 4.5 5.0 5.0
Other 59 4.6 3.6 2.8 2.8
Income distribution is another important dimension for comparison. Since household income was not asked in Wave 2, the Wave 2 income distribution in the table below displays the answers provided during Wave 1 from those who also responded to Wave 2. The table shows that the
57 ACS Demographic and Housing Estimates, American Community Survey 2018 5-Year Estimates Data Profiles. Available: https://data.census.gov/cedsci/table?q=United%20States&tid=ACSDP5Y2018.DP05. 58 ACS Demographic and Housing Estimates, American Community Survey 2019 5-Year Estimates Data Profiles. Available: https://data.census.gov/cedsci/table?q=United%20States&tid=ACSDP5Y2019.DP05. 59 In this table, “other” includes non-Hispanic American Indian or Alaska Natives, and non-Hispanic Native Hawaiian or other Pacific Islanders. We lacked sufficient sample size among these groups to break them out individually.

35 CHANGES IN CONSUMER FINANCIAL STATUS DURING THE EARLY MONTHS OF THE PANDEMIC
income distribution of those responding to both waves of the survey is very close to the original distribution in Wave 1. For comparison, Table 10 shows the closest comparable ACS income distribution, although direct comparisons of income are not possible for all categories. Table 10 shows that even when the comparison groups are not identical, both the ACS and MEM estimates follow a comparable income distribution although there are important differences which are discussed in the Wave 1 report.
TABLE 10: INCOME DISTRIBUTION COMPARISON OF MEM AND ACS
Annual Household Income in 2018
MEM W1 (percent)
MEM W2 (percent)
Income and Benefits (in 2018 inflation-adjusted dollars)60
ACS (percent)
$15,000 or less 10.3 9.2 $14,999 or less 11.9
$15,001 to $20,000 7.6 7.2 $15,000 to $24,999 9.3
$20,001 to $40,000 19.2 18.4 $25,000 to $34,999 9.3
$40,001 to $70,000 24.5 24.8 $35,000 to $49,999 12.6
N/A - - $50,000 to $74,999 17.5
$70,001 to $100,000 17.3 17.7 $75,000 to $99,999 12.5
More than $100,000 21.1 22.7 $100,000 or more 27.9
Several topics and questions in the Making Ends Meet survey have been studied in previous surveys, such as the FDIC survey of Unbanked and Underbanked Households (FDIC) 61 in 2017, the Federal Reserve Board’s Survey of Consumer Finance62 (SCF) in 2017, the Pew Survey of American Family Finances63 (Pew) in 2015, and the Federal Reserve Board Survey of Household Economics and Decision-making64 (SHED) in 2018. Table 11 presents the weighted responses to a selection of directly comparable questions from the MEM survey to results found in the public reports of these other surveys. The MEM W2 column displays the share of those who responded to Wave 2 that selected each option in Wave 1, therefore comparing the same question across
60 Census Bureau, 2019, “Selected Economic Characteristics, American Community Survey 2018 5-Year estimates Data Profiles.” Available: https://data.census.gov/cedsci/table?q=United%20States&tid=ACSDP5Y2018.DP03&g=0100000US&vintage=2018&hidePreview=true&moe=false&y=2018&d=ACS%205-Year%20Estimates%20Data%20Profiles. 61 Federal Deposit Insurance Corporation, “FDIC National Survey.” 62 Board of Governors of the Federal Reserve System, “Changes in U.S. Family Finances from 2013 to 2016: Evidence from the Survey of Consumer Finances,”2017. Available: https://www.federalreserve.gov/publications/files/scf17.pdf. 63 Pew Charitable Trusts, Survey of American Family Finances, “Top-lines accompanying “Americans’ Financial Security: Perception and reality,” 2015. Available: https://www.pewtrusts.org/~/media/assets/2015/03/fsm-poll-results-toplines_artfinal_v3.pdf. The proportions are the sum across each row of the results reported in item 7 In addition, see: Pew Charitable Trusts, “The Role of Emergency Savings in Family Financial Security: How Do Families Cope With: Financial Shocks?”2015. Available: https://www.pewtrusts.org/~/media/assets/2015/10/emergency-savings-report-1_artfinal.pdf. 64 “Report on the Economic Well-Being of U.S. Households in 2018,”, Board of Governors of the Federal Reserve System, 2019. Available: https://www.federalreserve.gov/publications/files/2018-report-economic-well-being-us-households-201905.pdf.
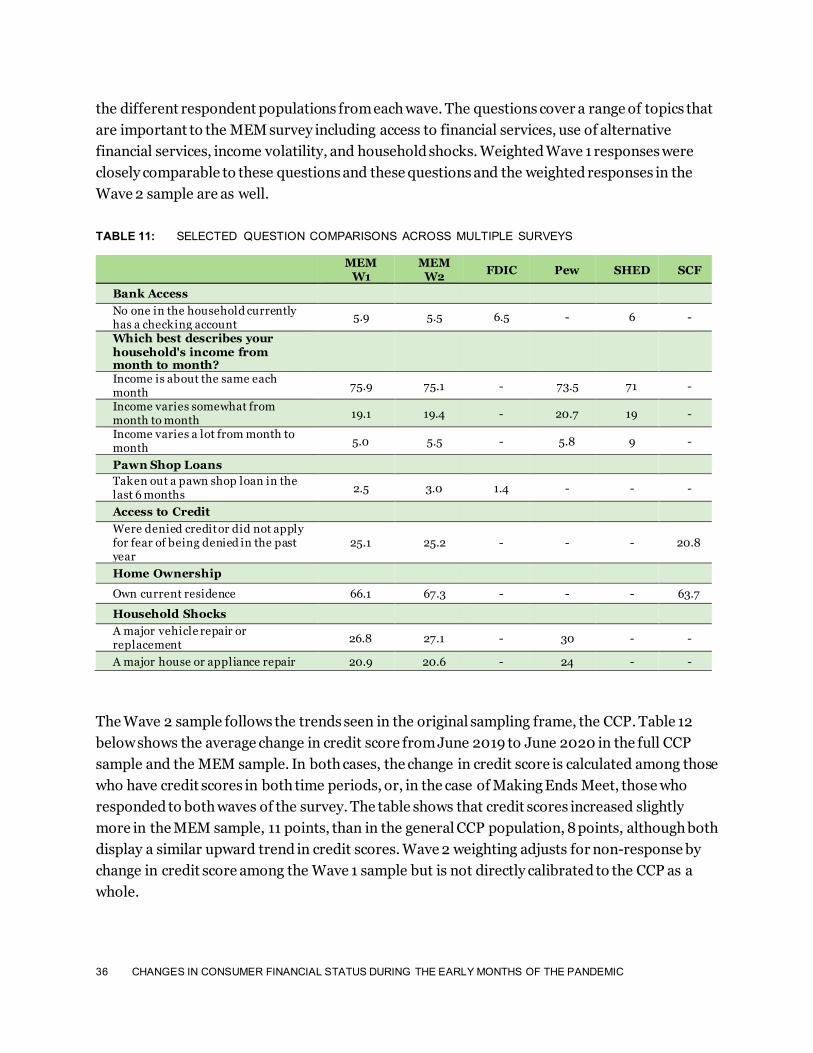
36 CHANGES IN CONSUMER FINANCIAL STATUS DURING THE EARLY MONTHS OF THE PANDEMIC
the different respondent populations from each wave. The questions cover a range of topics that are important to the MEM survey including access to financial services, use of alternative financial services, income volatility, and household shocks. Weighted Wave 1 responses were closely comparable to these questions and these questions and the weighted responses in the Wave 2 sample are as well.
TABLE 11: SELECTED QUESTION COMPARISONS ACROSS MULTIPLE SURVEYS
- MEM W1
MEM W2 FDIC Pew SHED SCF
Bank Access - - - - - - No one in the household currently has a checking account
5.9 5.5 6.5 - 6 -
Which best describes your household's income from month to month?
- - - - - -
Income is about the same each month 75.9 75.1 - 73.5 71 -
Income varies somewhat from month to month 19.1 19.4 - 20.7 19 -
Income varies a lot from month to month 5.0 5.5 - 5.8 9 -
Pawn Shop Loans - - - - - - Taken out a pawn shop loan in the last 6 months 2.5 3.0 1.4 - - -
Access to Credit - - - - - - Were denied credit or did not apply for fear of being denied in the past year
25.1 25.2 - - - 20.8
Home Ownership - - - - - -
Own current residence 66.1 67.3 - - - 63.7
Household Shocks - - - - - - A major vehicle repair or replacement 26.8 27.1 - 30 - -
A major house or appliance repair 20.9 20.6 - 24 - -
The Wave 2 sample follows the trends seen in the original sampling frame, the CCP. Table 12 below shows the average change in credit score from June 2019 to June 2020 in the full CCP sample and the MEM sample. In both cases, the change in credit score is calculated among those who have credit scores in both time periods, or, in the case of Making Ends Meet, those who responded to both waves of the survey. The table shows that credit scores increased slightly more in the MEM sample, 11 points, than in the general CCP population, 8 points, although both display a similar upward trend in credit scores. Wave 2 weighting adjusts for non-response by change in credit score among the Wave 1 sample but is not directly calibrated to the CCP as a whole.

37 CHANGES IN CONSUMER FINANCIAL STATUS DURING THE EARLY MONTHS OF THE PANDEMIC
TABLE 12: AVERAGE CHANGE IN CREDIT SCORE ACROSS SAMPLES
Sample Average Change in Credit
Score (in points)
CCP 8
MEM W2 11

38 CHANGES IN CONSUMER FINANCIAL STATUS DURING THE EARLY MONTHS OF THE PANDEMIC
APPENDIX C: REGRESSIONS Each figure in this appendix presents the results of the regression analyses we use to understand differences between groups in Financial-Wellbeing, credit scores, and difficulty paying for a bill or expense or the over-time change in these quantities. Characteristics are often closely correlated to each other. For example, income typically increases with age. Regression analysis allows us to control for relationships like these and uncover which characteristics are most associated with differences in financial status. All of the regressions are estimated using survey-weighted ordinary least squares.
In our regressions, each category of characteristics—race, age, income, etc.—has a reference group and comparisons are made to this group. The colored bars represent the regression coefficients for each comparison group in that category (all in the same color). These coefficients show how much financial status outcomes would change between the comparison group and the reference group while holding all of the other factors constant. For example, in Figure 8, the reference group for the age category is consumers under age 40. The figure shows that, holding constant every other characteristic in the regression including income, which is correlated with age, consumers 62 and older had Financial Wellbeing scores that were nearly 10 points higher than those of consumers under 40. The lines with end caps on each coefficient show the 95 percent confidence interval. If the lines cross zero, we cannot reject that the comparison group and reference group have the same outcome.65 In Figure 8, we can reject with 95 percent confidence that consumers under age 40 and those age 62 and older had the same Financial Well-Being scores in 2019, holding the other factors in the regression constant. In figure 8, a negative coefficient does not mean that the comparison group’s financial status declined. Instead, a negative coefficient indicates whether the comparison group increased more or less than the reference group.
Figure 9 shows how year-over-year changes in financial status vary by demographic categories, while Figure 10 includes both demographics and cash flow events. In both sets of figures, age (and occasionally gender) is the only statistically significant demographic variable (the confidence interval bands do not cross zero). In statistical terms, we cannot reject the hypothesis that Black and Hispanic consumers had the same change in financial status as other Non-Hispanic White consumers. The double negative is important: it is likely that there are, in fact, differences between groups, but either the difference is not very large, or our sample size is not large enough to detect it.
65 More precisely, the confidence interval calculates the interval that, if we had conducted the same survey at the same time but randomly drawn a different sample, the true outcome would be in the 95 percent confidence interval in 95 percent of the samples. The confidence interval thus contains the true outcome in 95 percent of samples, so values outside the interval are less plausible.

39 CHANGES IN CONSUMER FINANCIAL STATUS DURING THE EARLY MONTHS OF THE PANDEMIC
In Figure 11, we examine whether declines in financial status were more likely including demographic characteristics and change in employment status and cash flows. Employment status and cash flow tend to be much more associated with declines than the demographic variables except for age.

40 CHANGES IN CONSUMER FINANCIAL STATUS DURING THE EARLY MONTHS OF THE PANDEMIC
FIGURE 8: REGRESSIONS OF OVERALL FINANCIAL WELL-BEING SCORE ON DEMOGRAPHICS IN 2019 AND 202066
66 The “other” racial/ethnic category includes non-Hispanic Asian respondents, non-Hispanic American Indian or Alaska Natives, and non-Hispanic Native Hawaiian or other Pacific Islanders. We lacked sufficient sample size among these groups to break them out individually.

41 CHANGES IN CONSUMER FINANCIAL STATUS DURING THE EARLY MONTHS OF THE PANDEMIC
FIGURE 9: REGRESSIONS OF CHANGES IN CREDIT SCORE, FINANCIAL WELL-BEING SCORE, AND DIFFICULTY PAYING FOR A BILL OR EXPENSE ON DEMOGRAPHICS67
67 The “other” racial/ethnic category includes non-Hispanic Asian respondents, non-Hispanic American Indian or Alaska Natives, and non-Hispanic Native Hawaiian or other Pacific Islanders. We lacked sufficient sample size among these groups to break them out individually.

42 CHANGES IN CONSUMER FINANCIAL STATUS DURING THE EARLY MONTHS OF THE PANDEMIC

43 CHANGES IN CONSUMER FINANCIAL STATUS DURING THE EARLY MONTHS OF THE PANDEMIC
FIGURE 10: REGRESSIONS OF CHANGES IN CREDIT SCORE, FINANCIAL WELL-BEING SCORE, AND DIFFICULTY PAYING FOR A BILL OR EXPENSE ON SELECTED EVENTS (WITH DEMOGRAPHICS) 68
68 The “other” racial/ethnic category includes non-Hispanic Asian respondents, non-Hispanic American Indian or Alaska Natives, and non-Hispanic Native Hawaiian or other Pacific Islanders. We lacked sufficient sample size among these groups to break them out individually.

44 CHANGES IN CONSUMER FINANCIAL STATUS DURING THE EARLY MONTHS OF THE PANDEMIC

45 CHANGES IN CONSUMER FINANCIAL STATUS DURING THE EARLY MONTHS OF THE PANDEMIC
FIGURE 11: REGRESSIONS OF PROBABILITY OF A DECLINE IN CREDIT SCORE OR FINANCIAL WELL-BEING SCORE, AND PROBABILITY OF NEWFOUND DIFFICULTY PAYING FOR A BILL OR EXPENSE ON SELECTED EVENTS (WITH DEMOGRAPHICS) 69 70
69 These regressions present “linear probability model” results. We obtain similar results using a logit model. 70 The “other” racial/ethnic category includes non-Hispanic Asian respondents, non-Hispanic American Indian or Alaska Natives, and non-Hispanic Native Hawaiian or other Pacific Islanders. We lacked sufficient sample size among these groups to break them out individually.

46 CHANGES IN CONSUMER FINANCIAL STATUS DURING THE EARLY MONTHS OF THE PANDEMIC