Changes in Amyloid-beta Correlate with Neurological Status after … · Changes in Amyloid-beta...
72
Changes in Amyloid-beta Correlate with Neurological Status after TBI David L. Brody, MD PhD Assistant Professor of Neurology Washington University, St. Louis, MO Keystone Symposium February 29, 2012
Transcript of Changes in Amyloid-beta Correlate with Neurological Status after … · Changes in Amyloid-beta...

Changes in Amyloid-beta Correlate with Neurological Status after TBI
David L. Brody, MD PhD
Assistant Professor of Neurology Washington University, St. Louis, MO
Keystone Symposium
February 29, 2012

Disclosures • Support:
– NIH K08 to D. Brody – Burroughs Wellcome Career Award in the
Biomedical Sciences to D. Brody – NIH R01 and P01 grants to D. Holtzman – Eli Lilly and Co. provided antibodies.
• Conflicts of interest: none.

Outline • Introduction • Human Studies
– A-beta dynamics correlate with neurological status – A-beta is inversely related to markers of axonal injury
• Experimental Animal Studies – Soluble extracellular A-beta is reduced after TBI in
PDAPP and Tg2576 mice – Insoluble intraaxonal A-beta is increased after TBI in
3xTg-AD and APP/PS1 mice • Conclusions and Future Directions
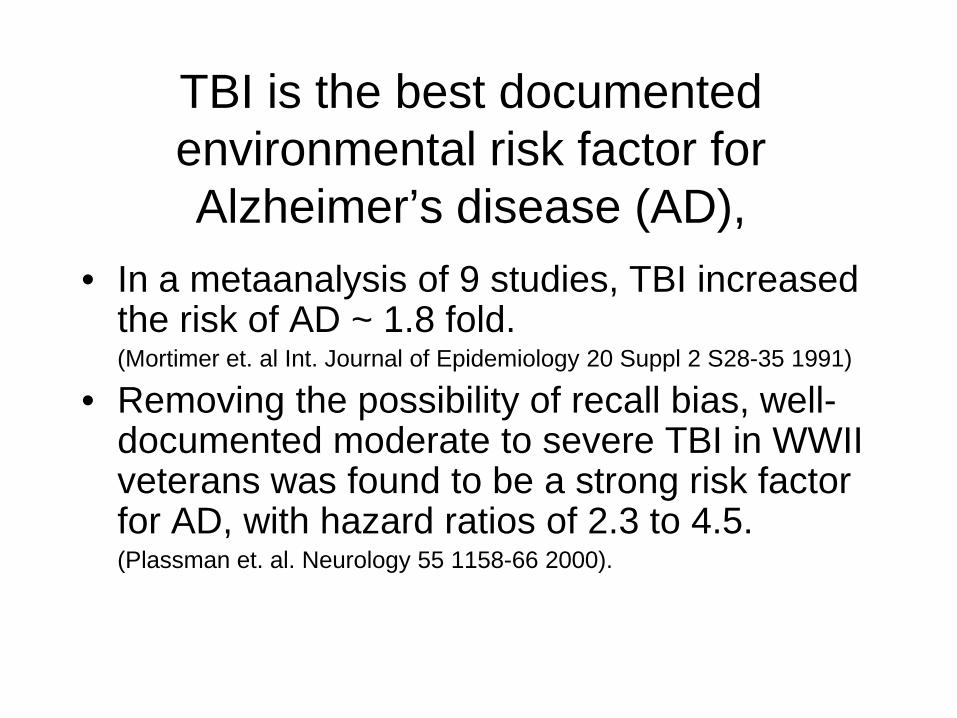
TBI is the best documented environmental risk factor for Alzheimer’s disease (AD),
• In a metaanalysis of 9 studies, TBI increased the risk of AD ~ 1.8 fold.
(Mortimer et. al Int. Journal of Epidemiology 20 Suppl 2 S28-35 1991)
• Removing the possibility of recall bias, well-documented moderate to severe TBI in WWII veterans was found to be a strong risk factor for AD, with hazard ratios of 2.3 to 4.5.
(Plassman et. al. Neurology 55 1158-66 2000).
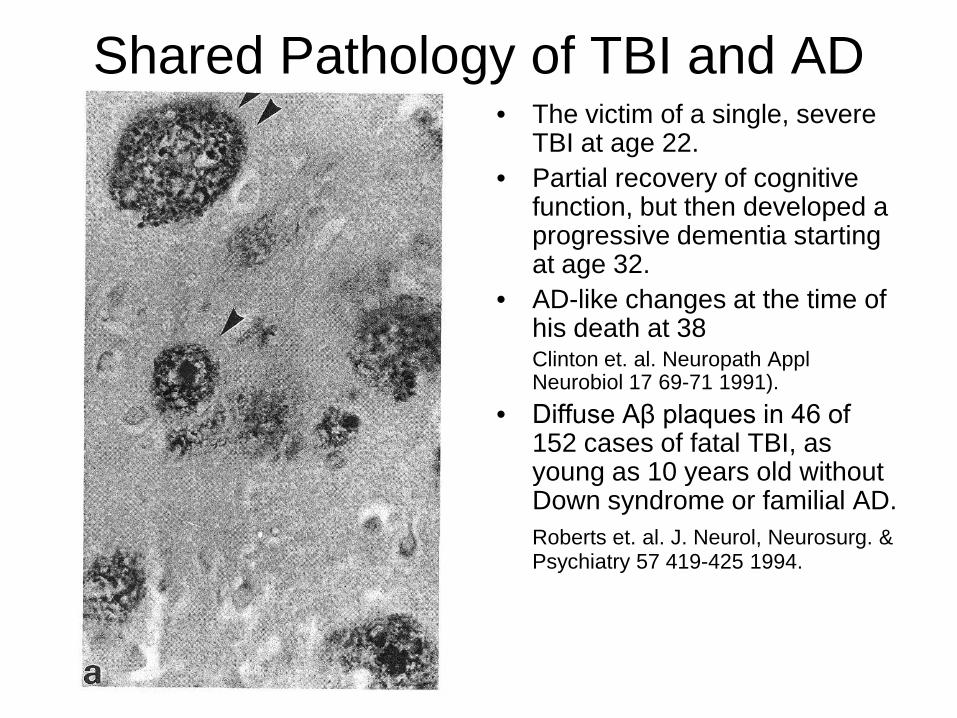
• The victim of a single, severe TBI at age 22.
• Partial recovery of cognitive function, but then developed a progressive dementia starting at age 32.
• AD-like changes at the time of his death at 38
Clinton et. al. Neuropath Appl Neurobiol 17 69-71 1991).
• Diffuse Aβ plaques in 46 of 152 cases of fatal TBI, as young as 10 years old without Down syndrome or familial AD.
Roberts et. al. J. Neurol, Neurosurg. & Psychiatry 57 419-425 1994.
Shared Pathology of TBI and AD

Aβ plaques appear in areas of Diffuse Axonal Injury in Humans
• Smith et. al., J. Neurosurgery 98 1072 (2003)
Aβ
Aβ
Diffuse Axonal Injury: APP → NF ↓
colocalization
colocalization

Amyloid-beta deposition in Alzheimer’s disease is largely extracellular
Yamaguchi et al. Am J Path 1979
Early, diffuse plaques (arrows) from frontal cortex in an 81 year old with AD.
Brendza et al. J Comp Neurol 2003
Mature, neuritic plaque (arrowhead)

Amyloid-beta dynamics in the extracellular space of the
human brain


Amyloid-beta deposition related to default activity in humans
Buckner et al J Neurosci 2005

Microdialysis involves exchange of extracellular fluid and solutes across a semi-permeable membrane.
Cirrito et al J. Neurosci 2003

Regulation of extracellular amyloid-beta levels in animal models.
Kamenetz et al., Neuron 2003 (slice cultures)
Cirrito et al., Neuron 2005 (in vivo microdialysis)

Microdialysis in the Human Brain Microdialysis
Catheter
External Ventricular
Drain
MicrodialysisCatheter
External Ventricular
Drain
Courtesy of CMA
Poca et al, J Neurotrauma 2006 Brody, Magnoni et al Science 2008

Outline • Introduction • Human Studies
– A-beta dynamics correlate with neurological status
– A-beta is inversely related to markers of axonal injury • Experimental Animal Studies
– Soluble extracellular A-beta is reduced after TBI in PDAPP and Tg2576 mice
– Insoluble intraaxonal A-beta is increased after TBI in 3xTg-AD and APP/PS1 mice
• Conclusions and Future Directions

Amyloid-beta Dynamics Correlate with Neurological Status in the
Injured Human Brain David L. Brody*, Sandra Magnoni* Kate E. Schwetye, Michael L. Spinner, Thomas J. Esparza, Nino Stocchetti, Gregory J. Zipfel,
David M. Holtzman Washington University, St. Louis, MO and Ospedale Maggiore Policlinico, Milan, Italy

Methods • 18 patients participated in this study: 17 with acute brain injury and 1 undergoing
craniotomy for unruptured aneurysm clipping. • All protocols were approved by the Human Research Protection Offices at Washington
University, St. Louis and the Ospedale Maggiore Policlico, Milan. • Written informed consent was provided by next of kin. • All microdialysis catheters (CMA70, 20kDa nominal MW cutoff or CMA71, 100 kDa
nominal MW cutoff) were placed by experienced neurosurgeons in conjunction with another interventional procedure, typically placement of an intracranial pressure monitoring device.
• Sterile human albumin was added to sterile CMA perfusion fluid to a final concentration of 0.15% (CMA70 catheters) or 1.5% (CMA71 catheters, for oncotic balance)
• Flow rate was 0.3 µl/min (18 µl/hour) • Samples were acquired every 1-2 hours in CMA microdialysis tubes. • Samples were immediately refrigerated on ice and frozen at -80°C within 12 hours of
acquisition. • 96-well plate format ELISAs were used to measure amyloid-beta.
– Aβ1-x: m266 (recognizes aa 13-28) used to capture, 3D6 (recognizes aa 1-5) used to detect
– Aβ1-42: 21F12 (specific for Aβ42) used to capture, 3D6 used to detect
– Aβ1-40: 2G3 (specific for Aβ40) used to capture, 3D6 used to detect

0 24 48 720
500
1000
1500
2000
0
5
10
15
20
Aβ1-xUrea
time (h)
ISF
Aβ
1-x
(pg/
ml) U
rea (mg/dl)
Aneurysmal Subarachnoid HemorrhageaGold tip of microdialysis catheter in right frontal lobe white matter
Aβ dynamics in a human patient
Urea was measured in the same samples as a control for stable catheter function (Ronne-Engstrom et al J Neurosurg 2001).
Brody, Magnoni et al, Science 2008

Brody, Magnoni et al, Science 2008

0 24 48 72 96 120 1440
500
1000
1500
0
5
10
15
time (h)
ISF
Aβ
1-x
(pg/
ml) U
rea (mg/dl)
Traumatic Brain Injury: Contusionc
Brody, Magnoni et al, Science 2008

Median Aβ increase was 58% over 3 days
*** p=.0002 Wilcoxon signed rank test
N=9 TBI patients with catheters in apparently normal brain regions (triangles)
N=3 TBI patients with catheters in pericontusional regions (x-symbols)
N=6 SAH patients (open circles)
Hours 0-1
2
Hours 60
-72
0
500
1000
1500
20005000
10000 ***B
rain
ISF
Aβ
1-x
(pg/
ml)
Hours 0-1
2
Hours 60
-72
Hours 0-1
2
Hours 60
-720
5
10
15
20
Bra
in I
SF U
rea
(mg/
dl)
Hours 0-1
2
Hours 60
-72
Brody, Magnoni et al, Science 2008

What about cerebrospinal fluid?
0 24 48 720
1000
2000
3000
4000Brain ISF (Microdialysis)Ventricular CSF
Approx time since injury (h) Aβ 1
-x (p
g/m
l)
Aβ levels appear overall lower in microdialysis samples than in ventricular CSF
ISF dynamics not reflected in ventricular CSF.
MicrodialysisCatheter
External Ventricular
Drain
MicrodialysisCatheter
External Ventricular
Drain
Brody, Magnoni et al, Science 2008

Aβ recovery by microdialysis is incomplete
0.0 0.5 1.00
500
1000
1500
2000 Zero-Flow Extrapolation
flow rate (µ l/min)
ISF
Aβ
40 (p
g/m
l)
in vivo
in vitro
010203040
% re
cove
ryat
0.3
µl /
min
Recovery appears to be ~30% in vivo and in vitro.
In contrast, recovery of small molecules like glutamate, lactate, pyruvate, glucose, urea etc. has been reported to be ~70-90% (Hillared et al J Neurotrauma 2005).
Brody, Magnoni et al, Science 2008

Unruptured aneurysm patient(no neurological injury)
0 12 240
500
1000
1500
2000
2500
3000
time (hours)
Estim
ated
true
ISF
A β1-
40 (p
g/m
l)
Estimated true ISF levels =
measured levels / fractional recovery
Fractional recovery calculated from zero-flow extrapolation.

Brain IS
F
Brain IS
F, corr.
for r
ecov.
Ventri
cular
CSF
10
100
1000
10000Aβ
1-x
(pg/
ml)
After correction for partial recovery, brain ISF levels appear similar on average to ventricular CSF levels.
Box: median and interquartile range, Whiskers: 5-95% confidence interval, Circles: outliers.
Brody, Magnoni et al, Science 2008

0.125 0.2
5 0.5 1 2 4 80.25
0.5
1
2
4
8
N.S.
Ventricular CSF Aβ1-x (fold change)
Brai
n IS
F Aβ 1
-x(fo
ld c
hang
e)
No correlation of dynamics between brain ISF and ventricular CSF
Brody, Magnoni et al, Science 2008

Aβ1-42
0 2000 40000
25
50
75200250300
Spearman r = 0.84
Brain ISF Aβ1-x (pg/ml)
Brai
n IS
F Aβ
1-42
(pg/
ml)
0 10000 200000
100
200
300
400
500Spearman r = 0.62
Ventricular CSF Aβ1-x (pg/ml)
Vent
ricul
ar C
SF A
β1-
42 (p
g/m
l)
Brody, Magnoni et al, Science 2008

What underlies these dynamcs in the injured brain?
• Correlations with other microdialysis parameters.
• Correlations with other aspects of cerebral physiology.
• Correlations with neurological status.

N.S.
0 5 100
500
1000
1500
2000
3000
5000
Lactate (mM)
ISF
Aβ
1-x
(pg/
ml)
Spearman r = .18, p=.0003
0.0 0.1 0.2 0.3 0.40
500
1000
1500
2000
3000
5000
Pyruvate (mM)
ISF
Aβ
1-x
(pg/
ml)
Spearman r = -.40, p<.0001
10 20 30 400
500
1000
1500
2000
3000
5000
Lactate / Pyruvate
ISF
Aβ
1-x
(pg/
ml)
a b c
Correlations with Redox State
Elevated lactate/pyruvate ratio reflects impaired oxidative metabolism. (Hillered et al J Neurotrauma 2005)
Elevated lactate can be a marker of synaptic activity (Bero et al Nature Neurosci 2011)

Spearman r = .45, p<.0001
0 1 2 3 40
500
1000
1500
2000
3000
5000
Glucose (mM)
ISF
Aβ
1-x
(pg/
ml)
N.S.
0 10 20 30 40 500
500
1000
1500
2000
3000
5000
PtiO2 (mm Hg)
ISF
Aβ
1-x
(pg/
ml)
Correlations with Oxygen and Glucose Delivery
Brody, Magnoni et al, Science 2008

N.S.
0.1 1 10 1000
500
1000
1500
2000
3000
5000
Glutamate (µM)
ISF
Aβ
1-x
(pg/
ml)
Glutamate Toxicity?
Brody, Magnoni et al, Science 2008

0 10 20 300
500
1000
1500
2000
50001000015000
Spearmanr = -.56,
p<.0001 forICP>20
N.S. overall
Intracranial Pressure (mm Hg)
ISF
Aβ
1-x
(pg/
ml)
N.S.
40 60 80 100 1200
500
1000
1500
2000
50001000015000
Cerebral Perfusion Pressure (mm Hg)IS
F Aβ
1-x
(pg/
ml)
Intracranial Pressure
Brody, Magnoni et al, Science 2008

N.S.
35 36 37 38 39 40 410
500
1000
1500
2000
3000
5000
Cerebral Temperature ( °C)
ISF
Aβ
1-x
(pg/
ml)
Cerebral Temperature Spearman r = -.26, p<.0001
0 1 2 3 40
500
1000
1500
2000
3000
5000
|Cerebral Temperature (°C)- 37.2|
ISF
Aβ
1-x
(pg/
ml)
Normal cortical temperature 37.2 ± 0.6 °C estimated by MR spectroscopy (Corbett et al. JCBFM 1997)
Brody, Magnoni et al, Science 2008

Overall Neurological Status

The Glasgow Coma Score (Teasdale and Jennett, Lancet 1974)
Eye Opening: 1-4
Best Verbal Response: 1-5
Best Motor Response: 1-6
Total: 3-15

3579111315
Rapid Recovery
Gla
sgow
Com
a Sc
ore
0 12 24 36 48 60
0.5
1
2
4
time (hours)
ISF
Aβ
1-x
(fold
cha
nge
from
bas
elin
e)
0 24 48 72 96 120 144 168
0.5
1
2
4
Prolonged Coma:Glasgow Coma Score = 4
time (hours)
ISF
Aβ
1-x
(fold
cha
nge
from
bas
elin
e)
567891011Clinical Fluctuations
Gla
sgow
Com
a Sc
ore
345678
Secondary Insult (ischemia)
Gla
sgow
Com
a Sc
ore
0 24 48 72 96
0.5
1
2
4
time (hours)
ISF
Aβ
1-x
(fold
cha
nge
from
bas
elin
e)
36 48 60 72 84 96
0.25
0.5
1
2
time (hours)
ISF
Aβ
1-x
(fold
cha
nge
from
bas
elin
e)
Global Neurological Status
Brody, Magnoni et al, Science 2008

Correlation with Change in Global Neurological Status
-5 -4 -3 -2 -1 0 1 2 3 4 5 6 7 8 9 10
0.25
0.5
1
2
4
8
Spearman r = 0.82, P<0.0001for |Change in GCS| ≥ 2
change in Glasgow Coma Score from baseline
Brai
n IS
F Aβ
1-x
(fold
cha
nge
from
bas
elin
e)
Brody, Magnoni et al, Science 2008

-5 -4 -3 -2 -1 0 1 2 3 4 5 6 7 8 9 10
0.25
0.5
1
2
4
8
Overall: Spearman r = .20, p=.009|Change in GCS| ≥ 2: Spearman r = 0.22, p=.05
change in GCS from baseline
Vent
ricu
lar
CSF
Aβ
1-x
(fol
d ch
ange
from
bas
elin
e)
-5 -4 -3 -2 -1 0 1 2 3 4 5 6 7 8 9 10
0.25
0.5
1
2
4
8
Spearman r = .65, p<.0001
change in GCS from baseline
ISF
Aβ
1-x
(fol
d ch
ange
from
bas
elin
e)
a b
Ventricular CSF vs Brain ISF
These dynamics correlating with changes in global neurological status are are not as clearly reflected in ventricular CSF amyloid-beta.
Brody, Magnoni et al, Science 2008

AcuteBrainInjury:[ISF Aβ ]unknown
Stabilization:[ISF Aβ ] stable
Recovery:[ISF Aβ ] increases
Secondary Insults:[ISF Aβ ] decreases
Model
Brody, Magnoni et al, Science 2008

What does this mean? • Amyloid-beta can be measured by
microdialysis in the human brain. – Selected scientific questions about amyloid-
beta physiology can be addressed using this technique.
– In principle, assessment of the effects of candidate therapeutics on amyloid-beta levels in the most relevant compartment- the human brain- could be made.
– However, it is not feasible or ethical to perform microdialysis studies in many patients, which may limit widespread use of this approach.
• Microdialysate amyloid-beta changes correlate with global neurological status changes. – We hypothesize that amyloid-beta levels
correlate with neurological status because both are related to synaptic activity.
– In mice, extracellular amyloid-beta levels are regulated by local synaptic activity.
– It is likely that synaptic activity is reduced following brain injury, and increases with recovery.
Synaptic Activity
?
?

Outline • Introduction • Human Studies
– A-beta dynamics correlate with neurological status – A-beta is inversely related to markers of axonal
injury • Experimental Animal Studies
– Soluble extracellular A-beta is reduced after TBI in PDAPP and Tg2576 mice
– Insoluble intraaxonal A-beta is increased after TBI in 3xTg-AD and APP/PS1 mice
• Conclusions and Future Directions

Tau Elevations in the Brain Extracellular Space Correlate with
Reduced Amyloid-β Levels and Predict Adverse Clinical Outcomes after Severe Traumatic Brain Injury.

Tau and Amyloid-beta dynamics
Magnoni et al, Brain 2011

Magnoni et al, Brain 2011
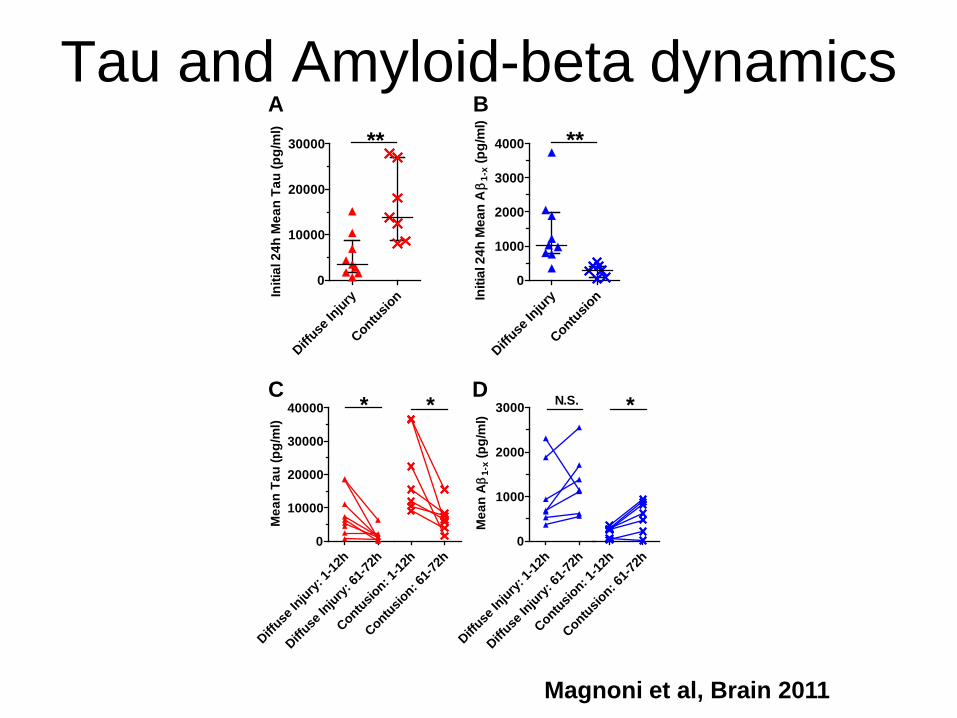
Tau and Amyloid-beta dynamics
Diffuse
Injury
Contusion
0
10000
20000
30000 **
Initi
al 2
4h M
ean
Tau
(pg/
ml)
Diffuse
Injury
Contusion
0
1000
2000
3000
4000 **
Initi
al 2
4h M
ean
Aβ
1-x (
pg/m
l)
Diffuse
Injury:
1-12
h
Diffuse
Injury:
61-72
h0
10000
20000
30000
40000 *
Mea
n Ta
u (p
g/m
l)
Contusion: 1
-12h
Contusion: 6
1-72h
*
A B
C D
Contusion: 1
-12h
Contusion: 6
1-72h
*
Diffuse
Injury:
1-12
h
Diffuse
Injury:
61-72
h0
1000
2000
3000 N.S.
Mea
n Aβ
1-x (
pg/m
l)
Magnoni et al, Brain 2011

Magnoni et al, Brain 2011

Neurofilament Light Chain- Another marker of Axonal Injury
A
B
0 10000 20000 300000
1000
2000
3000
4000 Spearman r = 0.60, p=0.013
ContusionDiffuse Injury
Initial 24h Mean Tau (pg/ml)
Initi
al 2
4h M
ean
NF-
L (p
g/m
l)
0 24 48 72 96 120 144 1680
10000
20000
30000
0
1000
2000
3000
4000Tau (pg/ml)NF-L
Time (h)
Tau
(pg/
ml)
NF-L (pg/m
l)
Magnoni et al, Brain 2011
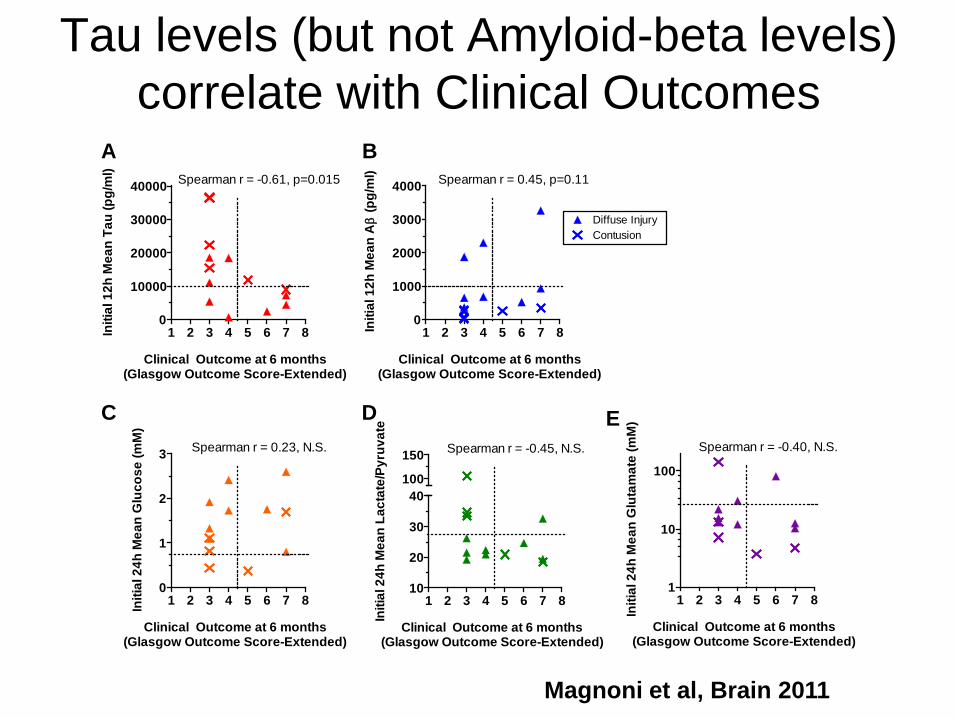
1 2 3 4 5 6 7 81
10
100
Spearman r = -0.40, N.S.
Clinical Outcome at 6 months(Glasgow Outcome Score-Extended)
Initi
al 2
4h M
ean
Glu
tam
ate
(mM
)
A B
1 2 3 4 5 6 7 80
10000
20000
30000
40000 Spearman r = -0.61, p=0.015
Clinical Outcome at 6 months(Glasgow Outcome Score-Extended)
Initi
al 1
2h M
ean
Tau
(pg/
ml)
1 2 3 4 5 6 7 80
1000
2000
3000
4000
Diffuse InjuryContusion
Spearman r = 0.45, p=0.11
Clinical Outcome at 6 months(Glasgow Outcome Score-Extended)
Initi
al 1
2h M
ean
Aβ
(pg/
ml)
C D E
1 2 3 4 5 6 7 80
1
2
3 Spearman r = 0.23, N.S.
Clinical Outcome at 6 months(Glasgow Outcome Score-Extended)
Initi
al 2
4h M
ean
Glu
cose
(mM
)
1 2 3 4 5 6 7 810
20
30
40100
150 Spearman r = -0.45, N.S.
Clinical Outcome at 6 months(Glasgow Outcome Score-Extended)
Initi
al 2
4h M
ean
Lact
ate/
Pyru
vate
Tau levels (but not Amyloid-beta levels) correlate with Clinical Outcomes
Magnoni et al, Brain 2011

Unresolved Questions Regarding Amyloid-beta Dynamics after TBI: Rationale for
Development of an Animal Model
Schwetye et al, Neurobiology of Disease 2010
Normal, risingHigh, rising further
Low, recovering
TBIHuman catheters placed ?
?
?
time (h; TBI at t=0)
% b
asel
ine
Aβ 1
-x
A B
Immunohistochemistryreveals Aß deposits
Microdialysis samplesextracellular (ISF) Aß
Extracellularinsoluble
Extracellularsoluble
Intracellularinsoluble
Intracellularsoluble
microdialysis
Tissue homogenates measurea mixture of Aß in all 4 pools
Immunohistochemistryreveals Aß deposits
Microdialysis samplesextracellular (ISF) Aß
Extracellularinsoluble
Extracellularsoluble
Intracellularinsoluble
Intracellularsoluble
microdialysis
Tissue homogenates measurea mixture of Aß in all 4 pools

Outline • Introduction • Human Studies
– A-beta dynamics correlate with neurological status – A-beta is inversely related to markers of axonal injury
• Experimental Animal Studies – Soluble extracellular A-beta is reduced after TBI in
PDAPP and Tg2576 mice – Insoluble intraaxonal A-beta is increased after TBI in
3xTg-AD and APP/PS1 mice • Conclusions and Future Directions

Traumatic Brain Injury Reduces Soluble Extracellular Amyloid-β in Mice: A Combined Microdialysis- Controlled Cortical Impact Study
Katherine E. Schwetye, John R. Cirrito, Thomas J. Esparza, Christine L. Mac Donald, David M. Holtzman, and David L. Brody
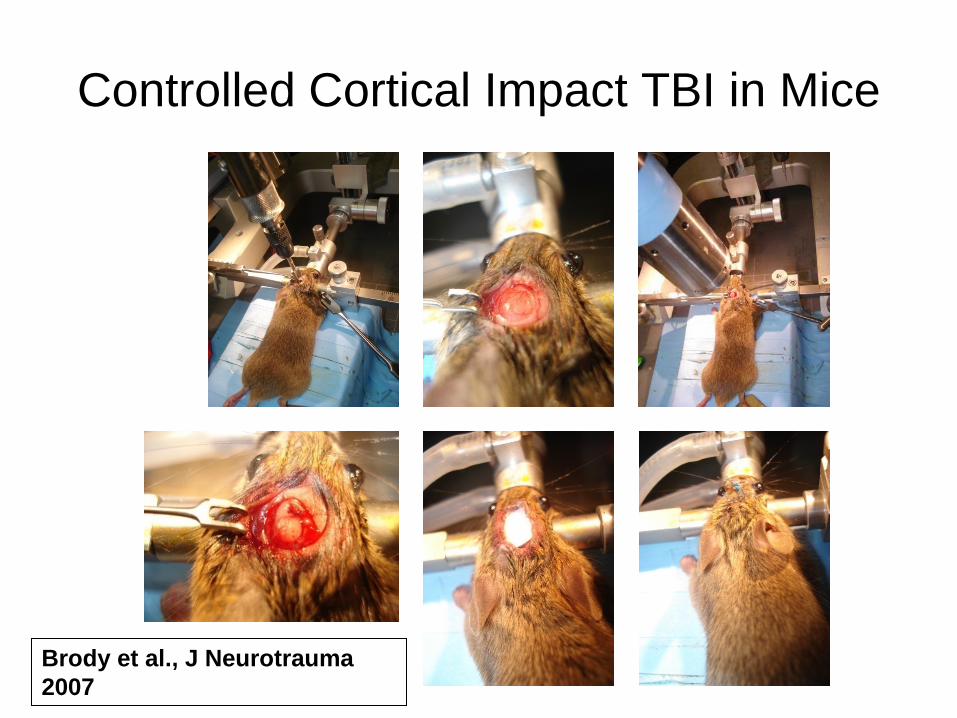
Controlled Cortical Impact TBI in Mice
Brody et al., J Neurotrauma 2007

Combined Microdialysis and Controlled Cortical Impact TBI in Mice
38°
0.5 mm
Bregma -2.80 mm
2.0 mm
probe
1.3 mm canula
38°
0.5 mm
Bregma -2.80 mm
2.0 mm
probe
1.3 mm canula
A B
C D
tether inflow
outflow
probe probe tract
guide canula
Schwetye et al, Neurobiology of Disease 2010

Controlled Cortical Impact
TBI Acutely Reduces
Extracellular Amyloid-beta in
Mice
Schwetye et al, Neurobiology of Disease 2010
-18 -12 -6 0 6 12 18 24 30
50
100
150
200 SHAM (n = 6)2.0 mm (n = 6)
*
time (h; SHAM or TBI at t=0)
% b
asel
ine
Aβ 1
-x
-18 -12 -6 0 6 12 18 24 30
50
100
150
200 SHAM (n = 5)2.0 mm (n = 5)
*
time (h; SHAM or TBI at t=0)
% b
asel
ine
Aβ x
-40
-18 -12 -6 0 6 12 18 24 30
50
100
150
200
1.5 mm (n = 5)1.0 mm (n = 5)
*
SHAM (steady state)2.0 mm (steady state)
ns
time (h; TBI at t=0)
% b
asel
ine
Aβ 1
-x
-18 -12 -6 0 6 12 18 24 30 36 42
50
100
150 SHAM (n = 4)2.0 mm (n = 4)
*
time (h; SHAM or TBI at t=0)
% b
asel
ine
Aβ x
-40
-12 0 12 24 36 48 60 72 84 96 108 120
50
100
150
1.5 mm (n = 5)
time (h; TBI at t=0)
% b
asel
ine
Aβ 1
-xA B
C
E
D
PDAPP+/- PDAPP+/-
Tg2576+/- C57Bl6 WT
Tg2576+/- / hApoE2

Fractional Amyloid-beta Recovery is Unchanged
0.0 0.5 1.0 1.50.0
0.5
1.0
1.5
2.0
flow rate (µL/min)
[Aβ ]
/pre
-TB
I [Aβ ]
, 0.1
uL/
min
0.0 0.5 1.0 1.50.0
0.1
0.2
0.3
0.4
flow rate (µL/min)
-18 -12 -6 0 6 12 18 24 30
50
100
150
time (h; TBI at t=0)
% b
asel
ine
urea
Pre Post0
25
50
75
100
% b
asel
ine
urea
-18 -12 -6 0 6 12 18 24 30
25
50
75
100
125
time (h; TBI at t=0)
Mea
n %
[Aβ
] IN
C
A
Pre Post0
25
50
75
100
% [A
β] IN
K0, pre-TBI = 9.5 ± 2.2 mL/(min*mm2) K0, post-TBI = 10.2 ± 1.6 mL/(min*mm2)
B
Schwetye et al, Neurobiology of Disease 2010

Only PBS-soluble Amyloid-beta is affected in PDAPP mice
Schwetye et al, Neurobiology of Disease 2010
SHAM2.0 mm
0
10
20
30
40
SHAM2.0 mm
0
1
2
3
4*
A β(p
g/m
L) /
prot
ein
(ug/
mL)
SHAM2.0 mm
0
1
2
3 *
SHAM2.0 mm
0
5
10
15
SHAM2.0 mm
0
5
10
15
PBS
CO
RTE
X
Carbonate pH 11
SHAM2.0 mm
0
5
10
15
20
GuanidineA C E
B D F
HIP
POC
AM
PUS

Reductions in Amyloid-beta Correlate with Reduced Neuronal Activity
Schwetye et al, Neurobiology of Disease 2010

Outline • Introduction • Human Studies
– A-beta dynamics correlate with neurological status – A-beta is inversely related to markers of axonal injury
• Experimental Animal Studies – Soluble extracellular A-beta is reduced after TBI in
PDAPP and Tg2576 mice – Insoluble intra-axonal A-beta is increased after
TBI in 3xTg-AD and APP/PS1 mice • Conclusions and Future Directions

Controlled Cortical Impact Traumatic Brain Injury in 3xTg-AD Mice Causes Acute Intra-axonal
Amyloid-beta Accumulation Hien T. Tran, Frank M LaFerla, David M. Holtzman, and
David L. Brody

Amyloid-beta Pathology in White Matter
Tran et al, J Neurosci 2011

Amyloid-beta Increased only in Guan-Soluble Fraction
Tran et al, J Neurosci 2011

Amyloid-beta Colocalized With Intracellular Markers of Axonal Injury
Tran et al, J Neurosci 2011

Outline • Introduction • Human Studies
– A-beta dynamics correlate with neurological status – A-beta is inversely related to markers of axonal injury
• Experimental Animal Studies – Soluble extracellular A-beta is reduced after TBI in
PDAPP and Tg2576 mice – Insoluble intraaxonal A-beta is increased after TBI in
3xTg-AD and APP/PS1 mice • Conclusions and Future Directions
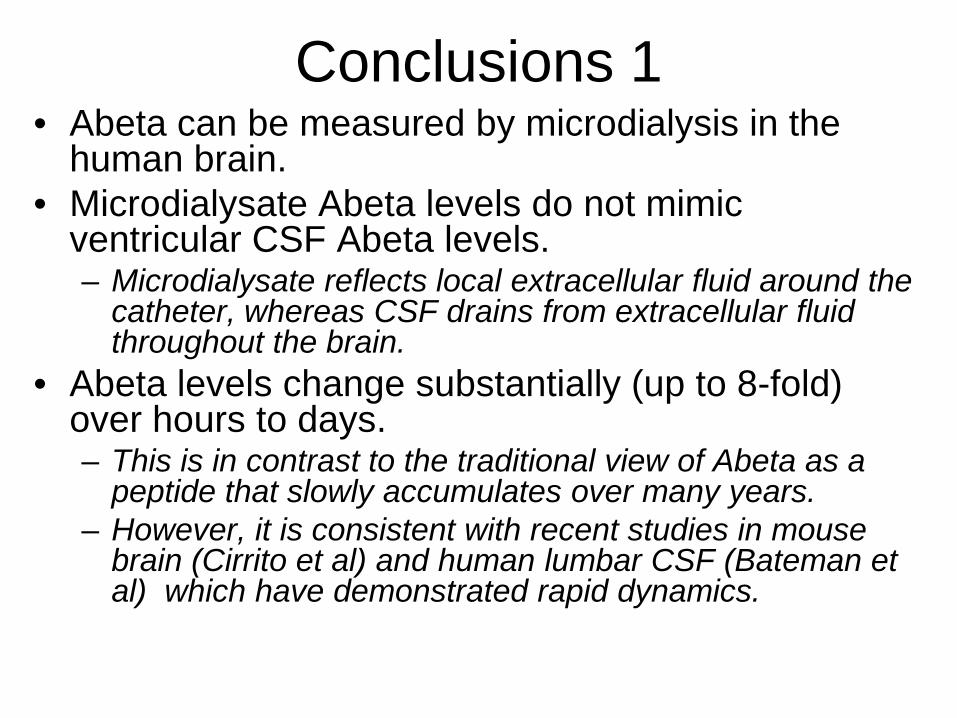
Conclusions 1 • Abeta can be measured by microdialysis in the
human brain. • Microdialysate Abeta levels do not mimic
ventricular CSF Abeta levels. – Microdialysate reflects local extracellular fluid around the
catheter, whereas CSF drains from extracellular fluid throughout the brain.
• Abeta levels change substantially (up to 8-fold) over hours to days. – This is in contrast to the traditional view of Abeta as a
peptide that slowly accumulates over many years. – However, it is consistent with recent studies in mouse
brain (Cirrito et al) and human lumbar CSF (Bateman et al) which have demonstrated rapid dynamics.

Conclusions 2 • Surprisingly, Abeta levels increase over time after injury.
– Previous studies have suggested that total brain homogenate Abeta levels may be acutely increased after TBI.
– It is possible that there is a dissociation between soluble, extracellular Abeta levels measured by microdialysis and total brain Abeta levels, which include intracellular and extracellular, soluble and insoluble Abeta.
• Microdialysate Abeta changes may correlate with global neurological status changes. – These changes may be consistent with recent findings that
extracellular Abeta levels are governed by local synaptic activity. – It is likely that synaptic activity is reduced following TBI, and
increases with recovery. – Other correlates of low amyloid-beta (high lactate/pyruvate ratio,
low glucose, high ICP, extremes of temperature) all would be expected to impair synaptic activity.
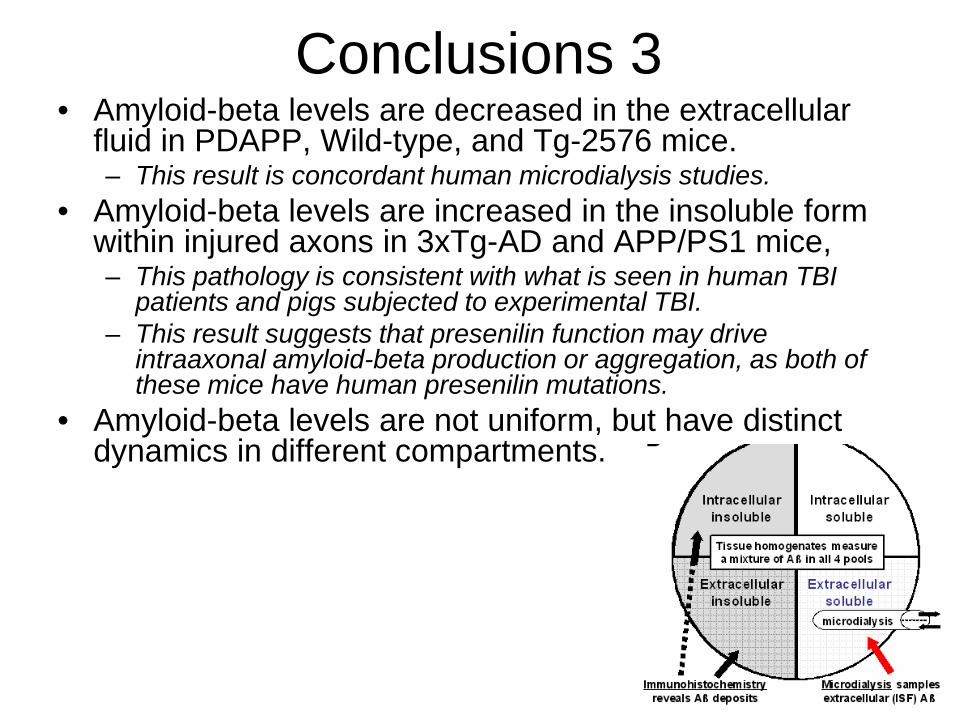
Conclusions 3 • Amyloid-beta levels are decreased in the extracellular
fluid in PDAPP, Wild-type, and Tg-2576 mice. – This result is concordant human microdialysis studies.
• Amyloid-beta levels are increased in the insoluble form within injured axons in 3xTg-AD and APP/PS1 mice, – This pathology is consistent with what is seen in human TBI
patients and pigs subjected to experimental TBI. – This result suggests that presenilin function may drive
intraaxonal amyloid-beta production or aggregation, as both of these mice have human presenilin mutations.
• Amyloid-beta levels are not uniform, but have distinct dynamics in different compartments.
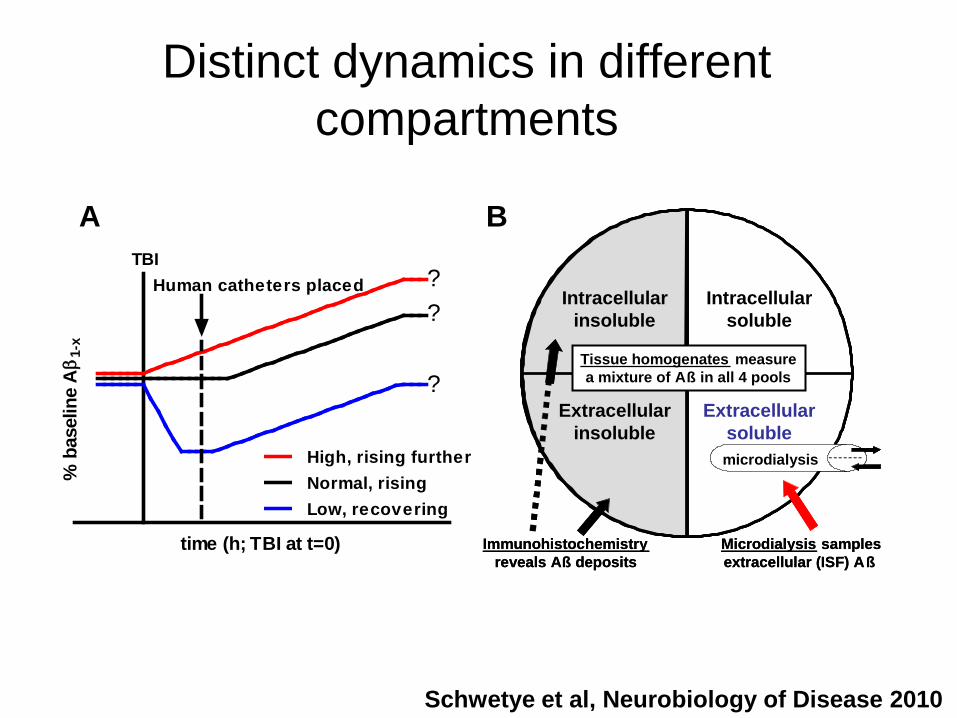
Distinct dynamics in different compartments
Schwetye et al, Neurobiology of Disease 2010
Normal, risingHigh, rising further
Low, recovering
TBIHuman catheters placed ?
?
?
time (h; TBI at t=0)
% b
asel
ine
Aβ 1
-x
A B
Immunohistochemistryreveals Aß deposits
Microdialysis samplesextracellular (ISF) Aß
Extracellularinsoluble
Extracellularsoluble
Intracellularinsoluble
Intracellularsoluble
microdialysis
Tissue homogenates measurea mixture of Aß in all 4 pools
Immunohistochemistryreveals Aß deposits
Microdialysis samplesextracellular (ISF) Aß
Extracellularinsoluble
Extracellularsoluble
Intracellularinsoluble
Intracellularsoluble
microdialysis
Tissue homogenates measurea mixture of Aß in all 4 pools
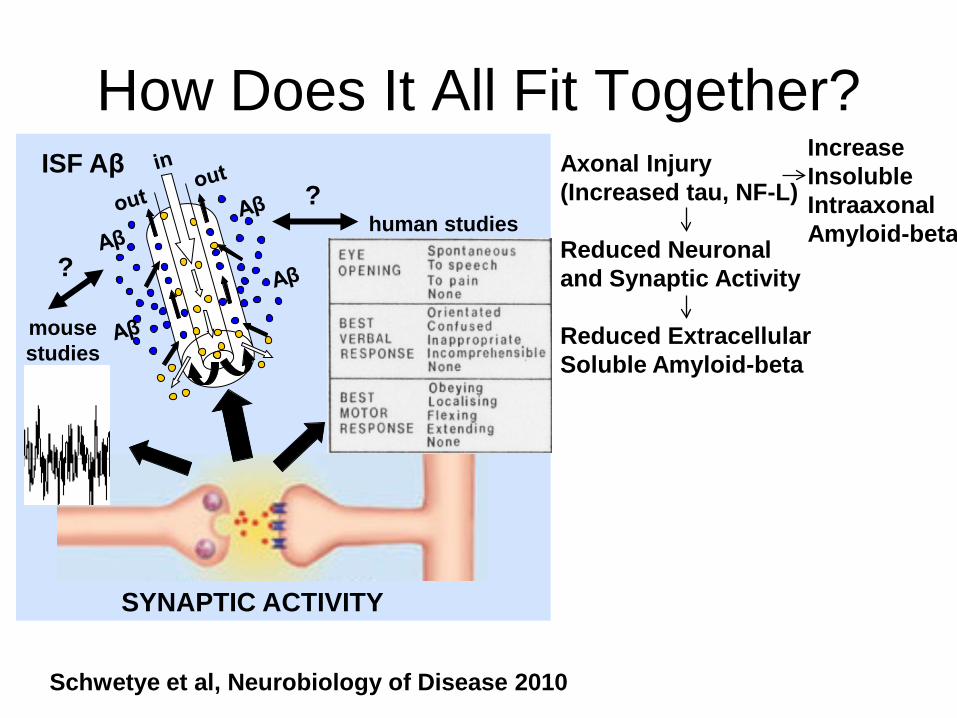
How Does It All Fit Together?
SYNAPTIC ACTIVITY
mouse studies
human studies
?
? ISF Aβ
Schwetye et al, Neurobiology of Disease 2010
Axonal Injury (Increased tau, NF-L) Reduced Neuronal and Synaptic Activity Reduced Extracellular Soluble Amyloid-beta
Increase Insoluble Intraaxonal Amyloid-beta

Future Directions • Detection of Abeta oligomers in patients with AD:
– Question: under what circumstances could microdialysis be performed in AD patients?
• Amyloid plaque imaging (PIB)-guided catheter placement. – Coregistration of PET with CT marking catheter location
• Pharmacodynamic studies of Abeta- modifying therapeutics in the human brain. – Candidates: gamma secretase inhibitors, beta secretase inhibitors,
statins… • Diffusion Tensor Imaging- guided probe placement
– Axonal injury vs. normal white matter. – Additional microdialysis markers of axonal injury: Tau, NF-L.
• Correlations with EEG • Comparisons across ApoE genotypes.
– ApoE4 is associated with worse outcomes following TBI, and increased risk of AD. [Talk and Poster from Rachel Bennett]

Acknowledgements: • We would like to especially thank the participants and their families
for their invaluable contributions. • We appreciate the assistance of our neurosurgical collegues for
referring patients, Dr. M. Diringer for serving as the independent safety monitor, Dr. M. Pluderi for placing several microdialysis catheters, and P. Bianchi, G. Brandi, M. Carbonara, U. Deledda, L. Magni, E. Milner, J. Sagar and T. Zoerle for help collecting samples.
• Valuable discussions with Drs. R. Bateman, R. Bullock, J. Cirrito, R. Dacey, M. Diringer, L. Hillered, P. Hutchinson, J. Ladensen, W. Powers and N. Temkin are acknowledged.
• We are grateful to Eli Lilly and Co. for providing the antibodies used in the Aβ ELISAs.
• This work was supported by NIH NS049237 (DLB), a Burroughs Wellcome Career Award in the Biomedical Sciences (DLB), NIH AG13956 (DMH), and Cure Alzheimer’s Fund (DMH)


0.25 0.5 1 2 40.25
0.5
1
2
4
N.S.
Lactate (fold change)
ISF
Aβ
1-x
(fold
cha
nge)
0.25 0.5 1 2 40.25
0.5
1
2
4
N.S.
Pyruvate (fold change)
ISF
Aβ
1-x
(fold
cha
nge)
0.25 0.5 1 20.25
0.5
1
2
4
N.S.
Lactate / Pyruvate (fold change)
ISF
Aβ
1-x
(fold
cha
nge)
0.25 0.5 1 2 4 80.25
0.5
1
2
4
N.S.
Glucose (fold change)
ISF
Aβ
1-x
(fold
cha
nge)
Spearman r = -.34, P<0.0001
0.01 0.1 10.25
0.5
1
2
4
Glutamate (fold change)
ISF
Aβ
1-x
(fold
cha
nge)
0.25 0.5 1 2 40.25
0.5
1
2
4
N.S.
PtiO2 (fold change)
ISF
Aβ
1-x
(fold
cha
nge)
0.25 0.5 1 2 40.25
0.5
1
2
4
8
N.S.
Intracranial Pressure (fold change)
ISF
Aβ
1-x
(fold
cha
nge)
Spearman r = .27, P<0.0001
0.5 1 20.25
0.5
1
2
4
8
Cerebral Perfusion Pressure(fold change)
ISF
Aβ
1-x
(fold
cha
nge)
Spearman r = .34, P<0.0001
0.90 0.95 1.00 1.05 1.100.25
0.5
1
2
4
Cerebral Temperature (fold change)
ISF
Aβ
1-x
(fold
cha
nge)
A B C
D
G H
F
I
E

A B
Sedati
on Incre
ase
Sedati
on Dec
rease
0.0
0.5
1.0
1.5
2.0
2.5N.S.
Bra
in IS
F Aβ
1-x
fold
cha
nge
Propofol
Barbitu
ates
Benzo
diazep
ines
Opiates
None0
2000
4000
6000
8000
**
**
Bra
in IS
F Aβ
1-x
(pg/
ml)
Overall, brain ISF Aβ levels were highest when patients were not sedated (**P <0.005, ANOVA followed Bonferroni pairwise post-hoc testing). Sedation with propofol was associated with lower Aβ levels than sedation with benzodiazepines (** P =.00025). However, sedation was not varied systematically; less severely injured patients typically received less intensive sedation, and the choice of agents was left to the discretion of the treating physicians. B. There was no difference in the fold changes in Aβ associated with times when sedation was increased vs. times when sedation was decreased (P=0.66). Ratios are slightly greater than 1 because brain ISF Aβ in general was rising over time. When this analysis was restricted to changes in short-acting agents (primarily propofol, midazolam, and fentanyl), the results were essentially unchanged (P=0.42).