Change Healthcare - research-doc.credit-suisse.com
32
DISCLOSURE APPENDIX AT THE BACK OF THIS REPORT CONTAINS IMPORTANT DISCLOSURES, ANALYST CERTIFICATIONS, LEGAL ENTITY DISCLOSURE AND THE STATUS OF NON-US ANALYSTS. US Disclosure: Credit Suisse does and seeks to do business with companies covered in its research reports. As a result, investors should be aware that the Firm may have a conflict of interest that could affect the objectivity of this report. Investors should consider this report as only a single factor in making their investment decision. 22 July 2019 Americas/United States Equity Research Healthcare Technology Change Healthcare (CHNG) INITIATION Rating OUTPERFORM Price (18-Jul-19, US$) 13.62 Target price (US$) 18.00 52-week price range (US$) 15.00 - 13.62 Market cap(US$ m) 4,096 Enterprise value (US$ m) 8,796 Target price is for 12 months. [V] = Stock Considered Volatile (see Disclosure Appendix) Research Analysts Jailendra Singh 212 325 8121 [email protected] A.J. Rice 212 325 8134 [email protected] Eduardo Ron 212 325 7491 [email protected] Caleb Harris, CPA 212 325 7458 [email protected] Investments Today Pave the Way for a Bright Future; Initiating with an Outperform, $18 TP ■ Favorable Industry Drivers Support Growth Prospects. Change Healthcare is a leading independent healthcare technology platform offering a comprehensive suite of software, analytics, technology-enabled services and solutions aimed at improving results across all aspects of the complex US healthcare ecosystem. As such, CHNG should benefit from favorable system-wide trends, including a) reducing unnecessary medical spend, b) a growing population of chronically ill and higher-risk patients, c) increasing adoption of value-based care models, d) increasing consumerism of healthcare services, and e) proliferation of healthcare data. ■ Predictable and Diversified Revenue Supports LT Growth Targets. Change Healthcare has predictable and highly diversified revenue, with 88% recurring and no single customer representing greater than 4%. The average tenure of CHNG’s top 10 customers is 20+ years. This attractive operating profile allows it to target operating efficiencies (investment and business rationalization) that underpin its long-term growth targets of 4-6% for revenue and 6-8% for EBITDA. FY20 is an investment year for CHNG and, as such, revenue growth is likely to remain below the LT target. However, we expect efficiencies to accelerate CHNG’s growth in FY21 and beyond. ■ Attractive FCF Profile Should Drive Quick Deleveraging. We estimate net leverage at 4.5x, relatively higher than its HCIT peers. However, we expect CHNG to apply its strong FCF generation toward de-leveraging. ■ Initiate with an Outperform Rating and $18 PT. Our $18 TP is based on 9.5x our CY21 EBITDA estimate. This is roughly a 20% discount to closest- comparable CERN’s current multiple. Risks include current investments not yielding desired results and high leverage limiting financial flexibility. Share price performance CHNG.OQ S&P 500 INDEX Jun-19 Ju l- 1 9 Ju l- 1 9 Ju l- 1 9 13.5 14.0 14.5 15.0 On 18-Jul-2019 the S&P 500 INDEX closed at 2995.95 Daily Jun27, 2019 - Jul18, 2019, 06/27/19 = US$15.0 Quarterly EPS Q1 Q2 Q3 Q4 2019A - - - - 2020E 0.34 0.32 0.37 0.44 2021E 0.31 0.32 0.38 0.43 Financial and valuation metrics Year 3/19A 3/20E 3/21E 3/22E EPS (CS adj.) (US$) 3.56 1.48 1.44 1.54 Prev. EPS (US$) - - - - P/E (x) 3.8 9.2 9.5 8.8 EV/SALES 3.0 3.0 2.8 2.7 Revenue (US$ m) 3,281.7 3,323.6 3,475.9 3,638.7 EBITDA (US$ m) 935.0 990.4 1,060.6 1,134.4 EBITDA margin (%) 28.5 29.8 30.5 31.2 EV/EBITDA (current) 10.6 8.9 7.9 7.0 ROIC (%) 13.00 13.24 12.19 13.28 Number of shares (m) 300.76 IC (current, US$ m) 4,870.89 Source: Company data, Refinitiv, Credit Suisse estimates
Transcript of Change Healthcare - research-doc.credit-suisse.com

DISCLOSURE APPENDIX AT THE BACK OF THIS REPORT CONTAINS IMPORTANT DISCLOSURES, ANALYST CERTIFICATIONS, LEGAL ENTITY DISCLOSURE AND THE STATUS OF NON-US ANALYSTS. US Disclosure: Credit Suisse does and seeks to do business with companies covered in its research reports. As a result, investors should be aware that the Firm may have a conflict of interest that could affect the objectivity of this report. Investors should consider this report as only a single factor in making their investment decision.
22 July 2019Americas/United States
Equity ResearchHealthcare Technology
Change Healthcare (CHNG)
INITIATION Rating OUTPERFORMPrice (18-Jul-19, US$) 13.62Target price (US$) 18.0052-week price range (US$) 15.00 - 13.62Market cap(US$ m) 4,096Enterprise value (US$ m) 8,796Target price is for 12 months.[V] = Stock Considered Volatile (see Disclosure Appendix)
Research AnalystsJailendra Singh
212 325 [email protected]
A.J. Rice212 325 8134
Eduardo Ron212 325 7491
Caleb Harris, CPA212 325 7458
Investments Today Pave the Way for a Bright Future; Initiating with an Outperform, $18 TP■ Favorable Industry Drivers Support Growth Prospects. Change
Healthcare is a leading independent healthcare technology platform offering a comprehensive suite of software, analytics, technology-enabled services and solutions aimed at improving results across all aspects of the complex US healthcare ecosystem. As such, CHNG should benefit from favorable system-wide trends, including a) reducing unnecessary medical spend, b) a growing population of chronically ill and higher-risk patients, c) increasing adoption of value-based care models, d) increasing consumerism of healthcare services, and e) proliferation of healthcare data.
■ Predictable and Diversified Revenue Supports LT Growth Targets. Change Healthcare has predictable and highly diversified revenue, with 88% recurring and no single customer representing greater than 4%. The average tenure of CHNG’s top 10 customers is 20+ years. This attractive operating profile allows it to target operating efficiencies (investment and business rationalization) that underpin its long-term growth targets of 4-6% for revenue and 6-8% for EBITDA. FY20 is an investment year for CHNG and, as such, revenue growth is likely to remain below the LT target. However, we expect efficiencies to accelerate CHNG’s growth in FY21 and beyond.
■ Attractive FCF Profile Should Drive Quick Deleveraging. We estimate net leverage at 4.5x, relatively higher than its HCIT peers. However, we expect CHNG to apply its strong FCF generation toward de-leveraging.
■ Initiate with an Outperform Rating and $18 PT. Our $18 TP is based on 9.5x our CY21 EBITDA estimate. This is roughly a 20% discount to closest-comparable CERN’s current multiple. Risks include current investments not yielding desired results and high leverage limiting financial flexibility.
Share price performance
CH N G.O Q S& P 5 0 0 IN D EX
Ju n - 1 9 Ju l - 1 9 Ju l - 1 9 Ju l - 1 91 3 .5
1 4 .0
1 4 .5
1 5 .0
1 5 .5
On 18-Jul-2019 the S&P 500 INDEX closed at 2995.95Daily Jun27, 2019 - Jul18, 2019, 06/27/19 = US$15.0
Quarterly EPS Q1 Q2 Q3 Q42019A - - - -2020E 0.34 0.32 0.37 0.442021E 0.31 0.32 0.38 0.43
Financial and valuation metricsYear 3/19A 3/20E 3/21E 3/22EEPS (CS adj.) (US$) 3.56 1.48 1.44 1.54Prev. EPS (US$) - - - -P/E (x) 3.8 9.2 9.5 8.8EV/SALES 3.0 3.0 2.8 2.7Revenue (US$ m) 3,281.7 3,323.6 3,475.9 3,638.7EBITDA (US$ m) 935.0 990.4 1,060.6 1,134.4EBITDA margin (%) 28.5 29.8 30.5 31.2EV/EBITDA (current) 10.6 8.9 7.9 7.0ROIC (%) 13.00 13.24 12.19 13.28
Number of shares (m) 300.76 IC (current, US$ m) 4,870.89Source: Company data, Refinitiv, Credit Suisse estimates
22 July 2019
Change Healthcare (CHNG) 2
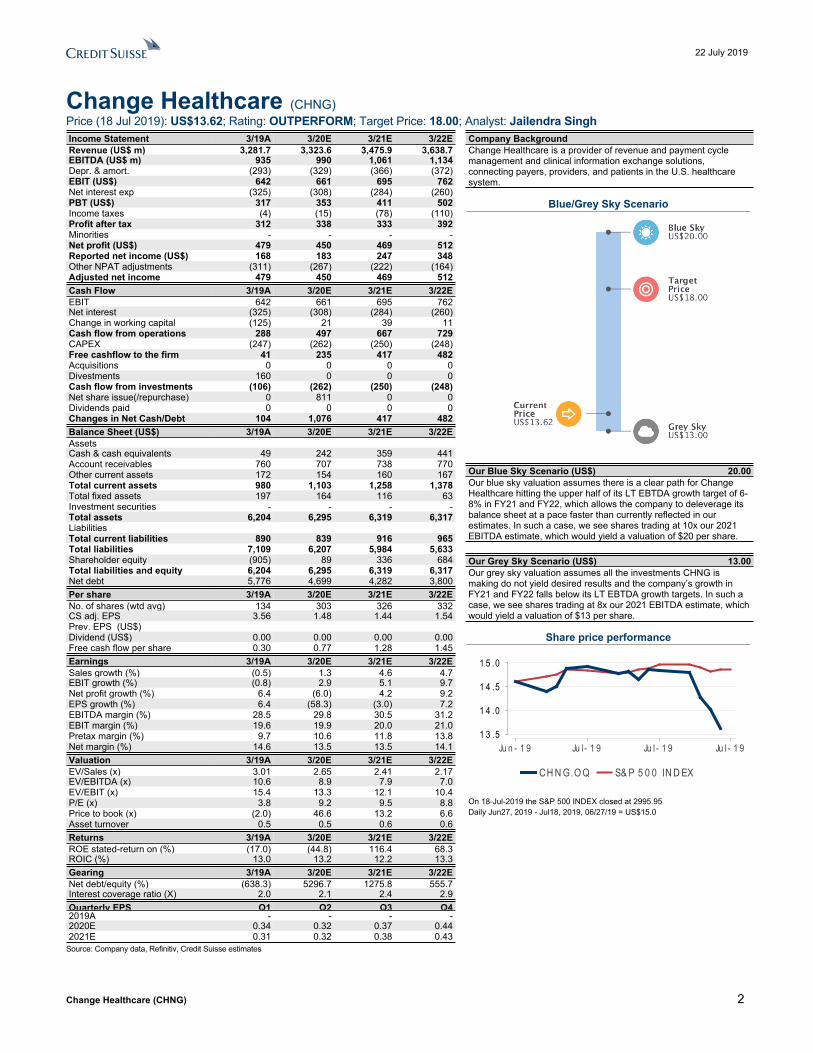
Change Healthcare (CHNG)Price (18 Jul 2019): US$13.62; Rating: OUTPERFORM; Target Price: 18.00; Analyst: Jailendra SinghIncome Statement 3/19A 3/20E 3/21E 3/22ERevenue (US$ m) 3,281.7 3,323.6 3,475.9 3,638.7EBITDA (US$ m) 935 990 1,061 1,134Depr. & amort. (293) (329) (366) (372)EBIT (US$) 642 661 695 762Net interest exp (325) (308) (284) (260)PBT (US$) 317 353 411 502Income taxes (4) (15) (78) (110)Profit after tax 312 338 333 392Minorities - - - -Net profit (US$) 479 450 469 512Reported net income (US$) 168 183 247 348Other NPAT adjustments (311) (267) (222) (164)Adjusted net income 479 450 469 512Cash Flow 3/19A 3/20E 3/21E 3/22EEBIT 642 661 695 762Net interest (325) (308) (284) (260)Change in working capital (125) 21 39 11Cash flow from operations 288 497 667 729CAPEX (247) (262) (250) (248)Free cashflow to the firm 41 235 417 482Acquisitions 0 0 0 0Divestments 160 0 0 0Cash flow from investments (106) (262) (250) (248)Net share issue(/repurchase) 0 811 0 0Dividends paid 0 0 0 0Changes in Net Cash/Debt 104 1,076 417 482Balance Sheet (US$) 3/19A 3/20E 3/21E 3/22EAssetsCash & cash equivalents 49 242 359 441Account receivables 760 707 738 770Other current assets 172 154 160 167Total current assets 980 1,103 1,258 1,378Total fixed assets 197 164 116 63Investment securities - - - -Total assets 6,204 6,295 6,319 6,317LiabilitiesTotal current liabilities 890 839 916 965Total liabilities 7,109 6,207 5,984 5,633Shareholder equity (905) 89 336 684Total liabilities and equity 6,204 6,295 6,319 6,317Net debt 5,776 4,699 4,282 3,800Per share 3/19A 3/20E 3/21E 3/22ENo. of shares (wtd avg) 134 303 326 332CS adj. EPS 3.56 1.48 1.44 1.54Prev. EPS (US$)Dividend (US$) 0.00 0.00 0.00 0.00Free cash flow per share 0.30 0.77 1.28 1.45Earnings 3/19A 3/20E 3/21E 3/22ESales growth (%) (0.5) 1.3 4.6 4.7EBIT growth (%) (0.8) 2.9 5.1 9.7Net profit growth (%) 6.4 (6.0) 4.2 9.2EPS growth (%) 6.4 (58.3) (3.0) 7.2EBITDA margin (%) 28.5 29.8 30.5 31.2EBIT margin (%) 19.6 19.9 20.0 21.0Pretax margin (%) 9.7 10.6 11.8 13.8Net margin (%) 14.6 13.5 13.5 14.1Valuation 3/19A 3/20E 3/21E 3/22EEV/Sales (x) 3.01 2.65 2.41 2.17EV/EBITDA (x) 10.6 8.9 7.9 7.0EV/EBIT (x) 15.4 13.3 12.1 10.4P/E (x) 3.8 9.2 9.5 8.8Price to book (x) (2.0) 46.6 13.2 6.6Asset turnover 0.5 0.5 0.6 0.6Returns 3/19A 3/20E 3/21E 3/22EROE stated-return on (%) (17.0) (44.8) 116.4 68.3ROIC (%) 13.0 13.2 12.2 13.3Gearing 3/19A 3/20E 3/21E 3/22ENet debt/equity (%) (638.3) 5296.7 1275.8 555.7Interest coverage ratio (X) 2.0 2.1 2.4 2.9Quarterly EPS Q1 Q2 Q3 Q42019A - - - -2020E 0.34 0.32 0.37 0.442021E 0.31 0.32 0.38 0.43
Company BackgroundChange Healthcare is a provider of revenue and payment cycle management and clinical information exchange solutions, connecting payers, providers, and patients in the U.S. healthcare system.
Blue/Grey Sky Scenario
Our Blue Sky Scenario (US$) 20.00Our blue sky valuation assumes there is a clear path for Change Healthcare hitting the upper half of its LT EBTDA growth target of 6-8% in FY21 and FY22, which allows the company to deleverage its balance sheet at a pace faster than currently reflected in our estimates. In such a case, we see shares trading at 10x our 2021 EBITDA estimate, which would yield a valuation of $20 per share.
Our Grey Sky Scenario (US$) 13.00Our grey sky valuation assumes all the investments CHNG is making do not yield desired results and the company’s growth in FY21 and FY22 falls below its LT EBTDA growth targets. In such a case, we see shares trading at 8x our 2021 EBITDA estimate, which would yield a valuation of $13 per share.
Share price performance
CH N G.O Q S& P 5 0 0 IN D EX
Ju n - 1 9 Ju l - 1 9 Ju l - 1 9 Ju l - 1 91 3 .5
1 4 .0
1 4 .5
1 5 .0
1 5 .5
On 18-Jul-2019 the S&P 500 INDEX closed at 2995.95Daily Jun27, 2019 - Jul18, 2019, 06/27/19 = US$15.0
Source: Company data, Refinitiv, Credit Suisse estimates

22 July 2019
Change Healthcare (CHNG) 3
Table of contentsKey Charts 4
Executive Summary 5
Investment Thesis 7
Favorable Industry Trends .......................................................................................7
Offering Comprehensive End-to-End Solutions for Complex Workflows .................7
Leading Clinical and Financial Healthcare Network Provides Scale Advantages....8
High Customer Retention Rate, with Predictable Financial Model...........................8
Cross-Selling Opportunity ........................................................................................9
Synergies and Operational Leverage to Drive Earnings Growth .............................9
M&A Strategy Designed to Fuel Growth ..................................................................9
Investment Risks 11
FY20 is Still an Investment Year ............................................................................11
High Leverage........................................................................................................11
Price Performance and Valuation 12
Detailed Company Overview 14
Software & Analytics (S&A) Segment ....................................................................14
Network Solutions Segment...................................................................................16
Technology-Enabled Services (TES) Segment......................................................17
Organizational Structure ........................................................................................18
Initial Public Offering (IPO).....................................................................................20
Financials 21
Software & Analytics (S&A) Segment Financials ...................................................21
Network Solutions Segment Financials..................................................................21
Technology-Enabled Services Segment Financials...............................................21
Industry Trends 22
PEERs Analysis 25
Financial Models 26

22 July 2019
Change Healthcare (CHNG) 4
Key ChartsFigure 1: 2018 Revenue % by Segment Figure 2: EBITDA % by Segment
S&A Segment,
51%
Network Solutions Segment,
19%
TES Segment,
30%
S&A Segment,
54%
Network Solutions Segment,
30%
TES Segment,
16%
Source: Company data, Credit Suisse Source: Company data, Credit Suisse
Figure 3: Adjusted EBITDA Margin Trend
28.8%
31.2%30.7%
32.2%
33.1%
33.9%
2017 2018 2019E 2020E 2021E 2022E
Source: Company data, Credit Suisse estimates

22 July 2019
Change Healthcare (CHNG) 5
Executive SummaryWe initiate coverage with an Outperform rating and an $18 target price.
Change Healthcare is a leading independent healthcare technology platform that provides data- and analytics-driven solutions to improve clinical, financial and patient engagement outcomes in the US healthcare system. It offers a comprehensive suite of software, analytics, technology-enabled services and network solutions aimed at improving results in the complex workflows of the healthcare system for payers and providers. The key US healthcare industry trends supporting Change Healthcare’s growth prospects include: a) reducing unnecessary spending amidst rising costs, b) a growing population of chronically ill and higher-risk patients, c) increasing adoption of value-based care and reimbursement models, d) increasing financial responsibility of patients and consumerism of healthcare services, and e) the proliferation of healthcare data.
Change Healthcare primarily operates its business via three operating segments: Software & Analytics (S&A), Network Solutions, and Technology-Enabled Services (TES). The company’s S&A segment, which represents 51% of CHNG’s revenue, offers key solutions for providers and payers including optimizing payment workflow, decision around financial administrative processes, clinical decision making, executing on value-based reimbursement model, and patient engagement. This business includes some of the Change’s fastest-growing franchises. With the attributes being very similar to a SaaS company, S&A achieves very healthy margins and represents roughly 54% of the company’s overall earnings. CHNG’s Network Solutions segment (roughly 19% of revenues) connects almost all of the US healthcare system. This segment provides the CHNG access to more data in a relatively timely manner, which it leverages across its other segments. Network Solutions has been growing for over a decade and achieves a very healthy margin, resulting in the segment representing 30% of CHNG’s earnings. The TES segment represents 30% of the company’s revenues and 16% of its earnings. This segment’s relatively lower margin is primarily a function of its higher labor component. However, the TES segment allows CHNG to provide clients flexibility to buy either modular solutions or complete end-to-end solutions.
Change Healthcare’s products and services are already well-embedded in the US healthcare ecosystem across providers, payers, patients and hospitals. Change Healthcare has breadth and scale across financial, clinical and operational IT products and services that address diverse industry challenges and client needs. The company facilitates nearly 14 billion healthcare transactions and approximately $1 trillion in adjudicated claims (approximately one-third of all US healthcare expenditure). The company’s customer base includes approximately 2.2K government and commercial payer connections, 900K physicians, 118K dentists, 33K pharmacies, 5.5K hospitals and 600 laboratories. 19 of the top 20 US payers leverage the company’s payment accuracy solutions. Nine of the top 10 Medicare Advantage (MA) plans use the company’s risk, quality and engagement solutions. The company’s network touches 211 million unique patients with coverage spanning across all 50 states and 90% of all US counties. Change Healthcare’s broad network connectivity combined with its use of artificial intelligence (AI) and machine learning (ML) enables it to regularly improve its solutions and uncover new insights as its customers’ needs evolve. The company’s deep reach across the healthcare ecosystem, and its history of driving innovations, position it to be a preferred partner for its customers. By way of background, about 60% of CHNG’s revenue is attributable to providers, while the remaining 40% is attributable to payers.
Change Healthcare has an attractive operating profile given the recurring nature of a significant portion of its revenue, combined with a scalable financial model. The company’s revenue is largely derived from predictable transactional, monthly-subscription and per-click formats, as well as contingency-based or long-term contracts. As a result, almost 88% of the company’s revenue is recurring. The company’s customer base is also

22 July 2019
Change Healthcare (CHNG) 6
highly diversified, with no single customer representing more than 4% of its revenue. The company’s customer retention rate for its top 50 provider and top 50 payer customers has been close to 100% in recent years. The average tenure of its top 10 customers is 20+ years.
Change Healthcare targets long-term revenue growth of 4-6%. It expects this, combined with synergies and operational efficiency, to translate into long-term EBITDA growth of 6-8%. The company’s long-term growth outlook excludes M&A opportunities; it acquired and integrated 14 businesses between 2012 and 2018.
Given the lack of trading history, we benchmark CHNG shares against its closest peer, CERN, which trades at roughly 12x 2020 EBITDA (FactSet consensus). However, given FY20 is a transition year for CHNG and due to its relatively high leverage, we believe the shares should trade at a ~20% discount to CERN shares, implying an EV/EBITDA of 9.5x on our CY2021 EBITDA estimate, resulting in our $18 target price which implies roughly 33% upside potential.
Risks to our Outperform rating and target price for Change Healthcare include the company’s current investments not yielding desired results and the company’s high leverage limiting financial flexibility. For instance, FY20 (ends March 31) is still a “build” year for Change Healthcare and, as such, revenue growth is likely to remain below its long-term target of 4-6%; our estimate is 1.2%. The company is taking steps this year to 1) strengthen its Intelligent Healthcare Platform; 2) transform underperforming businesses to reposition them for growth; 3) create new enterprise sales capabilities; and 4) expand its solutions set through innovative partnerships and strategic relationships. It is investing in improving the Revenue Cycle Management (RCM) service, repositioning its print business through investments in differentiated technology and products to align with the market shift towards digital communication, and transforming the imaging business to an enterprise cloud-based solution. If any of these initiatives or investments does not spark the growth the company expects, the company’s top-line growth could remain below its long-term target. However, FY20 EBITDA growth should be relatively closer to its LT target of 6-8% (we estimate 5.9%) as it benefits from operating efficiency and synergies.
Change Healthcare’s current leverage at 4.5x is high compared to the Healthcare IT peers, many of which have no leverage. The company has laid out a plan to de-lever fairly quickly. CHNG has a stable capital structure (currently rated B2 by Moody’s and B+ by S&P), significant access to cash and a strong operating cash flow and free cash flow profile. We expect the company to use its FCF to pay down debt. As a result, we estimate the company’s leverage improves to 3.4x in FY22. However, this de-leveraging plan is contingent on achieving LT growth rates, which may not happen if investments do not have the expected impact on returns.

22 July 2019
Change Healthcare (CHNG) 7
Investment ThesisFavorable Industry TrendsChange Healthcare competes in the market for data- and analytics-driven solutions to the healthcare industry that help providers deliver clinically appropriate care, increase efficiency and reduce unnecessary medical spend. Given the significant and lasting financial burden of rising costs, both government/commercial payers and providers are increasingly focused on reducing costs attributable to administrative complexity and errors, excessive manual labor, and uncoordinated care.
Another key industry driver that should propel growth for Change Healthcare is the growing population of chronically ill and higher-risk patients in the US. Providers and payers need tools to onboard and manage these populations, including the ability to deliver appropriate care for medically-complex patients, and the ability to document risk and outcomes to attain the appropriate reimbursement rates associated with these populations.
Further, Change Healthcare also stands to benefit from the increasing adoption of value-based care and reimbursement models. Both public and private sectors are shifting towards alternative payment models designed to incentivize value and quality throughout an “episode of care.” Many payers and providers are still building the capabilities, expertise and administrative processes to manage these changes adequately. They are partnering increasingly with third parties to demonstrate the achievement of the outcomes required under these value-based payment models, which requires a fundamentally different skillset than has been deployed historically.
Additionally, increasing consumerism of healthcare services is creating a need for personalized solutions and cost, quality, transparency, and decision support tools. Finally, the proliferation of healthcare data is resulting in companies seeking ways to utilize data and identify insights that improve outcome and decrease costs, thus driving a need for Change Healthcare’s software and analytics solutions.
Offering Comprehensive End-to-End Solutions for Complex WorkflowsChange Healthcare provides data- and analytics-driven solutions to improve clinical, financial and patient engagement outcomes in the US healthcare system. The company offers a comprehensive suite of software, analytics, technology-enabled services and network solutions that are designed to improve clinical decision making, simplify billing, collection and payment processes, and enable a better patient experience.
Change Healthcare offers comprehensive, end-to-end solutions with modular capabilities to address its customers’ needs. The company’s offerings range from discrete data and analytics solutions to broad enterprise-wide solutions. As payers and providers become larger and more sophisticated and manage increasingly complex workflows, they will increasingly seek strategic partners with scale and comprehensive, high-value solutions.
Change Healthcare deploys its solutions through complementary software and analytics, technology-enabled services and a network delivery model with the power to target the broad organizational needs of customers such as improved revenue opportunities or reduced operational costs. At the same time, the company’s solutions are modular and flexible, providing the company the ability to address a customer’s needs whether that is a point solution or an end-to-end comprehensive set of products and services. In addition, the company has the ability to deliver integrated solutions throughout its business.

22 July 2019
Change Healthcare (CHNG) 8
Leading Clinical and Financial Healthcare Network Provides Scale AdvantagesChange Healthcare’s Intelligent Healthcare Network is one of the largest clinical and financial healthcare networks in the United States. The company facilitates nearly 14 billion healthcare transactions and approximately $1 trillion in adjudicated claims or approximately one-third of all US healthcare expenditures. The company serves the vast majority of US payers and providers. Its customer base includes approximately 2,200 government and commercial payer connections, 900,000 physicians, 118,000 dentists, 33,000 pharmacies, 5,500 hospitals and 600 laboratories. This network transacts clinical records for over 112 million unique patients, more than one-third of the estimated total US population. The company’s payment accuracy solutions are embedded in the workflows of 19 of the 20 largest US commercial payers based on covered lives, while its decision support solutions are used by over 4,600 hospitals and facilities, and health plans covering over 100 million members. The company’s broad network connectivity combined with its use of artificial intelligence (AI) and machine learning (ML) enables it to regularly improve its solutions and uncover new insights as its customers’ needs evolve. The company’s deep reach across the healthcare ecosystem, and its history of driving innovations, position it to be a preferred partner for its customers.
Figure 4: Mission-Critical Partner to the Healthcare Industry
Source: Company data
High Customer Retention Rate, with Predictable Financial ModelChange Healthcare has an attractive operating profile given the predictable, recurring nature of a significant portion of its revenue combined with a scalable financial model. The company’s revenue is largely derived from recurring transactional, monthly-subscription and per-click formats, as well as contingency-based or long-term contracts. For the fiscal year ended March 31, 2019, roughly 88% of the company’s revenue was recurring.
The company’s customer base is also highly diversified as no single customer represents more than 4% of its revenue. Change Healthcare’s customer retention rate for its top 50 provider and top 50 payer customers has been almost 100% in recent years. In fact, the average tenure of the company’s top 10 customers has been 20+ years. The company’s high customer retention rates and predictable revenue streams, together with a scalable and capital efficient operating model, provide visibility into its financial results.
22 July 2019
Change Healthcare (CHNG) 9
Cross-Selling OpportunityChange Healthcare has significant opportunities to expand the suite of services that its long-tenured and highly loyal customer base purchases through focused cross selling. The company’s sales force is focused on expanding the scope and depth of its customer relationships. While the company serves a broad array of providers and payers, several of the company’s clients are still under-penetrated in terms of leveraging the company’s full suite of products and services. With Change Healthcare’s continuing focus of deepening its relationship with its customers and the stickiness of the company’s clients, we expect the company’s top-line to continue to benefit from its cross-selling efforts across its customer base.
Synergies and Operational Leverage to Drive Earnings GrowthIn connection with the McKesson and Change Healthcare transaction announced in March of 2017, Change Healthcare identified opportunities to implement certain cost synergies driven by: a) product integration; b) network efficiencies and combining common products; c) procurement savings from the elimination of duplicate orders, leveraging scale and optimization of providers; d) utilization of global talent; and (iv) reduction of management redundancies and duplicative roles. The company expects to generate approximately $150 million in annual run-rate synergies, of which the company has realized approximately $64 mln through the end of FY19. We expect the company to realize an additional $86 mln of synergy opportunity in FY20 and FY21.
Broadly, the company continues to streamline costs and has instituted cost improvement initiatives throughout the organization. Since creating the joint venture between MCK’s technology business and Change Healthcare, CHNG has identified and executed a number of initiatives to improve its operational efficiency and positively impact its operating margins while making significant investments to support its long-term growth. As part of its strategy, Change Healthcare is repositioning certain underperforming solutions to better address end market dynamics and to improve the long-term growth potential of these solutions. CHNG’s FY19 margins declined Y/Y, as the company’s investments and margin drag from the underperforming businesses more than offset synergy-related margin expansion and margin improvement in outperforming businesses. As the company continues to orient its sales efforts to fully capitalize on its expanded customer value proposition and capture opportunities, the company’s margin trends should improve in FY20 and beyond.
M&A Strategy Designed to Fuel GrowthChange Healthcare has strategically focused on key M&A that has helped fuel rapid growth. Since 2012, Change Healthcare has acquired and integrated 14 businesses. The company uses rigorous criteria to evaluate M&A opportunities, which has allowed the company to leverage synergies and further develop customer reach. Historically, the company has approached some of these acquisitions in a “Partnership-First” manner. By doing this, Change Healthcare is able to reduce risk and exposure that the company may face on any acquisition.
Some of Change Healthcare’s major acquisitions include HealthQx and NDSC. The acquisition of HealthQx helped Change Healthcare add new payers which increased the amount of people the company’s platform covers. Similarly, the purchase of NDSC helped expand customer reach and accelerate revenue growth. The acquisition of NDSC started out as a partnership and then transitioned into an acquisition. Separately, eRx Network presents a future M&A opportunity that is a result of the McKesson transaction. The company was spun-out of legacy Change Healthcare prior to the McKesson transaction

22 July 2019
Change Healthcare (CHNG) 10
and the Change Healthcare subsidiary has an option to acquire it at an exercise price of $1.00 for the first $14 mln in eRx adjusted EBITDA plus a market-based multiple of incremental eRx LTM adjusted EBITDA, which we estimate would be highly accretive to CHNG upon execution. eRx provides claims processing and editing, real-time insurance verification, e-prescribing, and medical and vaccination claims billing. Therefore, exercising this option would provide comprehensive, flexible solutions for pharmacies, efficiency through integration with CHNG’s existing pharmacy workflows and access to all major US third-party processors. However, certain terms must be met before this option can be exercised, specifically that McKesson has less than a 5% ownership interest in Change Healthcare.

22 July 2019
Change Healthcare (CHNG) 11
Investment RisksFY20 is Still an Investment YearFY20 (ends March 31, 2020) is still a “build” year for Change Healthcare as the company’s revenue growth is likely to remain below its long-term target of 4-6%, with our current estimate being 1.2%. Specifically, the company is taking steps this year to 1) strengthen its Intelligent Healthcare Platform; 2) transform underperforming businesses to reposition them for growth; 3) create new enterprise sales capabilities; and 4) expand its solutions set through innovative partnerships and strategic relationships. The company is investing in improving the Revenue Cycle Management (RCM) service, building out print capabilities and transforming the imaging business to an enterprise cloud-based solution. Currently CHNG is the largest healthcare-focused print communication vendor in the industry with 1.3 billion pieces printed annually. However, with healthcare patients embracing digital communication capabilities and payers placing great importance on member engagement and experience the market has shifted over time. CHNG is repositioning the print capabilities to be in line with this market shift through investments in differentiated technology and products. These three services/products (RCM, Print, and Imaging) combined make up approximately 40% of revenues. If any of these initiatives or investments do not drive the growth the company expects, the company’s top-line growth could remain below its long-term target.
High LeverageChange Healthcare’s current leverage at 4.5x is high compared to the Healthcare IT peers, many of which have no leverage. The company has laid out a plan to de-lever fairly quickly. CHNG has a stable capital structure (currently rated B2 by Moody’s and B+ by S&P), significant access to cash and a strong operating cash flow and free cash flow profile. The company’s business model requires moderate capital spending to grow, with capital expenditures of less than 6% of the solutions revenue. We estimate around $235 mln in FCF in FY20 and a further $417 mln in FY21. We expect the company to use its FCF to pay down debt. As a result, we estimate the company’s leverage improves to 3.4x in FY22.
However, we note that this de-leveraging plan is contingent on achieving LT growth rates, which may not happen if investments do not have the expected impact on returns as discussed above. If returns are lower than expected, this will lead to reduced operating cash flow, making it more difficult for the company to reduce debt.
Figure 5: CHNG Leverage vs. HCIT Peers (FY20 Net Debt/EBITDA)Company Ticker CS Rating Leverage*Allscripts Healthcare Solutions MDRX Not Covered 1.9xCerner CERN Not Covered 0.0xeHealth EHTH Outperform 0.0xHealthEquity HQY Not Covered 0.0xHMS Holdings HMSY Outperform 0.2xInovalon Holdings INOV Not Covered 3.7xNextGen Healthcare QSII Not Covered 0.0xPremier PINC Outperform** 0.0xR1 RCM RCM Not Covered 1.3xTabula Rasa Healthcare TRHC Not Covered 3.3xTeladoc Health TDOC Neutral 2.9x
Change Healthcare CHNG Outperform 4.5xSource: FactSet, Credit Suisse estimates; * Based on 2020 EBITDA estimates; **Covered by Erin Wright

22 July 2019
Change Healthcare (CHNG) 12
Price Performance and ValuationCHNG shares began trading on June 27, 2019. Since then, the stock has appreciated 4.2%. The S&P 500 is up 19.3% this year to date and the S&P500 HC Index is up 6.4% YTD.
Figure 6: Peers and S&P 500 Price Performance
Company Name Ticker 2010 2011 2012 2013 2014 2015 2016 2017 20182019 YTD*
Allscripts Healthcare Solutions, Inc.
MDRX -4.7% -1.7% -50.3% 64.1% -17.4% 20.4% -33.6% 42.5% -33.7% 14.2%
Cerner Corp. CERN 14.9% 29.3% 26.5% 43.8% 16.0% -6.9% -21.3% 42.3% -22.2% 39.0%
Change Healthcare, Inc.
CHNG - - - - - - - - - 4.2%
Cotiviti Holdings, Inc. COTV - - - - - - 92.8% -6.4% 38.9% -
eHealth, Inc. EHTH -13.6% 3.6% 86.9% 69.2% -46.4% -60.0% 6.7% 63.1% 121.2% 127.5%
HealthEquity Inc. HQY - - - - 50.1% -1.5% 61.6% 15.2% 27.8% 32.7%
HMS Holdings Corp. HMSY 33.0% 48.1% -18.9% -12.4% -6.9% -41.6% 47.2% -6.7% 66.0% 18.3%
Inovalon Holdings, Inc.
INOV - - - - - -37.0% -39.4% 45.6% -5.5% 3.7%
NextGen Healthcare, Inc.
NXGN 11.2% 6.0% -53.1% 21.3% -26.0% 3.4% -18.4% 3.3% 11.6% 30.0%
Premier Inc. PINC - - - 16.0% -8.8% 5.2% -13.9% -3.9% 28.0% 5.2%
R1 RCM, Inc. RCM 25.3% 41.4% -49.6% -20.9% -25.1% -53.4% -29.7% 96.0% 80.3% 62.1%
Tabula Rasa Healthcare, Inc.
TRHC - - - - - - 4.6% 87.2% 127.3% -13.5%
Teladoc Health, Inc. TDOC - - - - - -43.1% -8.1% 111.2% 42.2% 38.9%
Average 11.0% 21.1% -9.7% 25.9% -8.0% -21.4% 4.0% 40.8% 40.2% 30.2%
S&P 500 Health Care Index
0.7% 10.2% 15.2% 38.7% 23.3% 5.2% -4.4% 20.0% 4.7% 6.4%
S&P 500 12.8% -0.0% 13.4% 29.6% 11.4% -0.7% 9.5% 19.4% -6.2% 19.3%
Source: FactSet
*YTD through 07/19/2019; RCM price starting 05/31/2010: PINC price starting 09/30/2013: HQY price starting 08/01/2014: INOV price starting 02/12/2015: TDOC price starting 07/31/2015 COTV priced 05/27/2016 to 08/24/2018: TRHC price starting 09/30/2016; CHNG price starting 06/27/2019
Given the lack of trading history, we benchmark CHNG shares against its closest peer, CERN, which currently trades at roughly 12.0x 2021 EBITDA (FactSet consensus). However, given FY20 is a transition year for CHNG and due to its relatively high leverage, we believe CHNG shares should trade at a ~20% discount to CERN, implying an EV/EBITDA of 9.5x on our 2021 EBITDA estimate, from which we derive our $18 target price which implies roughly 33% upside potential.

22 July 2019
Change Healthcare (CHNG) 13
Figure 7: Comparable AnalysisShare EV/Revenue EV/EBITDA
Company Ticker CS Rating Price 2019E 2020E 2021E 2019E 2020E 2021EAllscripts Healthcare MDRX Not Covered $11.07 1.4x 1.3x 1.3x 8.2x 7.5x 7.1xCerner CERN Not Covered $73.23 4.1x 3.9x 3.6x 14.0x 12.3x 11.7xeHealth EHTH Outperform $87.48 5.4x 4.5x 3.7x 31.2x 21.7x 14.6xHealthEquity HQY Not Covered $79.35 13.9x 12.2x NM 34.5x 28.6x NMHMS Holdings HMSY Outperform $33.43 4.6x 4.3x 3.9x 16.9x 15.2x 13.6xInovalon Holdings INOV Not Covered $14.75 4.7x 4.3x 4.1x 14.8x 13.3x 12.3xNextGen Healthcare QSII Not Covered $19.79 2.3x 2.2x 2.1x 13.2x 11.7x 8.8xPremier PINC Outperform** $39.38 3.0x 4.0x 3.8x 9.2x 8.8x 8.4xR1 RCM RCM Not Covered $12.98 1.4x 1.3x 1.1x 11.2x 7.1x 5.6xTabula Rasa Healthcare
TRHC Not Covered $55.32 4.6x 3.7x 3.1x 33.6x 22.8x 18.6x
Teladoc Health TDOC Neutral $69.02 9.3x 7.6x 6.3x 171.4x 86.0x 60.3x
Change Healthcare* CHNG Outperform $13.52 2.7x 2.6x 2.5x 9.4x 8.7x 8.2xSource: Company data, Credit Suisse estimates; *Based on Calendar Year; **Covered by Erin Wright; Data as of July 18, 2019
Our blue sky valuation assumes there is a clear path for Change Healthcare to achieve the upper end of its LT EBTDA growth target of 6-8% in FY21 and FY22, which allows the company to deleverage its balance sheet at a pace faster than currently reflected in our estimates. In such a case, we assume the shares trade at 10x our 2021 EBITDA estimate, which yields a blue sky value of $20 per share.
Our grey sky valuation assumes all the investments CHNG is making do not yield desired results and the company’s growth in FY21 and FY22 falls below its LT EBTDA growth targets. In such a case, we assume the shares trade at 8x our 2021 EBITDA estimate, which yields our grey sky value of $13 per share.

22 July 2019
Change Healthcare (CHNG) 14
Detailed Company OverviewChange Healthcare offers financial, clinical, and engagement solutions in three business segments: Software & Analytics, Network Solutions, and Technology-Enabled Services. The company utilizes its broad portfolio of solutions to serve stakeholders across the healthcare system, including commercial and government payers, employers, hospitals and health systems, physicians and other providers, pharmacies, labs and consumers.
Figure 8: Change Healthcare’s Modular and Integrated Solutions
Source: Company data
Software & Analytics (S&A) Segment As part of its S&A segment, Change Healthcare provides services which include Network and Financial Management, Risk adjustment, Quality & Engagement, Decision Support, Revenue Cycle Technology, Enterprise Imaging, and Connected Analytics. At a broader level, the segment provides solutions to help customers drive financial performance, improve quality, and succeed in a value-based, consumer driven environment. The segment’s solutions are deeply embedded in its clients’ workflows as it powers critical business functions for the majority of US payers and providers, which makes the company well positioned to innovate. Under this segment, the company provides solutions such as InterQual, ClaimsXten, HealthQx, Assurance, Radiology, Risk Adjustment, & Quality Performance. Under its S&A segment, the company’s payment accuracy solutions are leveraged by 19 of the top 20 US payers . Nine of the top 10 MA plans use CHNG’s risk, quality and engagement solutions. The company also provides clinical decision support to greater than 4,600 hospitals and facilities and health plans covering almost 100 million lives.
Network & Financial ManagementAs part of its Network & Financial Management business, the company provides end-to-end solutions that enable pay to deliver accurate payments. The company also provides analytics to help payers and providers adopt value-based payment models. Finally, as part of this business, the company also provides solutions to help payers optimize provider networks.
The market trends supporting the growth in this segment include increasing pressure to manage costs, focus on reducing payment complexity, enabling payer-provider collaboration, growth from government lives, shift to value-based payment, and importance of the consumer experience.
The company’s competitors in this business include Optum, Equian (acquired by Optum recently), Cotiviti Holdings, HMS Holdings, etc. The fact that the company services 19 of the top 20 US payers and over 175 million members with its payment solutions provides it a strategic advantage over competitors. Payers representing 65 mln commercial lives have chosen Change Healthcare’s value-based payment analytics platform (HealthQx). The company’s end-to-end payment accuracy solutions have a unique ability to drive “pre-emptive” solutions through provider connectivity.

22 July 2019
Change Healthcare (CHNG) 15
Risk Adjustment, Quality & EngagementChange Healthcare also enables risk-bearing entities to address the complex reimbursement and compliance challenges for government-sponsored plans. The company offers a complete set of analytics-driven solutions for member engagement, risk adjustment and quality performance.
The market trends supporting the growth in this segment include expected growth in government lives, increased focus on reducing administrative complexity, continued importance of provider engagement and member experience, focus on Social Determinants of Health (SDoH), and emerging technologies (e.g. AI, NLP).
The company’s competitors in this business include Inovalon, Cotiviti, Optum, Pulse8, and Centauri. The fact that the company serves nine of the top 10 MA plans and top five managed Medicaid health plans provides the company a strategic advantage over its competitors in this segment. The company supports more than 45 mln members across risk, quality, and engagement.
Decision SupportAs part of its Decision Support business, CHNG offers clinical criteria to help payers and providers make clinically appropriate utilization decisions. The company’s integrated solutions deliver medical guidelines to point of care, and automate the authorization process.
The market trends supporting the growth in this segment include increasing pressure to manage costs, growing use of clinical decision support to address inappropriate care, unexplained variance in care, federal mandates, enabling payer-provider collaboration, and emerging technologies.
The company’s competitors in this business include Xsolis and MCG Health. Change Healthcare is the industry leader in evidence-based medical appropriateness criteria (acute and ambulatory). The company provides clinical decision support to over 3,700 acute hospitals, 900 provider facilities, 250 commercial health plans, and CMS.
Revenue Cycle TechnologyChange Healthcare also offers end-to-end workflow and analytics to automate reimbursement and simplify patient collections for hospitals, physician offices, laboratories and other ancillary care providers.
The market trends supporting the growth in this segment include increasing pressure to manage costs, rise in patient payment responsibilities, increasing administrative complexity, increasing focus on value-based payment, and emerging technologies.
The company’s competitors in this business include SSI, nthrive, Experian, Waystar, Epic, and Cerner. More than 2,400 hospitals and health systems use enterprise CHNG’s revenue cycle solutions. The company has almost 80K office-based provider customers. Additionally, leading BPOs leverage CHNG’s technology and intelligence to drive financial performance. CHNG’s technology footprint provides the company leverage for revenue integrity services.
Enterprise ImagingChange Healthcare’s diagnostic imaging solutions help customers improve productivity, optimize performance and enable collaboration across the care continuum.
The market trends supporting the growth in this segment include provider consolidation creating complex system integration, shift from departmental to enterprise imaging solutions, efforts to reduce total imaging costs, and potential to unlock value of imaging data through cloud and AI.

22 July 2019
Change Healthcare (CHNG) 16
The company’s competitors in this business include GE, Carestream, MERGE, AGFA, and Philips Healthcare. CHNG works with >3,300 facilities in the US and Internationally (UK, Ireland, Canada, Australia). The company is the leader in both US radiology systems and the adoption of cardiology reporting, and enables more than 70 mln diagnostic imaging studies/year.
Connected AnalyticsAs part of the Connected Analytics business, CHNG offers analytics solutions to help providers manage total cost of care. The company’s predictive analytics reduce labor costs by forecasting patient demand and optimizing patient flow.
Network Solutions SegmentChange Healthcare’s Network Solutions segment powers financial and clinical data exchange across payers, providers, pharmacies, labs, and consumers. The Change Healthcare network is by far the broadest and deepest network in the country. The company’s network business is characterized by its flywheel effects: a) Scale: efficiently connects across vast majority of payers and providers b) Value of data: controlled use of data to improve the quality and efficiency of healthcare; c) Compounding value: network growth drives better intelligence. The segment’s solutions include Medical EDI Network, Dental EDI Network, B2B payments, C2B payments, MedRx Network, Clinical Network, CommonWell Health Alliance, and Data Solutions. The segment’s customers include hospitals/health systems, government and commercial payers, pharmacies, physician groups, dentists, labs, and vendors.
Change Healthcare leverages its Intelligent Healthcare Network—with an industry-leading nearly 14 billion transactions, approximately $1 trillion in adjudicated claims, and $150 bln in payments distribution—to enable and optimize connectivity and transactions among healthcare system participants and to generate insight using healthcare data to help meet their analytical needs. The company’s network touches 211 mln unique patients with coverage spanning across all 50 states and 90% of all counties in the US.
NetworksChange Healthcare’s Networks business connects payers and providers via intelligent networks to exchange financial and clinical data across medical, dental, pharmacy, lab, and EMR domains. The market trends supporting the growth in this segment include payers deriving more value from networks, increasing transaction volumes (due to age and health of population, increasing utilization, and new transaction types), consolidation in all customer segments, competition from point solutions and vertically-integrated competitors, and reimbursement changes.
CHNG’s competitors in this segment include Availity, Optum, Experian, nthrive, WayStar, etc. in Medical, EDS, dentalxchange, MedRx, OmniSYS, etc. in Dental, and ELLKAY, ATLAS Medical, Liaison, etc. in Clinical Networks. Change Healthcare has by far the largest network offering end-to-end offerings from eligibility/benefits check through billing and payments. The company’s network-driven analytics, RCM software, payment accuracy, and TES solutions make its networks sticky. The company also has a unique differentiation from its comprehensive connectivity with payers, including the “long-tail” of smaller and regional payers. Finally, the company has a channel partner ecosystem with deep integrations spanning more than 700 vendors, including all major EMR vendors.

22 July 2019
Change Healthcare (CHNG) 17
PaymentsChange Healthcare’s Payments business facilitates electronic payments between payers, providers, and consumers utilizing a variety of payment methods.
The market trends supporting the growth in this business include continued shift in payments toward digital (administrative efficiency for payers, acceleration of payments for providers, and convenience for consumers), consumer as payer (rising consumer out-of-pocket responsibility - deductibles, HDHP), employers/payers/providers looking to improve the patient billing and payments experience, and government regulations limiting payer spend on administrative costs, leading payers to focus on electronic payments as a key lever.
CHNG’s competitors in this business include Softheon, Simplee, Experian, Zelis Healthcare, InstaMed, payspan, SwervePay, Patientco, vpay, etc. Change Healthcare is unique in being able to link payments, member communications, and transactional connectivity together to provide a better and lower-cost end-to-end experience for all stakeholders.
Data SolutionsChange Healthcare’s Data Solutions segment enables use of network generated de-identified data for carefully controlled uses that benefit healthcare stakeholders and help improve the quality and efficiency of healthcare.
The market trends supporting the growth in this segment include information asymmetry in healthcare (fragmented system, data blocking, regulatory constraints, and proprietary interests), growing understanding of the importance of combining financial and clinical data to get to more effective insights, shift toward AI/Machine Learning, which requires massive volume of data, rise in consumerism, and continued investments in new frontiers that leverage data (genomics, personalized medicine, clinical trials recruitment, etc.).
CHNG’s competitors in this segment include IBM, Milliman, Optum, AdvisoryBoard, Allscripts, Cerner, healthverity, prognos, practicefusion, etc.
Technology-Enabled Services (TES) SegmentThrough its TES segment, Change Healthcare provides solutions for revenue cycle and practice management, value-based care enablement, communications and payments, pharmacy benefits administration and consulting. The segment’s solutions include Hospital RCM service, Physician Group RCM service, Communications and Payment Services, Value-based Care enablement, Consulting, and Rx Benefits Administration Services. The segment’s customers include hospitals/health systems, physician groups, government and commercial payers, and alternative care sites. The segment is primarily centered around the health care financial transaction and is characterized by: a) longevity and dependability (over 30 years of provider revenue management); b) scale (one of largest providers of administrative and financial services to health care providers); and c) breadth and depth (comprehensive solutions). Change Healthcare is the leader in physician revenue cycle outsourcing market. The company processes $34 bln in annual charges, $9.2 bln in annual collections, and 207 mln in annual cases/procedures.
RCM ServicesUnder its RCM Services business, Change Healthcare performs operational functions across the revenue cycle to maximize collections from payers and patients.
The market trends supporting the growth in this segment include increasing reimbursement pressure (with rise of value-based care models), increasing prevalence of high deductible plans driving provider bad debt, provider consolidation and practice aggregation, increased focus on risk sharing, and growth of end-to-end outsourcing in health systems.

22 July 2019
Change Healthcare (CHNG) 18
CHNG’s competitors in this business include R1, nthrive, Epic, athenahealth, OptumInsight, Cerner, NextGen Healthcare, Intermedix, etc. As noted, Change Healthcare is the current market leader in physician RCM services market, and is among top 10 players in Hospital/Health system RCM services market.
Communications & Payment ServicesChange Healthcare also provides services related to informing patients of administrative and financial healthcare information and driving collections on patient liability.
The market trends supporting the growth in this segment include increase in patient out-of-pocket costs with rise of high-deductible plans, healthcare patients embracing digital communication capabilities, bundling of patient communications and patient payment solutions, and payers placing great importance on member engagement and experience.
CHNG’s competitors in this segment include Shutterfly, Fiserv, Softheon, Patientco, FSSI, payspan, InstaMed, etc. Change Healthcare is the largest healthcare-focused print communications vendor in the industry (1.3 bln pieces annually). The company is the only vendor in Healthcare offering both paper statements and digital payments capabilities.
Payer ServicesPayer Services business includes CHNG’s payer and advisory services, including value-based care enablement, pharmacy benefits, and consulting.
The market trends supporting the growth in this segment include continued payer consolidation, continued growth in government lives, government regulations limiting payer spend on administrative costs, and regulatory tailwinds continuing shift to value-based care, precipitating need for provider-payer collaboration.
CHNG’s competitors in this segment include Optum, Evolent Health, Cognizant, EnvisionRx, Deloitte, MagellanRx management, fluidEDGE consulting, etc. Change Healthcare has carved out a niche position in consulting / advisory services, payer services, and emerging value-based care enablement market. The company is among the top two players in the market in pharmacy benefits administration.
Organizational StructureOn March 1, 2017, McKesson Corporation and Change Healthcare (formerly HCIT Holdings) completed a transaction whereby the majority of McKesson’s Technology Solutions segment (“Core MTS”) and substantially all of Change Healthcare Performance (formerly Change Healthcare)’s legacy business (“Legacy CHC”) established a joint venture, Change Healthcare. Prior to and immediately following the IPO offering, Change Healthcare Inc. and McKesson each hold a 50% voting interest in the joint venture, with equal representation on the joint venture’s board of directors and with all major operating, investing and financial activities requiring the consent of both members.
The limited liability company agreement of the joint venture provides for a single class of membership interests, referred as “LLC Units.” Prior to the IPO offering, Change Healthcare held approximately 30% of the issued and outstanding LLC Units and McKesson held approximately 70% of the outstanding LLC Units. Post-offering organizational structure (commonly referred to as an umbrella partnership C-corporation or UP-C structure), McKesson holds approximately 60% of the outstanding LLC units.
According to Change Healthcare, McKesson generally finds it advantageous, in periods prior to the Qualified McKesson Exit, to continue to hold its equity interests in an entity that is not taxable as a corporation for US federal income tax purposes. Change Healthcare does not believe that its UP-C organizational structure will give rise to any significant business or strategic benefit or detriment to the company.

22 July 2019
Change Healthcare (CHNG) 19
Following the 180-days expiration of the underwriter lock-up period in connection with the IPO offering, subject to the terms and subject to the conditions provided in the LLC Agreement, McKesson may, at its election, initiate and complete a spin-off or split-off transaction (or a combination of the foregoing) that would result, among other things, in the acquisition by Change Healthcare of all of McKesson’s LLC Units and the issuance by Change Healthcare to McKesson and/or McKesson’s shareholders of an equal number of shares of its common stock (a “Qualified McKesson Exit”).
In connection with a Qualified McKesson Exit, McKesson would contribute the stock of McKesson subsidiaries that own all of McKesson’s interests in the joint venture to a Delaware corporation that is McKesson’s direct or indirect wholly-owned subsidiary (“SpinCo”) and then would either distribute stock of SpinCo to the stockholders of McKesson as a dividend in a spin-off, commence one or more exchange offers pursuant to which McKesson will exchange stock of SpinCo for stock of McKesson held by the stockholders of McKesson or consummate one or more exchanges of stock of SpinCo for debt securities of McKesson (or a combination of the foregoing). Immediately thereafter, SpinCo would merge with and into Change Healthcare, pursuant to which the stockholders of SpinCo will be entitled to receive a number of shares of common stock of Change Healthcare equal to the number of LLC Units held by SpinCo at the effective time of the Merger.
Following a Qualified McKesson Exit, Change Healthcare LLC is expected to become a consolidated subsidiary of Change Healthcare.
In addition, following the IPO offering, on the terms and subject to the conditions provided in the LLC Agreement, McKesson (or certain permitted transferees) now has the right from time to time to exchange its LLC Units for shares of Change Healthcare’s common stock on a one-for-one basis, subject to customary conversion rate adjustments for stock splits, stock dividends and reclassifications.
Figure 9: Post-IPO Ownership Structure
Sponsors,Management and
Other Pre-IPO Owners
Change Healthcare, Inc.
Change Healthcare, LLC (the "Joint Venture")
McKesson Corporation("McKesson")
Public Stockholders
Operating Subsidiaries
Common Stock - 75,474,654 shares of common stock (64% of outstanding
common stock)
Common Stock - 42,857,142 shares of common stock (36% of outstanding
common stock)Tangible Equity Units - 5,000,000 Units
(100% of outstanding Units)
LLC Units - 118,331,796 LLC Units (40% of outstanding LLC Units) and
50% voting interest
LLC Units - Exchangeable on a 1-for-1 basis for shares of Common Stock. 175,995,192 LLC Units (60% of outstanding LLC Units)
and 50% voting interest
Source: Company data

22 July 2019
Change Healthcare (CHNG) 20
Figure 10: Ownership Structure Post McKesson’s Qualified Exit
Sponsors,Management and
Other Pre-IPO Owners
Change Healthcare, Inc.
Public Stockholders
Operating Subsidiaries
Change Healthcare, LLC (the "Joint Venture")
Common Stock - 75,474,654 shares of common stock (26% of outstanding
common stock)
Common Stock - 218,852,334 shares of common stock (74% of
outstanding common stock)
LLC Units - 100% of outstanding LLC Units
Source: Company data
Initial Public Offering (IPO) The net proceeds to Change Healthcare from its IPO (priced at $13.00 per share) were approximately $529 mln (or $609 mln if the underwriters exercise in full their option to purchase additional shares of common stock) after deducting underwriting discounts and commissions. The net proceeds to Change Healthcare from the concurrent offering of the Units were approximately $243 mln (or $279 mln if the underwriters in the concurrent offering of the Units exercise in full their option to purchase additional Units) after deducting underwriting discounts and commissions. The company used these proceeds to pay down its term loan.

22 July 2019
Change Healthcare (CHNG) 21
Financials Change Healthcare’s adjusted solutions revenue grew around 0.6% in FY19 (or around 1.8% excluding the Extended Care and other revenue adjustments), as the company continues to strategically position underperforming business segments for future growth. For FY20, we estimate the adjusted solutions revenue growth to remain depressed at 1.2% Y/Y (or 1.3% excluding the Extended Care and other revenue adjustments) as Change Healthcare continues to align itself to take advantage of fast-paced growth in Healthcare IT. Once fully implemented, the company’s revenue should pick up in FY21 to 4.1% Y/Y growth. Even with some revenue losses in FY20, we expect Change Healthcare to post EBITDA growth of 5.6% primarily driven from the abundance of opportunities that can help push short-term productivity. In FY20, we expect the company to continue to re-align and reposition some of its underperforming business segments by shifting them to a long-term growth strategy, which is ultimately reflected in Change Healthcare estimated EBITDA growth rate of 6.6% in FY21.
Software & Analytics (S&A) Segment FinancialsChange Healthcare’s Core Software and Analytics revenue grew approximately 1.5% in FY19 which is slower than we estimate moving forward. We expect to see accelerated growth of 5.0% in FY20 despite a headwind of product overlaps which has resulted in a loss on the bottom line but has helped increase top-line revenue. It is important to note that there is evidence of seasonality in this business segment as the clinical review business ramps up in Q4. We expect to see Q4 FY20 revenue grow at 7.8% Y/Y. This uptick can also be seen in Q4 of 2020 adjusted EBITDA as we estimate that it will grow by $29.1 million to $281.1 million.
Network Solutions Segment FinancialsChange Healthcare’s Network Solutions revenue grew around 6.8% in FY19 as the company looks to capitalize on key drivers such as the B2B payments pushed by the data solutions business segment. We expect Change Healthcare to continue to integrate its various networks into one fully comprehensive site but do not see this in top-line growth until FY20. In FY20 we expect growth to slow at a rate of 3.1%. We assume that by this year its network integration process will help improve efficiency and bolster the networks capability but the full effects will not be seen until FY21. Once fully integrated we expect to see an improved growth rate of 3.3% which is primarily driven by the change in the actual transaction to the insight the company will provide customers. Over time we expect the B2B segments to continue to grow.
Technology-Enabled Services Segment FinancialsChange Healthcare’s Technology-Enabled Services revenue declined roughly 2.0% for FY19. This decline can be attributed to the realignment of the segment as the company looks to diversify its revenue stream away from the ambulatory BTO space. The company is looking to help enhance growth within the print business and we expect this to have a slight impact in FY20 of 0.2% but still expect a decline of 1.8%. In FY20 our estimate includes a $20 million dollar contract expiration. Despite that revenue headwind, we expect to see growth of 3.6% in FY21. The growth can be attributed to the abundance of opportunities to increase productivity gains through AI and RPA.

22 July 2019
Change Healthcare (CHNG) 22
Industry Trends The key industry trends which support Change Healthcare’s growth prospects include: a) reducing unnecessary medical spend amidst rising healthcare costs, b) growing population of chronically ill and higher-risk patients, c) increasing adoption of value-based care and reimbursement models, d) increasing financial responsibility of patients and consumerism of healthcare services, and e) proliferation of healthcare data.
Unnecessary Medical Spending Amidst Rising Costs in U.S. Healthcare System
According to a research by the National Academy of Medicine, 30% of US healthcare spending is unnecessary, implying more than $1 trillion of wasteful healthcare spending in 2018. Examples of wastefulness include failure to adhere to best care practices and lack of care coordination, significant variation among providers in the cost and quality, many inefficient processes that are manual, complex, frequently changing and time consuming. In addition, improper payments, according to the Office of Management and Budget, have represented approximately 10% of all Medicare and Medicaid payments since 2015. Such improper payments and fraudulent billing create costly and labor-intensive follow-up.
According to the Center for Medicare & Medicaid Services (CMS), US healthcare spending is expected to grow at a 5.6% annual growth rate, or 3.2% higher than expected inflation over the same period from 2018 to 2027. Given the significant and lasting financial burden of ongoing rising costs and unnecessary spending on society, both governmental and commercial payers and providers are increasingly focused on reducing costs attributable to administrative complexity and errors, excessive manual labor, and uncoordinated, unproductive, ineffective care the value of which is not well determined or communicated.
Figure 11: Health Care Expenditures ($ in trillions)
2011
2012
2013
2014
2015
2016
2017
2018
2019
E
2020
E
2021
E
2022
E
2023
E
2024
E
2025
E
2026
E
2027
E
$2.2 $2.3 $2.3 $2.5 $2.6 $2.8 $2.9 $3.0 $3.2 $3.3$3.5
$3.7$4.0
$4.2$4.4
$4.7$5.0
Medicare Medicaid CHIP Other Public Private Health Insurance
Source: Company data, Center for Medicare and Medicaid Services

22 July 2019
Change Healthcare (CHNG) 23
Growing Population of Chronically ill and Higher-Risk Patients
While the US population is expected to increase 7% from 2017 to 2027, the population of adults age 65 and older is expected to increase 34% over the same period, according to the US Census Bureau. This part of the population has the highest prevalence of chronic conditions, with average annual healthcare spending approximately three times higher than working adults and approximately five times higher than the under 18 year old demographic, according to CMS. As those older than 65 years of age access complex care at growing rates, they are also increasingly enrolling in managed care plans that bear the likelihood of healthcare utilization. For example, enrollment in Medicare Advantage is expected to increase to 45% of eligible lives by 2027, according to the Congressional Budget Office.
Additionally, government agencies are seeking to more effectively service Dual Eligibles, who are typically among the most chronically ill and disproportionately expensive beneficiaries for both Medicaid and Medicare, and promote avenues to access care in a more efficient and effective way. As the US healthcare system increasingly serves more chronically ill and higher-risk populations as the country’s elderly population continues to grow, providers and payers will need tools to onboard and manage these populations, including the ability to deliver appropriate care for medically-complex patients, and the ability to document risk and outcomes to attain the appropriate reimbursement rates associated with these populations.
Increasing adoption of value-based care and reimbursement models
Both public and private sectors are shifting towards alternative payment models that are designed to incentivize value and quality throughout an “episode of care.” These payment models require a high level of documentation, robust data, sophisticated payment attribution capabilities and advanced analytics that can adapt to new rules and goals to ensure compliance. Many payers and providers are still building the capabilities, expertise and administrative processes to manage these changes adequately. They are increasingly partnering with third parties to demonstrate the achievement of the outcomes required under these value-based payment models, which requires a fundamentally different skillset than has been deployed historically.
Increasing financial responsibility of patients and consumerism in healthcare
As healthcare expenditures have continued to rise, employers and health plans have shifted costs to patients through increased adoption of high-deductible health plans. Increases in patient financial responsibility require providers to obtain payment from the patient before and after the point of care. As providers become more consumer-oriented and retail in nature, they require increasingly sophisticated, dynamic and personalized solutions, which generally necessitate scale to be implemented efficiently and cost effectively. As patients are required to more out of their own pockets for healthcare, they are demanding price transparency and decision support from their health plans. Health plans are consequently partnering with third parties to provide their members with tools that enable them to assess quality and cost based on individual plan benefits. At the same time, providers seek to effectively communicate the quality and value of their services, determine patients’ upfront insurance eligibility, coverage and ability to pay their portion of their healthcare bills, and simplify the payment process to improve patient experience and satisfaction.
Proliferation of healthcare data
The US government funded almost $40 billion of incentive payments to healthcare providers between 2011 and 2017 to adopt electronic health record technology, which has resulted in 80% of physicians and 96% of hospitals in the United States having certified Electronic Health Record systems as of 2017, according to the Office of the National Coordinator for Health Information Technology. These EHRs, other digitized healthcare

22 July 2019
Change Healthcare (CHNG) 24
data and the increasing amount of personal health data from smartphones, wearable and other devices have created unprecedented amounts of healthcare data in the United States, which is expected to grow to more than 2,300 exabytes by 2020, according to the 2014 EMC Digital Universe Study by International Data Corporation. However, healthcare data is often siloed and unstructured and has historically been difficult to understand and use by all constituents on a timely basis.
Advancements in ML and AI are making it easier to cost effectively utilize data at scale in real time to identify actionable insights that help improve outcomes and decrease cost for healthcare constituents. As healthcare data can be used more effectively, the leading technology companies will increasingly seek scaled partners like Change Healthcare to develop new software and analytics solutions that help payers and providers improve workflows to deliver higher quality care at lower cost to consumers.
Change Healthcare continues to develop data-driven solutions that can drive tangible returns for its customers.

22 July 2019
Change Healthcare (CHNG) 25
PEERs AnalysisFigure 12: CHNG PEERs Analysis
Source: Credit Suisse

22 July 2019
Change Healthcare (CHNG) 26
Financial ModelsFigure 13: Annual Income Statement ($ in mlns except per share)
FY18 FY19 FY20E FY21E FY22EAdjusted Solutions revenue $3,024.4 $3,043.1 $3,079.5 $3,206.9 $3,345.4Postage revenue $274.4 $238.6 $244.1 $269.1 $293.3
Total revenue $3,298.8 $3,281.7 $3,323.6 $3,475.9 $3,638.7
Cost of operations (1,390.2) (1,340.0) (1,259.8) (1,272.7) (1,289.3)R&D Expense (221.7) (202.2) (199.6) (197.7) (194.6)Sales, Marketing, G&A (749.8) (821.1) (787.7) (765.1) (774.2)Accretion and changes in estimate with related parties, net49.9 (19.3) (13.4) (12.95) (13.0)Gain on Sale of the Extended Care Business 0.8 111.4 0.0 0.0 0.0Other Income 17.2 18.3 16.0 16.0 16.0Customer Postage Expense (274.4) (238.6) (244.1) (269.1) (293.3)
GAAP EBITDA $730.6 $790.3 $834.9 $974.5 $1,090.5D&A (278.4) (278.0) (295.1) (298.5) (300.5)Amortization of capitalized software developed for sale(18.3) (14.7) (34.1) (67.4) (71.4)
GAAP EBIT $433.9 $497.6 $505.8 $608.6 $718.6
Interest Expense (292.5) (325.4) (308.3) (283.7) (260.4)Pre-Tax Income $141.5 $172.2 $197.4 $324.9 $458.2
Income Tax Expense 51.8 (4.5) (14.7) (78.0) (110.0)GAAP Net Income $193.2 $167.7 $182.8 $246.9 $348.2
Non-Recurring Expenses (Income) for Adjusted EBITDA CalculationTotal Non-Recurring Adjustments 213.4 144.7 155.4 86.2 43.9
Adjusted EBITDA $944.0 $935.0 $990.4 $1,060.6 $1,134.4Adjusted EBIT $647.3 $642.3 $661.2 $694.8 $762.5
After Tax Impact of Non-recurring items 256.6 311.0 267.4 222.2 163.9Adjusted Net Income $449.9 $478.7 $450.2 $469.1 $512.1
Diluted Shares Outstanding 134.4 134.4 303.4 325.9 331.9
GAAP EPS $0.60 $0.76 $1.05Adjusted EPS $1.48 $1.44 $1.54
Margins/Expense Analysis (As a % of Adj Soltns Rev)Cost of Operations 46.0% 44.0% 40.9% 39.7% 38.5%R&D Expense 7.3% 6.6% 6.5% 6.2% 5.8%Sales, marketing, G&A 24.8% 27.0% 25.6% 23.9% 23.1%
EBITDA Margin 24.2% 26.0% 27.1% 30.4% 32.6%Adjusted EBITDA Margin 31.2% 30.7% 32.2% 33.1% 33.9%
Pre-Tax Margin 4.7% 5.7% 6.4% 10.1% 13.7%Effective Tax Rate NM NM 7.4% 24.0% 24.0%
Adjusted Net Margin 14.9% 15.7% 14.6% 14.6% 15.3%
Growth AnalysisAdjusted Solutions revenue 0.6% 1.2% 4.1% 4.3%Postage revenue (13.0%) 2.3% 10.2% 9.0%
Total Revenue (0.5%) 1.3% 4.6% 4.7%
Adjusted EBITDA Growth (1.0%) 5.9% 7.1% 7.0%Adjusted Net Income Growth 6.4% (6.0%) 4.2% 9.2%Adjusted EPS Growth (3.0%) 7.2%
Source: Company data, Credit Suisse Estimates

22 July 2019
Change Healthcare (CHNG) 27
Figure 14: Annual Balance Sheet Statement ($ in mlns)FY18 FY19 FY20E FY21E FY22E
AssetsCash $50.0 $48.9 $242.3 $359.4 $441.2Accounts Receivable 705.5 759.5 $706.8 $738.0 $769.9Prepaid Expenses & Other Current 146.2 172.1 $154.0 $160.3 $167.3
Total Current Assets $901.7 $980.5 $1,103.0 $1,257.7 $1,378.4
PP&E 167.5 197.3 164.0 115.6 62.7Intangibles 1,454.8 1,320.2 1,185.2 1,053.7 938.7Goodwill 3,344.8 3,284.3 3,284.3 3,284.3 3,284.3Other Non-Current Assets, Net 332.0 422.0 559.0 608.0 653.0
Total Assets $6,200.9 $6,204.1 $6,295.4 $6,319.3 $6,317.0
Liabilities & EquityAccounts Payable 84.1 98.6 $82.5 $96.2 $93.7Accrued Expenses 329.3 316.2 $323.3 $352.8 $374.7Deferred Revenues 493.9 437.6 $431.1 $465.0 $495.1Due to Related Party 8.7 34.6 0.0 0.0 0.0Liabilities of business held for sale 0.0 0.0 0.0 0.0 0.0Current Portion of LTD 53.4 2.8 2.0 2.0 2.0
Total Current Liabilities $969.5 $889.8 $839.0 $916.0 $965.5
LTD, excluding Current Portio 5,867.5 5,787.2 4,939.7 4,639.7 4,239.7Tax Receivable Agreement Obligation 223.2 212.7 198.7 188.7 178.7Deferred Tax Liability 112.7 106.1 116.1 126.1 136.1Other Long-Term Liabilities 94.2 113.2 113.2 113.2 113.2Equity (1,066.2) (904.8) 88.7 335.7 683.9Total Liabilities & Equity $6,200.9 $6,204.1 $6,295.4 $6,319.3 $6,317.0
Source: Company data, Credit Suisse Estimates

22 July 2019
Change Healthcare (CHNG) 28
Figure 15: Annual Cash Flow Statement ($ in mlns)FY18 FY19 FY20E FY21E FY22E
Net Income $192.4 $176.7 $182.8 $246.9 $348.2D&A 278.4 278.0 295.1 298.5 300.5Change in Working Capital (103.1) (125.3) $20.8 $39.3 $10.7Other (42.9) (41.7) (2.0) 82.5 70.0Operating Cash Flow $324.8 $287.7 $496.7 $667.2 $729.4
Capital Expenditures (166.6) (247.0) ($261.8) ($250.1) ($247.6)(Acquisitions) / Divestitures (94.5) 159.9 0.0 0.0 0.0Other 0.4 (18.6) 0.0 0.0 0.0Cash from Investing Activities ($260.7) ($105.7) ($261.8) ($250.1) ($247.6)
Debt Paydown (51.0) (153.0) (848.3) (300.0) (400.0)Equity Issuance 0.0 0.0 810.7 0.0 0.0Other (146.5) (29.1) (4.0) 0.0 0.0Cash from Financiang Activities ($197.5) ($182.1) ($41.5) ($300.0) ($400.0)
Effect of exchange rate changes on cash (4.7) (1.0) 0.0 0.0 0.0Net Increase (Decrease) in Cash and Cash Equivalents($138.1) ($1.1) $193.4 $117.1 $81.8
Cash and Cash Equivalents at Beginning of Period 188.1 50.0 48.9 242.3 359.4Cash and Cash Equivalents at End of Period $50.0 $48.9 $242.3 $359.4 $441.2
Source: Company data, Credit Suisse Estimates

22 July 2019
Change Healthcare (CHNG) 29
Companies Mentioned (Price as of 18-Jul-2019)Allscripts Healthcare Solutions Inc. (MDRX.OQ, $11.24)Anthem, Inc. (ANTM.N, $304.57)CVS Health (CVS.N, $56.5)Centene Corporation (CNC.N, $53.17)Cerner Corporation (CERN.OQ, $74.0)Change Healthcare (CHNG.OQ, $13.62, OUTPERFORM[V], TP $18.0)Cigna Corporation (CI.N, $176.94)Cognizant Technology Solutions Corp. (CTSH.OQ, $65.93)General Electric (GE.N, $10.06)HMS Holdings Corp (HMSY.OQ, $33.61)HealthEquity (HQY.OQ, $76.43)Humana Inc. (HUM.N, $283.33)Inovalon Hldg (INOV.OQ, $14.84)International Business Machines (IBM.N, $149.63)Premier Inc (PINC.OQ, $39.71)Quality Systems, Inc (NXGN.OQ, $20.22)R1 RCM (RCM.OQ, $13.08)Tabula Rasa (TRHC.OQ, $55.14)Teladoc Health (TDOC.N, $68.53)UnitedHealth Group Inc. (UNH.N, $260.6)Walgreens Boots Alliance (WBA.OQ, $54.82)WellCare Health Plans, Inc. (WCG.N, $288.4)eHealth (EHTH.OQ, $87.58)
Disclosure AppendixAnalyst Certification Jailendra Singh and A.J. Rice each certify, with respect to the companies or securities that the individual analyzes, that (1) the views expressed in this report accurately reflect his or her personal views about all of the subject companies and securities and (2) no part of his or her compensation was, is or will be directly or indirectly related to the specific recommendations or views expressed in this report.
3-Year Price and Rating History for Change Healthcare (CHNG.OQ)
CHNG.OQ Closing Price Target Price Date (US$) (US$) Rating 01-Jul-19 14.40 R * Asterisk signifies initiation or assumption of coverage.
Closing Price CHNG.OQ
05- Jul- 2019 12- Jul- 201913.5
14.0
14.5
15.0
15.5
REST RIC T ED
As of December 10, 2012 Analysts’ stock rating are defined as follows:Outperform (O) : The stock’s total return is expected to outperform the relevant benchmark* over the next 12 months.Neutral (N) : The stock’s total return is expected to be in line with the relevant benchmark* over the next 12 months.Underperform (U) : The stock’s total return is expected to underperform the relevant benchmark* over the next 12 months. *Relevant benchmark by region: As of 10th December 2012, Japanese ratings are based on a stock’s total return relative to the analyst's coverage universe which consists of all companies covered by the analyst within the relevant sector, with Outperforms representing the most attractive, Neutrals the less attractive, and Underperforms the least attractive investment opportunities. As of 2nd October 2012, U.S. and Canadian as well as European ratings are based on a stock’s total return relative to the analyst's coverage universe which consists of all companies covered by the analyst within the relevant sector, with Outperforms representing the most attractive, Neutrals the less attractive, and Underperforms the least attractive investment opportunities. For Latin American and Asia stocks (excluding Japan and Australia), ratings are based on a stock’s total return relative to the average total return of the relevant country or regional benchmark (India - S&P BSE Sensex Index); prior to 2nd October 2012 U.S. and Canadian ratings were based on (1) a stock’s absolute total return potential to its current share price and (2) the relative attractiveness of a stock’s total return potential within an analyst’s coverage universe. For Australian and New Zealand stocks, the expected total return (ETR) calculation includes 12-month rolling dividend yield. An Outperform rating is assigned where an ETR is greater than or equal to 7.5%; Underperform where an ETR less than or equal to 5%. A Neutral may be assigned where the ETR is between -5% and 15%. The overlapping rating range allows analysts to assign a rating that puts ETR in the context of associated risks. Prior to 18 May 2015, ETR ranges for Outperform and Underperform ratings did not overlap with Neutral thresholds between 15% and 7.5%, which was in operation from 7 July 2011.Restricted (R) : In certain circumstances, Credit Suisse policy and/or applicable law and regulations preclude certain types of communications, including an investment recommendation, during the course of Credit Suisse's engagement in an investment banking transaction and in certain other circumstances.Not Rated (NR) : Credit Suisse Equity Research does not have an investment rating or view on the stock or any other securities related to the company at this time.Not Covered (NC) : Credit Suisse Equity Research does not provide ongoing coverage of the company or offer an investment rating or investment view on the equity security of the company or related products.

22 July 2019
Change Healthcare (CHNG) 30
Volatility Indicator [V] : A stock is defined as volatile if the stock price has moved up or down by 20% or more in a month in at least 8 of the past 24 months or the analyst expects significant volatility going forward.Analysts’ sector weightings are distinct from analysts’ stock ratings and are based on the analyst’s expectations for the fundamentals and/or valuation of the sector* relative to the group’s historic fundamentals and/or valuation:Overweight : The analyst’s expectation for the sector’s fundamentals and/or valuation is favorable over the next 12 months.Market Weight : The analyst’s expectation for the sector’s fundamentals and/or valuation is neutral over the next 12 months.Underweight : The analyst’s expectation for the sector’s fundamentals and/or valuation is cautious over the next 12 months. *An analyst’s coverage sector consists of all companies covered by the analyst within the relevant sector. An analyst may cover multiple sectors.
Credit Suisse's distribution of stock ratings (and banking clients) is:
Global Ratings DistributionRating Versus universe (%) Of which banking clients (%)Outperform/Buy* 46% (33% banking clients)Neutral/Hold* 39% (27% banking clients)Underperform/Sell* 13% (23% banking clients)Restricted 2%*For purposes of the NYSE and FINRA ratings distribution disclosure requirements, our stock ratings of Outperform, Neutral, and Underperform most closely correspond to Buy, Hold, and Sell, respectively; however, the meanings are not the same, as our stock ratings are determined on a relative basis. (Please refer to definitions above.) An investor's decision to buy or sell a security should be based on investment objectives, current holdings, and other individual factors.
Important Global Disclosures Credit Suisse’s research reports are made available to clients through our proprietary research portal on CS PLUS. Credit Suisse research products may also be made available through third-party vendors or alternate electronic means as a convenience. Certain research products are only made available through CS PLUS. The services provided by Credit Suisse’s analysts to clients may depend on a specific client’s preferences regarding the frequency and manner of receiving communications, the client’s risk profile and investment, the size and scope of the overall client relationship with the Firm, as well as legal and regulatory constraints. To access all of Credit Suisse’s research that you are entitled to receive in the most timely manner, please contact your sales representative or go to https://plus.credit-suisse.com . Credit Suisse’s policy is to update research reports as it deems appropriate, based on developments with the subject company, the sector or the market that may have a material impact on the research views or opinions stated herein.Credit Suisse's policy is only to publish investment research that is impartial, independent, clear, fair and not misleading. For more detail please refer to Credit Suisse's Policies for Managing Conflicts of Interest in connection with Investment Research: https://www.credit-suisse.com/sites/disclaimers-ib/en/managing-conflicts.html . Any information relating to the tax status of financial instruments discussed herein is not intended to provide tax advice or to be used by anyone to provide tax advice. Investors are urged to seek tax advice based on their particular circumstances from an independent tax professional.Credit Suisse has decided not to enter into business relationships with companies that Credit Suisse has determined to be involved in the development, manufacture, or acquisition of anti-personnel mines and cluster munitions. For Credit Suisse's position on the issue, please see https://www.credit-suisse.com/media/assets/corporate/docs/about-us/responsibility/banking/policy-summaries-en.pdf . The analyst(s) responsible for preparing this research report received compensation that is based upon various factors including Credit Suisse's total revenues, a portion of which are generated by Credit Suisse's investment banking activities
Target Price and RatingValuation Methodology and Risks: (12 months) for Change Healthcare (CHNG.OQ)
Method: Given the lack of trading history, we benchmark CHNG shares with its closest peers, CERN, which is trading at roughly 12.0x 2021 CY EBITDA consensus. However, given FY20 being a transition year for CHNG and its relatively high leverage, we believe CHNG shares should trade at roughly 20% discount to CERN shares, yielding a PT EV/EBITDA valuation multiple of 9.5x on our 2021 EBITDA estimate and a PT of $18.
Risk: Risks to our Outperform rating and PT include current investments not yielding desired results, and inability to deleverage its balance sheet.
Please refer to the firm's disclosure website at https://rave.credit-suisse.com/disclosures/view/selectArchive for the definitions of abbreviations typically used in the target price method and risk sections. See the Companies Mentioned section for full company names Credit Suisse currently has, or had within the past 12 months, the following as investment banking client(s): CHNG.OQ, EHTH.OQ, CVS.N, CI.N, UNH.N, CTSH.OQ, GE.N, IBM.N, ANTM.NCredit Suisse provided investment banking services to the subject company (CHNG.OQ, EHTH.OQ, CVS.N, CI.N, UNH.N, CTSH.OQ, GE.N, IBM.N, ANTM.N) within the past 12 months.Within the last 12 months, Credit Suisse has received compensation for non-investment banking services or products from the following issuer(s): CVS.N, CI.N, CTSH.OQ, GE.N, IBM.N, ANTM.NCredit Suisse has managed or co-managed a public offering of securities for the subject company (CHNG.OQ, EHTH.OQ, CI.N, UNH.N, GE.N, IBM.N) within the past 12 months.Within the past 12 months, Credit Suisse has received compensation for investment banking services from the following issuer(s): CHNG.OQ, EHTH.OQ, CVS.N, CI.N, UNH.N, CTSH.OQ, GE.N, IBM.N, ANTM.N
22 July 2019
Change Healthcare (CHNG) 31
Credit Suisse expects to receive or intends to seek investment banking related compensation from the subject company (CHNG.OQ, CVS.N, CI.N, UNH.N, WCG.N, HMSY.OQ, PINC.OQ, WBA.OQ, CTSH.OQ, GE.N, IBM.N, ANTM.N) within the next 3 months.Credit Suisse currently has, or had within the past 12 months, the following issuer(s) as client(s), and the services provided were non-investment-banking, securities-related: CVS.N, CI.N, CTSH.OQ, GE.N, IBM.N, ANTM.NCredit Suisse currently has, or had within the past 12 months, the following issuer(s) as client(s), and the services provided were non-investment-banking, non securities-related: CTSH.OQ, GE.N, IBM.NCredit Suisse or a member of the Credit Suisse Group is a market maker or liquidity provider in the securities of the following subject issuer(s): ANTM.N, CVS.N, CNC.N, CHNG.OQ, CI.N, CTSH.OQ, GE.N, HMSY.OQ, HUM.N, IBM.N, PINC.OQ, TDOC.N, UNH.N, WBA.OQ, WCG.N, EHTH.OQA member of the Credit Suisse Group is party to an agreement with, or may have provided services set out in sections A and B of Annex I of Directive 2014/65/EU of the European Parliament and Council ("MiFID Services") to, the subject issuer (CHNG.OQ, EHTH.OQ, CVS.N, CI.N, UNH.N, CTSH.OQ, GE.N, IBM.N, ANTM.N) within the past 12 months.As of the date of this report, Credit Suisse beneficially own 1% or more of a class of common equity securities of (TDOC.N, PINC.OQ).For date and time of production, dissemination and history of recommendation for the subject company(ies) featured in this report, disseminated within the past 12 months, please refer to the link: https://rave.credit-suisse.com/disclosures/view/report?i=443118&v=-3we6h2junszd0wbw4lp0n3h6t . Important Regional Disclosures Singapore recipients should contact Credit Suisse AG, Singapore Branch for any matters arising from this research report.The analyst(s) involved in the preparation of this report may participate in events hosted by the subject company, including site visits. Credit Suisse does not accept or permit analysts to accept payment or reimbursement for travel expenses associated with these events.For Credit Suisse Securities (Canada), Inc.'s policies and procedures regarding the dissemination of equity research, please visit https://www.credit-suisse.com/sites/disclaimers-ib/en/canada-research-policy.html.Investors should note that income from such securities and other financial instruments, if any, may fluctuate and that price or value of such securities and instruments may rise or fall and, in some cases, investors may lose their entire principal investment.This research report is authored by:Credit Suisse Securities (USA) LLC........................................................................Jailendra Singh ; A.J. Rice ; Eduardo Ron ; Caleb Harris, CPAImportant disclosures regarding companies that are the subject of this report are available by calling +1 (877) 291-2683. The same important disclosures, with the exception of valuation methodology and risk discussions, are also available on Credit Suisse’s disclosure website at https://rave.credit-suisse.com/disclosures . For valuation methodology and risks associated with any recommendation, price target, or rating referenced in this report, please refer to the disclosures section of the most recent report regarding the subject company.

22 July 2019
Change Healthcare (CHNG) 32
This report is produced by subsidiaries and affiliates of Credit Suisse operating under its Global Markets Division. For more information on our structure, please use the following link: https://www.credit-suisse.com/who-we-are This report may contain material that is not directed to, or intended for distribution to or use by, any person or entity who is a citizen or resident of or located in any locality, state, country or other jurisdiction where such distribution, publication, availability or use would be contrary to law or regulation or which would subject Credit Suisse or its affiliates ("CS") to any registration or licensing requirement within such jurisdiction. All material presented in this report, unless specifically indicated otherwise, is under copyright to CS. None of the material, nor its content, nor any copy of it, may be altered in any way, transmitted to, copied or distributed to any other party, without the prior express written permission of CS. All trademarks, service marks and logos used in this report are trademarks or service marks or registered trademarks or service marks of CS or its affiliates.The information, tools and material presented in this report are provided to you for information purposes only and are not to be used or considered as an offer or the solicitation of an offer to sell or to buy or subscribe for securities or other financial instruments. CS may not have taken any steps to ensure that the securities referred to in this report are suitable for any particular investor. CS will not treat recipients of this report as its customers by virtue of their receiving this report. The investments and services contained or referred to in this report may not be suitable for you and it is recommended that you consult an independent investment advisor if you are in doubt about such investments or investment services. Nothing in this report constitutes investment, legal, accounting or tax advice, or a representation that any investment or strategy is suitable or appropriate to your individual circumstances, or otherwise constitutes a personal recommendation to you. Please note in particular that the bases and levels of taxation may change. Information and opinions presented in this report have been obtained or derived from sources believed by CS to be reliable, but CS makes no representation as to their accuracy or completeness. CS accepts no liability for loss arising from the use of the material presented in this report, except that this exclusion of liability does not apply to the extent that such liability arises under specific statutes or regulations applicable to CS. This report is not to be relied upon in substitution for the exercise of independent judgment. CS may have issued, and may in the future issue, other communications that are inconsistent with, and reach different conclusions from, the information presented in this report. Those communications reflect the different assumptions, views and analytical methods of the analysts who prepared them and CS is under no obligation to ensure that such other communications are brought to the attention of any recipient of this report. Some investments referred to in this report will be offered solely by a single entity and in the case of some investments solely by CS, or an associate of CS or CS may be the only market maker in such investments. Past performance should not be taken as an indication or guarantee of future performance, and no representation or warranty, express or implied, is made regarding future performance. Information, opinions and estimates contained in this report reflect a judgment at its original date of publication by CS and are subject to change without notice. The price, value of and income from any of the securities or financial instruments mentioned in this report can fall as well as rise. The value of securities and financial instruments is subject to exchange rate fluctuation that may have a positive or adverse effect on the price or income of such securities or financial instruments. Investors in securities such as ADR's, the values of which are influenced by currency volatility, effectively assume this risk. Structured securities are complex instruments, typically involve a high degree of risk and are intended for sale only to sophisticated investors who are capable of understanding and assuming the risks involved. The market value of any structured security may be affected by changes in economic, financial and political factors (including, but not limited to, spot and forward interest and exchange rates), time to maturity, market conditions and volatility, and the credit quality of any issuer or reference issuer. Any investor interested in purchasing a structured product should conduct their own investigation and analysis of the product and consult with their own professional advisers as to the risks involved in making such a purchase. Some investments discussed in this report may have a high level of volatility. High volatility investments may experience sudden and large falls in their value causing losses when that investment is realised. Those losses may equal your original investment. Indeed, in the case of some investments the potential losses may exceed the amount of initial investment and, in such circumstances, you may be required to pay more money to support those losses. Income yields from investments may fluctuate and, in consequence, initial capital paid to make the investment may be used as part of that income yield. Some investments may not be readily realisable and it may be difficult to sell or realise those investments, similarly it may prove difficult for you to obtain reliable information about the value, or risks, to which such an investment is exposed. This report may provide the addresses of, or contain hyperlinks to, websites. Except to the extent to which the report refers to website material of CS, CS has not reviewed any such site and takes no responsibility for the content contained therein. Such address or hyperlink (including addresses or hyperlinks to CS's own website material) is provided solely for your convenience and information and the content of any such website does not in any way form part of this document. Accessing such website or following such link through this report or CS's website shall be at your own risk.
This report is issued and distributed in European Union (except Switzerland): by Credit Suisse Securities (Europe) Limited, One Cabot Square, London E14 4QJ, England, which is authorised by the Prudential Regulation Authority and regulated by the Financial Conduct Authority and the Prudential Regulation Authority. Germany: Credit Suisse (Deutschland) Aktiengesellschaft regulated by the Bundesanstalt fuer Finanzdienstleistungsaufsicht ("BaFin"). United States and Canada: Credit Suisse Securities (USA) LLC; Switzerland: Credit Suisse AG; Brazil: Banco de Investimentos Credit Suisse (Brasil) S.A or its affiliates; Mexico: Banco Credit Suisse (México), S.A., Institución de Banca Múltiple, Grupo Financiero Credit Suisse (México) and Casa de Bolsa Credit Suisse (México), S.A. de C.V., Grupo Financiero Credit Suisse (México) ("Credit Suisse Mexico"). This document has been prepared for information purposes only and is exclusively distributed in Mexico to Institutional Investors. Credit Suisse Mexico is not responsible for any onward distribution of this report to non-institutional investors by any third party. The authors of this report have not received payment or compensation from any entity or company other than from the relevant Credit Suisse Group company employing them; Japan: by Credit Suisse Securities (Japan) Limited, Financial Instruments Firm, Director-General of Kanto Local Finance Bureau ( Kinsho) No. 66, a member of Japan Securities Dealers Association, The Financial Futures Association of Japan, Japan Investment Advisers Association, Type II Financial Instruments Firms Association; Hong Kong: Credit Suisse (Hong Kong) Limited; Australia: Credit Suisse Equities (Australia) Limited; Thailand: Credit Suisse Securities (Thailand) Limited, regulated by the Office of the Securities and Exchange Commission, Thailand, having registered address at 990 Abdulrahim Place, 27th Floor, Unit 2701, Rama IV Road, Silom, Bangrak, Bangkok10500, Thailand, Tel. +66 2614 6000; Malaysia: Credit Suisse Securities (Malaysia) Sdn Bhd; Singapore: Credit Suisse AG, Singapore Branch; India: Credit Suisse Securities (India) Private Limited (CIN no.U67120MH1996PTC104392) regulated by the Securities and Exchange Board of India as Research Analyst (registration no. INH 000001030) and as Stock Broker (registration no. INZ000248233), having registered address at 9th Floor, Ceejay House, Dr.A.B. Road, Worli, Mumbai - 18, India, T- +91-22 6777 3777; South Korea: Credit Suisse Securities (Europe) Limited, Seoul Branch; Taiwan: Credit Suisse AG Taipei Securities Branch; Indonesia: PT Credit Suisse Sekuritas Indonesia; Philippines:Credit Suisse Securities (Philippines ) Inc., and elsewhere in the world by the relevant authorised affiliate of the above.Additional Regional DisclaimersAustralia: Credit Suisse Securities (Europe) Limited ("CSSEL") and Credit Suisse International ("CSI") are authorised by the Prudential Regulation Authority and regulated by the Financial Conduct Authority ("FCA") and the Prudential Regulation Authority under UK laws, which differ from Australian Laws. CSSEL and CSI do not hold an Australian Financial Services Licence ("AFSL") and are exempt from the requirement to hold an AFSL under the Corporations Act (Cth) 2001 ("Corporations Act") in respect of the financial services provided to Australian wholesale clients (within the meaning of section 761G of the Corporations Act) (hereinafter referred to as “Financial Services”). This material is not for distribution to retail clients and is directed exclusively at Credit Suisse's professional clients and eligible counterparties as defined by the FCA, and wholesale clients as defined under section 761G of the Corporations Act. Credit Suisse (Hong Kong) Limited ("CSHK") is licensed and regulated by the Securities and Futures Commission of Hong Kong under the laws of Hong Kong, which differ from Australian laws. CSHKL does not hold an AFSL and is exempt from the requirement to hold an AFSL under the Corporations Act in respect of providing Financial Services. Investment banking services in the United States are provided by Credit Suisse Securities (USA) LLC, an affiliate of Credit Suisse Group. CSSU is regulated by the United States Securities and Exchange Commission under United States laws, which differ from Australian laws. CSSU does not hold an AFSL and is exempt from the requirement to hold an AFSL under the Corporations Act in respect of providing Financial Services. Credit Suisse Asset Management LLC (CSAM) is authorised by the Securities and Exchange Commission under US laws, which differ from Australian laws. CSAM does not hold an AFSL and is exempt from the requirement to hold an AFSL under the Corporations Act in respect of providing Financial Services. This material is provided solely to Institutional Accounts (as defined in the FINRA rules) who are Eligible Contract Participants (as defined in the US Commodity Exchange Act). Credit Suisse Equities (Australia) Limited (ABN 35 068 232 708) ("CSEAL") is an AFSL holder in Australia (AFSL 237237). Malaysia: Research provided to residents of Malaysia is authorised by the Head of Research for Credit Suisse Securities (Malaysia) Sdn Bhd, to whom they should direct any queries on +603 2723 2020. Singapore: This report has been prepared and issued for distribution in Singapore to institutional investors, accredited investors and expert investors (each as defined under the Financial Advisers Regulations) only, and is also distributed by Credit Suisse AG, Singapore Branch to overseas investors (as defined under the Financial Advisers Regulations). Credit Suisse AG, Singapore Branch may distribute reports produced by its foreign entities or affiliates pursuant to an arrangement under Regulation 32C of the Financial Advisers Regulations. Singapore recipients should contact Credit Suisse AG, Singapore Branch at +65-6212-2000 for matters arising from, or in connection with, this report. By virtue of your status as an institutional investor, accredited investor, expert investor or overseas investor, Credit Suisse AG, Singapore Branch is exempted from complying with certain compliance requirements under the Financial Advisers Act, Chapter 110 of Singapore (the “FAA”), the Financial Advisers Regulations and the relevant Notices and Guidelines issued thereunder, in respect of any financial advisory service which Credit Suisse AG, Singapore Branch may provide to you. EU: This report has been produced by subsidiaries and affiliates of Credit Suisse operating under its Global Markets Division In jurisdictions where CS is not already registered or licensed to trade in securities, transactions will only be effected in accordance with applicable securities legislation, which will vary from jurisdiction to jurisdiction and may require that the trade be made in accordance with applicable exemptions from registration or licensing requirements. This material is issued and distributed in the U.S. by CSSU, a member of NYSE, FINRA, SIPC and the NFA, and CSSU accepts responsibility for its contents. Clients should contact analysts and execute transactions through a Credit Suisse subsidiary or affiliate in their home jurisdiction unless governing law permits otherwise. Please note that this research was originally prepared and issued by CS for distribution to their market professional and institutional investor customers. Recipients who are not market professional or institutional investor customers of CS should seek the advice of their independent financial advisor prior to taking any investment decision based on this report or for any necessary explanation of its contents. CS may provide various services to US municipal entities or obligated persons ("municipalities"), including suggesting individual transactions or trades and entering into such transactions. Any services CS provides to municipalities are not viewed as "advice" within the meaning of Section 975 of the Dodd-Frank Wall Street Reform and Consumer Protection Act. CS is providing any such services and related information solely on an arm's length basis and not as an advisor or fiduciary to the municipality. In connection with the provision of the any such services, there is no agreement, direct or indirect, between any municipality (including the officials,management, employees or agents thereof) and CS for CS to provide advice to the municipality. Municipalities should consult with their financial, accounting and legal advisors regarding any such services provided by CS. In addition, CS is not acting for direct or indirect compensation to solicit the municipality on behalf of an unaffiliated broker, dealer, municipal securities dealer, municipal advisor, or investment adviser for the purpose of obtaining or retaining an engagement by the municipality for or in connection with Municipal Financial Products, the issuance of municipal securities, or of an investment adviser to provide investment advisory services to or on behalf of the municipality. If this report is being distributed by a financial institution other than Credit Suisse AG, or its affiliates, that financial institution is solely responsible for distribution. Clients of that institution should contact that institution to effect a transaction in the securities mentioned in this report or require further information. This report does not constitute investment advice by Credit Suisse to the clients of the distributing financial institution, and neither Credit Suisse AG, its affiliates, and their respective officers, directors and employees accept any liability whatsoever for any direct or consequential loss arising from their use of this report or its content. No information or communication provided herein or otherwise is intended to be, or should be construed as, a recommendation within the meaning of the US Department of Labor’s final regulation defining "investment advice" for purposes of the Employee Retirement Income Security Act of 1974, as amended and Section 4975 of the Internal Revenue Code of 1986, as amended, and the information provided herein is intended to be general information, and should not be construed as, providing investment advice (impartial or otherwise). Copyright © 2019 CREDIT SUISSE AG and/or its affiliates. All rights reserved. When you purchase non-listed Japanese fixed income securities (Japanese government bonds, Japanese municipal bonds, Japanese government guaranteed bonds, Japanese corporate bonds) from CS as a seller, you will be requested to pay the purchase price only.