Change detection in urban scenes by fusion of SAR and ...dborghys/Publications/BorghysSPIE07.pdf ·...
12
Change detection in urban scenes by fusion of SAR and hyperspectral data Dirk Borghys *a , Michal Shimoni a , Christiaan Perneel b a Royal Military Academy, Signal & Image Centre, Renaissancelaan 30, B-1000 Brussels, Belgium ; b Royal Military Academy, Dept. of Applied Math., Renaissancelaan 30, B-1000 Brussels, Belgium ABSTRACT Urban areas are rapidly changing all over the world and therefore provoke the necessity to update urban maps frequently. Remote sensing has been used for many years to monitor these changes. The urban scene is characterized by a very high complexity, containing objects formed from different types of man-made materials as well as natural vegetation. Hyperspectral sensors provide the capability to map the surface materials present in the scene using their spectra and therefore to identify the main object classes in the scene in a relatively easy manner. However ambiguities persist where different types of objects are constructed of the same material. This is for instance the case for roads and roof covers. Although higher-level image processing (e.g. spatial reasoning) might be able to relief some of these constraints, this task is far from straight forward. In the current paper the authors fused information gathered using a hyperspectral sensor with that of high-resolution polarimetric SAR data. SAR data give information about the type of scattering backscatter from an object in the scene, its geometry and its dielectric properties. Therefore, the information obtained using the SAR processing is complementary to that obtained using hyperspectral data. This research was applied on a dataset consisting of hyperspectral data from the HyMAP sensor (126 channels in VIS-SWIR) and E-SAR data which consists of full- polarimetric L-band and dual-polarisation (HH and VV) X-band data. Two supervised classifications are used; ‘Logistic Regression’ (LR) which applied to the SAR and the PolSAR data and a ‘Matched Filter’ which is applied to the hyperspectral data. The results of the classification are fused in order to improve the mapping of the main classes in the scene and were compared to a ground truth map that was constructed by combining a digital topographic map and a vectorized cadastral map of the research area. An adequate change detection of man-made objects in urban scenes was obtained by the fusion of features derived from SAR, PolSAR and hyperspectral data. Keywords: change detection, hyperspectral, SAR, PolSAR, logistic regression, urban mapping 1. INTRODUCTION (Semi-)automatic land cover classification of complex scenes, such as urban and industrial areas, is a very challenging task and is one of the main applications of remote sensing imaging. To aid in this process, data from multiple sensors are often utilised, since each potentially provides different information about the characteristics of the land cover. In urban and industrial areas, many man-made materials appear spectrally similar to moderate resolution optical sensors like Landsat TM. High spatial resolution sensors like IKONOS are also not sufficient to distinguish man-made objects constructed from different materials 1-4 . Some man-made objects can be discriminated in a radar image based on their dielectrical and geometrical properties. For instance, building walls oriented orthogonal to the radar look direction form corner reflectors and have relatively strong signal returns. A smooth surface of bare soil, which acts as specular reflector, will result in relatively low signal returns. However, trees can introduce interpretation uncertainty by producing bright returns similar to buildings. Wet soil and other urban man-made features with high dielectric constants (e.g. vegetation, metal roofs) are confused in a radar image 5 . Thus, there is no single sensor able to provide sufficient information to extract man-made objects in the complex urban environment 6 . Instead, the way for increasing this analysis is the integration of features extracted from different sources. * Dirk.Borghys(at)elec.rma.ac.be; phone 32 2 742 6660; fax 32 2 742 6472;
Transcript of Change detection in urban scenes by fusion of SAR and ...dborghys/Publications/BorghysSPIE07.pdf ·...
Change detection in urban scenes by fusion of SAR and hyperspectral
data
Dirk Borghys*a
, Michal Shimonia, Christiaan Perneel
b
aRoyal Military Academy, Signal & Image Centre, Renaissancelaan 30, B-1000 Brussels, Belgium ; bRoyal Military Academy, Dept. of Applied Math., Renaissancelaan 30, B-1000 Brussels, Belgium
ABSTRACT
Urban areas are rapidly changing all over the world and therefore provoke the necessity to update urban maps frequently.
Remote sensing has been used for many years to monitor these changes. The urban scene is characterized by a very high
complexity, containing objects formed from different types of man-made materials as well as natural vegetation.
Hyperspectral sensors provide the capability to map the surface materials present in the scene using their spectra and
therefore to identify the main object classes in the scene in a relatively easy manner. However ambiguities persist where
different types of objects are constructed of the same material. This is for instance the case for roads and roof covers.
Although higher-level image processing (e.g. spatial reasoning) might be able to relief some of these constraints, this
task is far from straight forward. In the current paper the authors fused information gathered using a hyperspectral sensor
with that of high-resolution polarimetric SAR data. SAR data give information about the type of scattering backscatter
from an object in the scene, its geometry and its dielectric properties. Therefore, the information obtained using the SAR
processing is complementary to that obtained using hyperspectral data. This research was applied on a dataset consisting
of hyperspectral data from the HyMAP sensor (126 channels in VIS-SWIR) and E-SAR data which consists of full-
polarimetric L-band and dual-polarisation (HH and VV) X-band data. Two supervised classifications are used; ‘Logistic
Regression’ (LR) which applied to the SAR and the PolSAR data and a ‘Matched Filter’ which is applied to the
hyperspectral data. The results of the classification are fused in order to improve the mapping of the main classes in the
scene and were compared to a ground truth map that was constructed by combining a digital topographic map and a
vectorized cadastral map of the research area. An adequate change detection of man-made objects in urban scenes was
obtained by the fusion of features derived from SAR, PolSAR and hyperspectral data.
Keywords: change detection, hyperspectral, SAR, PolSAR, logistic regression, urban mapping
1. INTRODUCTION
(Semi-)automatic land cover classification of complex scenes, such as urban and industrial areas, is a very challenging
task and is one of the main applications of remote sensing imaging. To aid in this process, data from multiple sensors are
often utilised, since each potentially provides different information about the characteristics of the land cover. In urban
and industrial areas, many man-made materials appear spectrally similar to moderate resolution optical sensors like
Landsat TM. High spatial resolution sensors like IKONOS are also not sufficient to distinguish man-made objects
constructed from different materials 1-4
. Some man-made objects can be discriminated in a radar image based on their
dielectrical and geometrical properties. For instance, building walls oriented orthogonal to the radar look direction form
corner reflectors and have relatively strong signal returns. A smooth surface of bare soil, which acts as specular reflector,
will result in relatively low signal returns. However, trees can introduce interpretation uncertainty by producing bright
returns similar to buildings. Wet soil and other urban man-made features with high dielectric constants (e.g. vegetation,
metal roofs) are confused in a radar image 5. Thus, there is no single sensor able to provide sufficient information to
extract man-made objects in the complex urban environment 6. Instead, the way for increasing this analysis is the
integration of features extracted from different sources.
* Dirk.Borghys(at)elec.rma.ac.be; phone 32 2 742 6660; fax 32 2 742 6472;
Thus, the fusion of multi-sensor data has received tremendous attention in the remote sensing literature 7-9
and mainly
fusion of SAR with optical or thermal data 6,10-13
. Fusion of features extracted from polarimetric synthetic aperture radar
and hyperspectral imagery was successfully conducted for land use mapping, urban characterisation and urban
classification 14-15. However, those researches were devoted to detect built areas or to separate different soil use classes in
urban areas, with no or little attention for single man-made objects or structures.
As far as the change-detection task is concerned the availability of SAR data promises high potentialities 16-19
, thanks to
the insensitivity of SAR imagery to atmospheric conditions and cloud cover issues; the short revisit time planned for
future SAR-based missions will make SAR data even more appealing. The hyperspectral provides the capability to
identify changes in the imaged scenes in a relatively rapid way based on spectral changes 20-21
.
The main objective of the work presented in this paper is to resolve the classification ambiguity of several man-made
objects in urban and industrial scenes for rapid detection of changes based on the fusion of hyperspectral data and multi-
channel SAR data. Because of the very dissimilar characteristics between SAR and hyperspectral, a high-level fusion is
used. For both sensors a classifier is applied that detects the different classes of interest in the scene. The obtained
“detection images”, which are in fact probability or abundance images are combined in the fusion and the obtained
classification is compared at object level with a digital map of the area. The authors already demonstrated 22
the
complementarity of SAR and hyperspectral data for the classification of urban areas. In that work the fusion was done
using neural networks, support vector machines and a decision tree and results were quantitavely compared. In the
current paper a semi-automatic fusion method is applied and the fused results are used for change detection.
2. DATASET
2.1 Airborne data
For this project HyMap hyperspectral data and E-SAR data were acquired by the German Aerospace Agency (DLR) over
the area of Oberpfaffenhofen and Neugilching, Germany. The HyMap data contains 126 contiguous bands ranging from
the visible region to the short wave infrared (SWIR) region (0.45 – 2.48) with a bandwidth of 15-18 nm. The spatial
resolution of the HyMAP scene is 4 m at nadir and the image covers an area of 2.6x9.5 km. Four subsequent levels of
pre-processing were applied: radiometric correction, geocoding, atmospheric correction (using ATCOR4 24
) and the
``Empirical Flat Field Optimized Reflectance Transformation'' (EFFORT 25
). The pre-processing was done by the
Flemish Institute for Technological Development (VITO). In this paper the data of the last pre-processing level is used.
In all processing the first and last channel were discarded, the first contains too much noise while the last is saturated.
The E-SAR data consists of full-polarimetric L-band data (lambda=23cm) and HH and VV polarised X-band data
(lambda=3cm). All SAR data were delivered as Single-Look Complex (SLC) data as well as geocoded amplitude data.
The DLR also provided geocoding matrices that enable one to extract polarimetric information using the SLC data and
geocode the results afterwards. The spatial resolution of the geocoded SAR data is 1.5 m. Figure 1 shows the dataset
used in this paper; the left image shows part of the HyMap dataset in RGB color combination, the right image is a color
composite of the SAR data (R:Xhh,G:Xvv,B:Lhh).

Figure 1: The image dataset used in this paper: Left: Hymap image (R:635nm,G:558nm,B:497nm), right: E-SAR image
(R:Xhh,G:Xvv,B:Lhh)
2.2 Contextual data
For the change detection process and for the constructing the learning set, a cadastral map and a digital topographic map
were acquired for the area of interest. As the project mainly focuses on changes of man-made objects in the scene, the
classes of interest for change detection were: roads, railways, different types of buildings and background. For each of
the classes of interest approximately 300 points were selected in the images to constitute the learning set. For the training
of the classifiers, the building class was sub-divided according to the roof material into clay-roofed, schist-roofed and
conglomerate-roofed buildings and the background class was sub-divided into grass, bare soil and two types of fields.
3. OVERVIEW OF THE METHOD
Figure 1 presents an overview of the method applied in this paper. For the SAR data, the applied classification is feature-
based. The features were extracted using two parallel processes. In one process, the polarimetric information is extracted
from the full-polarimetric L-band data using various polarimetric decomposition methods (cf. sect. 4.3). These are
calculated using 7x7 averaging windows and therefore the results have a reduced spatial resolution. The polarimetric
decomposition is applied on the single-look- complex data directly and the results are then geocoded.
In the other process a speckle reduction method (sect. 4.1) is applied on the five different SAR channels after geocoding.
On the speckle reduced data, a dark and bright line detector is applied (sect. 4.2). The LR classifier (sect. 5.2) is run on
two sets of features. The first consists of the results of the polarimetric decompositions and the second is a combined set
extracted from the full-resolution SAR data and consisting of the original intensity data, the speckle reduced intensity
data and the results of the dark and bright line detectors.
Because the spatial resolution of the geocoded SAR data is higher than that of the Hymap data, the Hymap data are first
registered to the SAR data. For the hyperspectral data a matched Filter MF (sect. 5.1) is used for classification, which is
applied directly on the original hyperspectral data and on the 30 first channels after principal component analysis (PCA).
Both classifiers yield detection or abundance images per class. These images are used as input for the fusion method
which in this paper is a relatively simple semi-automatic method (sect. 5.3).
The following sections describe the various processing steps in details.

SAR SLCData
HymapData
Speckle
Reduction
Line
Detector
PCA
LR LR MF MF
Detection Images
PolSARDecomp.
RegistrationGeocoding
Geocoding
FusionContextual
Maps
Change detection
SAR SLCData
HymapData
Speckle
Reduction
Line
Detector
PCA
LR LR MF MF
Detection Images
PolSARDecomp.
RegistrationGeocoding
Geocoding
FusionContextual
Maps
Change detection
Figure 2: Overview of the method
4. SAR FEATURE EXTRACTION
4.1 Speckle reduction
Standard speckle reduction methods tend to blur the image. In particular edges are smoothed and strong isolated
scatterers are removed. Because these two features are very important, Pizurica developed a speckle reduction method
based on context-based locally adaptive wavelet shrinkage 26
. The idea is to estimate the statistical distributions of the
wavelet coefficients representing mainly noise and representing useful edges. In particular it was noted that in SAR
intensity images, the magnitudes of the wavelet coefficients representing mainly noise follow an exponential distribution
while those representing a useful signal follow a Gamma distribution. This information is used to find a threshold that
allows distinguishing useful signal from noise. Prior knowledge about possible edge configurations is introduced using a
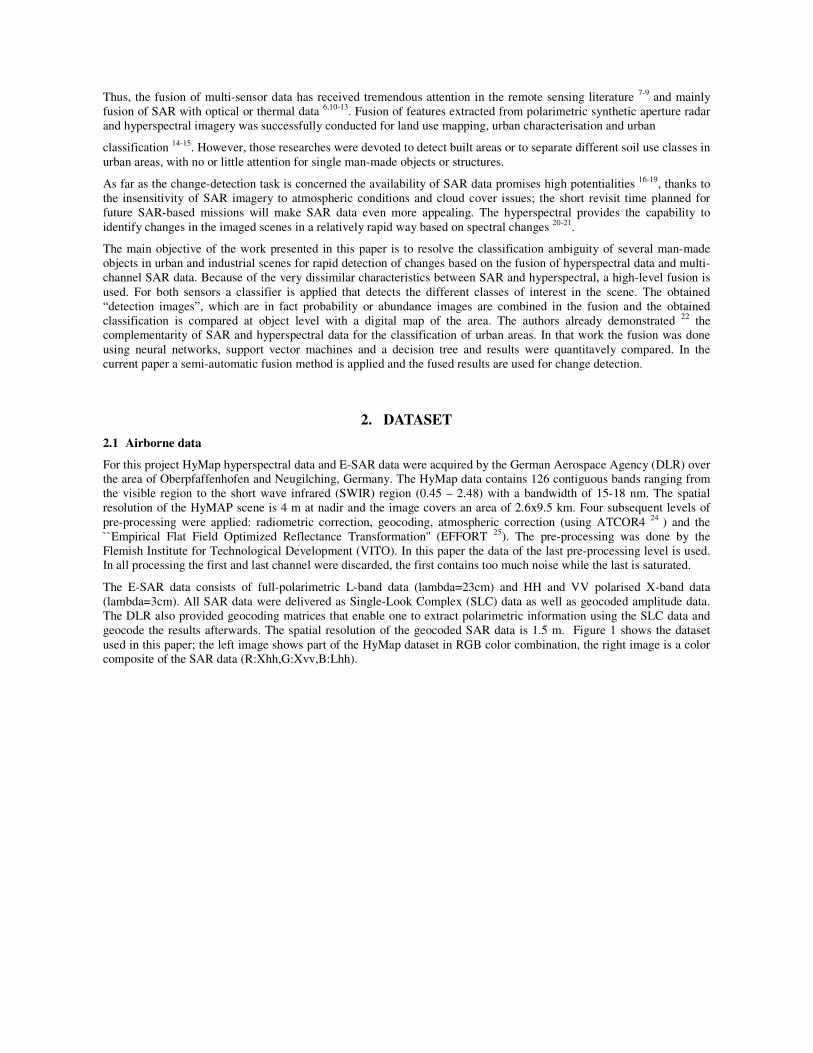
Markov Random Field. Figure 2 (left) shows the results of the speckle reduction in RGB color composite
(R:XhhSR,G:XvvSR,B:LhhSR; SR=speckle reduced).
4.2 Line detection
For multi-channel images, it is possible to construct a line detector from an edge detector based on multi-variate
statistical hypothesis tests. In this paper we use a line detector based on a Hotellings T2 test for the difference of means.
The method 27,28
is applied on the complete set of log-intensity SAR images (5 channels) after speckle reduction.
A dark and bright line detection is performed. Figure 2 (right) shows the results of the dark line detector superimposed
on the Xhh SAR image. The dark line detector highlights roads, railways and radar shadows. The bright line detector
mainly highlights the double-bounce scattering from buildings.
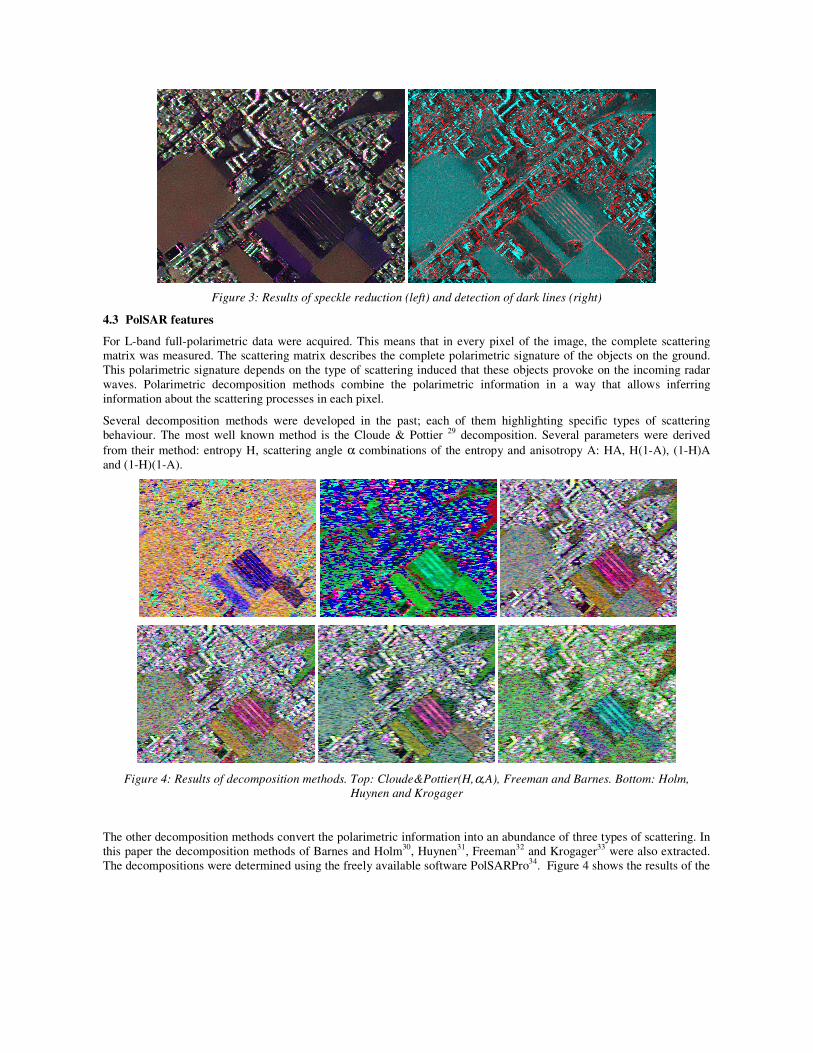
Figure 3: Results of speckle reduction (left) and detection of dark lines (right)
4.3 PolSAR features
For L-band full-polarimetric data were acquired. This means that in every pixel of the image, the complete scattering
matrix was measured. The scattering matrix describes the complete polarimetric signature of the objects on the ground.
This polarimetric signature depends on the type of scattering induced that these objects provoke on the incoming radar
waves. Polarimetric decomposition methods combine the polarimetric information in a way that allows inferring
information about the scattering processes in each pixel.
Several decomposition methods were developed in the past; each of them highlighting specific types of scattering
behaviour. The most well known method is the Cloude & Pottier 29 decomposition. Several parameters were derived
from their method: entropy H, scattering angle α combinations of the entropy and anisotropy A: HA, H(1-A), (1-H)A
and (1-H)(1-A).
Figure 4: Results of decomposition methods. Top: Cloude&Pottier(H,α,A), Freeman and Barnes. Bottom: Holm,
Huynen and Krogager
The other decomposition methods convert the polarimetric information into an abundance of three types of scattering. In
this paper the decomposition methods of Barnes and Holm30
, Huynen31
, Freeman32
and Krogager33
were also extracted.
The decompositions were determined using the freely available software PolSARPro34
. Figure 4 shows the results of the

various decomposition methods; as one can see the different decomposition methods highlight different aspects of the
scene. The decomposition parameters are determined using averaging windows on the slant-range image (7x7 in this
case), which reduces the resolution of the results. Although it was already shown 35
that these features are very important
for classifying agricultural scenes, they are likely to be less valuable in urban scenes where it is very important to keep
the highest possible spatial resolution.
5. CLASSIFICATION AND FUSION METHODS
For this project we have chosen to use classification methods that are based on a per-class detection in each pixel. The
first method, the MF, is assigning abundances of each class to each pixel and the second method, LR, provides
probability images for each class. A classification can be obtained by assigning to each pixel the class for which
respectively the abundance or probability is the highest. In this paper the classification is obtained after fusing the
probability images.
5.1 Matched filter
The MF method applied in this research, for each pixel of the hyperspectral image, is based on the ‘Orthogonal
Background Suppression (OBS)’ technique 36
which finds the proper combination of background scene components and
removes them completely from the target spectrum, leaving only the spectrum of the gas of interest and random noise. A
mixed pixel containing p spectrally distinct materials, denoted by the l x 1 vector ),( yxrr
can be described by the linear
model:
),(),(),( yxnyxMyxrrr
+= α
where l is the number of spectral bands, (x,y) is the spatial position of the pixel, ),,,,,( 11 duuuM pi −=r
Kr
Kr
is an l x
p matrix with linearly independent columns and the l x 1 column vectors iur
are the spectral signatures of the p-1 distinct
materials and d denotes the desired signature of interest. ),( yxαr
is a p x 1 vector where the Ith element is the fraction of
the ith signature present in the mixed pixel and ),( yxnr
is an l x 1 vector representing random noise. Separating the
desired signature from the undesired signature, one can reformulate previous expression as,
),(),(),(),( yxnyxdyxUyxr p
rrr++= αγ
here ),( yxγ is a vector which contains the first p-1 elements of ),( yxα , ),( yxpα being a scalar is the fraction of
the desired signature.
An operator P can be constructed which projects ),( yxrr
onto a subspace that is orthogonal to the columns of U:
)( †UUIP −= with TT UUUU 1† )( −=
with P an l x l matrix and †
U the pseudo inverse of U. A pseudo inverse of U is needed rather than a normal inverse due
to the fact that U is a non-square matrix. The pixel classification operator Tq that maximises the signal to noise ratio is
given by:
Pdq TT =
where both Tq and
Td represent 1 x l vectors. Applying
Tq on an image pixel ),( yxrr
, results with a scalar being
the measure of the presence of the signature of interest. The result is an abundance measure for each class that in each
pixel estimates the proportion of that class within the pixel.

5.2 Logistic Regression
Logistic regression (LR)37
is developed for dichotomous problems where a target class has to be distinguished from the
background. LR estimates the conditional probability of an event (current pixel belonging to the target class) occurring
using the independent variables (the extracted features in our case). The odds of this probability in pixel (x,y) is
modelled by:
( )( )
+=
−∑
=
k
i
ii
yx
yxyxF
yxFtgtp
yxFtgtp
1
0
,
,),(exp
),(1
),(ββr
r
with ),( yxFr
the vector of available features in pixel x,y, and Fi(x,y) the value of the ith feature at x,y.
The model parameters βi’s are estimated by maximizing the logarithm of the Likelihood function based on the training
set. The log-likelihood function is given by:
( ) ( )[ ] ( ) ( )[ ]{ }∑=
−−+=N
i
yxyxiyxyxiyx FptFptL1
,,,,, tgt1ln1tgtlnrr
β
The change of this function when adding a feature is used to determine the significance of the considered feature.
In order to identify a subset of features that are good predictors of the dependent variable, stepwise selection of the
features is used. The iterations stop when adding a new feature to the model does not improve ( )βyxL , significantly. The
step-wise LR performs a feature reduction by adding one by one feature into the model in order of decreasing
discriminative power.
Applying the model on the complete scene, a probability image is created, in which the pixel value is proportional to the
conditional probability that the pixel belongs to the target class, given the set of retained features. The probability images
for the different classes can be combined into a classification image by attributing to each pixel the class corresponding
to the highest value in the probability image. This method has been already successfully applied to SAR image
classification 38,39. In the present paper the probability images will be used as the input for the fusion.
5.3 Fusion method
In this paper a semi-automatic fusion method was used. The abundance and probability images of two MF and two LR
classifiers were examined by a human expert in order to determine which “expert” (classifier) allows to correctly
distinguish each of the classes and to set a lower threshold on abundance an probability in order to reduce false alarms.
After applying these thresholds the results are summed for each of the classes and a rule-classifier is applied to find the
fusion result.
6. RESULTS AND DISCUSSION
Table 1 presents the abundance or probability images that were selected for the different classes as input for the fusion.
For roads and railways, both HyMap results are combined with the full-resolution SAR results. For all types of buildings
they are combined with the lower-resolution PolSAR results. This seems strange because the buildings are relatively
small and one would expect that the high-resolution SAR data will provide better results. We assume that this is due to
the fact that the PolSAR features provide an averaged polarimetric signature of the buildings while the high-resolution
SAR present too many obstacles within the buildings.
For all types of background only the PCA results of the HyMAP are used. For fields they are combined with the two
SAR results and for grass they are sufficient by themselves to detect the class reliably. For the bare soil only the high-
resolution SAR features are used.
As mentioned before, the logistic regression also performs a feature selection. Table 2 and Table 3 show the features that
were selected by the LR for the high-resolution and the PolSAR feature set for creating the probability images for each
class. The tables show the feature selection only for the classes for which the corresponding SAR feature set was used

for the fusion. From Table 2 it appears that the two line detectors (DarkL and BrightL) provide very relevant information
because they are both selected for 4 out of 5 classes. Furthermore the original and the speckle reduced (SR) intensities
are both used in the classification for most of the classes. For roads, the speckle reduced data were not selected. In Table
3 the different polarimetric decomposition parameters are abbreviated by the first letters of the author and a number. For
the Cloude & Pottier decomposition, the names of the parameters are appended to the abbreviation “CP”. Each of the
decomposition methods was selected for at least one of the classes. Most decomposition methods were used for all of the
classes. This indicates that the different decomposition methods indeed provide complementary information.
Table 1: Selected experts for each class
Class MF
Hymap
MF PCA LR
HiRes
SAR
LR
PolSAR
Roads X X X
Res. Congl. X X X
Res. Schist X X X
Res. Clay X X X
Railways X X X
Fields X X X
Fields2 X X X
Grass X
Bare soil X
Table 2: Features selected by the LR for the Hi-Res SAR data
Class Road Railways Field Field2 Bare
# Features 5 6 9 9 4
Feature Xvv Xvv Xhh Xhh Lhv
List Lhh Lhh Lhh Lhh XvvSR
Lvv LhvSR XhhSR Lhv LhvSR
DarkL LvvSR XvvSR XhhSR LvvSR
BrightL DarkL LhhSR XvvSR
BrightL LhvSR LhhSR
LvvSR LvvSR
DarkL DarkL
BrightL BrightL
Table 3: PolSAR features selected by the LR
Class Res. Congl Res. Clay Res. Schist Field Field2
# Features 9 9 9 11 10
Feature Bar_3 Bar_1 Bar_3 Bar_2 Bar_2
List Hol_2 Bar_2 Hol_2 Bar_3 Bar_3 Huy_2 Hol_2 Huy_2 Hol_1 Hol_2
Free_3 Hol_3 Free_3 Hol_3 Huy_1
Kro_1 Free_1 Kro_1 Huy_2 Free_1 Kro_2 Free_3 Kro_2 Free_1 Free_3
Kro_3 Kro_2 Kro_3 Kro_1 CP_α
CP_α CP_H CP_α CP_α CP_λ
CP_(1-H)A CP_α CP_(1-H)A CP_λ CP_HA
CP_HA CP_(1-H)(1-A)
CP_(1-H)A
Figure 5 shows the results of the fusion superimposed on the RGB color composite of the Hymap image. It can be seen
that most of the road network and the buildings were correctly indentified. For some classes a post-processing could
improve the results. This is for instance the case for the class “fields”. However, as this project is only interested in man-
made objects and the aim here is to detect changes, the post-processing was not implemented.

Residence Conglomerate roofing
Road
Residence Schist roofing
Residence Clay roofing
Railway
Fields
Grass
Bare soil
Fields 2
Residence Conglomerate roofingResidence Conglomerate roofing
RoadRoad
Residence Schist roofingResidence Schist roofing
Residence Clay roofingResidence Clay roofing
RailwayRailway
FieldsFields
GrassGrass
Bare soilBare soil
Fields 2Fields 2
Figure 5: Results of fusion for all classes of interest, superimposed on Hymap RGB composite
Figure 6 shows the results of only the man-made objects. By comparing the results of the classification presented in
Figure 6 to the original HyMap image presented in Figure 1, one can see that in the large ‘white’ area in the Southern
part of the image only the residence schist roofing is appearing. In the case where the roofing material and the yard are
both cover by conglomerates, the classification based spectra is insufficient and the supplementary geometrical
information from the SAR data is necessary to classify the building in the scene.
The man-made objects were compared at the object level with the ground truth map which does not contain information
about the type of roofing material of the buildings. Therefore only three classes are of interest: roads, railways and
buildings. A threshold is applied on the size of the changed objects.
Road
Residence Conglomerate roofing
Residence Schist roofing
Residence Clay roofing
Railway
Road
Residence Conglomerate roofing
Residence Schist roofing
Residence Clay roofing
Railway
Figure 6: Results of man-made object classification based on fused data
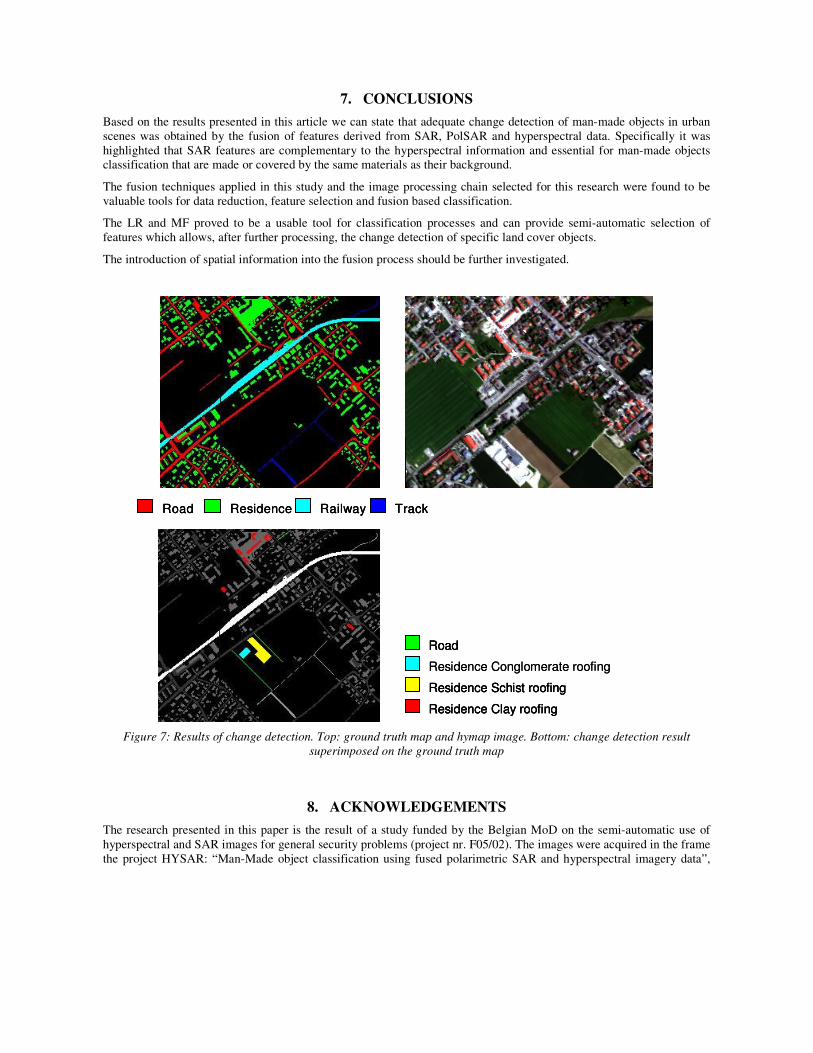
The results of the change detection is shown in Figure 7, the ground truth map with the original Hymap image at the top
and the results of the change detection superimposed on the ground truth map on the bottom. Several changes were
found: in the southern part of the image a set of new buildings and some connecting roads were detected, which were
found to be a newly constructed school. On the top of the image a problem with the ground truth map was detected: a
large area was indicated as building, while that area only contains a few isolated large buildings. Two new houses were
also detected.
7. CONCLUSIONS
Based on the results presented in this article we can state that adequate change detection of man-made objects in urban
scenes was obtained by the fusion of features derived from SAR, PolSAR and hyperspectral data. Specifically it was
highlighted that SAR features are complementary to the hyperspectral information and essential for man-made objects
classification that are made or covered by the same materials as their background.
The fusion techniques applied in this study and the image processing chain selected for this research were found to be
valuable tools for data reduction, feature selection and fusion based classification.
The LR and MF proved to be a usable tool for classification processes and can provide semi-automatic selection of
features which allows, after further processing, the change detection of specific land cover objects.
The introduction of spatial information into the fusion process should be further investigated.
Road Residence Railway TrackRoadRoad ResidenceResidence RailwayRailway TrackTrack
Residence Conglomerate roofing
Road
Residence Schist roofing
Residence Clay roofing
Residence Conglomerate roofing
Road
Residence Schist roofing
Residence Clay roofing
Road
Residence Schist roofing
Residence Clay roofing
Figure 7: Results of change detection. Top: ground truth map and hymap image. Bottom: change detection result
superimposed on the ground truth map
8. ACKNOWLEDGEMENTS
The research presented in this paper is the result of a study funded by the Belgian MoD on the semi-automatic use of
hyperspectral and SAR images for general security problems (project nr. F05/02). The images were acquired in the frame
the project HYSAR: “Man-Made object classification using fused polarimetric SAR and hyperspectral imagery data”,

funded by the Belgian Government, Belgian Federal Science Policy Office, in the frame of the STEREO Program
(project nr. SR/00/044). The E-SAR images were provided by DLR-HR, copyright DLR-HR.
REFERENCES
1 B. C., Forster, “An examination of some problems and solutions in monitoring urban areas from satellite
platform”, International Journal of remote Sensing, 6 (1), 139-151, 1985. 2 G. F. Hepner, Houshmand, B., Kulikov, I. and Bryant, N., “Investigation of the integration of AVIRIS and IFSAR
for urban analysis”, Photogrammetric Engineering and Remote Sensing, 64 (8), 813-820, 1998. 3 C. M., Chen, Hepner, G. F. and Forster, R. R., “Fusion of hyperspectral and radar data using the HIS
transformation to enhance urban surface features”, Photogrammetric Engineering and Remote Sensing, 58, 19-30,
2003. 4 C., Small, “Global Analysis of Urban Reflectance”, International Journal of Remote Sensing, 26(4), pp 661-681,
2005. 5 F. M., Henderson and Xia, Z. G., “SAR application in human settlement detection population estimation and
urban land use pattern analysis: a status report”, IEEE Transaction on Geosciences and Remote Sensing, 35, 79-
85, 1997. 6 P. Gamba and Houshmand, B., “Urban remote sensing through multispectral and radar data”, Proceeding of the
ERS/ENVISAT symposium, Gothenbourg’2000, 272-278, 2000. 7 K. O., Niemann, Goodenough, D. G., Marceau, D. and Hay, G., “A practical alternative for fusion of
hyperspectral data with high resolution imagery”, Proceeding of IGARSS’98, I, 174-176, 1998. 8 P. Gamba and Houshmand, B, “Three-dimensional road network by fusion of polarimetric and interferometric
SAR data”, Proceeding of IGARSS’99 I, 302-304, 1999. 9 Y, Zhang, “A new merging method and its spectral and spatial effects”, International Journal of remote Sensing,
20 (10), 2003-2014, 1999. 10 D. J. Weydahl, Becquery, X. and Tollefsen, T, “Combining ERS-1 SAR with optical satellite data over urban
area, Proceeding of IGARSS’1995, 3, 2161-2163, 1995. 11 L. Fatone, Maponi, P. and Zirilli, F., “Fusion of SAR/optical images to detect urban areas”, IEEE/ISPRS joint
workshop’2001 on remote sensing and data fusion over urban area, 217-221, 2001. 12 B. A. Lofy and Sklansky, J., “Segmenting multi-sensor aerial images in class-scale space”, Pattern recognition,
34, 1825-1839, 2001. 13 G. F., Hepner, B. Houshmand, I. Kulikov and N. Bryant, “Investigation of the potential for the integration of
AVIRIS and IFSAR for urban analysis”, Photogrammetric Engineering and Remote Sensing, 64 (8), 512-520,
1998. 14 P. Gamba and B. Houshmand, “Hyperspectral and IFSAR for 3D urban characterisation”, Photogrammteric
engineering and remote sensing, 67, 944-956, 2000. 15 Y. Allard, A. Jouan and S. Allen, “Land Use Mapping using Evidential Fusion of Polarimetric Synthetic Aperture
Radar and Hyperspectral Imagery”, Information fusion, 5(4), pp 251-267, dec 2004. 16 R. G. White and C. J. Oliver, “Change detection in SAR imagery,” in Proc. IEEE Int. Radar Conf., Arlington,
VA, 1990, pp. 217–222. 17 E. J. M. Rignot and J. J. van Zyl, “Change detection techniques for ERS-1 SAR data,” IEEE Trans. Geosci.
Remote Sens., vol. 31, no. 4, pp. 896–906, Jul. 1993. 18 P. Lombardo and C. J. Oliver, “Maximum likelihood approach to the detection of changes between multitemporal
SAR images,” in Proc. Inst. Elect. Eng., Radar, Sonar Navigat., Aug. 2001, vol. 148, no. 4, pp. 200–210. 19 F. T. Bujor, L. Valet, E. Trouve, G. Mauris, and P. Bolon, “An interactive fuzzy fusion system applied to change
detection in SAR images,” in Proc. FUZZ-IEEE, 2002, vol. 2, pp. 932–937. 20 A. Nielsen, “The regularized iteratively reweighted MAD method for change detection in multi-and hyperspectral
data”, IEEE Trans. Image Proc., 16, no. 2, pp. 463-478, 2007. 21 A. Nielsen, “Regularisation in multi- and hyperspectral remote sensing change detection,” on CD-ROM
Proceedings of 6th GeomaticWeek Conference, Barcelona, Spain, 8-10 February 2005, Internet
http://www.imm.dtu.dk/pubdb/p.php?3387. 22 Association Conference, 18-22 October 2004, Internet http://www.imm.dtu.dk/pubdb/p.php?3176

23 D. Borghys, M.Shimoni, C. Perneel, “Improved object recognition by fusion of Hyperspectral and SAR data”,
5th EARSeL SIG IS workshop “Imaging Spectroscopy: innovation in environmental research”, 23-25 April 2007,
Bruges, Belgium. 24 R. Richter, “Atcor-4 user guide, v4.0”, Tech. Rep., DLR, Jan 2005. 25 “ENVI User’s Manual (V4.0)”, Research Systems Inc., Boulder, 1993. 26 Pizurica A, Philips W., Lemahieu I. and Acheroy M., 2001. Despeckling SAR images using wavelets and a new
class of adaptive shrinkage estimators, In: Proc. IEEE Conf. on Image Proc. (ICIP), (Thessaloniki, Greece) N.
Bluzer and A. S. Jensen, "Current readout of infrared detectors," Opt. Eng. 26(3), 241-248 (1987). 27 D. Borghys, V. Lacroix and C. Perneel. Edge and line detection in polarimetric SAR images. Proc. Int. Conf. on
Pattern Recognition (ICPR), Quebec, Canada, August 2002. 28 D. Borghys, C. Perneel, A. Pizurica and W. Philips. Combining multi-variate statistics and speckle reduction for
line detection in multi-channel SAR images. In Proc. of the Conference on SAR Image Analysis, Modeling and
Techniques VIII, volume 5236, September 2003. 29 S.R. Cloude and E. Pottier, “An entropy-based classification scheme for land applications of polarimetric SAR”,
IEEE Trans. Geoscience and Remote Sensing, vol. 35-1, pp. 68-78, Jan. 1997. 30 W.A. Holm and R.M. Barnes, “On radar polarization mixed target state decomposition techniques,” in Proc.
IEEE Radar Conference, Ann Arbor, MI, USA, 1988, pp. 249-254. 31 J.R. Huynen, “Phenomenological theory of radar targets”, PhD dissertation, University of Technology, Delft, The
Netherlands, 1970. 32 A. Freeman and S. L. Durden, “A three-component scattering model for polarimetric SAR data”, IEEE Trans.
Geoscience and Remote Sensing, vol. 36-3, pp. 963-973, May. 1998. 33 E. Krogager, “New decomposition of the radar target scattering matrix”, Electronic Letters, vol. 26-18, pp. 1525-
1527, Aug. 1990. 34 http://earth.esa.int/polsarpro/ 35 M. Shimoni, D. Borghys, N. Milisavljevic, C. Perneel, D. Derauw, and A. Orban. Feature recognition by fusion of
polinsar and optical data. In Proc. ESA PolInSAR'07 Workshop, Rome, Italy, January 2007. 36 J.C. Harsanyi, and C. I. Chang, “Hyperspectral image classification and dimensionality reduction: An orthogonal
subspace projection approach”, IEEE Transactions on Geoscience and Remote Sensing, vol. 32, pp. 779-785,
1994. 37 D. Hosmer and S. Lemeshow, “Applied Logistic Regression”, John Wiley & Sons, 1989. 38 D. Borghys, Y. Yvinec, C. Perneel, A. Pizurica, and W. Philips., “Supervised feature-based classification of
multi-channel SAR images”, Pattern Recognition Letters, Special Issue on Pattern Recognition for Remote
Sensing, vol. 27-4, pp. 252-258, Mar. 2006. 39 D. Borghys and C. Perneel, “A supervised classification of multi-channel high-resolution SAR data”, Earsel
eProceedings, vol. 6-1, pp. 26-37, 2007.