
Research on Electronic Common Brain model and Information Visualization Platform

Change Detection and Visualization of Functional Brain Networks using EEG Data
Vijayalakshmi R1, Naga Dasari2, Nandagopal D2*, Subhiksha R1, Bernie Cocks2, Nabaraj Dahal2, Thilaga M1
1Department of Applied Mathematics and Computational Sciences, PSG College of Technology, Coimbatore, India
2Division of IT, Engineering and Environment, University of South Australia, Adelaide, Australia [email protected], [email protected]
Abstract Mining dynamic and non-trivial patterns of interactions of functional brain networks has gained significance due to the recent advances in the field of computational neuroscience. Sophisticated data search capabilities, advanced signal processing techniques, statistical methods, complex network and graph mining algorithms to unfold and discover hidden patterns in the functional brain network supported with efficient visualization techniques are essential for making potential inferences of the results obtained. Visualization of change in activity during cognitive function is useful to discover and get insights into the hidden, novel and complex neuronal patterns and trends during the normal and cognitive load conditions from the graph/temporal representation of the functional brain network. This paper explores novel methods to detect and track the dynamics and complexity of the brain function. It also uses a new tool called Functional Brain Network Analysis and Visualization (FBNAV) tool to visualize the outcomes of various computational analyses to enable us to identify and study the changing neuronal patterns during various states of the brain activity using augmented/customised Topoplots and Headplots. The change detection algorithm tracks and visualizes the cognitive load induced changes across the scalp regions. These techniques may also be helpful to locate and identify patterns in certain abnormal mental states resulting due to some mental disorders such as stress. Keywords: Functional brain network, Cognition, Mutual Information, Visualization, Change Detection
1 Introduction The styles Data mining, a discovery process classifies and summarizes the data into useful
information by exploring the relationships between the data, eventually uncovers the patterns and trends in the contents of the information (Jiawei, 2005) (Kaufmann & Rousseeuw, 2005) and
*This work is being supported by the Cognitive Neuro-Engineering laboratory (CNEL), University of South Australia
Procedia Computer Science
Volume 29, 2014, Pages 672–682
ICCS 2014. 14th International Conference on Computational Science
672 Selection and peer-review under responsibility of the Scientific Programme Committee of ICCS 2014c© The Authors. Published by Elsevier B.V.
doi: 10.1016/j.procs.2014.05.060

visualizes the information content (Kard, Mackinlay, & Scheiderman, 1999) of the patterns and images. The outcomes of computational analyses of large amounts of complex data in the forms of graphs, lattices and sequences in various scientific experiments could be better explored and understood using appropriate visualization techniques. Computer visualization is highly dependent on the data visualization technique chosen and an inappropriate technique may result in misinterpretation of the data that may lead to an incorrect/no decision (Johnson & Hansen, 2004)(Kard, Mackinlay, & Scheiderman, 1999)(Thomas & Cook, 2005). The study of brain function expressed as coordinated neural activity using electroencephalography (EEG) analysis not only allow scientists to develop new theories regarding overall brain function, but also may help identify potential new treatments for neurological disorders as well. By examining the EEG records using advanced computational techniques, the communication between small neuronal collections (clusters) and other distant assemblies in the brain’s cortex can be studied. Recent developments in the quantitative analysis of complex networks, based largely on graph theory, have been rapidly translated to the studies of brain network organization. The brain’s functional systems have features of complex networks such as small-world topology and highly connected hubs. Graph topology can be quantitatively described by a wide variety of complex network measures such as centrality, clustering coefficient and efficiency and are hence used in this work for the analysis of EEG data (Koschu tzki, Lehmann, Peeters, Richter, Tenfelde-Podehl, & Zlotowski, 2005) (Freeman, 1979). Software tools such as NetDraw that integrates Pajek and Mage, a 3D network visualization tool are Social Network Visualization and Analysis tools that are capable of only visualizing the network topology not the network metrics. The processing and analysis of EEG data in time domain in terms of its signal amplitude has led to many discoveries regarding the functional characteristics of various areas of the brain. The field of computational neuroscience demands enhanced tools to quantify changing patterns of neuronal interactions during cognitive activity and visualize the brain’s activity to understand and draw useful conclusions on various functional aspects of the complex brain network despite the availability of the common data visualization techniques such as decision tree, scatter plot, dendrogram, histogram, etc.
EEGLAB, an interactive Matlab toolbox offers a wealth of methods for visualizing and modeling event-related brain dynamics (Delorme & Makeig, 2004). Topoplot function available in EEGLAB is basically designed for visualizing power values in the default scale -1 to +1 mapped to the intensity of the color at a particular region. It plots a topographic map of a scalp data field in a 2-D circular view using interpolation on a fine Cartesian grid. The Headplot function plots a spherically-splined EEG field map on a semi-realistic 3-D head model. In order to get a better idea of how the brain regions function during different states, a three dimensional visualization called Headplot is used to display the power of the signal in the color scale of -1 to +1. It also allows 3D rotation of the head image. This work integrates complex network metrics, with the enhanced Topoplot and Headplot functions for better understanding of functional brain network dynamics.
The rest of the paper is organized as follows. Section 2 outlines an overview of the literature of visualization techniques to emphasize the need for data visualization. Section 3 describes the proposed FBNAV tool that uses a novel methodology to detect the changing neural patterns during cognition and the visualization techniques used. Section 4 presents the results and discussions on the proposed techniques and Section 5 concludes with a summary discussion including important future research directions for functional brain network analysis and visualization.
2 Tools for Visualizing Brain activity The human brain is a complex system that exhibits rich spatiotemporal dynamics. While early
attempts to analyze EEG data relied on visual inspection of EEG records, the availability of huge volume of data generated from EEG recordings drove the need for applying automation based on pattern classification techniques with considerable success. Data visualization tools in general aim at
Change Detection and Visualization of Functional Brain Networks ... Vijayalakshmi et al.
673

reducing the information overload by intelligent abstraction and visualization of the features of interest relating to a particular state. One of the problems connected with the evaluation of EEG signals is that it necessitates visual checking of such a recording by a Neuro-Physiologist and computer-aided data analysis and visualization might be of great help to check long-term EEG recordings (Rieger, Kosar, Lhotska, & Krajca, 2004).
VisBrain, developed for EEG data analysis involves a concept of dynamic 3D volumetric shape for showing how the electrical signal changes through time. Brainstorm, a collaborative, open-source application dedicated to MEG/EEG/sEEG/ECoG data analysis (visualization, processing and advanced source modeling), shares a comprehensive set of user-friendly tools with the scientific community using MEG/EEG as an experimental technique. It takes as input the MEG/EEG recordings and provides options for preprocessing (epoching, detection of bad trials/bad channels, baseline correction etc.,) and visualization (time series displays, data mapping on 2D/3D surfaces). It also provides MRI visualization (generate surfaces from MRI volume) head modeling, source modeling etc. BCILAB, an open-source MATLAB-based toolbox was built to address the need for BCI (Brain Computer Interface) methods development and testing. The straight forward use of BCILAB to obtain results compatible with the current BCI literature was demonstrated. (Kothe & Makeig, 2013).
It becomes apparent that efficient EEG visualization techniques facilitate the understanding of data sets through an appropriate choice of visual metaphor. Despite various techniques often create distinct imagery, emphasizing particular data characteristics or visualization goals, the existing EEG visualizations do not always provide the desired insight (Anderson, Potter, Matzen, Shepherd, Preston, & Silva, 2011). The visualization expert must not only determine an appropriate technique for the type of data, but also ensure the chosen method will answer the questions posed by domain experts. The following section discusses the proposed methodology used for change detection followed by functional brain network visualization.
3 Functional Brain Network Visualization The graph based computational network analysis quantitatively characterizes the structural and
functional architectures of the brain by modeling the electrodes (covering brain regions) as nodes (vertices), and the physical connections (synapses or axonal projections) or functional association/coherence among brain regions as edges (links) between them as presented by Bullmore and (Bullmore & Sporns, 2009) (Newman, 2010) (Smit, Stam, Posthuma, Boomsma, & deGeus, 2008). Applying graph theory–based network analysis to explore brain connectivity patterns facilitates characterizing functional connectivity patterns (Bullmore & Sporns, 2009) (Rubinov & Sporns, 2010). In particular, a class of graph theory–based social network measures called centrality measures are used to assess the centrality or functionally influential brain regions is receiving significant attention (Koschu tzki, Lehmann, Peeters, Richter, Tenfelde-Podehl, & Zlotowski, 2005). Since centrality measures take into account a given region’s relationship with the entire functional connectivity, these measures allow us to capture the complexity of the functional connectivity of the brain as a whole. The networks obtained using the nonlinear metrics for various states are an efficient representative to measure and quantify cognitive activity in EEG based on the complex network centrality analysis (Freeman, 1979). A detailed description of the proposed FBNAV tool and the novel methods for visualizing the results obtained using various computational techniques applied on EEG data in two and three dimensional spaces are described in the following sections.
Change Detection and Visualization of Functional Brain Networks ... Vijayalakshmi et al.
674
3.1 Functional Brain Network Analysis and Visualization (FBNAV) Tool
Our approach includes graph theoretical analysis, information theory and statistical measures of complex networks to provide quantitative insights into detecting patterns and identifying significant changes in functional brain networks during cognitive load conditions. The multichannel EEG data is processed and graph databases in time and frequency domains are constructed using efficient linear and non-linear statistical measures such as mutual information (Nandagopal, et al., 2013). The graphs of baseline activity are compared with that of cognitive load conditions using various procedures. Categorical data is a statistical data type consisting of categorical variables, used for observed data whose value is one of a fixed number of nominal categories, or for data that has been converted into that form, for example as grouped data. The observations of categorical data are summarized as counts or cross tabulations, or of quantitative data, where observations might be directly observed counts of events happening or they might counts of values that occur within given intervals (Le, 2009). The changing neural patterns are analyzed and visualized after converting the graph data into categorical attributes using a categorical analysis algorithm. Applying complex network metrics on the graph databases (weighted and binary) clearly show changing patterns over time and during different brain states demonstrating the behavior of functional brain networks. Visualization of the results using our extended Topoplot and Headplot portray the computational results of neural interactions of the multiple channels of electrodes thereby providing a better understanding of the functional association of various brain regions in terms of these network metrics.
The FBNAV tool aims at providing techniques that are helpful in identifying the changing patterns in neuronal clusters during cognition by applying a novel procedure to convert the pair-wise nonlinear mutual information into categorical values, applying complex network metrics on the functional brain networks constructed using non-linear statistical metrics and compare the results obtained with the baseline activity using the enhanced visualization techniques. The framework of the proposed FBNAV tool is illustrated in Figure 1.
Change Detection and Visualization of Functional Brain Networks ... Vijayalakshmi et al.
675

3.2 Data Collection and Pre-processing The EEG data collected from healthy adult males under University of South Australia HREC
approval (30855) is used for this study. EEG data collected from eight subjects namely P1 through P8 for baseline state of Eyes Open (EOP) and Cognitive Load state with audio distraction (Cog1) and audio and video distraction (Cog2) has been used. All participants were aged between 25-50 years and provided informed consent prior to participation. EEG data were acquired through a Nuamps EEG amplifier using Curry V7 software (Dumermuth, 1974). Channel names used for various analyses were based on the International 10-20 System: FP1, FP2, F7, F3, Fz, F4, F8, FT7, FC3, FCz, FC4, FT8, T7, C3, Cz, C4, T8, TP7, CP3, CPz, CP4, TP8, T5, P3, Pz, P4, P8, O1, Oz, O2.
Pre-processing of the EEG data prior to analysis was done by band pass filtering from 0.5Hz to 70Hz. A notch filter of 50Hz was also applied during data collection to prevent contamination of the signal by environmental electrical interference. Eye-blink artifacts were reduced using a VEOL threshold of approximately 105 µV and further corrected post-recording in the Curry 7 software using Independent Component Analysis (ICA). Bad blocks were initially removed manually following visual inspection. Further removal of bad blocks was done with EEGLAB software from UCSD which runs with MATLAB in the background (Delorme & Makeig, 2004).
The pair-wise association between each node with every other node measured using the linear/non-linear measures of Pearson product-moment correlation coefficient (r)/magnitude squared coherence (MSC)/Normalized Mutual Information (NMI) were considered as the edges (Estevez,
Figure 1: Functional Brain Network Analysis and Visualization Tool Framework
Change Detection and Visualization of Functional Brain Networks ... Vijayalakshmi et al.
676

Tesmer, Perez, & Zurada, 2009). The resulting phase correlation graphs of eyes open (EOP) and cognitive load (CogLoad) events were stored in a graph database. These graphs were then analysed to identify and quantify the changing neuronal patterns during cognitive load condition.
3.3 Change Detection In general, EEG of a human subject can be analyzed for various brain states – the baseline activity
when the subject does no specific task and various levels of cognitive loads when a specific task such as responding to audio or video stimuli or both is assigned to the subject. It is of value to identify the regions of the brain that have increased activity during cognitive load, to find out the percentage of increase in activity, and to visualize this increased activity mapping to the brain surface. The NMI of the region surrounding each electrode is computed for both baseline and cognitive loads. Extensive analyses on the EEG data to measure qualitative as well as quantitative differences between the baseline and various cognitive load activities would provide insights in to better understanding of the changing brain activity.
The proposed change detection algorithm demonstrates the changing behaviour of the brain regions by representing the relationships of the NMI values in ordinal scale. The NMI values in the graph database for baseline and cognitive load conditions are converted in to k (user defined) categorical bins with integer labels {1, 2, …,k} based on the global maximum and minimum values in the NMI matrices of EOP and CogLoad states together. The algorithm for change detection applied on categorical data is outlined as follows. Algorithm: Change Detection Input:Graphs of Eyes Open(EOP) and Cognitive Load (CogLoad) states Output: Topoplot and Headplot depicting Cognitive Change
(i) Compute Normalized MI matrix for all pairs of electrodes for EOP, NMI(EOP) (ii) Compute Normalized MI matrix for all pairs of electrodes for CogLoad, NMI(CogLoad) (iii) Find maximum and minimum NMI values of NMI(EOP) and NMI(CogLoad), global
maximum (GlobalMAX) and global minimum (GlobalMIN) respectively. GlobalMAX=max(max(NMI(EOP)), max(NMI(CogLoad)) GlobalMIN=min(min(NMI(EOP)), min(NMI(CogLoad))
(iv) Convert NMI values in EOP and CogLoad in to ordinal scale using ‘k’ bins of equal intervals using GlobalMAX and GlobalMIN and construct the corresponding categorical matrices EOPCat and CogLoadCat respectively
(v) Construct Cognitive Change (CogChange) matrix from the difference between EOPCat from CogLoadCat obtained from Step (iv). The range of values in CogChange matrix is -(k-1) to (k-1)
(vi) Plot the average cognitive change for each electrode using Topoplot/Headplot The advantage of the change detection algorithm is that it works as a normalization measure to
categorise the NMI values in a common scale and is helpful for making comparisons across subjects.
3.4 Two Dimensional Data Visualization The two dimensional visualization is often used to establish precise relationships that enable
analysis of details and precise navigation and distance measurements. Topoplot in EEG Lab is commonly used for the two dimensional visualization of the power values of EEG data. The Topoplot function has been extended to enable visualization of various network metrics and is described in the following subsection. The topological parameters of the complex network can measure and assess the state of the brain network (including global efficiency, clustering coefficient, shortest path length, node degrees, small-world property, betweenness, transitivity, synchronization etc.) (Bullmore & Sporns, 2009). To visualize these complex network metrics effectively, the Topoplot and Headplots can be extended appropriately. The existing Topoplot fails to show the minor variations in these
Change Detection and Visualization of Functional Brain Networks ... Vijayalakshmi et al.
677

results obtained. For instance, the important measure of local structure of a network which can be calculated for individual nodes or for the entire network is the clustering coefficient(CC) that varies between 0 and 1. High clustering coefficients means that neighbouring nodes are well interconnected implying redundancy in connections, which protects the network against random error, i.e. the loss of an individual node will have little impact on the structure of the network. Figure 2(a) and 2(b) show the existing Topoplot and the extended Topoplot to visualize the clustering coefficient values of the electrodes computed for a functional brain network as shown in Table 1.
It can be noted from Figure 2(a) that the regions of the brain around the electrode sites Fz, F4,
Fcz have similar color code meaning that these electrodes have almost the same clustering coefficient. Since, the regions of the brain around these electrodes show slight variations from each other, to visualize these minor changes accurately, the Topoplot function is enhanced for visualizing complex network metrics. Inputs to the Extended Topoplot function are the data vector and electrode locations. Data vector is a single column vector that has the corresponding data computed from the complex network metrics for each electrode location. The implementation of the extended Topoplot is such that the scale is adjusted based on the complex network metric used to visualize the changes across the electrode sites depicting the complex network metric under study accurately. Figure 2(b) shows a clear distinction among the brain regions surrounded by Fz, F4, Fcz using the extended Topoplot that visualizes clustering coefficient values of Table 1.
The efficiency of these plots for comparison between baseline activity and cognitive load based on
complex network metrics are discussed in Section 4.
Electrodes CC Electrodes CC Electrodes CC Electrodes CC Electrodes FP1 0.90 F8 1.00 T3 0.40 C4 0.83 Pz FP2 0.80 FT7 0.50 T4 0.88 CP3 0.59 P4 F7 0.00 FC3 0.85 TP7 0.70 CPz 0.59 T6 F3 0.30 FCz 0.74 TP8 0.59 CP4 0.81 O1 Fz 0.59 FC4 0.55 C3 0.91 T5 0.73 Oz F4 0.51 FT8 1.00 Cz 0.86 P3 0.00 O2
FP1 0.90 F8 1.00 T3 0.40 C4 0.83 Pz Table 1: Clustering Coefficients of Electrodes for Subject P2
Figure 2(a): Topoplot Figure 2(b): Extended Topoplot
Change Detection and Visualization of Functional Brain Networks ... Vijayalakshmi et al.
678
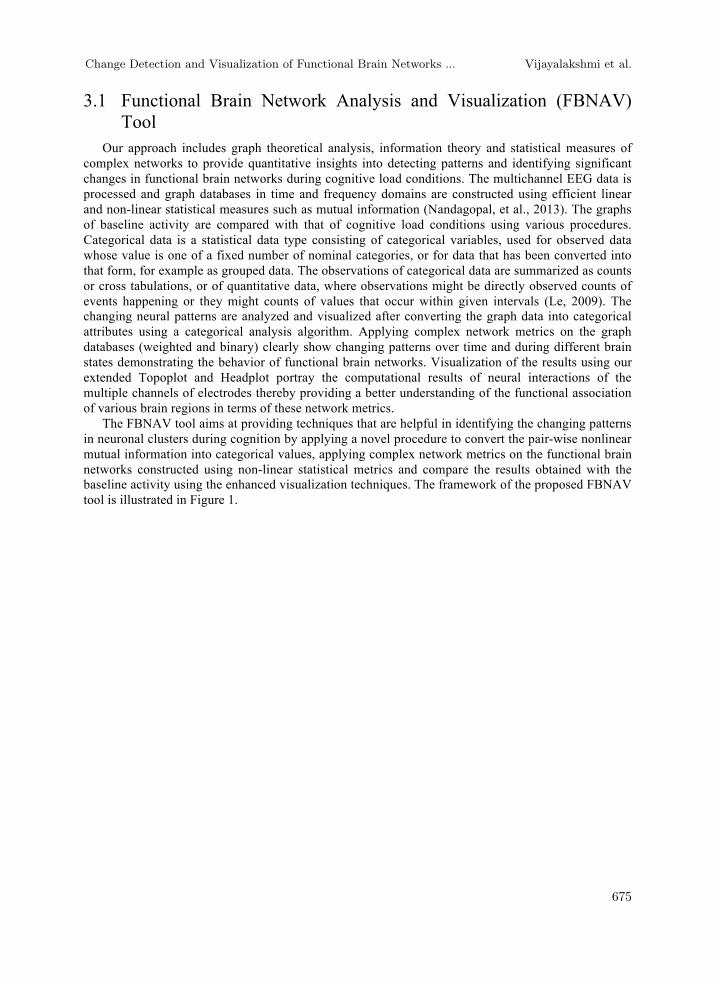
3.5 Three Dimensional Visualization Three Dimensional visualization is used to gain a qualitative understanding, facilitate surveying a
three dimensional space, and better understanding of interactions around the three dimensional shape. Although the extended Topoplot described in section 3.4 provides an efficient picture of the complex network metrics, it is a two-dimensional visualization technique. When the existing Headplot is used to visualize complex network metrics, it also has the same disadvantages as Topoplot. Figure 3(a) shows the different views of an existing Headplot to visualize clustering coefficient results shown in Table 1.
From Figure 3(a), it is noted that it has the same scaling problem as that of Topoplot. To resolve
the problem in visualizing the complex network metrics using the Headplot an extended Headplot is used as shown in Figure 3(b) for visualizing clustering coefficient of the various electrode sites. It shows a clear distinction among the brain regions surrounded by Fz, F4, and Fcz.
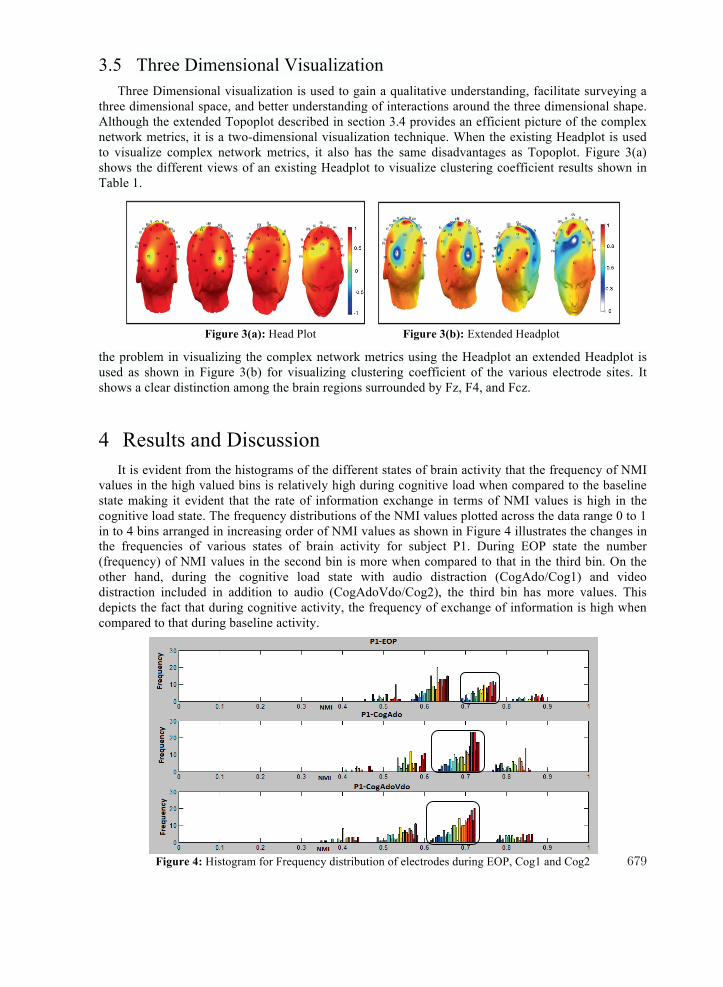
4 Results and Discussion It is evident from the histograms of the different states of brain activity that the frequency of NMI
values in the high valued bins is relatively high during cognitive load when compared to the baseline state making it evident that the rate of information exchange in terms of NMI values is high in the cognitive load state. The frequency distributions of the NMI values plotted across the data range 0 to 1 in to 4 bins arranged in increasing order of NMI values as shown in Figure 4 illustrates the changes in the frequencies of various states of brain activity for subject P1. During EOP state the number (frequency) of NMI values in the second bin is more when compared to that in the third bin. On the other hand, during the cognitive load state with audio distraction (CogAdo/Cog1) and video distraction included in addition to audio (CogAdoVdo/Cog2), the third bin has more values. This depicts the fact that during cognitive activity, the frequency of exchange of information is high when compared to that during baseline activity.
To measure this changing NMI values a novel change detection algorithm as described in Section
3 is applied. It first transfers the NMI values in the matrices of various states in to the ordinal scale constituting four categories. The change in cognitive activity of each pair of electrode is computed by
Figure 3(a): Head Plot Figure 3(b): Extended Headplot
Figure 4: Histogram for Frequency distribution of electrodes during EOP, Cog1 and Cog2 679

comparing the EOP and the respective cognitive load states and is represented as the CogChange matrix and is plotted using Headplot in the range of -3 to +3. The change detection algorithm transfers the NMI values in the matrices of EOP, Cog1/Cog2 states in to the ordinal scale constituting k=4 categories represented as EOPCat and CogCat respectively. The change in cognitive activity of each pair of electrode is then computed by comparing the EOPCat and the respective CogCat matrices and is stored in the cognitive change matrix represented as CogChange. The Topoplots of EOPCat and CogCat matrices and the actual change during cognition represented by CogChange matrix for subject P1 are shown in Figure 5(a) and Figure 5(b) respectively. These plots show the relatively high NMI values during cognitive load when compared to the baseline activity at various electrode positions. These plots show the relatively high NMI values during cognitive load when compared to the baseline activity at various electrode positions.
Figure 6 shows the eight different views of degree centrality plotted for the subject P1 for the
states EOP and Cog1 respectively.
The functional brain network and associated changes detected during cognitive stimulation provide
a set of metrics to quantify brain function. The functional brain network together with its topology illustrated in the above visualization give a better understanding of the activity of the brain regions since it allows the rotation of the images in different perspectives. These results demonstrate not only the efficacy of the analysis and visualization aspects of the FBNAV in unveiling the dynamics of the brain function particularly during cognitive activity but may also contribute to better understanding of neurophysiological states of brain. The FBNAV system as a bed side tool may assist Neurologists, clinical neurophysiologist and Neuro Scientists to develop a deeper understanding of brain responses to cognitive tasks. The visualization aspect of the FBNAV may pave way for further exploration of its
Figure 5: Change Detection: EOP, CogAdo, and CogAdoVdo
Figure 6: Degree centrality of the subject P1 for EOP Vs. Cog1
Change Detection and Visualization of Functional Brain Networks ... Vijayalakshmi et al.
680

clinical application particularly in the neurophysiological assessment of cognitive impairment and hence diagnosis of any related mental health issues. The clinical usefulness the FBNAV system could be improved by appropriately modifying the algorithms for real time processing and visualization.
5 Conclusion and Future Work The research work uses techniques from information visualization to explore time-varying
multichannel EEG data. The proposed FBNAV tool takes preprocessed EEG data as input and computes statistical measures and complex network metrics and visualizes them in two and three dimensional spaces. In addition, given the EEG data for baseline activity and during cognitive load, the cognitive load induced changes across the scalp regions are detected and vizualised. This would significantly help assess the level of cognitive activity taking place in the brain during a task. Further work is planned to not only fine tune the analysis and visualization tool but most importantly explore its clinical application by testing the tool against large data sets.
References Anderson, E. W., Potter, K. C., Matzen, L. E., Shepherd, J. F., Preston, G. A., & Silva, C. T.
(2011). A User Study of Visualization Effectiveness using EEG and Cognitive Load. IEEE Symposium on Visualization, 30.
Bigdely, S. N., Kreutz, D. K., Kothe, C., & Makeig, S. (2013). EyeCatch: Data-Mining over half a million EEG independent components to construct a fully-automated eye-component detector. National Centre for Biotechnology Information, 5845.
Bullmore, E., & Sporns, O. (2009). Complex brain networks: graph theoretical analysis of structural and functional systems. Nature Reviews Neuroscience, 10, 186-198.
Bullmore, E., & Sporns, O. (2009). Complex brain networks: Graph theoretical analysis of structural and functional systems. Nature Reviews, 67, 735-748.
Carlisle, D. (2010, April). graphicx: Enhanced support for graphics. Retrieved from http://www.ctan.org/tex-archive/ help/Catalogue/entries/graphicx.html
Chaovalitwongse, W., Pardalos, P. M., Iasemidis, L. D., Suharitdamrong, W., Shiau, D. S., Dance, L. K., et al. (2007). Data Mining in EEG: Application to Epileptic Brain Disorders. In Data Mining in Biomedicine (Vol. 7, pp. 459-481). Springer US.
Delorme, A., & Makeig, S. (2004). EEGLAB: an open source toolbox for analysis of single-trial EEG dynamics including independent component analysis. Journal of Neuroscience, 134, 9-21.
Dumermuth, G. (1974). Quantification and analysis of the EEG. Schweiz Arch Neurol Neurochir Psychiatr, 115(2), 175-92.
Estevez, P. A., Tesmer, M., Perez, C. A., & Zurada, J. M. (2009). Normalized Mutual Information Feature Selection. IEEE Transactions on Neural Networks.
Fekete, J., & Plaisant, C. (2002). Interactive Information Visualization of a Million Items. Proceedings of IEEE Symposium on Information Visualization 2002, (pp. 117-124). Boston.
Freeman, L. C. (1979). Centrality in Social networks: Conceptual Clarification. Social Networks, 1, 215-239.
Healey, C. G., Booth, S. K., & Enns, J. T. (1995). Visualizing Real-Time Multivariate Data Using Preattentive Processing. ACM Transactions on Modelling and Computer Simulation, 5, 190-221.
Honey, C. J., Sporns, O., Cammoun, L., Gigandet, X., Thiran, J. P., Meuli, R., et al. (2008). Predicting Human Resting-State Functional Connectivity from Structural Connectivity. Proceedings of National Academy of Sciences of the United States of America, 106, pp. 2035-2040.
Change Detection and Visualization of Functional Brain Networks ... Vijayalakshmi et al.
681

Jahankhani, P., Revett, K., & Kodogiannis, V. (2007). Data Mining and EEG Dataset with an Emphasis on Dimensionality Reduction. Computational Intelligence and Data Mining, (pp. 405-412). Honolulu.
Jiawei, H. (2005). Data Mining: Concepts and Techniques. Morgan Kaufmann. Johnson, C., & Hansen, C. (2004). Visualization Handbook. Orlando, FL, United States of
America: Academic Press, Inc. Juozapavicius, A., Bacevicius, G., Bugelskis, D., & Samaitiene, R. (2011). EEG Analysis -
Automatic Spike Detection. Nonlinear Analysis: Modelling and Control, 16, 375-386. Kard, S. T., Mackinlay, J. D., & Scheiderman, B. (1999). Readings in Information Visualization:
Using Vision to Think. San Francisco: Morgan Kaufmann. Kaufmann, L., & Rousseeuw, P. J. (2005). Finding Groups in Data: An Introduction to Cluster
Analysis. Wiley Series in Probability and Statistics. Koschu tzki, D., Lehmann, A., Peeters, L., Richter, S., Tenfelde-Podehl, D., & Zlotowski, O.
(2005). Centrality indices, Network analysis: methodological foundations. New York:Springer-Verlag , 16-61.
Kothe, C. A., & Makeig, S. (2013). BCILAB: A Platform for Brain-Computer Interface Development. Journal of Neural Engineering, 10.
Kulish, V., Sourin, A., & Sourina, O. (2004). Human Electroencephalograms seen as Fractal Time Series: Mathematical Analysis and Visualization. Computers in Biology and Medicine, 36, 291-302.
Le, C. T. (2009). Applied Categorical Data Analysis and Translational Research (2nd Edition ed.). Wiley Publications.
Nandagopal, N. D., Vijayalakshmi, R., Cocks, B., Dahal, N., Dasari, N., Thilaga, M., et al. (2013). Computational Techniques for Characterizing Cognition using EEG - New Approaches. 17th International Conference in Knowledge Based and Intelligent Information and Engineering Systems - KES2013.
Newman, M. (2010). Networks: An Introduction. Oxford University Press. Rieger, J., Kosar, K., Lhotska, L., & Krajca, V. (2004). EEG Data and Data Analysis
Visualization. In Biological and Medical Data Analysis (Vol. 3337, pp. 39-48). Springer Berlin Heidelberg.
Rubinov, M., & Sporns, O. (2010). Complex network measures of brain connectivity: uses and interpretations. Neuroimage, 52, 1059-1069.
Smit, D., Stam, C., Posthuma, D., Boomsma, D., & deGeus, E. (2008). Heritability of “small-world” networks in the brain: a graph theoretical analysis of resting state EEG functional connectivity. Human Brain Mapping, 29, 1368-1378.
Sourina, O., Sourin, A., & Kulich, V. (2009). EEG Data Driven Animation and Its Application. In Computer Vision/Computer Graphics Collaboration Techniques (Vol. 5496, pp. 380-388). Springer Berlin Heidelberg.
Tadel, F., Baillet, S., Mosher, J. C., Pantazis, D., & Leahy, R. M. (2011). Brainstorm: A User-Friendly Application for MEG/EEG Analysis. Computational Intelligence and Neuroscience , 13.
Thomas, J. J., & Cook, K. A. (2005). Illuminating the Path: The Research and Development Agenda for Visual Analytics. National Visualization and Analytics Ctr.
Change Detection and Visualization of Functional Brain Networks ... Vijayalakshmi et al.
682


![Intrinsic Geometry Visualization for the Interactive Analysis of Brain ...€¦ · The Connectome Visualization Utility [22], the Brain Net Viewer [37], and the Connectome Viewer](https://static.fdocuments.us/doc/165x107/5fda3a93cb3f75147c4cd498/intrinsic-geometry-visualization-for-the-interactive-analysis-of-brain-the-connectome.jpg)