Change detection and hydrological implications in the ... · PDF fileRainfall is highly...
9
Remote Sensing for Environmental Monitoring and Change Detection (Proceedings of Symposium HS3007 at IUGG2007, Perugia, July 2007). IAHS Publ. 316, 2007. 91 Change detection and hydrological implications in the Lower Ogun flood plain, SW Nigeria SHAKIRUDEEN ODUNUGA & LEKAN OYEBANDE Department of Geography, University of Lagos, Postal Code 101017, Nigeria [email protected] Abstract The purpose of this study was to examine the immediate and future consequences of the processes taking place in the ecologically fragile coastal flood plain of the Lower Ogun River basin. Aerial photography and Landsat multi-spectral imagery were used to assess the land use and land cover of the basin as it was in 1965 and 2005, respectively. Calculations of the area of various units for the two scenarios ware generated. Overlay analysis for change detection in a matrix format was carried out. The change matrix was used to assess the extent of degradation. The statistic land cover of the lower Ogun flood plain in 1965 was 38.01 × 10 6 ha. The ecologically fragile wetland covered 82.45% of the total area. This figure decreased to 13 × 10 6 ha or 36.31% in 2005 at an average rate of 0.439 × 10 6 ha. per annum. A conserva- tion management approach to rescue the fragile ecosystem of the lower Ogun from complete destruction is proposed. Key words change detection; flood plain; GIS; degradation; remote sensing INTRODUCTION Information on land use and land cover forms the basis from which past and present human interaction and their impact on natural resources and the environment can be understood. Land use and land cover are linked to hydroclimatic fluxes in complex ways. In addition to being a driver of Earth system processes affecting climate, the carbon cycle and the ecosystem, land use and land cover change has a significant impact on the feedback of the hydroclimatic processes on the surface hydrology. Determining the effects of land use and land cover change on the Earth system depends on an understanding of past land use practices, current land use and land cover patterns, and projections of future land use and cover, as affected by various factors. Such factors include population size and distribution, economic development, technology, and other factors (Adeniyi & Omojola, 1999). This paper presents the pattern of the land use and cover of the lower Ogun basin between 1965 and 2005. Remote Sensing and Geographic Information Systems were used to determine the characteristics of change in land use systems of the lower Ogun River, as well as to assess the extent of degradation in the flood plain. The specific objectives of this study were to: (1) Determine the rate and trend of environmental change (land use/land cover) of the lower Ogun basin using remote sensing and GIS techniques; (2) Assess the extent of degradation and decreasing functional role of the flood plain; and (3) Examine the consequences of the observed pattern on human activities and habitats. Copyright © 2007 IAHS Press
Transcript of Change detection and hydrological implications in the ... · PDF fileRainfall is highly...

Remote Sensing for Environmental Monitoring and Change Detection (Proceedings of Symposium HS3007 at IUGG2007, Perugia, July 2007). IAHS Publ. 316, 2007.
91
Change detection and hydrological implications in the Lower Ogun flood plain, SW Nigeria SHAKIRUDEEN ODUNUGA & LEKAN OYEBANDE
Department of Geography, University of Lagos, Postal Code 101017, Nigeria [email protected] Abstract The purpose of this study was to examine the immediate and future consequences of the processes taking place in the ecologically fragile coastal flood plain of the Lower Ogun River basin. Aerial photography and Landsat multi-spectral imagery were used to assess the land use and land cover of the basin as it was in 1965 and 2005, respectively. Calculations of the area of various units for the two scenarios ware generated. Overlay analysis for change detection in a matrix format was carried out. The change matrix was used to assess the extent of degradation. The statistic land cover of the lower Ogun flood plain in 1965 was 38.01 × 10⁶ ha. The ecologically fragile wetland covered 82.45% of the total area. This figure decreased to 13 × 106 ha or 36.31% in 2005 at an average rate of 0.439 × 10⁶ ha. per annum. A conserva-tion management approach to rescue the fragile ecosystem of the lower Ogun from complete destruction is proposed. Key words change detection; flood plain; GIS; degradation; remote sensing
INTRODUCTION Information on land use and land cover forms the basis from which past and present human interaction and their impact on natural resources and the environment can be understood. Land use and land cover are linked to hydroclimatic fluxes in complex ways. In addition to being a driver of Earth system processes affecting climate, the carbon cycle and the ecosystem, land use and land cover change has a significant impact on the feedback of the hydroclimatic processes on the surface hydrology. Determining the effects of land use and land cover change on the Earth system depends on an understanding of past land use practices, current land use and land cover patterns, and projections of future land use and cover, as affected by various factors. Such factors include population size and distribution, economic development, technology, and other factors (Adeniyi & Omojola, 1999). This paper presents the pattern of the land use and cover of the lower Ogun basin between 1965 and 2005. Remote Sensing and Geographic Information Systems were used to determine the characteristics of change in land use systems of the lower Ogun River, as well as to assess the extent of degradation in the flood plain. The specific objectives of this study were to: (1) Determine the rate and trend of environmental change (land use/land cover) of the lower Ogun basin using remote sensing and GIS techniques; (2) Assess the extent of degradation and decreasing functional role of the flood plain; and (3) Examine the consequences of the observed pattern on human activities and habitats.
Copyright © 2007 IAHS Press

Shakirudeen Odunuga & Lekan Oyebande
92
Fig. 1 Location of the study area.
STUDY AREA Location and extent The study area covers the flood plain of the lower Ogun River, which discharges into the Lagos Lagoon. The main river (River Ogun) enters the lagoon in a meandering system with several bifurcations due to erosion, sedimentation and human activities. Geographically, the area extends from about latitude 6°30′22″ to 6°48′10″and longitude 3°15″ to 3°50′45″. Administratively it is shared by two State Governments, Lagos and Ogun, both in the southwestern part of Nigeria. (Fig. 1).
Physical and cultural setting The lower Ogun occupies an undulating topography generally between sea level (m.s.l.) and about 50 m above m.s.l. Surface lithology is made up entirely of alluvium sedimentary formation with coastal plain sands along the channels. This is underlain by a middle age Eocene sedimentary, popularly known as the Ilaro formation. The climate is humid tropical and experiences a contrast between dry and wet seasons. These two seasons are dependent on the two prevailing air masses blowing over the country at different times of the year. The first being the warm, dry and dusty tropical continental or the northeasterly air mass of Saharan origin, while the second is the warm and moist tropical maritime or the humid maritime air mass blowing from over the Atlantic. The mean annual rainfall is between 1500 and 2000 mm, falling during some 125 days on average. The rainy season lasts for about 8–10 months, followed by a short dry season in August and a more pronounced dry season generally between December and February. Rainfall is highly torrential with short duration and high intensity that allows for rapid concentration of storm runoff. Average day temperature varies between 21°C

Change detection and hydrological implications in the Lower Ogun flood plain, SW Nigeria
93
and 24°C and falls down to about 18°C at night. The area is a region of high surface humidity of about 80% in January (dry season) and over 90% in June/July (Wet Season). Vegetation cover is thicket, deciduous forest and scrubs. Urbanization is accelerating due to population increase and residential developments (Oyeleye, 2001). METHODOLOGY The study applied remote sensing and GIS tools to conduct change detection in land use and land cover, with the view to assessing the level of environmental degradation in the lower Ogun River basin. Thus the procedure allows for the generation of land use and land cover statistics for 1965 and 2005 in a manner useable for change analysis. Prior to image interpretation, a reconnaissance of the study area was carried out; first to develop an image–environmental model of the study area, especially as relates to land use and land cover; and second to assist in developing an appropriate land use and land cover classification scheme. Various collateral materials, including topographic maps of the study area, were used during the reconnaissance survey. Table 1 shows the data sources and their characteristics while Fig. 2 provides a schematic depicting the procedure adopted for this research. Table 1 Data sources and their characteristics.
Data type Scale Resolution Source Mosaic of aerial photographs 1:4000 5m Lagos state survey Township map with contour 1:20000 Federal survey Street map of Lagos Topographic sheet 1:25,000 Federal survey
Fig. 2 Schematic depicting procedure followed in achieving the research objectives.

Shakirudeen Odunuga & Lekan Oyebande
94
Classification scheme A pragmatic classification scheme which takes into consideration the characteristics of the multi-source, multi-scale and multi-date remote sensing data, the physical and anthropogenic activities, as well as the urban and suburban nature of the environment was developed for the study. Because of multi-dimensional use of the flood plain, five classes were identified for 1965 compared to 10 classes in 2005. Image interpretation Panchromatic aerial photography (1965) and Landsat multi-spectral satellite imagery (2005) were used to detect the changes in land use land cover of the lower Ogun basin during the 40 year period. Using the image elements such as colour, association, site, size, tonal variation and pattern, as well as the local knowledge of the environment, the land use and land cover of the lower Ogun River basin for both dates were interpreted and vectorized using on-screen digitization in the multi-source image data. Arc Map 9.1 with image analyst extension was used for the mapping and the analyses. Two major analyses were carried out on GIS to accomplish the land use change detection. These are: (a) area calculation of the land use and land cover for the two scenarios; (b) overlay of the generated land use of two different years for change detection. While the first procedure provides aerial analysis that highlights the trend and rate of land use changes over the period of analysis (1965–2005), the second provides information in matrix format on specific (point by point) change detection procedure that generate the nature, location and magnitude of changes. The direction of change was used to assess the extent of degradation and decreasing functional role of the flood plain as well as its consequence on human activities and habitation. This was achieved by combining field observation with different types of land use and land cover change (matrix) and their correlation with the occurrence of land processes. Criteria for degradation were spelled out based on the direction of change. Table 2 shows the indicator used to determine degradation. The criteria for land degradation problem assessment in Table 2 show that the degradation process/activities are not mutually exclusive. The cause and consequences of the processes/activities are often similar and in most cases overlapped. RESULT AND DISCUSSION The static land use/land cover of the lower Ogun River basin for 1965 and 2005 are presented in Table 3 and Table 4, respectively. Only five major land use and land cover types are distinctive in the 1965 scenario, with wetlands constituting over 80% (31.338 × 10⁶ ha) of the entire study area (Fig. 3). This massive wetland serves as a reservoir for excess water during heavy rain storm and high tides from the Lagos Lagoon. Historical evidence, as presented by aerial photography, reveals that flooding was uncommon to most communities, while settlers and those that live directly adjacent to the river course or on the flood plain wetland have developed local or traditional means of coping with bank overflow. The most significant coping strategy is the method of constructing the wooden building whereby the building is raised up

Change detection and hydrological implications in the Lower Ogun flood plain, SW Nigeria
95
Table 2 Degradation processes resulting from the various land use/land cover changes.
Land use and land cover indicator Environmental process Change from Change to Wetland Cultivation Water body Built up area Water body Port area Forest Built up area Forest Cultivation Forest PSNRR Forest Road
Erosion
Forest FDFPC Wetland Built up area Wetland Cultivation Wetland Road Wetland Construction Site Forest Built up Area
Flooding
Forest Cultivation PSNRR: Public service not related to road; FDFPC: Forest (deciduous & flood plain) / cultivation. Table 3 Static land use and land cover distribution for 1965.
Land use type Area (ha) % of total Built up area 0.48 × 10⁶ 1.26 Wetland (shrub and flood plain) 31.338 × 10⁶ 82.45 Forest (deciduous and flood plain) 1.70 × 10⁶ 4.48 Water body 3.72 × 10⁶ 9.81 Cultivation 0.76 × 10⁶ 2.00 Total 38.01 × 10⁶ 100.00
Fig. 3 Lower Ogun River Basin land use/land cover (1965).

Shakirudeen Odunuga & Lekan Oyebande
96
Table 4 Static land use and land cover distribution for 2005.
Land use Type Area (ha) % of Total Built up area 11.58 × 10⁶ 30.46 Public service not related to road 0.27 × 10⁶ 0.71 Construction site 0.31 × 10⁶ 0.82 Port Area 0.34 × 10⁶ 0.9 Forest (deciduous and flood plain) 0.72 × 10⁶ 1.9 Forest (deciduous and flood plain) / cultivation 0.27 × 10⁶ 0.72 Cultivation 7.09 × 10⁶ 18.65 Wetland (flood plain / shrubs) 13.78 × 10⁶ 36.25 Water body 2.85 × 10⁶ 7.49 Road 0.80 × 10⁶ 2.1 Total 38.01 × 10⁶ 100
Fig. 4 Lower Ogun River basin land use/land cover (2005).
such that there will be free flow of water under the plank structure. Also no distinctive erosion site was identified on the 1965 aerial photographs. All these suggest that there was a balanced and sustainable relationship between the natural ecological flow systems and anthropogenic activities within the lower Ogun River basin as at 1965. Also, the built up area, forest (deciduous and flood plain), water body and cultivation constitutes 1.26% (0.48 × 10⁶ ha), 4.48% (1.70 × 10⁶ ha) 9.81% (3.72 × 10⁶ ha) and 2% (0.76 × 10⁶ ha), respectively. On the 2005 Landsat multi-spectral satellite imagery, the number of identifiable features has been increased to 10 features. Table 3 and Fig. 4 show the static land use

Change detection and hydrological implications in the Lower Ogun flood plain, SW Nigeria
97
and land cover distribution for the 2005 scenario. Additional land use categories include public service area not related to road, construction sites, port area and road. Cultivation has also mixed with forest in some parts of the basin. However, like the 1965 scenario where wetlands constituted over 80% of the basin, none of the land use and land cover categories exceeds 37% of the total area. In fact, the wetland, which is still the highest land cover, constitutes 36.25% (13.78 × 10⁶ ha). This is followed by built up area that increased from 1.26% in 1965 to 30.46% in 2005. Like built up area, cultivation recorded a significant increase from 2% (0.76 × 10⁶ ha) in 1965 to 18.65% (7.09 × 10⁶ ha) in 2005. These and other major activities such as construction of light terminal port at Ikorodu (Fig. 4) and the opening of more roads reveals the extents to which the wetland of the lower Ogun River has been converted to other uses and this has resulted in severe land degradation. Table 5 shows the land use and land cover change statistics (trend) for the period between 1965 and 2005. Two (built up area and cultivation) of the five land use and land cover of 1965 scenarios recorded positive changes during the period under investigation. Forest, wetlands and water body recorded negative trends in the change equation. 17.56 × 10⁶ ha. of the wetlands were converted to other uses. This constitutes about 44.10% of the total land area. Table 5 shows the annual rate of change for each of the land use and land cover. Wetland decreases at the rate of 0.44 × 10⁶ ha per annum, while built up area increases at the rate of 0.2775 × 10⁶ ha per annum. Cultivation increases at the rate of 0.1772 × 10⁶
ha per annum. Water body decreases at the rate of 0.0220 × 10⁶ ha per annum. In all these, the greatest victim is the wetlands that lost more than half of its areal extent in less than half a century. The consequences of continuous loss of wetland, especially in the urban setting, are degradation of the environments in various forms (Selman, 1996). Nature and location of changes in land use / land cover Matrix overlay describe the nature of land use and land cover change between 1965 and 2005. The figure along the diagonals of the tables represent the areas of land use / Table 5 Land use land cover change statistics (trend).
1965–2005 Land use type Area in ha % of change Annual rate of
change Built up area 11.10 × 10⁶ 27.87 0.2775 × 10⁶
Public service not related to road 0.27 × 10⁶ 0.68 0.0067 × 10⁶
Construction site 0.31 × 10⁶ 0.78 0.0077 × 10⁶
Port Area 0.34 × 10⁶ 0.86 0.0085 × 10⁶
Forest (deciduous and flood plain) –0.98 × 10⁶ –2.46 –0.0245 × 10⁶
Forest (deciduous and flood plain) / cultivation 0.49 × 10⁶ 1.22 0.0121 × 10⁶
Cultivation 7.09 × 10⁶ 17.80 0.1772 × 10⁶
Wetland (flood plain / shrubs) –17.56 × 10⁶ –44.10 –0.4390 × 10⁶
Water Body –0.88 × 10⁶ –2.21 –0.0220 × 10⁶
Road 0.80 × 10⁶ 2.00 0.0199 × 10⁶
Shakirudeen Odunuga & Lekan Oyebande
98
land cover classes that have remained in the same locations (representing the relative stability of those classes); all figures along the rows (excluding those along the diagonal) represent losses to land use / land cover classes and those along the columns are gains to land use / land cover classes.
Extent of degradation The assessment criteria in Table 2 were used to map two major degradation activities using the matrix overlay in Table 5. These are erosion and flooding. However, the losses and gains which translate to degradations are not mutually exclusive, since what is gain by a particular land use/land cover class is what is lost by another land use and land cover class(es). Also, there are overlaps in the degradation criteria for a change from a particular land use and land cover to another land use and land cover that may lead to both flooding and erosion simultaneously.
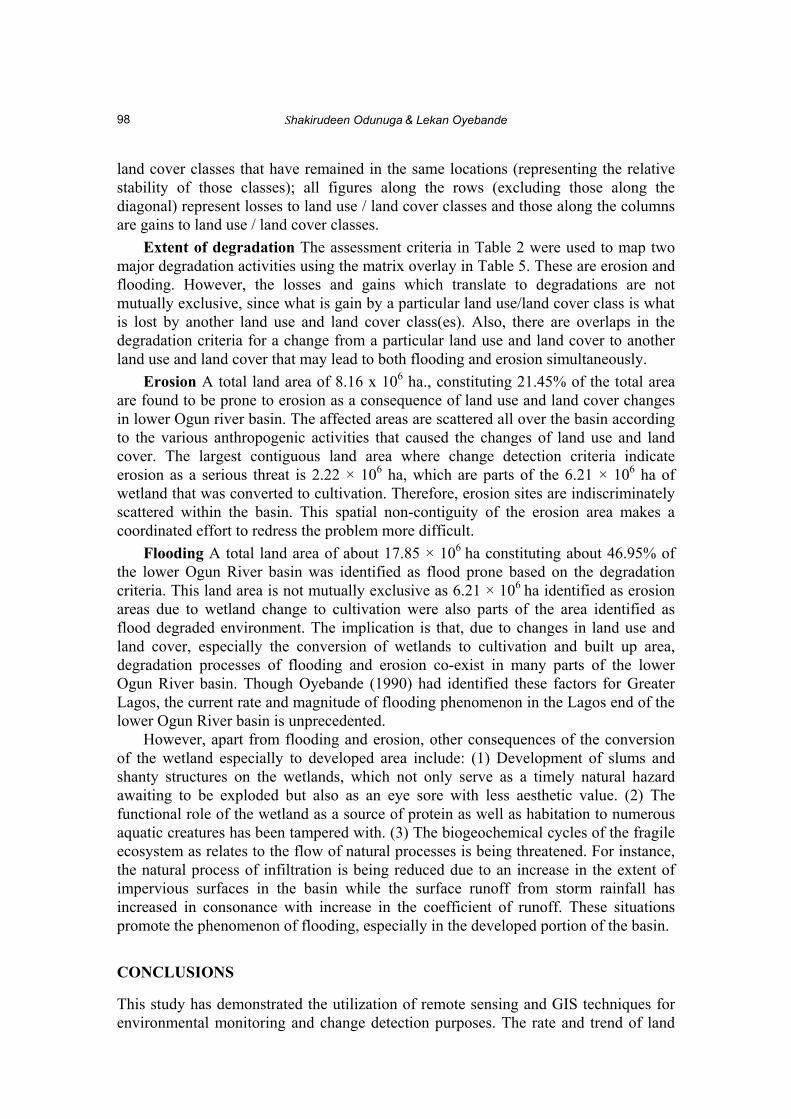
Erosion A total land area of 8.16 x 10⁶ ha., constituting 21.45% of the total area are found to be prone to erosion as a consequence of land use and land cover changes in lower Ogun river basin. The affected areas are scattered all over the basin according to the various anthropogenic activities that caused the changes of land use and land cover. The largest contiguous land area where change detection criteria indicate erosion as a serious threat is 2.22 × 10⁶ ha, which are parts of the 6.21 × 10⁶ ha of wetland that was converted to cultivation. Therefore, erosion sites are indiscriminately scattered within the basin. This spatial non-contiguity of the erosion area makes a coordinated effort to redress the problem more difficult.
Flooding A total land area of about 17.85 × 10⁶ ha constituting about 46.95% of the lower Ogun River basin was identified as flood prone based on the degradation criteria. This land area is not mutually exclusive as 6.21 × 10⁶ ha identified as erosion areas due to wetland change to cultivation were also parts of the area identified as flood degraded environment. The implication is that, due to changes in land use and land cover, especially the conversion of wetlands to cultivation and built up area, degradation processes of flooding and erosion co-exist in many parts of the lower Ogun River basin. Though Oyebande (1990) had identified these factors for Greater Lagos, the current rate and magnitude of flooding phenomenon in the Lagos end of the lower Ogun River basin is unprecedented. However, apart from flooding and erosion, other consequences of the conversion of the wetland especially to developed area include: (1) Development of slums and shanty structures on the wetlands, which not only serve as a timely natural hazard awaiting to be exploded but also as an eye sore with less aesthetic value. (2) The functional role of the wetland as a source of protein as well as habitation to numerous aquatic creatures has been tampered with. (3) The biogeochemical cycles of the fragile ecosystem as relates to the flow of natural processes is being threatened. For instance, the natural process of infiltration is being reduced due to an increase in the extent of impervious surfaces in the basin while the surface runoff from storm rainfall has increased in consonance with increase in the coefficient of runoff. These situations promote the phenomenon of flooding, especially in the developed portion of the basin.
CONCLUSIONS This study has demonstrated the utilization of remote sensing and GIS techniques for environmental monitoring and change detection purposes. The rate and trend of land

Change detection and hydrological implications in the Lower Ogun flood plain, SW Nigeria
99
use and land cover change in lower Ogun basin was determined. Using the overlay change matrix, the extent of degradation within the basin was assessed (Table 6). The consequences of the observed pattern, especially as it relates to sustainable develop-ments, were highlighted. A conservation management approach is proposed to redirect the present trend of unsustainable and disaster prone development approach, in order to rescue the fragile ecosystem of the lower Ogun River Basin from complete destruction.
Table 6 Change matrix. Land use and land cover for 2005 (Area is ×106) 1965 Built up
Area PSNRR CS Port
Area FDFP FDFPC Cultivation WFPS Water
Body Road Total
1965 Built up area 0.48 0.48 Public service not related to road
Construction site (CS) Port Area Forest (deciduous and floodplain) FDFP
0.2 0.27 0.72 0.27 0.1 0.24 1.7
Forest (deciduous and flood plain) cultivation
Cultivation 0.78 0.78 Wetland (flood plain / shrubs)
10.47 0.31 6.21 13.8 0.56 31.34
Water body 0.53 0.34 2.85 3.72 Road Total 2005 11.58 0.27 0.31 0.34 0.72 0.27 7.09 13.8 2.85 0.8 38.02
REFERENCES Adeniyi. P. O. & Omojola A. (1999) Land use/land cover change evaluation in Sokoto–Rima basin of NW Nigeria based
on archival remote sensing and GIS techniques. In: Geoinformation Technology Applications for Resources and Environmental Management in Africa (ed. by P. O. Adeniyi), 143–172. African Association of Remote Sensing of the Environment (AARSE) publication, Wura-Kay Prints, Lagos, Nigeria.
Meyer, S. P., Salem, T. H. & Labadie, J. W. (1993) Geographic Information System in urban storm–water management. J. Water Resour. Plan. Manage. 119(2), 5–9.
Oyebande, L. (1990) Aspect of urban hydrology and the challenge for African urban environment. African Urban Quarterly 5(1–2), 39–66.
Oyeleye, D. A. (2001) Settlement Geography. University of Lagos Press, Lagos, Nigeria. Selman, P. (1996) Local Sustainability Managing and Planning Ecologically Sound Places. St. Martin’s Press, New York,
USA. Ward, S. V. (1994) Planning and Urban Change. Paul Chapman Publishing, London, UK.