CHANCE News 13.01 Jan. 6, 2004 to Feb. 9, 2004chance/chance_news/recent_news/chance_news… ·...
26
CHANCE News 13.01 Jan. 6, 2004 to Feb. 9, 2004 Prepared by J. Laurie Snell, Bill Peterson, Jeanne Albert, Charles Grinstead, with help from Fuxing Hou and Joan Snell. We are now using a listserv to send out notices that a new Chance News has been posted on the Chance Website. You can sign on or off or change your address at this This listserv is used only for this posting and not for comments on Chance News. We do appreciate comments and suggestions for new articles. Please send these to [email protected]. Chance News is based on current news articles referenced in Chance listserv. Chance News Lite. The current and previous issues of Chance News and other materials for teaching a Chance course are available from the . Chance web site Chance News is distributed under the GNU General Public License (so-called 'copyleft'). See the end of the newsletter for details. Figures won't lie, but liars will figure. Charles H. Grosvenor Contents of Chance News 13.01 . (1) Forsooth. (2) Calculator parts in the Hormel Chili. (3) What are the odds of that? (4) Peter Kostelec answers a leap year question. (5) The risk of mad cow disease (6) Random music. (7) Paulos wants a math quiz for the candidates. (8) A statistical tie? (9) Place your bets on the big birds . (10) Studying literature by the numbers. (11) Pigskin overtime rules and beaned batters spur math theorems. (12) Big and Bad: How the S.U.V. ran over automotive safety. (13) Of fuzzy math and 'food security'. 2/10/04 2:52 PM Chance News 13.01 Page 1 of 26 file://localhost/Users/video/Desktop/Chance%20News/current_news/current.html
Transcript of CHANCE News 13.01 Jan. 6, 2004 to Feb. 9, 2004chance/chance_news/recent_news/chance_news… ·...

CHANCE News 13.01Jan. 6, 2004 to Feb. 9, 2004
Prepared by J. Laurie Snell, Bill Peterson, Jeanne Albert, Charles Grinstead, with help from Fuxing Hou and Joan Snell. We are now using a listserv to send out notices that a new Chance News has been posted on the Chance Website. You can sign on or off or change your address at this This listserv is used only for this posting and not for comments on Chance News. We do appreciate comments and suggestions for new articles. Please send these to [email protected]. Chance News is based on current news articles referenced in
Chance listserv.
Chance News Lite.
The current and previous issues of Chance News and other materials for teaching a Chance course are available from the . Chance web site
Chance News is distributed under the GNU General Public License (so-called 'copyleft'). See the end of the newsletter for details.
Figures won't lie, but liars will figure.
Charles H. Grosvenor
Contents of Chance News 13.01
.
(1) Forsooth.
(2) Calculator parts in the Hormel Chili.
(3) What are the odds of that?
(4) Peter Kostelec answers a leap year question.
(5) The risk of mad cow disease
(6) Random music.
(7) Paulos wants a math quiz for the candidates.
(8) A statistical tie?
(9) Place your bets on the big birds .
(10) Studying literature by the numbers.
(11) Pigskin overtime rules and beaned batters spur math theorems.
(12) Big and Bad: How the S.U.V. ran over automotive safety.
(13) Of fuzzy math and 'food security'.
2/10/04 2:52 PMChance News 13.01
Page 1 of 26file://localhost/Users/video/Desktop/Chance%20News/current_news/current.html

(14) Are athletes Bayesian statisticians?
(15) More on Tufte's book on the evils of PowerPoint.
(16) The N.F.L.'s passer rating, arcane and misunderstood.
(17) B.C.S. coordinator says that the system requires some adjusting.
(18) The need for accurate statistics in Africa.
(19) The misuse of statistical significance in economics.
(20) Estimating the prevalence of AIDS in Africa.
Here are two Forsooth from the December 2003 RSS news.
Data from UK Sport shows that football carried out 1,256 [drugs] tests from April 2002 to March 2003, more than any other sport. But these figures are misleading. There are approximately 5,000 professional footballers in England, so a footballer has roughly one in four chance of going through a drugs test.
By contrast, UK Athletics administered 509 tests in the same period against an elite performer base of 200 people -- meaning an athlete is eight times more likely to be tested.
BBC Sports.
These remarks are right opposite the following graphic:
Obesity levels in the UK have tripled in the past two decades. Almost 24 million adults are now overweight or obese - a fifth are men and a quarter are women.
The Big Issue.28 July-3 Aug 2003
2/10/04 2:52 PMChance News 13.01
Page 2 of 26file://localhost/Users/video/Desktop/Chance%20News/current_news/current.html
Myles McLeod provided the following that might also be considered a forsooth item.
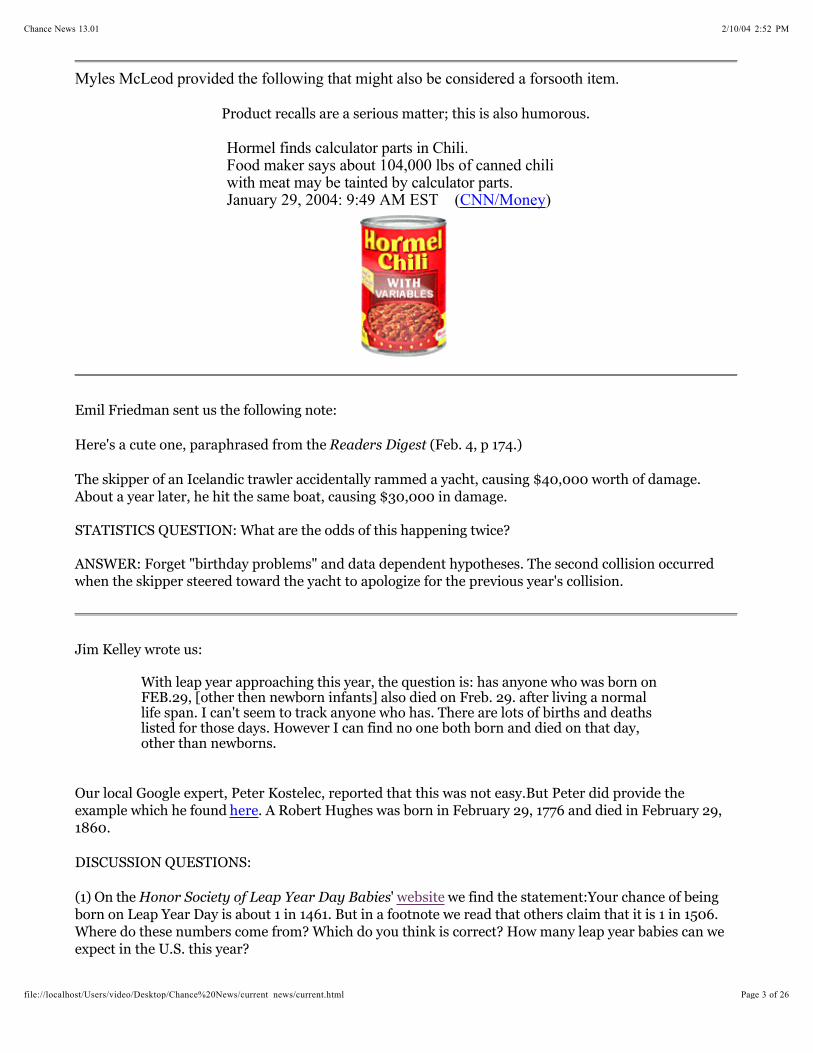
Product recalls are a serious matter; this is also humorous.
Hormel finds calculator parts in Chili. Food maker says about 104,000 lbs of canned chili with meat may be tainted by calculator parts. January 29, 2004: 9:49 AM EST ( ) CNN/Money
Emil Friedman sent us the following note:
Here's a cute one, paraphrased from the (Feb. 4, p 174.)Readers Digest
The skipper of an Icelandic trawler accidentally rammed a yacht, causing $40,000 worth of damage. About a year later, he hit the same boat, causing $30,000 in damage.
STATISTICS QUESTION: What are the odds of this happening twice?
ANSWER: Forget "birthday problems" and data dependent hypotheses. The second collision occurred when the skipper steered toward the yacht to apologize for the previous year's collision.
Jim Kelley wrote us:
With leap year approaching this year, the question is: has anyone who was born on FEB.29, [other then newborn infants] also died on Freb. 29. after living a normal life span. I can't seem to track anyone who has. There are lots of births and deaths listed for those days. However I can find no one both born and died on that day, other than newborns.
Our local Google expert, Peter Kostelec, reported that this was not easy.But Peter did provide the example which he found . A Robert Hughes was born in February 29, 1776 and died in February 29, 1860.
here
DISCUSSION QUESTIONS:
(1) On the ' we find the statement:Your chance of being born on Leap Year Day is about 1 in 1461. But in a footnote we read that others claim that it is 1 in 1506. Where do these numbers come from? Which do you think is correct? How many leap year babies can we expect in the U.S. this year?
Honor Society of Leap Year Day Babies website
2/10/04 2:52 PMChance News 13.01
Page 3 of 26file://localhost/Users/video/Desktop/Chance%20News/current_news/current.html

., with special thanks to and the current .
(2) How would you estimate the probability that a person born this February 29th will die on a later February 29th? How likely is it that one of this year's U.S. leap year babies will die on a later 29th February?
Greg Leibon is teaching the Dartmouth Chance class this term and gave us his discussion motivated by the recent mad cow disease scare.
Mad Cow MadnessGreg Leibon Elizabeth Jane Whittington Chance! Class
Question 1. Suppose you are in the middle of a mad cow epidemic and really want a half pound hamburger. How many miles should you cut out of your driving schedule to balance out the risk of eating this burger? (Answer: Exactly one mile!)
Question 2. Suppose you are in the middle of a mad cow epidemic and you just bought a Powerball lottery ticket and ate a half pound hamburger. Is it more likely that you will win the jackpot or perish from the human form of Mad Cow Disease? (Answer: Both these chances are equal!)
Discussion Questions:
1. Who might like us to dwell on each of the above comparisons?
2. What have we learned about the chance of winning the lottery as compared to the risks associated to driving?
Solutions to Mad Cow Madness.
First, we will estimate the risk
Mad Cow Risk.
First, we will estimate the risk of getting, hence dying from, a disease-inducing-serving of beef during the British "Mad Cow Epidemic". We will estimate this risk by using the ratio of the number of disease-inducing-servings of beef caused by the epidemic to the total number of beef servings produced by Britain during the epidemic.
Let's first determine our denominator. Using this we find that the United Kingdom produces about (1000)(1000) tons of beef for consumption each year. Using a conversion this is
(1000)(1000)(.9842)(2240) pounds or rather about 2(10 ) pounds. Let's assume that a serving is about
1/2 a pound. Then the British beef industry produces about (2)(2)(10 ) servings of beef a year. This
epidemic lasted at least . Hence there were at least (5)(2)(2)(10 ) servings of beef produced.
datatable
9
9
five years 9
Now let's estimate our numerator. , there were about 140 deaths attributed to diseased cow meat
during the Mad Cow Epidemic in Britain. Hence of the 5(2)(2)(10 ) servings of beef, we will estimate about 140 were disease inducers.
Recall9
From these estimates, the chance of a given serving of beef being a disease-inducing-serving is about
140/((5)(2)(2)(10 ))=70/(10 ), or rather a bit less than 100/(10 ) = 1/10 . 9 10 10 8
Discussion Questions:
2/10/04 2:52 PMChance News 13.01
Page 4 of 26file://localhost/Users/video/Desktop/Chance%20News/current_news/current.html

It is that the odds of winning the Powerball jackpot are 1 in 1.2(10 ). In other words, the chance of winning the jackpot is about 1/10 .
(1) the relevance of this computation to the current U.S. "Mad Cow Scare". Discuss
(2) the assumptions we made in order to interpret our ratio as a chance. Discuss
(3) the assumptions we made in order to estimate this ratio's numerator and this ratio's denominator.
Discuss
(4) whether or not it is reasonable to consider our estimate a worst case scenario. Discuss
Driving Risk.
Second, we will estimate the risk associated to risk associated to driving a mile. First choose our
possibilities, namely all the miles driven. From this we find there were 2.6 (10 ) miles driven in US in 2000. Now we need to estimate which of these miles ended in an occupant fatality. Using this as well as the above, we find that there were (41,717-5,842) (or about 35000) occupant fatalities. ASSUMING that each fatality corresponds to some given mile, we have that our risk of being killed in a
given mile is about (35000)/(2.6(10 )) or very nearly 10 /10 = 1/10 .
data 12
data
12 4 12 8
Discussion Topics:
1. Discuss the assumptions we made in order to interpret such our ratio as a chance.
2. Discuss the assumptions we made in order to estimate this ratio's numerator and this ratio's denominator.
Jackpot Chance.
well known 8
8
Discussion Topic:
1. how you could figure out this number yourself Discuss
Peter Doyle received a random disc with random music and suggested that readers of Chance News might enjoy participating in this project.
This is an interesting random music project under the direction of Doyle Dean. The gives the following description of the experiment.
A Pop/Rock Music Experiment in Random Determination
projects web site
We have produced a compact disc containing thirty songs that have essentially written themselves. Each song is ninety seconds in length and each was conceived by methods of random determination. Song structures have been used as blueprints upon which individual notes or chords have been changed according to dice rolls. From drumbeats and guitar sounds to vocal and lyrical content, chance and fate have nurtured the songs into being. The pieces were written and recorded at the time of creation, one element at a time. The musicians have never performed nor ‘rehearsed’ these pieces in a conventional manner. Only now do the elements come together in song form.
2/10/04 2:52 PMChance News 13.01
Page 5 of 26file://localhost/Users/video/Desktop/Chance%20News/current_news/current.html

One thousand compact discs are being sent out into the world using (quasi) random methods, e.g., left in a restaurant in Topeka, a subway car in New York, or aboard a boat in Bangkok. The discs will then be (re)distributed by willing participants. The multi-lingual liner notes will encourage one who comes across a CD to listen to and/or copy the material and then pass the disc on, either to a friend or by random means. They will also be encouraged to log on to our web site and enter the disc number, location and date. The CDs are not for sale, nor are they to be kept.You can learn more about this project and hear samples of the music at the
.projects
web site
We are told that there are still some CD's available. If you are interested contact Doyle Dean.([email protected]).
Who's counting.Arithmetic and the candidates, January 1, 2004.John Paulos
ABCNews
In his January monthly column for ABCNews, John Paulos suggests that every President should know some math. So he proposes that moderators of political debates, both for the primary and general elections, ask at least one basic numerical question during each debate. He provides a short quiz with ten questions to show what he has in mind.
DISCUSSION QUESTION:
Go to and read John's ten questions and see how you do on his quiz. Then estimate the score President Bush and the current Democratic candidates would get on his quiz.
Who's counting
Rich Gordon suggested this item.
A Fair and Balanced WeblogMark Kleiman
Mark Kleiman, Professor of Policy Studies at the UCLA School of Public Policy and Social Research, maintains a monthly electronic newsletter called " " in which he comments on current political issues. The January issue includes an amusing discussion called where Kleimin critiques the meaning of margin of error used in a January 7, 2003 Associated Press article. This article starts with:
A Fair and Balanced WeblogWrong!
WASHINGTON -- Wesley Clark has closed the gap with Howard Dean among Democratic voters, according to a national poll taken at a time when Dean had been under intense criticism from rivals. Dean had the support of 24 percent and Clark had the backing of 20 percent in the CNN-USA Today-Gallup poll out today. The poll of 465 Democrats and those who lean Democratic had a margin of sampling error of plus or minus 5 percentage points, meaning Dean and Clark are essentially tied for the lead nationally. The poll was taken Jan. 2-5.
You will also find here up-to-date poll information, including the prices at the . and . Kleiman also gives a good description of how
the Iowa electronic markets works.
Iowa electronic markets winner-take-all nomination contract Tradesports here
2/10/04 2:52 PMChance News 13.01
Page 6 of 26file://localhost/Users/video/Desktop/Chance%20News/current_news/current.html

(1) What do you think the phrase "Dean and Clark are essentially tied for the lead" means? What do you think the AP thinks it means? Is it reasonable to call it a "statistical tie" if the differences between the candidates are within the margin of error?
(2) Kleiman's critique of how the 5% margin of error is interpreted in the article includes the following explanation. "All it means is that, if I'd called another 465 people at the same time, using the same algorithm to select them, using the same weighting formula to adjust the sample to the assumed population of actual voters, and having the same interviewers ask the same questions, there's a 95% chance that the results of the second sample would have been within 5 points of the results of the first sample." Critique Kleiman's explanation.
(3) Kleiman posts a reader's response to the above statement in which it is asserted that "a sampling error of +/– 5 points means there is a 95% chance that the sampled proportion is within 5 points of the true population proportion...There is only an 83.5 percent chance that the 'results of the second sample would have been within 5 points of the results of the first sample.'"Critique this statement. How do you think the 83.5% probability was determined?
(4) What do you think is the best way to report the polling results and how the margin of error should be interpreted?
DISCUSSION QUESTIONS:
Myles McLeod provided the next item.
Place your bets on the big birds.
Alex Kirby BBC News Online
UK online betting firm has paired with an organization called the and the to raise awareness about the plight of the Tasmanian Shy
Albatross by launching The Big Bird Race.
ladbrokes.com Conservation Foundation Tasmania state government
An estimated 300,000 of the birds die each year from entanglement in fishing lines as they migrate 6000 miles from Tasmania to South Africa.
The race goals are:
2/10/04 2:52 PMChance News 13.01
Page 7 of 26file://localhost/Users/video/Desktop/Chance%20News/current_news/current.html

Encourage more countries to sign a document called the Agreement for the Conservation of Albatrosses and Petrels (ACAP).
Raise funds for further conservation efforts.
The Big Bird Race.
Scientists will fit eighteen birds with satellite transmitters so their movements can be monitored via the Internet. Ladbrokes.com will post betting parameters and amounts on their Web site shortly. The race lasts from March to August. Schools and minors can monitor the racewithout betting from www.wildlifebiz.org.
The Course.
The foundation asked Ladbrokes to back the event because it says the race is very like horse racing, especially the Grand National.
They are two of the world's longest steeplechases/migrations.
There are major hurdles to overcome (the albatrosses will risk hypothermia over the southern ocean).
The horses have trainers, the birds have scientists monitoring them.
Each albatross will have the equivalent of an owner, a high-profile backer (still to be announced).
In place of jockeys, the birds will carry tags.
Backers will be able to follow the action and bet on the outcome of both races.
Only five months to go on one of the world's longest migrations
2/10/04 2:52 PMChance News 13.01
Page 8 of 26file://localhost/Users/video/Desktop/Chance%20News/current_news/current.html

Source: BBC News, 22 Jan. 2004
., 10 Jan, 2004
Emily Eakin
Studying literature by the numbersNew York Times
Graphs, Maps, Trees: Abstract models for literary history - 1, Nov Dec 2003
Franco Moretti New Left Review
Franco Moretti is a professor of English and comparative literature at Stanford and is director of the university's center for the study of the novel. He has decided that literary research should make better use of some of the tools of science. He is writing three papers for the to show how this might be done using graphs, maps, trees, and abstract models. This first paper emphasizes the use of graphs. The article writes:
New Left Review
Times
If Franco Moretti had his way, literature scholars would stop reading books and start counting, graphing and mapping them instead. For an English professor, this is an ambition verging on apostasy. But Mr. Moretti... insists that such a move could bring new luster to a tired field, one that in some respects, he says, is among "the most backwards disciplines in the academy."
Literary study, he argues, has been a random, unsystematic affair. For any given period, scholars focus on a select group of a mere few hundred texts: the canon. As a result, they have allowed a narrow, distorting slice of literary history to pass for the total picture.
"What a minimal fraction of the literary field we all work on," Mr. Moretti declares, tactfully including himself among the guilty. "A canon of 200 novels, for instance, sounds very large for 19th-century Britain (and is much larger than the current one), but is still less than 1 per cent of the novels that were actually published: 20,000, 30, more, no one really knows — and close reading won't help here, a novel a day every day of the year would take a century or so."
The perils of such a method, he writes, are clear: "A field this large cannot be understood by stitching together separate bits of knowledge about individual cases, because it isn't a sum of individual cases: it's a collective system, that should be grasped as such, as a whole."
To illustrate this Moretti provides the following simple graph showing the three rises of the British novel.
The three rises of the British novel.
2/10/04 2:52 PMChance News 13.01
Page 9 of 26file://localhost/Users/video/Desktop/Chance%20News/current_news/current.html

Moretti remarks that such a plot provides the data but does not provide the interpretation. He says "Where the significant turning points lie along the continuum--and why--is something that must be decided on a different basis".
Sources: McBurney, : Beasley, ; Raven, ; Peter Garside, James Raven and Rainer Schöwerling, eds,
, 2 vols,Oxford 2000: Andrew Block. The English , London 1961.
Check List of English Prose Fiction 1700-39The Novels of the 1740 British Fiction 1750-70
The English Novel 1770-1829
Novel, 1740-1850
Moretti provides similar graphs for other countries showing considerable variation in the patterns of evolution of the novel in different countries. Click for a graph showing the fall of the novel in Japan. He also provides other graphs, including one showing the coming and going of different types of novels, and discusses what can be inferred from these graphs. You can see his graph of the evolution of the types of British novels from 1740-1900
here
here.
The article reports that Harold Bloom pronounced Mr. Moretti "an absurdity."NYTimes
I am interested in reading, "he said with an audible shudder." That's all I'm interested in."
The article goes on to say:
Mr. Moretti cheerfully acknowledge that his ideas were controversial. But that has not dampened his enthusiasm."My little dream, "he added wistfully, "is of a literary class that would look more like a lab than a Platonic academy".
Emil Friedman suggested the following discussion question:
DISCUSSION QUESTION:
What would happen to Moretti's "turning points" were he to plot the per-capita number of novels, or the number of "quality" (as defined by methods similar to those of Charles Murphy?) novels, etc.
Pete Schumer suggested the following article.
Pigskin overtime rules and beaned batters spur math theorems. , 9 January 2004, A7Wall Street Journal
2/10/04 2:52 PMChance News 13.01
Page 10 of 26file://localhost/Users/video/Desktop/Chance%20News/current_news/current.html

Sharon Begley
This is a report on several sports models that were presented at the Joint Mathematics Meetings in Phoenix.
Doug Drinen of the University of the South presented a paper on the "economics of plunking," which compares the rate of hit batsmen in Major League Baseball's American and National Leagues. Various explanations have been proposed for the AL's higher rate, focusing on the designated hitter rule. One holds that the designated hitter is simply another strong batter that a pitcher might need to intimidate. Another view is that, because the pitcher never comes up to bat, he has no fear of a retaliatory beaning. Drinen's statistical model says that 60% to 80% of the difference between the AL and NL can be explained by the possibility of retaliation.
Michael Jones of Montclair (NJ) State University applied Markov chains to study the National Football League's overtime rules. The sudden death first-to-score format effectively turns overtime into a field goal competition, and winning the coin toss is a big advantage (in 2002, the team that won the toss won 17 of 24 overtime games). Jones's model compared the current rules with a first-to-six-points format, assuming a 21% probability of scoring a touchdown and 12% probability of scoring a field goal on any possession. In the existing first-to-three format, the receiving team had a 55% chance of winning, compared with a 49% chance in the proposed first-to-six format.
DISCUSSION QUESTION:
Are the results given to show that it is an advantage to win the toss statistically significant?
Big and Bad: How the S.U.V. ran over automotive safety., 12 January 2004, 28-33
Malcolm GladwellThe New Yorker
Sport Utility Vehicles (S.U.V.'s) continue to be enormously popular, even though most owners rarely need their off-road capabilities. Moreover, despite repeated studies about roll-over risks and other safety problems, consumers regularly report that they feel safe in these vehicles. In this essay, Gladwell explores these paradoxical preferences.
Auto-makers like S.U.V.'s because they are easy to build by adapting simple truck frames. Minivans, by contrast, require more engineering. Their "uni-body" construction must meet automobile safety standards and be light enough to meet fuel efficiency targets. The heavy duty construction does not make S.U.V.'s safer. The article notes that in a 35 mph crash test, "the driver of a Cadillac Escalade S.U.V. has a 16% chance of a life-threatening head injury, a 20% chance of a life-threatening chest injury and a 35% chance of a leg injury." The corresponding figures for a Ford Windstar minivan are 2%, 4% and 1%, respectively.
The article presents the a larger dataset, from Tom Wenzel of Lawrence Livermore Laboratory and Mark Ross of the University of Michigan, showing fatalities per million cars for both drivers of various models and for drivers of the cars they hit.
Make/Model Type
Driver Deaths
per million
cars
Other Deaths
per million
cars
Total
Toyota Avalon large 40 20 60
2/10/04 2:52 PMChance News 13.01
Page 11 of 26file://localhost/Users/video/Desktop/Chance%20News/current_news/current.html

Chrysler Town & Country
minivan 31 36 67
Toyota Camry mid-size 41 29 70
VW Jetta subcompact 47 23 70
Ford Windstar minivan 37 35 72
Nissan Maxima mid-size 53 26 79
Honda Accord mid-size 54 27 82
Chevrolet Venture minivan 51 34 85
Buick Century mid-size 70 23 93
Subaru Legacy/Outback
compact 74 24 98
Mazda 626 compact 70 29 99
Chevrolet Malibu mid-size 71 34 105
Chevrolet Suburban S.U.V. 46 59 105
Jeep Grand Cherokee S.U.V. 61 44 106
Honda Civic subcompact 84 25 109
Toyota Corolla subcompact 81 29 110
Ford Expedition S.U.V. 55 57 112
GMC Jimmy S.U.V. 76 39 114
Ford Taurus mid-size 78 39 117
Nissan Altima compact 72 49 121
Mercury Marquis large 80 43 123
Nissan Sentra subcompact 95 34 129
Toyota 4Runner S.U.V. 94 43 137
Chevrolet Tahoe S.U.V. 68 74 141
Dodge Stratus mid-size 103 40 143
Lincoln Town Car large 100 47 147
Ford Explorer S.U.V. 88 60 148
Pontiac Grand Am compact 118 39 157
Toyota Tacoma pickup 111 59 171
Chevrolet Cavalier subcompact 146 41 186
Dodge Neon subcompact 161 39 199
Pontiac Sunfire subcompact 158 44 202
Ford F-Series pickup 110 28 238
The moral is that size does not translate into safety: the mid-size Toyota Camry and Honda Accord have better records than the Chevy Suburban or Ford Explorer S.U.V.'s. The article observes that consumers overvalue "passive" safety features such as greater size and weight while discounting "active" safety features such as better maneuverability and shorter stopping distance. The S.U.V. craze thus presents another example where people's subjective perception of risk does not square with the data.
DISCUSSION QUESTIONS
2/10/04 2:52 PMChance News 13.01
Page 12 of 26file://localhost/Users/video/Desktop/Chance%20News/current_news/current.html
Perry Lessing suggested the following story.
(1) Do the "fatalities per million cars" data surprise you? Why or why not?
(2) Which vehicles do you think are the most dangerous? In answering the question, what weight did you give to the data presented in the table? Do you think your answer might be different if additional data were available, such as vehicle-miles driven?
(3) Critique the following statement. "Cars don't kill people; drivers kill people."
Of fuzzy math and 'food security'., 11 January 2004, Sect. 4, p. 16
Tom ZellerNew York Times
In December, the US Council of Mayors released its annual survey on hunger and homelessness. You can read its or download the . A key finding was a 17% increase in the demand for emergency food, a story that was widely reported in the media. It turns out, however, that the survey has found increased demand every year since 1988, with a high of 26% in 1991 and a low of 9% in 1995.
press release full report
The American Heritage Foundation issued its own criticizing the methodology of the survey. It cited data from the Census Bureau and the US Department of Agriculture showing that while "food insecurity" is indeed up somewhat in the last few years, it remains lower than it was in 1995. So why, they ask, should the survey results systematically differ from national trends?
report
A spokesperson for the Council of Mayors conceded that the 25 individual cities in the sample did their own research, and the Council then compiled the percentages. The figures should not be used, for example, to produce estimates of the actual number of Americans living in hunger. Nevertheless, the Council believes that the findings reflect the continued pressure on service agencies.
The presented a graphical comparison of the two reports, entitled .
Times One Topic, Two Studies, Two Conclusions
., 20 January 2004), F1
David Leonhardt
Subconsciously, athletes may play like statisticiansNew York Times
, 427 (15 January 2004), 244-247Konrad P. Kording and Daniel M. Wolpert
Bayesian integration in sensorimotor learning.Nature
When an athlete makes a split-second decision, fans are likely to interpret it as a finely trained reflex. But the research reported here suggests that the athlete is subconsciously doingprobability calculations. The quotes Kording as saying "the human brain knows about Bayes rule." The cover of the issue features a tennis player running to make a shot. The caption reads "Anyone for bayesian integration?".
TimesNature
The researchers constructed an experiment in which subjects tried to guide the cursor across a computer screen which blocked their view of the controlling hand. In practice runs, the cursor appeared on average one centimeter to the right of the subject's hand. During the experiment, subjects got information about the location of the cursor when it was about halfway across the screen. Sometimes it was a distinct arrow, other times a vague cloud. When the arrow appeared, the subjects used that information directly. When the cloud appeared they used the uncertain information in a manner consistent with Bayesian updating of
2/10/04 2:52 PMChance News 13.01
Page 13 of 26file://localhost/Users/video/Desktop/Chance%20News/current_news/current.html

their experience from the practice runs.
The article explains that tennis players have to be better randomizers than people who are asked to mentally generate coin flip patterns. For example, a player receiving serves tries to anticipate whether the ball will come to the forehand or backhand side, and would be able to take advantage of nonrandom patterns.
Times
In we discussed Edward Tufte's new book and we asked the following discussion question: Do you agree with Tufte that PowerPoint presenatations are so bad? If so, why do so many people use them?
Chance News 12.06 The Cognitive Style of PowerPoint
Myles McLeod answers this question:
The following anonymous Amazon.com review of Tufte's book recounts one reviewer's informal empirical comparison of several co-workers' PowerPoint presentations versus his own handout presentation created using Tufte's recommendations:
December 29, 2003.
Reviewer: from Highland, CA United States.
After the first read, I was disappointed with Edward Tufte's essay on PPTs. I was expecting more practical suggestions from the master of visualizing information; steps we could all take to make our PPTs better. This essay mostly gives graphic examples of bad PPTs. We've all seen plenty of bad PPTs in our lives. Do we really need to pay Mr. Tufte to see more?
The point of the essay seems to be, instead of trying to make your PPTs better, you shouldn't even bother using the evil software package from Microsoft. Instead, make a nice handout for your audience.
So I decided to perform a test. I was involved in an internal presentation to a different group in the company. One by one, eight different managers gave a 10 to 15 minute presentation to a group of about 25 people. While the other managers worked on their PPTs, got their laptops ready, and made sure a screen and a Boxlight would be in the conference room, I worked on a one-page handout. My presentation would stand by itself, without the crutch of PPT illuminating the wall behind me; the handout would supplement my presentation, and would allow the audience to take something physical back to their offices.
After the presentations were over, the audience was asked to fill out a survey. To summarize, they hated the handouts, loved the PPTs. And the PPT presentation they loved the best was one of the most hideous examples I had ever seen--one Mr. Tufte would have had a field day tearing apart, one slide at a time.
I agree that too many presenters use bad PPTs as a crutch, and as presenters we should rely more on handouts as a secondary communication tool. However, in my own experience the audience seems to want and *expect* PPTs-in which case a bad PPT might be more effective than no PPT at all. Read Tufte's essay and take his points to heart, but ultimately, KNOW YOUR AUDIENCE!
Know Your Audience!
A reader
Source: Amazon.com
His statement “” misses the point. Tufte made quite an impression by simply showing how many (most?) users
We've all seen plenty of bad PPTs in our lives. Do we really need to pay Mr. Tufte to see more ?
2/10/04 2:52 PMChance News 13.01
Page 14 of 26file://localhost/Users/video/Desktop/Chance%20News/current_news/current.html

employ the tool. Given Tufte’s view that the product should be subject to a global product recall, is it surprising that he does not offer more PowerPoint presentation improvement tips? How polished could the reviewer’s presentation have been if he produced it “
…” ? One can only speculate about why the reviewer’s audience preferred the PowerPoint presentations over his handout. Perhaps the handout was not as effective as the reviewer thought, or his delivery did not match his peers’. Whatever the case, it would be interesting to hear Tufte’s comparison of the two. PowerPoint is used almost everywhere today, and barring unforeseen circumstances at Microsoft, it is likely to be around for many more years. A random Web poster named ‘maglia’ offers his views on a board devoted to Web design. He believes PowerPoint files are an unavoidable medium that should be used with restraint then quickly destroyed to guard against their future use as substandard historical records. So, is PowerPoint evil? Some say yes; others no. An otherwise outstanding presentation converted to PowerPoint may lose clarity, impact and variety as surely as an atrocious presentation converted to PowerPoint may benefit from added structure and ease of use. Tufte’s implied argument seems to be that PowerPoint’s net effect across millions of users has been a significant lowering of average presentation quality. This tendency to find middle ground is recognizable as the well known principle called “Regression to the Mean". The term is attributed to Francis Galton [1] (1822-1911), who in turn credits Belgian astronomer and statistician Adolphe Quetelet (1796-1874) for his ideas on the Bell Curve. An interesting sidebar about Quetelet is that he is also namesake for the term , the measure for obesity. Cornell Professor William Trochim [2] provides an illustrated treatment of regression to themean in his . Suppose we change his regression diagram by substituting the terms ‘Pre-PowerPoint Quality’ for ‘pretest’, ‘Post-PowerPoint Quality’ for ‘posttest’, then relabel the horizontal axis ‘Presentation Quality'. Trochim’s graphs would then visually communicate the same message Tufte preaches. Using Trochim’s terminology, Tufte could then say that the ‘regression artifact applies to the quality of PowerPoint presentations among a nonrandom sample from a selected population'.
While the other managers worked on their PPTs, got their laptops ready, and made sure a screen and a Boxlight (were) in the conference room
here
Quetelet index
research guide
From The Memphis Daily Avalanche Memphis, Shelby County ,Tennessee
April 2, 1887
: Source TheOldenTimes.com
Blaming PowerPoint for producing poor presentations is unfair. To do so is to commit a judgment error
2/10/04 2:52 PMChance News 13.01
Page 15 of 26file://localhost/Users/video/Desktop/Chance%20News/current_news/current.html

termed the described by Robert Todd Carroll [3] in his . Carroll explains the regressive fallacy is the mistaken attribution of cause that can be accounted for in the normal random happening of events. PowerPoint then is arguably no more responsible for causing a poor presentation today than Gooch’s Mexican Syrup mentioned in graphic above was responsible for curing the Rev. Thomas B. Warwick’s asthma in 1887. PowerPoint simply makes it much easier to turn both great and poor presentations into mediocre ones. The real issue however, is that while bad presentations existed before widespread PowerPoint adoption, they are now much more likely to happen.
regressive fallacy, Skeptic’s Dictionary
Why then do so many people use PowerPoint if they think it has such obvious flaws? They use it for the same reason they use MS Windows – it is everywhere and often its use is compulsory. On the other hand, advocates say the tool is convenient, easy to use, and standardized.
And so, what steps can a reluctant PowerPoint user take to improve presentations As chance would have it, Pamela Bagley and David Izzo of Dartmouth Biomedical Libraries offer some , a PowerPoint presentation entitled , and other .
general tipsPowerPoint: the Good, the Bad, and the Ugly resource links
Finally, unabashed PowerPoint fans can take heart that a teen has provided this of .
[1] Galton F., “Regression towards mediocrity in hereditary stature”, 1886;15:246-63.
[2] Trochim, William M., The Research Methods Knowledge Base, 2nd Edition. Internet WWW page, at URL: < > (version current as of 08/06/2003).
[3] Carroll, Robert T., The Skeptic's Dictionary: A Collection of Strange Beliefs, Amusing Deceptions, and Dangerous Delusions, John Wiley & Sons; 1st edition, 2003.
(1) Is concern about PowerPoint becoming a medium of record with the potential to dull the expression of complex ideas a valid worry? (2) If tasked to deliver a persuasive presentation, how would you utilize PowerPoint to maximize your message’s emotional impact? Would your strategy differ if your main discussion goal was to ensure accurate transmission of facts?
condensed version The Cognitive Style of PowerPoint
REFERENCES
Journal of the Anthropological Institute
http://trochim.human.cornell.edu/kb/index.htm
MORE QUESTIONS:
, 14 January 2004, D1Richard Sandomir
The N.F.L's passer rating, arcane and misunderstood.New York Times
The NFL's passer rating system was featured in sports pages this month when Peyton Manning of the Indianapolis Colts achieved a perfect rating of 158.3 in a playoff game against Denver. This unwieldy figure comes from a formula that has been used since 1973 to rate quarterbacks. It combines four components of performance: percentage of passes completed, average yards per completion, percentage of passes for touchdowns and percentage of passes intercepted. Unfortunately, the article does not completely clarify the formula. We read:
Times
How does a quarterback attain a 158.3 rating? He must ace all four categories, which for mathematical reasons, awards a maximum of 2.375 points if his completion percentage is
2/10/04 2:52 PMChance News 13.01
Page 16 of 26file://localhost/Users/video/Desktop/Chance%20News/current_news/current.html
Well, there are problems on the college front also.
at least 77.5 percent; his ratio of touchdowns to passing attempts is at least 11.9 percent; he averages 12.5 yards a pass; and he throws no interceptions.
If the quarterback hits the jackpot, as Manning did against Denver, his four-category total of 9.5 is divided by 6, then multiplied by 100, and the result is 158.3.
Any performance below those targets receives fewer points, and requires a maze of arithmetic gesticulations to reach the final rating.
You can find more information online. A number of web sites present some version of an that computes the rating from raw data on number of attempts, completions, total yards,
touchdowns and interceptions. The has more detail, explaining some of the philosophy behind the formula, illustrating with data for the 49ers Steve Young, whose season mark of 112.8 for 1994 stands as the NFL record.
online calculator
NFL web site
The most complete description we could find is , which gives all the computational details. Each category is scored with a piecewise linear function. For example, in the completion category, anything below 30% gets a score of 0 and anything above 77.5% gets 2.375. Between these values, the scale is linear with a slope of 0.05. This site presents a number of other pedagogical activities in the sciences, including other exercises with .
StudyWorks! Online
probability and statistics
B.C.S. coordinator says that the system requires some adjusting., 5 Jan. 2004
Joe DrapeNew York Times
This article begins with:
Mike Tranghese, the coordinator of the Bowl Championship Series, said Sunday that the formula for creating a national title game had failed this season by leaving Southern California out of the Sugar Bowl. The Trojans were No. 1 in polls by the news media and the coaches.
"Never in our wildest dreams did we think we could have the No. 1 team in both the human polls not here playing for the national championship," Tranghese said at the Superdome before the B.C.S. title game between Oklahoma and Louisiana State. "We've got to do something different."
This might be a good time to discuss football rankings in your class. There is a huge amount of literature here and the best we can do is to point you to some web sites that would be helpful for such a discussion. We are indebted to Hal Stern for suggesting these sites and his comments on them.
. Here you will find a description of the system in its nuts and bolts.
. The Billinglsy system is one of the 7 computer systems included. You will find here links to all of the computer systems. Massey, Wolfe, Billingsley, Colley including varying degrees of detail about their ratings. Sagarin, Anderson and Hester, and the NY Times basicallyprovides zero details. has an interesting comparison of a large number of rating systems.
is interesting. You can go in and change a game and see what happens to
The official BCS web site
Billingsley's college football site
Massey's page
Colley's site
2/10/04 2:52 PMChance News 13.01
Page 17 of 26file://localhost/Users/video/Desktop/Chance%20News/current_news/current.html

his ratings. If you change the outcome of the Boise St - Hawaii game (which Boise won) which ended the regular season you find the USC jumps ahead of LSU in the Colley ratings and this is enough to have USC jump ahead of LSU in the entire BCS selection process. How odd is that?
And here is another article you might like to read.
, Vol. 32, No. 5, Sept-Oct. 2002,pp85-94Joseph Marinich
College football rankings: do computers know best?Interfaces
Here is a the abstract for this article:
The bowl-championship-series (BCS) committee uses 10 ranking schemes, including eight computer rankings, to select college football teams for bowl-championship-series bowl games, including the national championship game. The large financial benefits of participating in BCS bowl games make it imperative that the selection process accurately select the best teams. We evaluated the performance of the 10 ranking schemes the BCS committee used during the 1999 and 2000 seasons to select bowl teams. We found that almost all are equally accurate, but the Seattle Times scheme clearly underperforms the others. In addition, two proposed changes to the BCS selection formula, (1) to prohibit computer ranking schemes from considering the margin of victory in their rankings, and (2) to include explicitly the outcomes of head-to-head games among teams being considered for BCS bowls, could do more harm than good and could decrease the likelihood of the committee selecting the best teams for the BCS bowls.
Here's a cartoon on this subject sent to us by Emil Friedman:
The next articls was contributed by John Gavin who remarked that it shows the importance of good statistics when policy makers are making decisions about resource allocations.
Africa's Potemkin deception. , London, Tues, Jan 19, 2004, page 21,
Michael HolmanFinancial Times
The author says that the lack of basic statistics about countries in Africa hampers decisions about how best to allocate resources. For example, it is believed that Nigeria has the biggest population in Africa but the population could be anywhere from 120 to 140 million people. Holman says:
2/10/04 2:52 PMChance News 13.01
Page 18 of 26file://localhost/Users/video/Desktop/Chance%20News/current_news/current.html

The last reliable census was conducted by the British in the colonial era about 50 years ago. Post-independent counts have been distorted by rivalry between the Christian south and the Muslim north and tensions over the distribution of the country's oil wealth among the states: allocation is based partly on a state's population.
If we do not know something as fundamental as the number of Nigerians, who account for one in six Africans (or five or seven) and we guess at their birth rate, every statistic about Nigeria confidently cited by its development partners is not a fact, but an assumption, based on trends with questionable foundations.
And if this is the Nigeria, can we believe World Bank figures, often based on extrapolations that go back decades, for Mail or Malawi or Mozambique, whether about radio sets per 1,000 households or literacy rates?
Holman was Africa editor of the from 1984 to 2002. You can read essentially the same article .
Financial Timeshere
John Gavin also recommended the following article:
The article begins with the following cryptic comment based on a variation on our quote for this issue.
Signifying nothing?Too many economists misuse statistics
, 29 Jan. 2004, p71.The Economist
Figures lie, as everyone knows, and liars figure. That should make economists suspect, since they rely heavily on statistics to try and resolve a wide range of controversies.
The article goes on to discuss the misuse of statistical significance in many economic studies. We read:
A failure to separate statistical significance from plausible explanation is all too common in economics, often with harmful consequences. In a past paper Professors McCloskey and Ziliak (1) attacked other economists' over-reliance on statistical rather than economic reasoning, and focused on one case in particular.
In the 1980s, the American state of Illinois launched a programme to keep people off the dole. Economists asked whether its costs outweighed its benefits. One study estimated that the programme produced benefits that were more than four times as large as the costs. Although this seemed a good deal for taxpayers--and other tests seem to support this conclusion--the authors of the study rejected such a finding because they found that their estimate was not statistically significant. In other words, their results fell just short of 90% certainty--the usual, though ad hoc, rule of thumb for most economic work--of not being random.
But far from this being an unusual case, Ms McCloskey and Mr Ziliak found that 70% of the papers published during the 1980s in the American Economic Review (AER), one of the most respected journals of the dismal science, failed to distinguish between "economic" and "statistical" significance. They relied too much on numbers, and too little on economic reasoning. Increasingly insignificant
The two had hoped things might be getting better in recent years. The reverse seems to be the case. In their latest work, Ms McCloskey and Mr Ziliak looked at all the AER articles in the 1990s, and found that more than four-fifths of them are guilty of
2/10/04 2:52 PMChance News 13.01
Page 19 of 26file://localhost/Users/video/Desktop/Chance%20News/current_news/current.html

Rian Malan questions the mathematical underpinnings of HIV/AIDS computer models and "AIDS lobby" motives. As the title suggests, the topic is controversial, especially in African states.We read the article with an eye towards hearing Mr. Malan's allegations of statistics abuse in global HIV/AIDS policy decisions.
the same sin. Indeed, so pervasive is the cult of statistical significance, say the authors, that ever more economists dispense altogether with the awkward question of whether the patterns they uncover have anything meaningful to say about the real world.
While this article is interesting, even more interesting, is the latest McCloskey and Ziliak (2). The authors write passionately about their feeling that that statistical significance is widely misused especially in economics. There are lots of quotes from our heroes such as:
article
William Kruskal, an eminent statistician long at the University of Chicago, an editor of the International Encyclopedia of the Social Sciences, and a former president of the American Statistical Association, agrees. “What happened?” we asked him in a recent interview at his home (William Kruskal 2002). "Why did significance testing get so badly mixed up, even in the hands of professional statisticians?" "Well," said Kruskal, who long ago had published in the Encyclopedia a devastating survey on “significance” in theory and practice [3], “I guess it's a cheap way to get marketable results.”
Read the and see if it changes your feelings about statistical significance!article
REFERENCES
[1] McCloskey, Deirdre, and Stephen Ziliak. 1996. “The Standard Error of Regressions.”, Mar 1996: pp. 97-114.Journal of Economic Literature
[2] Stephen T. Ziliak and Deirdre N. McCloskey. 2003, "" (forthcoming, Journal of Socio-Economics).
Size Matters: The Standard Error of Regressions in the American Economic Review
[3] Kruskal, William S. 196a. "Tests of Statistical Significance." Pp. 238-250, in David Sills, ed., International Encyclopedia of the Social Sciences 14. New York: MacMillan.
DISCUSSION QUESTION:
At you will find advice on which bets to make on for the NBA basketball games. From their past records you see that if you have followed their advice for the 2002-2003 season you would have won 56% of your bets. Assuming that you are going to bet in the 2003-2004 season, what considerations would you take into account in deciding whether to following their recommendations. In particular, would you require that their previous record be statistically significant? If so, would this be sufficient?
Coverwired.com
Finally, we have another insightful article provided by Myles McLeod.
Africa isn't dying of AIDS., 13 Dec. 2003
Rian MalanThe Spectator
The Spectator magazine is no stranger to dispute. They have this to say about themselves:
2/10/04 2:52 PMChance News 13.01
Page 20 of 26file://localhost/Users/video/Desktop/Chance%20News/current_news/current.html

The Spectator was established in 1828, and is the oldest continuously published magazine in the English language. The Spectator's taste for controversy, however, remains undiminished. There is no party line to which our writers are bound - originality of thought and elegance of expression are the sole editorial constraints.
Rian Malan is no shrinking violet. In 1977, while working as a crime reporter in his native South Africa, he immigrated to America to dodge the South African military draft. Over a decade later, he stopped work on a book tracing his Huguenot ancestry in South Africa to instead publish a book on apartheid [1], and then returned to South Africa as the apartheid system fell. More details about Mr. Malan are available . Not mentioned in the interview is that Malan is the great-nephew of Daniel Malan, described here by Infoplease.com:
here
, 1874-1959 South African political leader. A minister of the Dutch Reformed Church, he left the pulpit after the outbreak of World War I to become editor of an Afrikaner nationalist paper. Rising to prominence in the National party in , he was elected to parliament in 1918. He served (1924ú33) as minister of the interior, public health, and education in the cabinet of J. B. M. . After World War II, Malan's National party and the small Afrikaner party, campaigning on the issue of white supremacy, came (1948) to power with Malan as prime minister. His government initiated the racial separation laws known as . He retired as prime minister in 1954.
Malan, Daniel François ,
Cape Province
Hertzog
apartheid
On to the [2]... The contents are similar to an earlier Malan work [3] in Rolling Stone Magazine shortly after 9/11. Both articles contain much rhetoric and many informal facts, but no formal citations. I will identify Malan's main themes, and then try brief examination of both with the benefit of alternate sources of information.
article published
ANALYSIS
Summary of Malan's Theories.
(1) Computer models may be overstating HIV prevalence.
(2) Diseases such as malaria and TB are ignored in favor of HIV.
Computer models may be overstating HIV prevalence.
is a global joint venture of nine United Nations agencies:UNAIDS
United Nations Children's Fund ( ) UNICEF
World Food Programme ( ) WFP
United Nations Development Programme ( )UNDP
United Nations Population Fund (UNFPA
United Nations Office on Drugs and Crime ) UNODC
International Labor Organization ( ) ILO
United Nations Educational, Scientific and Cultural Organization )UNESCO
World Health Organization ( ) WHO
2/10/04 2:52 PMChance News 13.01
Page 21 of 26file://localhost/Users/video/Desktop/Chance%20News/current_news/current.html

World Bank
UNAIDS charter is to .
help the world prevent new HIV infections; care for those already infected, and mitigate the impact of the epidemic UNAIDS produces annual HIV prevalence statistics for countries throughout the world and distribute epidemiological software and tools to anyone interested through their Web site.
African countries represent a significant challenge for those estimating disease statistics. Researchers determined the most efficient way to collect disease surveillance information was to focus on testing pregnant women at central health care clinics, termed 'sentinel antenatal clinics'. According to the UNAIDS Web site, statistics gathered from the 15-49 year old women frequenting these clinics in a number of countries serves as a good proxy for infection rates in the larger general population of males and females of all ages.
South Africa is one of a few sub-Saharan African countries with the highest HIV infection rates in the world. As expected, this fact sparked intense debate within South Africa - enough debate to spur the government to drop UNAIDS produced HIV prevalence statistics and models in favor of those created by the . The numbers produced by ASSA are lower than those produced by UNAIDS, but their size and increasing trends offer no solace to skeptics. Malan remains unconvinced about the reliability of data produced or the tools used by both UNAIDS and ASSA.
Actuarial Society of South Africa (ASSA)
As Malan ends his article, he reveals his motivation for writing the piece - to question the appropriateness of earmarking government resources to provide HIV antiretroviral drugs. A 2001Johannesburg newspaper article entitled [4] captures the sentiment of this debate within South Africa.
AIDS Arithmetic Won't Help Mbeki
Back to Malan's assertion about model accuracy. The following graphics displays the HIV prevalence rate estimates among pregnant women that visit prenatal clinics.
A recent WHO/UNAIDS document entitled [5]
Reconciling Antenatal Clinic-based Surveillance and Population-based Survey Estimates of HIV Prevalence in Sub-Saharan Africa
2/10/04 2:52 PMChance News 13.01
Page 22 of 26file://localhost/Users/video/Desktop/Chance%20News/current_news/current.html

shows the estimated HIV prevalence figure for all age and sex categories is about 15-16%.
In a national survey of people aged two years and over was conducted in 2002 (Shisana and Simbayi, 2002). The survey included a questionnaire and oral fluid samples were collected using the Orasure HIV-1 oral specimen collection device. Samples were tested in reference laboratories using a single Vironostika test. HIV prevalence among adults 15-49 years was 15.6%.
South Africa,
As mentioned previously, HIV prevalence rates for women visiting antenatal clinics serve as input for South Africa's ASSA2000 epidemic model. Here is a graph of those observed rates versus the ASSA2000 model's fit against those data (see [6] ). The model's forecast graph fairly closely captures the observed trend in antenatal prevalence rates.
Aids Update 2002
At this point, one might wonder how well the ASSA2000 model is able to extrapolate this antenatal prevalence rate data into prevalence projections for the larger South African population and how closely the model's projections compare to data from the national 2002 oral sampling.
We downloaded the ASSA2000 model and its instructions document from . The instructions document explains assumptions, a high-level model flowchart, algorithms, and step-by-step instructions to produce tables and graphs. Scenarios modeled can be of either "No Change" or "Change" types. The former models an epidemic where the disease runs its course with no intervention, that is no antiretroviral drugs given or behavior changes encouraged. The latter displays projections when corrective actions are applied. We ran a "No Change" scenario that resulted in an Excel spreadsheet with data for the period 1985-2015, a portion of which is reproduced below.
ASSA's Web site
NO CHANGE SCENARIO 2000 2001 2002 2003
Numbers (total and infected)
Total population 45,078,805
45,768,984
46,361,337 46,848,269
Total HIV infections 5,263,841 5,968,521 6,558,628 7,027,931
Total births 1,142,387 1,139,039 1,131,308 1,120,501
Births infected perinatally 58,048 63,880 67,984 70,644
Babies newly infected by mother's milk 16,259 18,289 19,780 20,794
AIDS sick
2/10/04 2:52 PMChance News 13.01
Page 23 of 26file://localhost/Users/video/Desktop/Chance%20News/current_news/current.html

Total AIDS sick (in the middle of year) 236,228 334,253 453,352 591,088
Deaths:
Non-AIDS deaths 387,667 392,447 396,537 399,954
AIDS deaths 139,009 194,892 262,209 339,500
Accumulated Aids Deaths (to middle of the
year) 298,645 462,642 688,428 987,061
Prevalence rates
Antenatal clinics 25.2% 27.3% 28.9% 30.1%
Women aged 15 - 49 21.5% 23.9% 25.8% 27.4%
Adult women (ages 20 - 65) 19.6% 21.8% 23.5% 24.9%
Adult men (ages 20 - 65) 20.5% 22.8% 24.7% 26.0%
Adults (ages 20 - 65) 20.1%
22.3%
24.1% 25.4%
Total population 11.7% 13.0% 14.1% 15.0%
Incidence rates
Total new infections 892,241 851,175 810,891 774,173
Mortality statistics
Life expectancy at birth 56 55 52 50
Maternal orphan statistics
Total orphans (in middle of year) 493,846 555,684 636,876 739,576
Total AIDS orphans (in middle of year) 124,989 190,993 279,102 391,137
The model produced a projected overall population prevalence rate of 14.1% for 2002. The model's answer here is lower and so more conservative than the 15 to 16% estimate got from the 2002 door-to-door oral sampling.
This experiment did not produce figures to support Rian Malan's assertion the ASSA2000 model used in South Africa overstates HIV prevalence rates. In fact, the modeled outputs seem to match empirical data closely.
Diseases such as malaria and TB are being ignored in favor of HIV.
Malan's argument here is that he sees the problem of 350 million malaria infections and about 1 million malaria deaths as a problem more worthy of global aid than HIV. He further contends that spending on HIV outstrips that on malaria by 90: 1. Getting an answer here requires looking at the and
Web sites. A quick check of recent UNAIDS press releases shows this 21 January, 2004:UNAIDS The
Global Fund
.
21 January 2004 | GENEVA -- The World Health Organization (WHO) announced today a plan to expand collaboration between national tuberculosis and HIV/AIDS programmes to curb the growing pandemic of TB/HIV co-infection, with a principal focus on Africa where 70% of the world's 14 million people who are co-infected live.
WHO pushing to rapidly scale-up measures to fight TB and HIV.
Collaborative approach to speed distribution of AIDS treatment and reduce spread of tuberculosis in high HIV prevalence areas
You can find the full press release .here
2/10/04 2:52 PMChance News 13.01
Page 24 of 26file://localhost/Users/video/Desktop/Chance%20News/current_news/current.html

TB is on UNAIDS' radar screen. An earlier June 2003 press release reveals the establishment of an organization called The Global Fund:
The United Nations and the Global Fund to Fight AIDS, TB and Malaria
The Global Fund is a public-private partnership established to attract, manage and disburse new resources to fight AIDS, TB and malaria and the negative social and economic impacts they cause among communities with the greatest need. It supports interventions for the prevention, treatment, care and support of people with these three diseases.
The Global Fund evaluates grant submissions and disburses funds for health projects related to HIV/AIDS, HIV/TB, and malaria epidemics. Their Web site maintains a programs database where one can query projects by country, disease or region. A query of all South Africa projects reveals 2-year approved maximum funding of $65,030,985.00 for HIV/AIDS and HIV/TB projects. Absence of South African malaria projects probably means no malaria project proposals have been submitted. Whatever the reason in South Africa's case, another query for all countries' malaria projects shows $475,547,837.87 2-year approved maximum funding.
The following graph of South African malaria cases by month for the period 1999-2003 reveals that South Africa has no need for outside funds to control malaria. The points out South Africa's success controlling malaria is in large part because of the use of DDT.
fightingmalaria.org Web site
Annual malaria notifications
The annual reported malaria cases for South Africa for the past 5 years, 1999-2003, are presented below. In 2000, South Africa experienced a malaria epidemic with 64 622 malaria cases having been reported. Following the epidemic from 2001, the number of reported malaria cases has steadily decreased. The 2003 total malaria notified cases for both March and April demonstrate a decrease of 65% and 73% respectively when compared to March and April 2002.
Source: http://www.fightingmalaria.org
Running further queries against all countries' project by project type shows these funding distributions:
Disease 2-Yr Funding % 5-Yr Funding %
HIV/AIDS 1,174,749,934 57% 3,219,177,173 63%HIV/TB 89,795,118 4% 318,555,752 6%
Integrated 23,595,621 1% 44,245,508 1%
2/10/04 2:52 PMChance News 13.01
Page 25 of 26file://localhost/Users/video/Desktop/Chance%20News/current_news/current.html
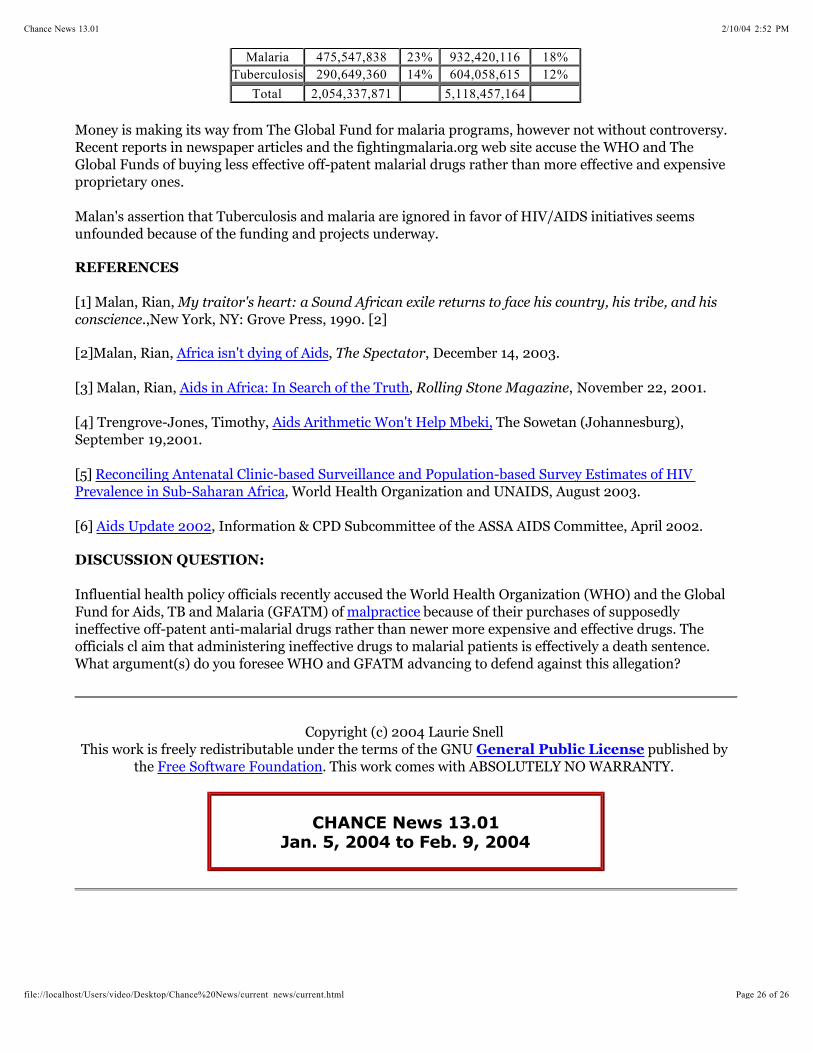
Malaria 475,547,838 23% 932,420,116 18%Tuberculosis 290,649,360 14% 604,058,615 12%
Total 2,054,337,871 5,118,457,164
Money is making its way from The Global Fund for malaria programs, however not without controversy. Recent reports in newspaper articles and the fightingmalaria.org web site accuse the WHO and The Global Funds of buying less effective off-patent malarial drugs rather than more effective and expensive proprietary ones.
Malan's assertion that Tuberculosis and malaria are ignored in favor of HIV/AIDS initiatives seems unfounded because of the funding and projects underway.
REFERENCES
[1] Malan, Rian, .,New York, NY: Grove Press, 1990. [2]
[2]Malan, Rian, , , December 14, 2003.
My traitor's heart: a Sound African exile returns to face his country, his tribe, and his conscience
Africa isn't dying of Aids The Spectator
[3] Malan, Rian, , , November 22, 2001.Aids in Africa: In Search of the Truth Rolling Stone Magazine
[4] Trengrove-Jones, Timothy, The Sowetan (Johannesburg), September 19,2001.
Aids Arithmetic Won't Help Mbeki,
[5]World Health Organization and UNAIDS, August 2003.
Reconciling Antenatal Clinic-based Surveillance and Population-based Survey Estimates of HIV Prevalence in Sub-Saharan Africa,
[6] , Information & CPD Subcommittee of the ASSA AIDS Committee, April 2002.Aids Update 2002
DISCUSSION QUESTION:
Influential health policy officials recently accused the World Health Organization (WHO) and the Global Fund for Aids, TB and Malaria (GFATM) of because of their purchases of supposedly ineffective off-patent anti-malarial drugs rather than newer more expensive and effective drugs. The officials cl aim that administering ineffective drugs to malarial patients is effectively a death sentence. What argument(s) do you foresee WHO and GFATM advancing to defend against this allegation?
malpractice
Copyright (c) 2004 Laurie Snell This work is freely redistributable under the terms of the GNU published by
the . This work comes with ABSOLUTELY NO WARRANTY. General Public License
Free Software Foundation
CHANCE News 13.01Jan. 5, 2004 to Feb. 9, 2004
2/10/04 2:52 PMChance News 13.01
Page 26 of 26file://localhost/Users/video/Desktop/Chance%20News/current_news/current.html


![1. DAC Form Manual · DAC Form Manual [ Version française de cette page ] DAC Form Manual ... Update with the releases DAC 12.01, 12.02, 13.01, DEC 13.01 and CTR 13.02. New chapter](https://static.fdocuments.us/doc/165x107/5b92619f09d3f277288dec56/1-dac-form-manual-dac-form-manual-version-francaise-de-cette-page-dac.jpg)