HONG KONG 2011 Music : Reminisce Hong Kong means Fragrant Harbor in Cantonese Hong Kong.
Research Brief Issue No. 4 2015 – 2016
Research Office Legislative Council Secretariat
1. Introduction 1.1 Employment income is the lifeblood of almost all families in Hong Kong, accounting for 86% of overall household income.1 A steady job market is thus of utmost importance for both livelihood of people and stability of the society. Yet overall unemployment rate rose to a two-year high of 3.4% in early 2016, reversing the relative stability in the labour market for six years since 2009 and reigniting concerns over renewed manpower retrenchment in the near future. This apart, there are also concerns over increasing number of workers taking up flexible jobs upon work fragmentation and those with higher education taking up lower-skill occupations. This Research Brief reviews some of the emerging manpower developments in Hong Kong.
1 According to the results of the 2011 Population Census, employment income took up 85.7% of the household
income in Hong Kong. Non-employment income (including rental income, dividend and interest, pensions, social security allowance and regular contributions from other family members) took up the rest of 14.3%.
Challenges of manpower adjustment in Hong Kong June 2016 Employment outlook in Hong Kong is likely to stay cautious in the near future, dampened by the business setback in retail trade, restaurants and hotels and construction. Lower-skilled occupations are expected to face greater retrenchment pressure. In parallel with the work fragmentation trend, the total number of casual employees, part-time employees and self-employed persons in Hong Kong rose by 40% over 1999 to about 524 000 in 2015. Flexible workforce is generally subject to greater job insecurity, less statutory employment benefits and lower employment income, compared with permanent employees. About three-tenths of local workforce has attained degree education, but an enlarged proportion of them ended up in lower-skilled occupations due to slow progress in creation of high-end jobs amidst the structural change in the economy. Even for the top 10% of youngsters who managed to get high-end jobs, their earnings are lower than their predecessors, along with slackening social mobility across generations. Entrepreneurship is a key driver for economic growth and job creation, but the proportion of employers in local workforce has almost halved over the past two decades to just 3% in 2015. The proportion of youngsters aged 34 and below among local employers has also shrunk from 25% to only 9% during 1991-2015. Recently, the Government announced a number of measures providing financial assistance to technology start-ups. Overseas entrepreneurship studies nevertheless focus more on creating a facilitative regulatory environment and level playing field for sustainable start-ups in all economic sectors. The subject of manpower and labour market falls within the policy area of the Panel on Manpower.

2
Q3 Q3 Q4 Feb-Apr 2008 2009 2015 2016
Q3 Q3 Q4 Feb-Apr 2008 2009 2015 2016
2. Employment outlook in the short term
2.1 In February – April 2016, the seasonally adjusted unemployment rate in Hong Kong edged up by 0.1 of a percentage point over the fourth quarter of 2015 to 3.4%. 2 Yet some sectors witnessed much steeper rise in the unadjusted unemployment rate3 by up to 2 percentage points, including hotels and restaurants (4.8%), construction (5.4%) and retail trade (5.6%). Although these three sectors took up just about 25% of local workforce, they accounted for almost all the rise in the unemployed population in the most recent periods. Indeed, manpower requirement in these three sectors is usually more sensitive to cyclical changes in the economy and manifests greater volatility than other sectors, and hence, may have certain lead indication for the overall employment situation (Figure 1).4 Figure 1 – Unemployment rate* of cyclically sensitive sectors, 2008-2016
Note: (*) Figures in this table are not seasonally adjusted. Data source: Census and Statistics Department. 2 On an unadjusted basis, overall unemployment rate rose by 0.3 of a percentage point to 3.4%. See Census and
Statistics Department (2016c). 3 Census and Statistics Department does not release seasonally adjusted unemployment rate for individual sectors,
but it is noted that the rise in the unadjusted unemployment in the three sensitive sectors up to April 2016 was generally greater than those caused by seasonal factors.
4 Taking the earlier adjustment in the local labour market during 2008-2009 as an illustration, construction, retail and import/export trades, restaurants and hotels altogether accounted for more than half of the overall rise in unemployed population.
5.4 6.1 6.5 6.74.6
5.6
6.2 7.3 8.3 8.4
4.4 4.8
Construction
Retail trade
Hotels and restaurants
6.1
12.09.4
3.4 5.4
11.3
Overall*
Construction
Unemployment rate (%)
Overall*
Retail trade
Unemployment rate (%)
Overall*
Hotels and restaurants
Unemployment rate (%)
5.5
4.6
5.6
3.95.5
3.1 3.45.13.75.7
Q3 Q3 Q4 Feb-Apr 2008 2009 2015 2016

3
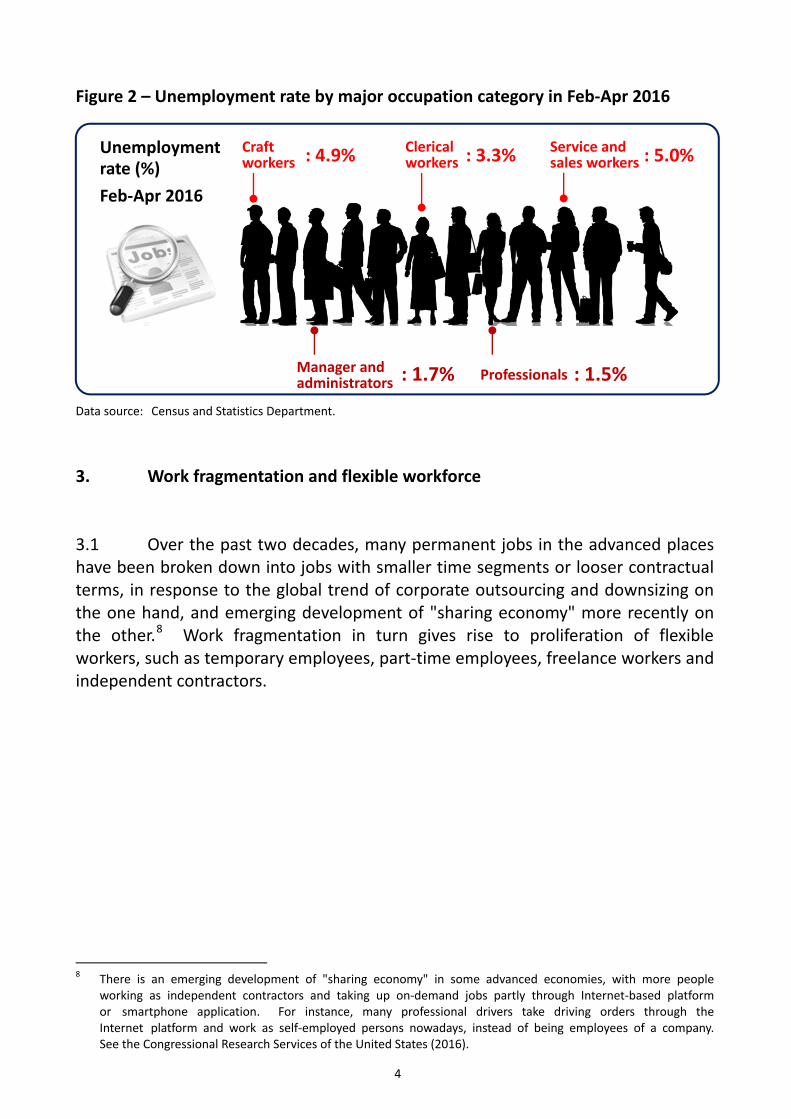
2.2 Looking ahead, unemployment in Hong Kong is likely to face more upward pressure in the near term, in view of worsening business performance in the three sensitive sectors more recently. For the distributive and catering trade, its labour demand is deemed to be hit by the sharp declines of 11% in the volume of retail sales and 9% in the number of overall visitor arrivals in the first four months of 2016 over a year earlier. For construction, while labour demand in the segment of building and civil engineering may still be supported by growing intensity of existing projects which have already commenced work, the segment of decoration and maintenance may face more manpower adjustment upon the 50% slump in the volume of property trading in the first four months of 2016.5 As corporate hiring or retrenchment decisions usually lag behind business performance by at least one quarter, these sensitive sectors are expected to see more difficult times ahead. 2.3 In the earlier round of manpower adjustment precipitated by the global financial tsunami in 2008-2009, unemployment rate in the three cyclically sensitive sectors had risen continuously for four to five quarters. As such, the employment outlook for 2016 is likely to stay cautious, as echoed by a few business prospect surveys just released in April/May 2016.6 2.4 Generally speaking, lower-skilled workers are likely to face greater pressure on corporate retrenchment than higher-skilled workers, as shown in the corporate downsizing in 2008-2009.7 Indeed, this differential in occupational adjustment is already seen in February – April 2016, with unemployment rate of clerical workers, service and shop sale workers and craft workers rising more visibly over end-2015 to 3.3%, 4.9% and 5.0% respectively, while that for managers and professionals edged up to only 1.5%-1.7% (Figure 2).
5 Overall construction output increased by 5% in real terms in 2015, despite concerns over the implications of a fall
in the number of public sector contracts awarded under the Capital Works Reserve Fund in recent years, from HK$51 billion in 2013-2014 to HK$18 billion in 2014-2015.
6 In April and May 2016, there were at least three business prospects surveys showing cautious employment outlook in the near future. They included the Business Tendency Survey compiled by the Census and Statistics Department, Hong Kong SME Leading Business Index compiled by the Hong Kong Productivity Council and Hong Kong Purchasing Manager Index compiled by the Markit.
7 Between the third quarter of 2008 and the third quarter of 2009, the unemployment rate of the managers and professionals increased by a total of 0.9-1.7 percentage points only, while the unemployment rate in the lower end of the occupational hierarchy such as clerical workers, service workers and craft workers increased more visibly, by 2.0-3.7 percentage points.
4
Figure 2 – Unemployment rate by major occupation category in Feb-Apr 2016 Data source: Census and Statistics Department. 3. Work fragmentation and flexible workforce 3.1 Over the past two decades, many permanent jobs in the advanced places have been broken down into jobs with smaller time segments or looser contractual terms, in response to the global trend of corporate outsourcing and downsizing on the one hand, and emerging development of "sharing economy" more recently on the other.8 Work fragmentation in turn gives rise to proliferation of flexible workers, such as temporary employees, part-time employees, freelance workers and independent contractors.
8 There is an emerging development of "sharing economy" in some advanced economies, with more people
working as independent contractors and taking up on-demand jobs partly through Internet-based platform or smartphone application. For instance, many professional drivers take driving orders through the Internet platform and work as self-employed persons nowadays, instead of being employees of a company. See the Congressional Research Services of the United States (2016).
Craft workers : 4.9%Unemployment
rate (%) Feb-Apr 2016
Clerical workers : 3.3% Service and
sales workers : 5.0%
Manager and administrators : 1.7% Professionals : 1.5%

5
3.2 Hong Kong is not immune from this global trend. Based on scattered household and establishment surveys conducted by the Census and Statistics Department ("C&SD"), it is crudely estimated that there was a total of 524 000 flexible workers in Hong Kong in 2015, comprising 96 000 casual employees, 214 000 part-time employees, and 214 000 self-employed persons.9 This represents a noticeable increase of 40% over the respective size of flexible workforce in 1999, with a particularly significant increase of 84% in part-time employment. The ratio of flexible workers in the overall workforce has also gone up gradually over the past 16 years, from 12% to 14% (Figure 3). Figure 3 – Estimated size of flexible workforce* in Hong Kong, 1999-2015 Notes: (*) Comprising casual employees, part-time employees and self-employed persons. (#) Proportion in total employment of Hong Kong. Data source: Census and Statistics Department.
9 C&SD does not compile dedicated statistics on fragmented or flexible workforce, but its order of magnitude can
be guesstimated from scattered existing surveys. More specifically, casual employees refer to those employees employed on a day-to-day basis or for a fixed period less than 60 days, while part-time employees usually work less than five days per week or less than six hours per day or less than 30 hours per week. As to self-employed persons, they are mainly independent workers and freelancers. Statistics on these three categories of workers can be obtained from the quarterly household surveys, special topic enquiries of household surveys and annual surveys on business establishments. See Census and Statistics Department (2010, 2012b, 2015 and 2016a).
375 000 persons (12.1%)
440 000 persons (13.7%)
465 000 persons (13.4%)
536 000 persons (14.4%)
524 000 persons (13.9%)
Total no. of flexible workers(Ratio in workforce)#
Casual employees
Part-time employees
Self-employed persons
1999 2003 2009
20132015
6
3.3 Key socioeconomic attributes of local flexible workforce can be briefly summarized below:
(a) Occupation distribution: Casual and part-time employment is more commonly seen in construction, retail trade and restaurants due to operational needs of these sectors in Hong Kong. As to self-employment, they straddle far more occupations across economic sectors like drivers, salespersons, tutors or financial products agents;
(b) Education attainment: By and large, about 20% of casual
employees, 21% of part-time employees and 28% of self-employed persons had received tertiary education, showing that job fragmentation is not confined to lower-skilled workers; and
(c) Reasons for taking up flexible jobs: As a whole, broadly half of the
part-time and self-employed employment was the career choice of the workers concerned for such reasons as engagement in housework or better work/life balance.10 By contrast, casual employment was taken up more reluctantly by the workers concerned, with almost 70% citing normal practice of the trade and slack work in the companies as reasons for taking up the jobs.
3.4 By and large, local flexible workforce taking up fragmented jobs need to face greater risks of losing the jobs at times of business downturn, compared with permanent employees. In addition, self-employed persons and those casual and part-time employees with weekly working hours less than 18 hours for four weeks continuously are not entitled to certain statutory benefits stipulated under the Employment Ordinance, including rest days, paid annual leave, sickness allowance, severance payment and long service payment. Furthermore, most of this flexible workforce cannot capture employers' contribution under the Mandatory Provident Fund Schemes ("MPF") Ordinance, resulting in less accumulated assets at the time of retirement.11 10 According to the earlier surveys conducted by C&SD during 2009-2011, 37% of the part-timers cited housework as
their major reason for taking up part-time jobs, followed by education pursuit (11%). Some part-time jobs were taken up rather reluctantly, such as slack work in the companies (15%), cannot find jobs with longer hours (9%) and customs of the trade (9%). For self-employment, it was taken because of starting own business (19%) and better control of working hours (18%). As regards casual employment, it was mainly due to customs of the trade (45%), slack work in the company (24%) and housework (10%). See Census and Statistics Department (2010 and 2012b).
11 Under the MPF Ordinance, while casual employees in construction and catering industries can join the "Industry Schemes" where employers' contribution is calculated on a daily basis even though the duration of employment is less than two months. However, for causal employees in other sectors and part-time employees with employment duration less than two months, their employers are not required to make MPF contribution. For self-employed persons, they need to make contribution to 5% of the relevant income, without employers' contribution.

7
3.5 Apart from job insecurity, flexible workforce also witnessed lower pay than permanent employees. As an illustration, the median monthly employment income of part-time employees, casual employees and self-employed persons were in the region of HK$4,500-12,300 in 2015, noticeably lower than the respective monthly wage of HK$15,700 for permanent employees. That said, wages of casual employees had already registered a significant cumulative increase of 72% during 2011-201512, conceivably benefited from implementation of statutory minimum wages13 on the one hand, and the steep increase in construction wages in recent years on the other (Figure 4). Figure 4 – Median monthly employment income* of workers, 2011-2015
Note: (*) Median monthly employment income of employees is measured in terms of median monthly wages based on annual establishment survey, while that for self-employed persons is in terms of median monthly employment earnings based on household survey.
Data source: Census and Statistics Department.
12 Cumulative wage increase for part-time employees, permanent employees and self-employed persons was
around 19-22% during 2011-2015. 13 Statutory minimum wage came into effect in May 2011, with the statutory hourly rate initially set at HK$28, and
has been progressively lifted to HK$30 in May 2013 and HK$32.5 in May 2015. For the impacts of minimum wage on the employment income of elementary workers, see Legislative Council Secretariat (2015a).
Casual employees
Part-time employees
Self-employedpersons
Permanentemployees
HK$3,700
HK$4,500
+22%
HK$11,000 HK$12,300
HK$15,700
HK$6,400
HK$10,300
HK$13,000+72%
+19%
+21%
2015 pay
2011 pay

8
4. Job mismatch for workforce with higher educational attainment 4.1 In parallel with continued expansion of tertiary education in Hong Kong, there is an annual additional inflow of some 40 000 workers with degree education into the job market over the past two decades.14 The proportion of degree holders in overall workforce has thus more than tripled from 9% to 29% during 1994-2015. While this education upgrading is beneficial for Hong Kong in overall terms, creation of high-end jobs seems to be unable to keep pace with this development in manpower supply, along with decelerated economic growth and lacklustre progress towards knowledge-based economy (Figure 5).15 Figure 5 – Total number of additional workers with degrees* during 1994-2015 Note: (*) Excluding sub-degree and non-degree qualifications in post-secondary education. Data source: Census and Statistics Department. 4.2 This is corroborated by a detailed analysis of the occupations taken up by additional workforce with degree education over the past 21 years, with key findings shown below:
14 Degree education excludes sub-degree and non-degree qualifications in post-secondary education. They cover
fresh graduates completing both local and overseas studies and existing workers completing on-the-job study. 15 Average annual economic growth in real terms in Hong Kong has been reduced by half over the past three
decades, from 6.7% during 1980-1990 to 4.0% during 1990-2010, and further to only 2.9% during 2010-2015. Concurrently, there is a general feeling that the overall economy was too dependent on a few traditional sectors, with limited development of new economic engines. See Legislative Council Secretariat (2015b and 2015c).
854 000 persons
Managers and administrators
666 000 jobs
Professionals
Associate professionals +
Additional workers with degrees: Higher-skilled jobs:

9
(a) Managerial and professional occupations absorbing just two-fifths of additional degree-holders: During 2008-2015, managerial, administrative and professional occupations could absorb only 38% of additional workers with degree education, noticeably down from 47% during 1994-2001 (Figure 6);
(b) Slowing absorption by associate professionals: In the past, those
degree holders who could not work as managers or professionals might work as associate professionals instead. However, even this pathway is getting crowded recently. During 2008-2015, 33% of the additional workforce with degree education took up the position of associate professionals, down from 38% during 2001-2008; and
(c) Shifting towards jobs at lower end of hierarchy: As a result of
gradual saturation of higher-end jobs, more degree holders end up at lower-end jobs requiring less professional knowledge. During 2008-2015, as much as 26% of the additional workforce with degree education worked as clerks, service workers or shop sale workers, more than twice the respective figure of 12% during 1994-2001.
Figure 6 – Occupation distribution of additional workers with degrees, 1994-2015
Data source: Census and Statistics Department.
Professionals, managers and administrators
47% 43% 38%
Associate professionals
Clerical workers, service and shop sales workers
36% 38% 33%
12% 17% 26%
1994-2001 2001-2008 2008-2015 Occupation

10
4.3 For those highly educated workers taking up lower-end jobs, they inevitably see a large wage discount. For instance, if degree holders managed to fetch managerial and professional occupations, their median monthly employment earnings would be HK$38,000 in 2015. The monthly income would be reduced almost by half to HK$20,000 if they worked as associate professionals. In case these degree holders ended up at clerical or shop sale occupations, their median monthly earnings would be reduced further to just around HK$11,000-13,000. The wide pay differential may in turn cause career disappointment amongst some degree holders in the younger generation (Figure 7). Figure 7 – Median monthly employment earnings by occupation, 2015 Data source: Census and Statistics Department. 5. Slower social mobility across generations 5.1 Most of the additional inflow of workers with degree education is absorbed into employment, with the unemployment rate of degree holders staying at a low level of 2.9% in 2015. Over time, these higher-skilled workers can see significant income growth through accumulation of work experience. According to an earnings mobility study just released by the Government in May 2016, the average monthly income of first-degree holders graduated in 2002 could triple in real terms after working for around a decade in 2014. For the median graduate of
HK$14,500
Overall workforce Professionals Managers and Associate Clerical workers, administrators professionals service and shop sales workers
HK$38,000 HK$38,000
HK$20,000 HK$11,000-HK$13,000

11
this 2002 cohort, his or her monthly employment income "could reach the top 20% of income distribution" in Hong Kong in 2014, with the threshold estimated to be around HK$27,000.16 5.2 It is well-expected that highly educated workers can climb up the income ladder rapidly during the early stage of their careers, especially so when compared with less educated workers. Yet there is another concern whether income mobility of the younger generation has slackened compared with the earlier generations in the context of slower economic growth and more crowded pathways at the higher end of the occupation hierarchy in Hong Kong nowadays. According to another study covering a much longer duration, the first generation of university graduates born in the mid-1960s could attain median monthly employment earnings of HK$33,500 at constant (2013) market prices at the age of 35-39, after 10-15 years of work. 17 However, the respective median university graduate of the third generation born in the mid-1970s could make only HK$26,100 at the age of 35-39. For the fifth generation of the university graduates born in the mid-1980s, they were aged below 30 in the benchmark year 2013, but their salary level in the early stage of their career was the lowest compared with their predecessors (Figure 8). Figure 8 – Monthly earnings of the median university graduate across generations
Note: (*) In constant (2013) market prices. Data source: 新論壇 .
16 The study did not specify the level of the monthly income of the median graduate of the 2001/02 cohort.
According to C&SD, monthly employment earnings of the 80 percentile of the entire workforce in Hong Kong were about HK$27,000 in 2014. See Economic Analysis and Business Facilitation Unit (2016b).
17 新論壇:《香港各世代大學生收入比較研究報告》。
0
25,000
50,000
75,000
100,000
Earnings at aged 25-29
Earnings* at aged 35-39
1st generation (born in
mid-1960s)
HK$33,445
HK$18,684
HK$30,675
HK$19,157
HK$26,064
HK$16,722 HK$15,337 HK$14,770
2nd generation (born in
early-1970s)
3rd generation (born in
mid-1970s)
4th generation (born in
early-1980s)
5th generation (born in
mid-1980s)
HK$
12
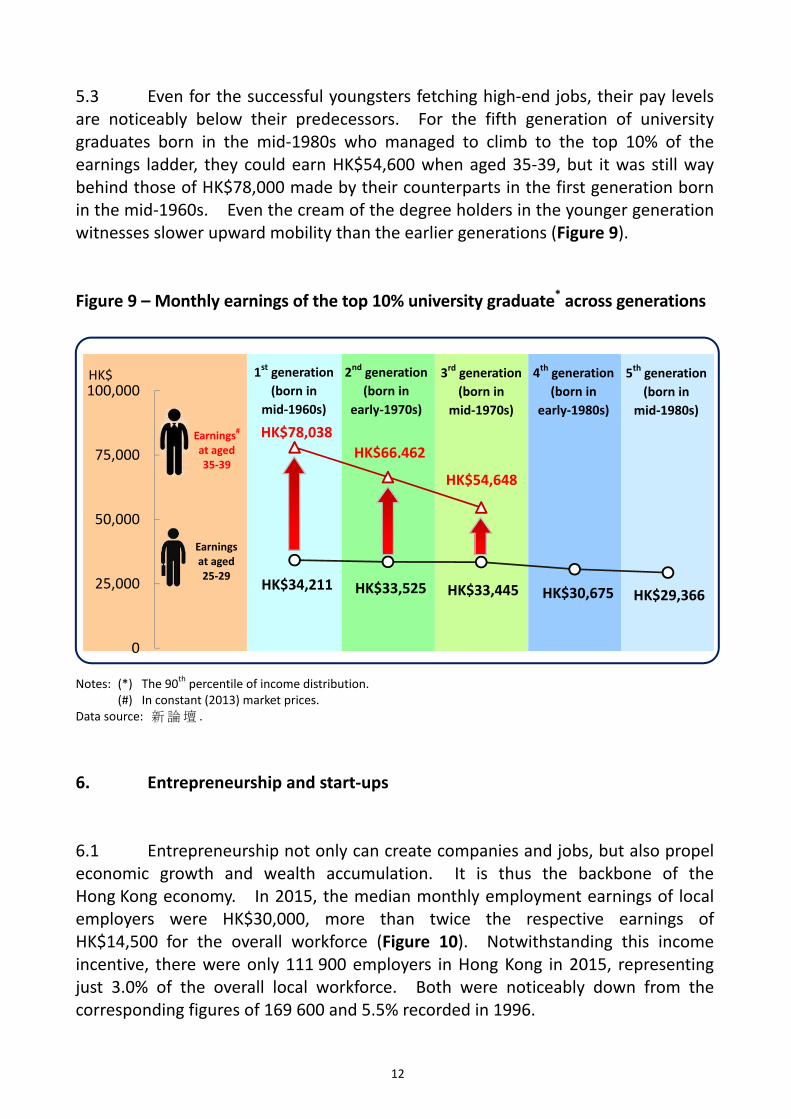
5.3 Even for the successful youngsters fetching high-end jobs, their pay levels are noticeably below their predecessors. For the fifth generation of university graduates born in the mid-1980s who managed to climb to the top 10% of the earnings ladder, they could earn HK$54,600 when aged 35-39, but it was still way behind those of HK$78,000 made by their counterparts in the first generation born in the mid-1960s. Even the cream of the degree holders in the younger generation witnesses slower upward mobility than the earlier generations (Figure 9). Figure 9 – Monthly earnings of the top 10% university graduate* across generations Notes: (*) The 90th percentile of income distribution. (#) In constant (2013) market prices. Data source: 新論壇 .
6. Entrepreneurship and start-ups 6.1 Entrepreneurship not only can create companies and jobs, but also propel economic growth and wealth accumulation. It is thus the backbone of the Hong Kong economy. In 2015, the median monthly employment earnings of local employers were HK$30,000, more than twice the respective earnings of HK$14,500 for the overall workforce (Figure 10). Notwithstanding this income incentive, there were only 111 900 employers in Hong Kong in 2015, representing just 3.0% of the overall local workforce. Both were noticeably down from the corresponding figures of 169 600 and 5.5% recorded in 1996.
0
25,000
50,000
75,000
100,000
Earnings at aged 25-29
Earnings# at aged 35-39
1st generation (born in
mid-1960s)
HK$78,038
HK$34,211
HK$66,462
HK$33,525
HK$54,648
HK$33,445 HK$30,675 HK$29,366
2nd generation (born in
early-1970s)
3rd generation (born in
mid-1970s)
4th generation (born in
early-1980s)
5th generation (born in
mid-1980s)
HK$

13
Figure 10 – Median monthly employment earnings in 2015 Data source: Census and Statistics Department. 6.2 To a certain extent, waning local entrepreneurship can be attributed to the following factors:
(a) Diminishing opportunities in manufacturing and trading sectors: It was quite common for local employees to establish small factories for sub-contracting part of production or to set up small trading firms for conducting import/export trade with the Mainland companies in the 1980s and 1990s. Yet these opportunities have subsided somewhat over the past two decades, upon progressive relocation of manufacturing processes across the boundary and increased sophistication of the Mainland companies in handling foreign trade themselves;
(b) Reduced appetite for risk-taking: By and large, creativity and risk
taking are two essential ingredients for successful entrepreneurship, which are more easily found amongst youths.18 Yet the propensity of local youngsters to take risks in setting up their own business has weakened considerably over the past decades. Coupled with smaller numbers of younger persons amidst the ageing trend, the proportion of youngsters aged 34 and below amongst local employers has shrunk from 25% to only 9% during 1991-2015, which is not conducive to entrepreneurship in Hong Kong (Figure 11);
18 See Wong (2016).
Employers: Overall workforce: HK$30,000 HK$14,500

14
Figure 11 – Ratio of youngsters aged 34 and below amongst employers, 1991-2015 Data source: Census and Statistics Department.
(c) High property rentals: During 2005-2015, average rentals for office space, flatted factory space and retail premises have increased by a total of 135%, 111% and 82% respectively, two to three times the respective rise of 37% in overall consumer prices. This escalation of property rentals has considerably lifted the cost of setting up business firms in Hong Kong, discouraging many prospective entrepreneurs who have very limited capital at the start; and
(d) Funding constraints: Although Hong Kong is a global financial
centre, it is very difficult for start-ups without business track records to obtain funding support. According to a local survey, 88% of local entrepreneurs have to resort to self-funding as the seed capital, with little assistance from venture capitalists (8%) and banks (6%). About two-thirds of the respondents also feel that financial accessibility is the biggest hurdle in local entrepreneurship.19
6.3 Most recently, some positive signs of a resurrection in entrepreneurship appear to have emerged. Technology start-ups in Hong Kong surged by 50% to 1 600 in 2015, about half of them were made by local residents. Moreover, the Government has announced a few new initiatives to promote entrepreneurship in the 2016-2017 Budget. They include (a) setting up a HK$2 billion Innovation and Technology Venture Fund to foster local technology start-ups; (b) expanding the Science Park to create new space for start-ups and technology companies at a cost of HK$4.4 billion; and (c) earmarking HK$200 million for investment in start-ups by Cyberport. If effectively nurtured, resurrection of entrepreneurship may potentially become a new growth spot of the local economy and job creation in the medium to longer term. 19 See Chinese University Hong Kong (2014).
Young employers : 25% Young
employers : 9%
1991 2015

15
6.4 Globally, promotion of youth entrepreneurship has also ranked high in the policy agenda of many places, partly to solve the youth unemployment problem.20 According to overseas studies, effective entrepreneurship policy hinges on not just financial assistance, but creation of a supportive "entrepreneurial ecosystem" in the wider society.21 In the process, the governments concerned need to (a) create a more facilitative regulatory environment; (b) enhance entrepreneurship education through mentoring and networking of young business owners; (c) ensure adequate supply of talents; and (d) create a level playing field to embrace sustainable start-ups in all economic sectors, rather than a specific segment of economic activity. 7. Observations 7.1 The following observations can be made from the above analysis:
(a) Cautious employment outlook in the near future: The outlook of the local labour market is likely to stay cautious in the short term, in view of the business setback in retail trade, restaurants and hotels and construction. Lower-skilled occupations are expected to see more pressure of manpower adjustment than those at the upper end of the hierarchy;
(b) Increased size of flexible workforce: In line with the trend of work
fragmentation, the total number of casual employees, part-time employees and self-employed persons in Hong Kong went up by 40% to 524 000 during 1999-2015. Their proportion in total workforce has thus risen from 12% to 14%. Broadly speaking, flexible workforce is subject to more job insecurity, less statutory employment benefit and lower income than permanent employees;
(c) Job mismatch for workers with degree education: The proportion
of local workforce with degree education has more than tripled from 9% to 29% during 1994-2015, but less than half of them could take up managerial and professional jobs at the top in recent years. As creation of high-end jobs cannot keep pace with manpower supply amidst slow progress in structural change in the local economy
20 See the United Nations Conference on Trade and Development (2015). 21 "Entrepreneurial ecosystem" was coined by Professor Daniel Isenberg to highlight the supportive role played by
(a) conducive culture; (b) enabling policies and leadership; (c) financial support; (d) quality human capital; (e) venture-friendly markets for products; and (f) a range of institutional supports. See World Economic Forum (2014) and Kauffman (2015).
16
towards knowledge-based activities, more workers with degree education need to take up lower-skilled occupations in recent years;
(d) Slowing social mobility compared with earlier generations: Slower
economic growth has implications for both the career paths and social mobility for the youngsters nowadays. Even for the top 10% of degree holders of the younger generation who managed to get high-pay jobs at present, their monthly income is still far behind their counterparts in earlier generations; and
(e) Focus of entrepreneurship policy: Entrepreneurship is the backbone
of economic growth and job creation, but the proportion of employers in local workforce has almost halved over the past two decades to just 3% in 2015. In particular, the proportion of younger persons aged 34 and below amongst the local employers has shrunk from 25% to 9% during 1991-2015. While the Government has announced a few measures targeting for financial assistance of technology start-ups, overseas entrepreneurship studies suggest that focus should be placed on creating a facilitative regulatory environment and level playing field for nurturing sustainable start-ups in all sectors, rather than a specific segment of economic activity.
Research Office Information Services Division Legislative Council Secretariat 7 June 2016 Tel: 2871 2134 ------------------------------------------------------------------------------------------------------------------------------------------------------------------------------ Research Briefs are compiled for Members and Committees of the Legislative Council. They are not legal or other professional advice and shall not be relied on as such. Research Briefs are subject to copyright owned by The Legislative Council Commission (The Commission). The Commission permits accurate reproduction of Research Briefs for non-commercial use in a manner not adversely affecting the Legislative Council, provided that acknowledgement is made stating the Research Office of the Legislative Council Secretariat as the source and one copy of the reproduction is sent to the Legislative Council Library. The paper number of this issue of Research Brief is RB04/15-16.

17
References 1. Census and Statistics Department. (2010) Special Topics
Report #52 on Casual employment and part-time employment. Available from: http://www.statistics.gov.hk/pub/B11301522010XXXXB0100.pdf [Accessed June 2016].
2. Census and Statistics Department. (2012a) 2011 Population Census: Thematic
Report on Household Income Distribution in Hong Kong. Available from: http://www.statistics.gov.hk/pub/B11200572012XXXXB0100.pdf [Accessed June 2016].
3. Census and Statistics Department. (2012b) Special Topics
Report #60 on Self-employment. Available from: http://www.statistics.gov.hk/pub/B11301602012XXXXB0100.pdf [Accessed June 2016].
4. Census and Statistics Department. (2015) Women and Men in Hong Kong –
Key Statistics. Available from: http://www.statistics.gov.hk/pub/B11303032015AN15B0100.pdf [Accessed June 2016].
5. Census and Statistics Department. (2016a) 2015 Report on
Annual Earnings and Hours Survey. Available from: http://www.statistics.gov.hk/pub/B10500142015AN15B0100.pdf [Accessed June 2016].
6. Census and Statistics Department. (2016b) Report on Quarterly Business
Tendency Survey, Second Quarter 2016. Available from: http://www.statistics.gov.hk/pub/B11100082016QQ02B0100.pdf [Accessed June 2016].
7. Census and Statistics Department. (2016c) Unemployment and
underemployment statistics for February-April 2016. Available from: http://www.censtatd.gov.hk/press_release/pressReleaseDetail.jsp?charsetID=1&pressRID=3840 [Accessed June 2016].
8. Chinese University Hong Kong. (2014) Booming Startup Ecosystem Signals Bright
Future for Hong Kong Entrepreneurs. Available from: http://mba.cuhk.edu.hk/news_post/booming-startup-ecosystem-signals-bright-future-hong-kong-entrepreneurs/ [Accessed June 2016].

18
9. Congressional Research Services of the United States. (2016) What Does the Gig Economy Mean for Workers? Available from: https://www.fas.org/sgp/crs/misc/R44365.pdf [Accessed June 2016].
10. Economic Analysis and Business Facilitation Unit. (2016a) 2015 Economic Background and 2016 Prospects: An update on the self-employment situation. Available from: http://www.hkeconomy.gov.hk/en/pdf/box-15q4-6-2.pdf [Accessed June 2016].
11. Economic Analysis and Business Facilitation Unit. (2016b) 2015 Study on Earnings Mobility. Available from: http://www.povertyrelief.gov.hk/pdf/Information%20Paper%20-%20Bilingual%20-%20Main%20Text%20(12.5.2016)_clean.pdf [Accessed June 2016].
12. GovHK. (2016) The 2016-17 Budget. Available from: http://www.budget.gov.hk/2016/eng/speech.html [Accessed June 2016].
13. Haltiwanger, J. et al. (2013) Who Creates jobs? Small Versus Large Versus Young. The Review of Economics and Statistics, vol. XCV, no. 2, May 2013. Available from: http://www.mitpressjournals.org/doi/pdf/10.1162/REST_a_00288 [Accessed June 2016].
14. Hong Kong Productivity Council. (2016) Hong Kong SME Leading Business Index Report, Second Quarter 2016. Available from: https://www.smeone.org/index.php?option=com_content&view=article&id=413:sme-index-report-20150433&catid=37&Itemid=122&lang=en [Accessed June 2016].
15. Invest Hong Kong. (2015) InvestHK's survey shows continued growth of Hong Kong startup ecosystem. Available from: http://www1.investhk.gov.hk/news-item/investhks-survey-shows-continued-growth-of-hong-kong-startup-ecosystem/?am_force_theme_layout=mobile [Accessed June 2016].
16. Kauffman Foundation. (2015) Entrepreneurship Policy Digest: The Dos and Don't of Local Entrepreneurship Promotion. Available from: http://www.kauffman.org/what-we-do/resources/entrepreneurship-policy-digest/the-dos-and-donts-of-local-entrepreneurship-promotion [Accessed June 2016].
17. KPMG. (2011) Work fragmentation: How much is too much? Available from: http://www.kpmg.com/AU/en/IssuesAndInsights/ArticlesPublications/Lists/Expired/Work-fragmentation-how-much.pdf [Accessed June 2016].
19
18. Legislative Council Secretariat. (2015a) Essentials on Minimum wage and protection of elementary workers. LC Paper No. ISE17/14-15.
19. Legislative Council Secretariat. (2015b) Research Brief on Four Pillars and Six
Industries in Hong Kong: reviews and outlook. LC Paper No. RB03/14-15. 20. Legislative Council Secretariat. (2015c) Research Brief on Social Mobility in
Hong Kong. LC Paper No. RB02/14-15. 21. Markit. (2016) Nikkei Hong Kong PMI: News release on 5 May 2016.
Available from: https://www.markiteconomics.com/Survey//PressRelease.mvc/c2972592be8f4a08b8b1bfd19bcd49e6 [Accessed June 2016].
22. The Economist. (2016) The gig economy: Smooth operators, 20 February 2016.
Available from: http://www.economist.com/news/finance-and-economics/21693261-new-report-reveals-scale-and-purpose-app-based-earnings-smooth-operators [Accessed June 2016].
23. United Nations Conference on Trade and Development. (2015) Policy Guide
on Youth Entrepreneurship. Available from: http://www.google.com.hk/url?sa=t&rct=j&q=&esrc=s&source=web&cd=2&ved=0ahUKEwiq6t2fo_TMAhUkIKYKHRrnAXUQFggiMAE&url=http%3A%2F%2Functad.org%2Fen%2FPublicationsLibrary%2Fwebdiaeed2015d1_en.pdf&usg=AFQjCNHUaUS30k7Q414TLMbmsjMhl5Sulg [Accessed June 2016].
24. Wells Fargo. (2016) How Far Reaching is the "Gig economy"?
Available from: https://www08.wellsfargomedia.com/assets/pdf/commercial/insights/economics/special-reports/gig-economy-20160229.pdf [Accessed June 2016].
25. Wong, R. (2016) Is Hong Kong turning less entrepreneurial? Available from:
http://www.wangyujian.com/?p=6469&lang=en [Accessed June 2016]. 26. World Economic Forum. (2014) 6 ways governments can encourage
entrepreneurship. Available from: https://www.weforum.org/agenda/2014/12/6-ways-governments-can-encourage-entrepreneurship/ [Accessed June 2016].
27. 新論壇:《香港各世代大學生收入比較研究報告》, 2015 年,網址:http://www.ncforum.org.hk/file/upload/file_828_4jy.pdf [於 2016 年6 月登入 ]。