Challenges in the Future Power Network
64
All rights reserved. No part of this publication may be reproduced or distributed in any form without permission of the author. Copyright © 2017. http:www.fglongatt.org Monterrey, Mexico, September 2017 CHALLENGES IN THE FUTURE POWER NETWORKS Dr. Francisco M. Gonzalez-Longatt Loughborough University, UK 1 st September 2017 Monterrey, Mexico
-
Upload
francisco-gonzalez-longatt -
Category
Engineering
-
view
162 -
download
1
Transcript of Challenges in the Future Power Network

All
right
s re
serv
ed. N
o pa
rt o
f thi
s pu
blic
atio
n m
ay b
e re
prod
uced
or
dist
ribut
ed in
any
form
with
out p
erm
issi
on o
f the
aut
hor.
Cop
yrig
ht ©
201
7. h
ttp:w
ww
.fglo
ngat
t.org
Monterrey, Mexico, September 2017
CHALLENGES IN THE FUTURE POWER NETWORKS
Dr. Francisco M. Gonzalez-LongattLoughborough University, UK
1st September 2017
Monterrey, Mexico

All
right
s re
serv
ed. N
o pa
rt o
f thi
s pu
blic
atio
n m
ay b
e re
prod
uced
or
dist
ribut
ed in
any
form
with
out p
erm
issi
on o
f the
aut
hor.
Cop
yrig
ht ©
201
7. h
ttp:w
ww
.fglo
ngat
t.org
Monterrey, Mexico, September 2017
Future Electric Power Grid:
Smart-erGrid
Driving Forces and challenges

All
right
s re
serv
ed. N
o pa
rt o
f thi
s pu
blic
atio
n m
ay b
e re
prod
uced
or
dist
ribut
ed in
any
form
with
out p
erm
issi
on o
f the
aut
hor.
Cop
yrig
ht ©
201
7. h
ttp:w
ww
.fglo
ngat
t.org
Monterrey, Mexico, September 2017
Context: Overview of Drivers
@fglongatt
@fglongatt
Gonzalez-Longatt, F. (2014). Frequency Control
and Inertial Response Schemes for the Future
Power Networks. Large Scale Renewable Power
Generation. J. Hossain and A. Mahmud, Springer
Singapore: 193-231.

All
right
s re
serv
ed. N
o pa
rt o
f thi
s pu
blic
atio
n m
ay b
e re
prod
uced
or
dist
ribut
ed in
any
form
with
out p
erm
issi
on o
f the
aut
hor.
Cop
yrig
ht ©
201
7. h
ttp:w
ww
.fglo
ngat
t.org
Monterrey, Mexico, September 2017
Context: Where do we need to Change?
EVIM
Storage
PV
MTDC
AC
System
Wind Farm
The other half of the challenge lies
in building the transport and
distribution networks
As the low-emission economy
evolves, building new generation
technologies is just half the
challenge
@fglongatt
Gonzalez-Longatt, F. (2014). Frequency Control
and Inertial Response Schemes for the Future
Power Networks. Large Scale Renewable Power
Generation. J. Hossain and A. Mahmud, Springer
Singapore: 193-231.
All
right
s re
serv
ed. N
o pa
rt o
f thi
s pu
blic
atio
n m
ay b
e re
prod
uced
or
dist
ribut
ed in
any
form
with
out p
erm
issi
on o
f the
aut
hor.
Cop
yrig
ht ©
201
7. h
ttp:w
ww
.fglo
ngat
t.org
Monterrey, Mexico, September 2017
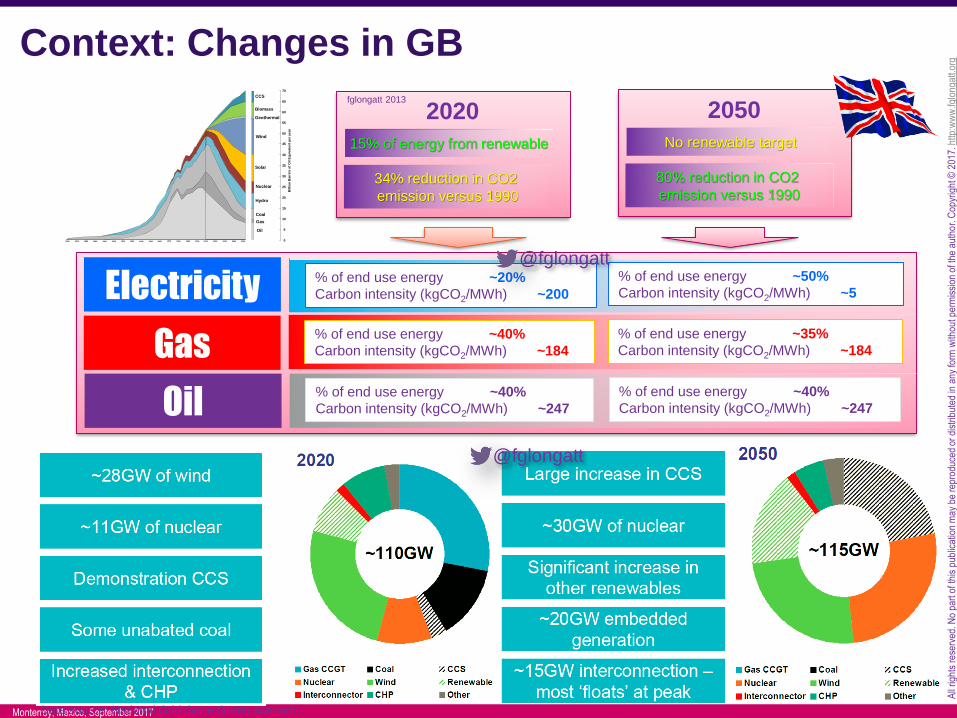
Context: Changes in GB
15% of energy from renewable
34% reduction in CO2
emission versus 1990
2020
No renewable target
80% reduction in CO2
emission versus 1990
2050
% of end use energy ~20%
Carbon intensity (kgCO2/MWh) ~200
% of end use energy ~50%
Carbon intensity (kgCO2/MWh) ~5Electricity
1860 1870 1880 1890 1900 1910 1920 1930 1940 1950 1960 1970 1980 1990 2000 2010 2020 20402030 2050
Oil
Gas
Coal
Hydro
Nuclear
Solar
Wind
Geothermal
Biomass
CCS
Billio
n B
arr
els
of
Oil E
qu
iva
len
t p
er
ye
ar
0
5
10
15
20
25
30
35
40
45
50
55
60
65
70
% of end use energy ~40%
Carbon intensity (kgCO2/MWh) ~184
% of end use energy ~35%
Carbon intensity (kgCO2/MWh) ~184Gas% of end use energy ~40%
Carbon intensity (kgCO2/MWh) ~247
% of end use energy ~40%
Carbon intensity (kgCO2/MWh) ~247Oil
Data source: National Grid Gone Green scenario
fglongatt 2013
@fglongatt
@fglongatt

All
right
s re
serv
ed. N
o pa
rt o
f thi
s pu
blic
atio
n m
ay b
e re
prod
uced
or
dist
ribut
ed in
any
form
with
out p
erm
issi
on o
f the
aut
hor.
Cop
yrig
ht ©
201
7. h
ttp:w
ww
.fglo
ngat
t.org
Monterrey, Mexico, September 2017
North Sea National Targets 2030 (1/4)
SKAGERRAK
IRISH SEA
ENGLISH CHANNEL
KATTEGAT
DENMARK
GERMANY
NETHERLANDS
BELGIUM
UNITED
KINGDOM
IRELAND
www.fglongatt.org.veFrancisco Gonzalez-Longatt, PhD
June 2012Coventry, UK
@fglongatt
Data source: EWEA
@fglongatt

All
right
s re
serv
ed. N
o pa
rt o
f thi
s pu
blic
atio
n m
ay b
e re
prod
uced
or
dist
ribut
ed in
any
form
with
out p
erm
issi
on o
f the
aut
hor.
Cop
yrig
ht ©
201
7. h
ttp:w
ww
.fglo
ngat
t.org
Monterrey, Mexico, September 2017
Future Energy Systems
Basic considerations of Future Energy
Systems

All
right
s re
serv
ed. N
o pa
rt o
f thi
s pu
blic
atio
n m
ay b
e re
prod
uced
or
dist
ribut
ed in
any
form
with
out p
erm
issi
on o
f the
aut
hor.
Cop
yrig
ht ©
201
7. h
ttp:w
ww
.fglo
ngat
t.org
Monterrey, Mexico, September 2017
Power Network (present) Energy Systems Future
MTDC
Multi-terminal HVDC
Increased use of
HVDC lines of both,
LCC and
predominantly VSC
technology (in meshed
networks and as a
super grid)
• Liberalised market
• Increased cross-boarder bulk
power transfers to facilitate
effectiveness of market
mechanisms
@fglongatt

All
right
s re
serv
ed. N
o pa
rt o
f thi
s pu
blic
atio
n m
ay b
e re
prod
uced
or
dist
ribut
ed in
any
form
with
out p
erm
issi
on o
f the
aut
hor.
Cop
yrig
ht ©
201
7. h
ttp:w
ww
.fglo
ngat
t.org
Monterrey, Mexico, September 2017
Power Network (present) Energy Systems Future
Proliferation of
nonconventional
renewable
generation – largely
stochastic and
intermittent
(wind, PV, marine) at
all
levels and of various
sizes
• Large on-shore and offshore
wind farms
Wind Farm
Offshore wind power
Storage
Electric-vehicles
Renewable Energy Resources
@fglongatt

All
right
s re
serv
ed. N
o pa
rt o
f thi
s pu
blic
atio
n m
ay b
e re
prod
uced
or
dist
ribut
ed in
any
form
with
out p
erm
issi
on o
f the
aut
hor.
Cop
yrig
ht ©
201
7. h
ttp:w
ww
.fglo
ngat
t.org
Monterrey, Mexico, September 2017
Power Network (present) Energy Systems Future
• Integrated “intelligent”
Power Electronic
devices
• Integrated ICT &
storage
• Small scale (widely
• dispersed) technologies in
Distribution networks
• Active distribution networks
• New types of loads within
• customer premises
Bi-directional energy flow
Different energy carriers
Multi-directional info flow
@fglongatt

All
right
s re
serv
ed. N
o pa
rt o
f thi
s pu
blic
atio
n m
ay b
e re
prod
uced
or
dist
ribut
ed in
any
form
with
out p
erm
issi
on o
f the
aut
hor.
Cop
yrig
ht ©
201
7. h
ttp:w
ww
.fglo
ngat
t.org
Monterrey, Mexico, September 2017
Future Electric Power Grid:
Smart-erGrid
Smarter-Grid and Potential solutions

All
right
s re
serv
ed. N
o pa
rt o
f thi
s pu
blic
atio
n m
ay b
e re
prod
uced
or
dist
ribut
ed in
any
form
with
out p
erm
issi
on o
f the
aut
hor.
Cop
yrig
ht ©
201
7. h
ttp:w
ww
.fglo
ngat
t.org
Monterrey, Mexico, September 2017
What it is?

All
right
s re
serv
ed. N
o pa
rt o
f thi
s pu
blic
atio
n m
ay b
e re
prod
uced
or
dist
ribut
ed in
any
form
with
out p
erm
issi
on o
f the
aut
hor.
Cop
yrig
ht ©
201
7. h
ttp:w
ww
.fglo
ngat
t.org
Monterrey, Mexico, September 2017
Smarter Grid
A smart electricity grid that develops to support an efficient, timely transition
to a low carbon economy to help the UK meet its carbon reduction targets,
ensure energy security and wider energy goals while minimising costs to
consumers
https://www.gov.uk/government/uploads/system/uploads/attachment_data/file/285417/Smart_Grid_Vision_and_RoutemapFINAL.pdf
The term smart grid has
been in use since at least
2005, when it appeared in
the article "Toward A
Smart Grid" by Amin and
Wollenberg.
Smart Grids European
Technology Platformhttp://www.smartgrids.eu/
http://energy.gov/oe/technology-development/smart-grid
"Smart Grid /
Department of Energy"
https://www.gov.uk/government/policies/maintaining-uk-
energy-security--2/supporting-pages/future-electricity-
networks
Department of
Energy &
Climate Change
and Ofgem
Self-Healing to correct problems early
Interactive with consumers and markets
Optimized to make best use of resources
Predictive to prevent emergencies
Distributed assets and information
Integrated to merge all critical information
More Secure from threats from all hazards
Massive deployment in ICT
Intelligent systems
Distributed intelligent systems.
Features of a Smart Grid

All
right
s re
serv
ed. N
o pa
rt o
f thi
s pu
blic
atio
n m
ay b
e re
prod
uced
or
dist
ribut
ed in
any
form
with
out p
erm
issi
on o
f the
aut
hor.
Cop
yrig
ht ©
201
7. h
ttp:w
ww
.fglo
ngat
t.org
Monterrey, Mexico, September 2017
Smarter Grid

All
right
s re
serv
ed. N
o pa
rt o
f thi
s pu
blic
atio
n m
ay b
e re
prod
uced
or
dist
ribut
ed in
any
form
with
out p
erm
issi
on o
f the
aut
hor.
Cop
yrig
ht ©
201
7. h
ttp:w
ww
.fglo
ngat
t.org
Monterrey, Mexico, September 2017
Research Projects (1/2)
http://www.fglongatt.org/Desechable/SEMINAR%20Exploring%20Beyond%20frontier.pdf
@fglongatt
@fglongatt

All
right
s re
serv
ed. N
o pa
rt o
f thi
s pu
blic
atio
n m
ay b
e re
prod
uced
or
dist
ribut
ed in
any
form
with
out p
erm
issi
on o
f the
aut
hor.
Cop
yrig
ht ©
201
7. h
ttp:w
ww
.fglo
ngat
t.org
Monterrey, Mexico, September 2017
Smart Grids: Challenges/Solutions
Solution
Balancing generation & demand, new business models
Reliability through auto-matic outage prevention and restoration
Efficient generation, transmission, distribution & consumption
Full transparency on distribution level and automated loss prevention
Load management & peak avoidance
Distributed and renewable energy
Aging and/or weak infrastructure
Cost and emissions of energy supply
Revenue losses, e.g. non-technical losses
Limited generation and grid capacity
Great Challenges@fglongatt

All
right
s re
serv
ed. N
o pa
rt o
f thi
s pu
blic
atio
n m
ay b
e re
prod
uced
or
dist
ribut
ed in
any
form
with
out p
erm
issi
on o
f the
aut
hor.
Cop
yrig
ht ©
201
7. h
ttp:w
ww
.fglo
ngat
t.org
Monterrey, Mexico, September 2017
Challenge:
Uncertainties and Big Data
Smart Grid Context
All
right
s re
serv
ed. N
o pa
rt o
f thi
s pu
blic
atio
n m
ay b
e re
prod
uced
or
dist
ribut
ed in
any
form
with
out p
erm
issi
on o
f the
aut
hor.
Cop
yrig
ht ©
201
7. h
ttp:w
ww
.fglo
ngat
t.org
Monterrey, Mexico, September 2017
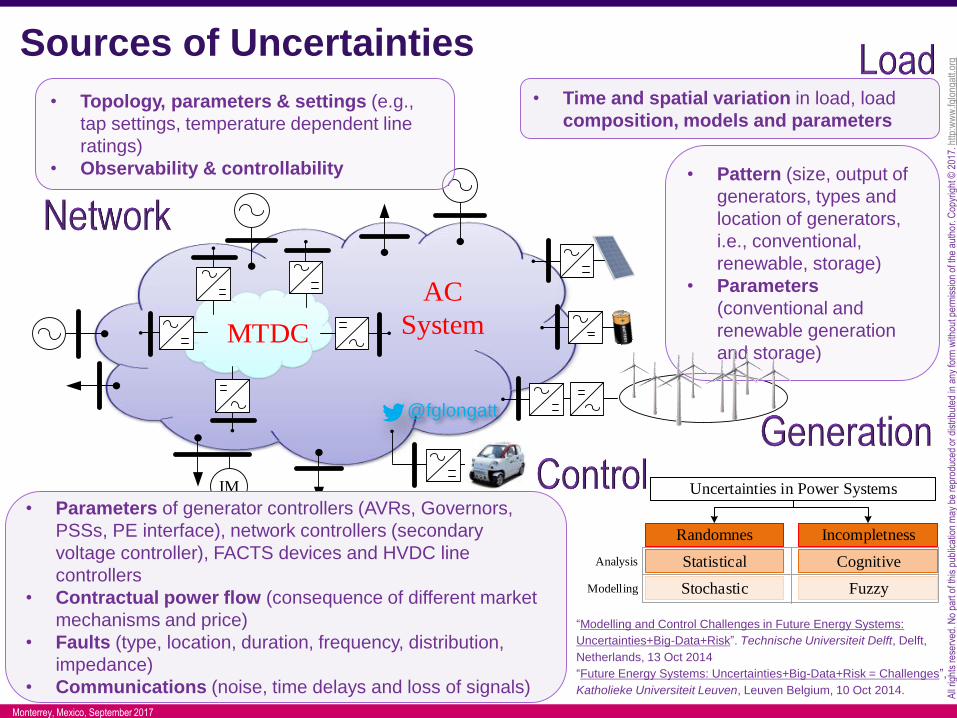
Sources of Uncertainties
IM
MTDC
AC
System
@fglongatt
• Topology, parameters & settings (e.g.,
tap settings, temperature dependent line
ratings)
• Observability & controllability • Pattern (size, output of
generators, types and
location of generators,
i.e., conventional,
renewable, storage)
• Parameters
(conventional and
renewable generation
and storage)
• Parameters of generator controllers (AVRs, Governors,
PSSs, PE interface), network controllers (secondary
voltage controller), FACTS devices and HVDC line
controllers
• Contractual power flow (consequence of different market
mechanisms and price)
• Faults (type, location, duration, frequency, distribution,
impedance)
• Communications (noise, time delays and loss of signals)
• Time and spatial variation in load, load
composition, models and parameters
Uncertainties in Power Systems
Randomnes Incompletness
Statistical Cognitive
Stochastic FuzzyModelling
Analysis
“Modelling and Control Challenges in Future Energy Systems:
Uncertainties+Big-Data+Risk”. Technische Universiteit Delft, Delft,
Netherlands, 13 Oct 2014
“Future Energy Systems: Uncertainties+Big-Data+Risk = Challenges”,
Katholieke Universiteit Leuven, Leuven Belgium, 10 Oct 2014.

All
right
s re
serv
ed. N
o pa
rt o
f thi
s pu
blic
atio
n m
ay b
e re
prod
uced
or
dist
ribut
ed in
any
form
with
out p
erm
issi
on o
f the
aut
hor.
Cop
yrig
ht ©
201
7. h
ttp:w
ww
.fglo
ngat
t.org
Monterrey, Mexico, September 2017
Sources of Big-Data
WAN
People
Smart
Meters
Smart
Appliances
Data
concentrator
Applications
server
PMU PMU
• SCADA (Supervisory Control And Data Acquisition) systems
• WAMS (Wide Area Monitoring Systems)
• Advanced metering devices (“Intelligent”/“Smart” meters)
Many measurements
not just standard
Condition parameters
• New data sources: no knowledge / expertise
• Data mining and online analytics for interpretation
PQ monitoring
Customer surveys
Dynamic Thermal Rate
Environment
All
right
s re
serv
ed. N
o pa
rt o
f thi
s pu
blic
atio
n m
ay b
e re
prod
uced
or
dist
ribut
ed in
any
form
with
out p
erm
issi
on o
f the
aut
hor.
Cop
yrig
ht ©
201
7. h
ttp:w
ww
.fglo
ngat
t.org
Monterrey, Mexico, September 2017
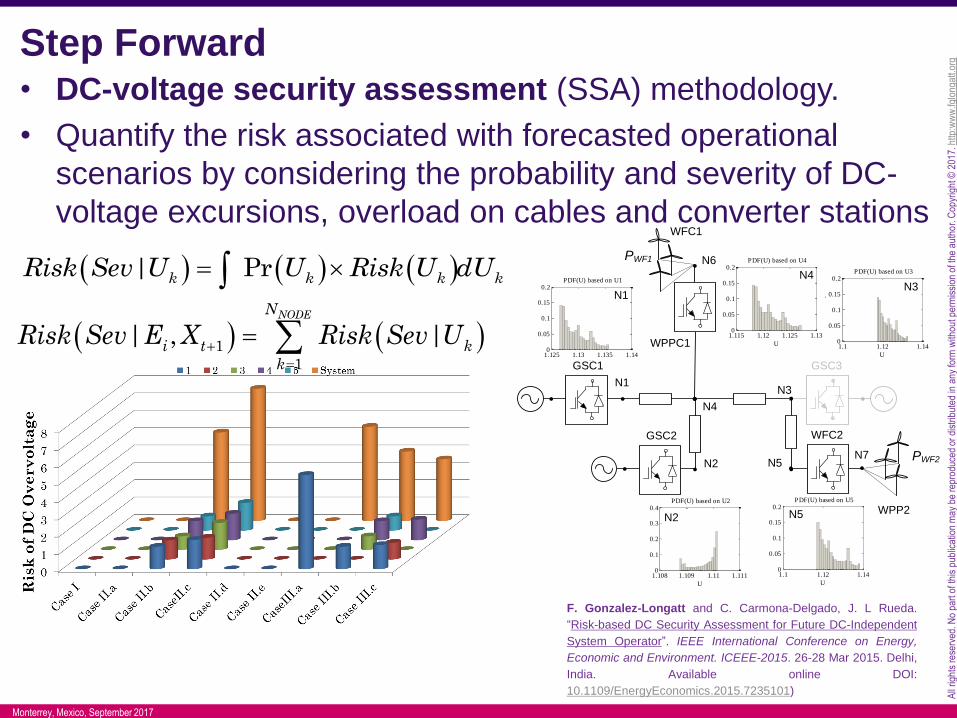
Step Forward• DC-voltage security assessment (SSA) methodology.
• Quantify the risk associated with forecasted operational
scenarios by considering the probability and severity of DC-
voltage excursions, overload on cables and converter stations
| Prk k k k
Risk Sev U U Risk U dU
1
1
| , |NODEN
i t k
k
Risk Sev E X Risk Sev U
N4
PWF1 N6
N1N3
WPPC1
WFC1
GSC1 GSC3
N5
WFC2
WPP2
PWF2N7N2
GSC2
1.125 1.13 1.135 1.140
0.05
0.1
0.15
0.2
U
Pro
babil
ity
PDF(U) based on U1
1.108 1.109 1.11 1.1110
0.1
0.2
0.3
0.4
U
Pro
babil
ity
PDF(U) based on U2
1.1 1.12 1.140
0.05
0.1
0.15
0.2
U
Pro
babil
ity
PDF(U) based on U3
1.115 1.12 1.125 1.130
0.05
0.1
0.15
0.2
U
Pro
babil
ity
PDF(U) based on U4
1.1 1.12 1.140
0.05
0.1
0.15
0.2
U
Pro
babil
ity
PDF(U) based on U5
N4N3
N1
N2 N5
F. Gonzalez-Longatt and C. Carmona-Delgado, J. L Rueda.
“Risk-based DC Security Assessment for Future DC-Independent
System Operator”. IEEE International Conference on Energy,
Economic and Environment. ICEEE-2015. 26-28 Mar 2015. Delhi,
India. Available online DOI:
10.1109/EnergyEconomics.2015.7235101)

All
right
s re
serv
ed. N
o pa
rt o
f thi
s pu
blic
atio
n m
ay b
e re
prod
uced
or
dist
ribut
ed in
any
form
with
out p
erm
issi
on o
f the
aut
hor.
Cop
yrig
ht ©
201
7. h
ttp:w
ww
.fglo
ngat
t.org
Monterrey, Mexico, September 2017
Reducing Risk in Uncertain Scenarios• Online Risk-Based DC-Voltage Security Assessment of
Multi-Terminal HVDC Transmission System of Wind Power
Plant.
General Considerations of oRB-VC
Methodology of risk-based DC-voltage security assessment (RB-VS)
Risk mapping process of (n=3)-
Level risk matrix based on fuzzy-
logic rules.
@fglongatt
@fglongatt
@fglongatt
J.L. Rueda F. Gonzalez-Longatt. “Dynamic
Vulnerability assessment and intelligent control for
sustainable power systems”. IEEE-Wiley. ISBN-13:
978-1119214953 Wiley-Blackwell

All
right
s re
serv
ed. N
o pa
rt o
f thi
s pu
blic
atio
n m
ay b
e re
prod
uced
or
dist
ribut
ed in
any
form
with
out p
erm
issi
on o
f the
aut
hor.
Cop
yrig
ht ©
201
7. h
ttp:w
ww
.fglo
ngat
t.org
Monterrey, Mexico, September 2017
Challenges
Massive deployment of Power Electronic
High Voltage Direct Current (HVDC)

All
right
s re
serv
ed. N
o pa
rt o
f thi
s pu
blic
atio
n m
ay b
e re
prod
uced
or
dist
ribut
ed in
any
form
with
out p
erm
issi
on o
f the
aut
hor.
Cop
yrig
ht ©
201
7. h
ttp:w
ww
.fglo
ngat
t.org
Monterrey, Mexico, September 2017
HVDC Context
LCC HVDC• Current-sourced
• Line-Commutated
VSC HVDC
− Voltage-Sourced
− Self-Commutated
+
-
Idc
acU+
-
+
-
dcU
-1
-0.5
0
0.5
1
0
2
3
2
2
acU
2
dcU
2
dcU
Desired
voltage
Realized
Voltage
MMC HVDC
• Multi-level
Converter
@fglongatt

All
right
s re
serv
ed. N
o pa
rt o
f thi
s pu
blic
atio
n m
ay b
e re
prod
uced
or
dist
ribut
ed in
any
form
with
out p
erm
issi
on o
f the
aut
hor.
Cop
yrig
ht ©
201
7. h
ttp:w
ww
.fglo
ngat
t.org
Monterrey, Mexico, September 2017
Types of HVDC SystemsDifferent common system configurations and operating
modes used for HVDC transmission
Monopole, Ground Return
Monopole, Metallic Return
Monopole, Midpoint Grounded
Back-to-Back
(a) Monopole (b) Bipole
Bipole Bipole, Metallic Return
(c) Multi-Terminal
Multiterminal
Bipole, Series-Connected
Converters

All
right
s re
serv
ed. N
o pa
rt o
f thi
s pu
blic
atio
n m
ay b
e re
prod
uced
or
dist
ribut
ed in
any
form
with
out p
erm
issi
on o
f the
aut
hor.
Cop
yrig
ht ©
201
7. h
ttp:w
ww
.fglo
ngat
t.org
Monterrey, Mexico, September 2017
Nanao 3-Terminal VSC-HVDC• The world’s first three-terminal VSC HVDC system in
China.
• The pilot project with designed ratings of ±160kV/200MW-
100MW-50MW brings dispersed, intermittent clean wind
power generated on Nanao island into the mainland
Guangdong power grid through 32km of combination of
HVDC land cables, sea cables and overheard lines.
Diagram of Nan’ao three-terminal HVDC Flexible projectR&D and application of voltage sourced converter based high voltage direct current engineering technology in China
Guangfu TANG (&), Zhiyuan HE, Hui PANG
https://www.dnvgl.com/news/dnv-gl-advises-on-world-s-first-multi-terminal-vsc-hvdc-transmission-project-
integrating-clean-energy-into-china-s-regional-power-composition-mix-6205
“Massive Integration of Offshore wind power using HVDC” (Spanish: Integración
masiva de la energía eólica marina utilizando HVDC) Colegio de Ingenieros de
Chile, Santiago de Chile, Chile http://pes.ieeechile.cl/,
http://www.fglongatt.org/Desechable/NEWS/NEWS29_HVDC_Chile.html

All
right
s re
serv
ed. N
o pa
rt o
f thi
s pu
blic
atio
n m
ay b
e re
prod
uced
or
dist
ribut
ed in
any
form
with
out p
erm
issi
on o
f the
aut
hor.
Cop
yrig
ht ©
201
7. h
ttp:w
ww
.fglo
ngat
t.org
Monterrey, Mexico, September 2017
World's First 5-Terminal VSC HVDC• 4th July 2014, ±200kV Zhoushan VSC-HVDC project--the
world first 5-terminal one was put into service (141 km).
• This project establishes a critical interconnection between
mainland and 5 isolated islands.
State Grid Company of Zhejiang province
Diagram of Zhoushan five-terminal HVDC Flexible project
16 km
34 km
52 km
39km
400 MW
300 MW
100 MW
100 MW100 MW
“Moving Towards Future Electrical Systems: Multi-Terminal HVDC + Wind Power”. University of Seville, Seville Spain, 21-
22 Oct 2015.
Online. Slides: http://www.slideshare.net/fglongatt/moving-towards-future-electrical-systemsmultiterminal-hvdc-wind-
power-2122-october-2015-seville-spain.
Videos: http://catedraendesa.us.es/index.php/es/aula-de-la-luz-catedraendesa/seminarios-catedraendesa/2015/francisco-
m-gonzalez-longatt-moving-towards-future-electrical-systems-multiterminal-hvdc-offshore-wind-power

All
right
s re
serv
ed. N
o pa
rt o
f thi
s pu
blic
atio
n m
ay b
e re
prod
uced
or
dist
ribut
ed in
any
form
with
out p
erm
issi
on o
f the
aut
hor.
Cop
yrig
ht ©
201
7. h
ttp:w
ww
.fglo
ngat
t.org
Monterrey, Mexico, September 2017
HVDC in GB Context
ENGLISH CHANNEL
UNITED
KINGDOM
IRELAND
①
②
③
④
⑤
⑥
⑦
⑧
To France
⑨
⑩France
⑪⑫
⑬
⑭
⑮
To Iceland
⑯
⑰
⑱
⑲
⑳
To Spain
2122
CURRENT HVDC LINKS
PLANNED HVDC LINKS (2016-2020)ANTICIPATED HVDC LINKS (2020-2025) LINK
POTENTIAL HVDC INTERCONNECTORS LINK
F. Gonzalez-Longatt. “Optimal Power Flow in Multi-terminal HVDC Networks for DC-
System Operator: Constant Current Operation”. 50th International Universities Power
Engineering Conference (UPEC 2015), 1-4th Sept 2015, Stoke-on-Trent, UK.
(Available online: 10.1109/UPEC.2015.7339913)
@fglongatt

All
right
s re
serv
ed. N
o pa
rt o
f thi
s pu
blic
atio
n m
ay b
e re
prod
uced
or
dist
ribut
ed in
any
form
with
out p
erm
issi
on o
f the
aut
hor.
Cop
yrig
ht ©
201
7. h
ttp:w
ww
.fglo
ngat
t.org
Monterrey, Mexico, September 2017
Control Strategies for MTDC Schematic representation of MTDC control system
hierarchy
AC
network
VSC1
VSCdcn
MTDC
network
iP ,dc iP
,dc iUiV
...
,g iP,l iP
1gP
1lP
...
VSCi
Time
ScaleVSCnVSC2VSC1
Pulses
. . .
. . .
Master Control
VSC
Terminal
Controller 1
Terminal
Controller 2
Terminal
Controller n
Supplementary
Control
Firing ControlInner Control
Outer Control
The terminal controllers determine the
behavior of the converter at the system
bus.
They are designed for the main
functions for
controlling: active power (P), reactive
power (Q), AC and the DC voltage
(Vac, Udc)
The master control optimizes the overall performance of the MTDC by regulating
the DC side voltage.
It is provided with the minimum set of functions necessary for coordinated
operation of the terminals in the DC circuit, i.e. start and stop, minimization of
losses, oscillation damping and power flow reversal, black start, AC frequency and
AC voltage support.
sec
<s
ms
s
F. Gonzalez-Longatt, J. M. Roldan, J. Rueda, C.A. Charalambous, and B. S. Rajpurohit. Implementation
of Simplified Models of Local Controller for Muti-terminal HVDC Systems in DIgSILENT Power Factory.
in PowerFactory Applications for Power System Analysis. Springer-Verlag 2015. DOI: 10.1007/978-3-
319-12958-7_19

All
right
s re
serv
ed. N
o pa
rt o
f thi
s pu
blic
atio
n m
ay b
e re
prod
uced
or
dist
ribut
ed in
any
form
with
out p
erm
issi
on o
f the
aut
hor.
Cop
yrig
ht ©
201
7. h
ttp:w
ww
.fglo
ngat
t.org
Monterrey, Mexico, September 2017
Control Strategies for MTDC
VSCA
Terminal
controller A
Terminal
controller B
Master Controller
VSCB
Udc,AUdc,BVac,A Vac,B
PBPA
AC voltage
Control
Reactive Power
Control
Inner Current
Controller
DC Voltage
Control
Active Power
ControlrefQ
Q
acV,ac refV
*
qi*
di
refPP
dcU,dc refU
Control Mode,ac CtrlV
CtrlQ,dc CtrlU
CtrlP
Control Mode
Terminal Controller
Terminal Controllers are based on
locals actions and measurements.
Wide-area measurement and control
can improve the system performance.
@fglongatt

All
right
s re
serv
ed. N
o pa
rt o
f thi
s pu
blic
atio
n m
ay b
e re
prod
uced
or
dist
ribut
ed in
any
form
with
out p
erm
issi
on o
f the
aut
hor.
Cop
yrig
ht ©
201
7. h
ttp:w
ww
.fglo
ngat
t.org
Monterrey, Mexico, September 2017
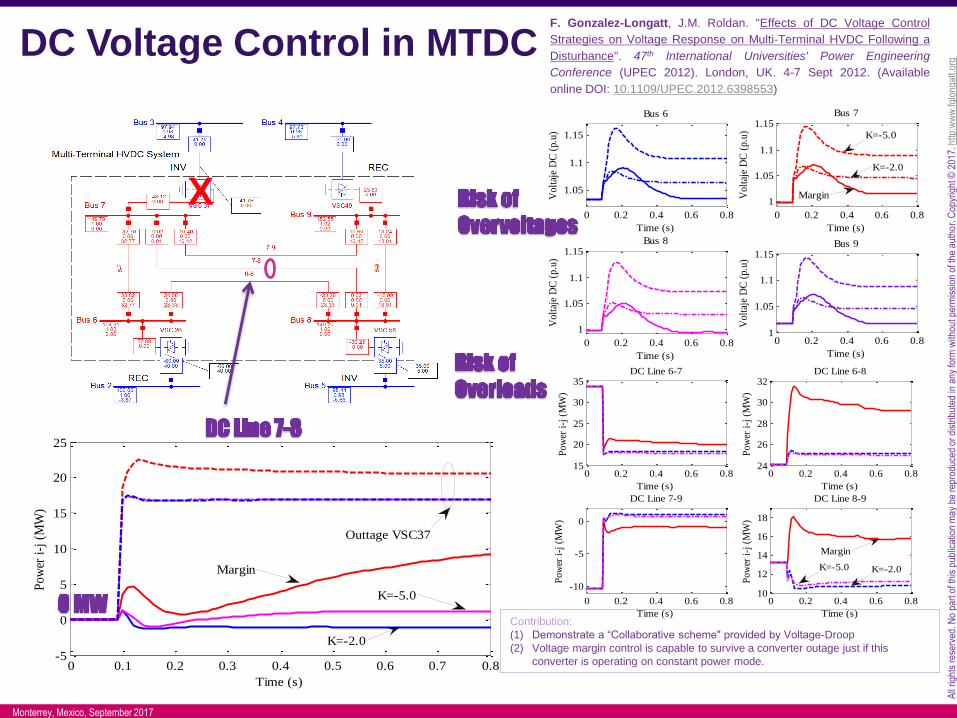
DC Voltage Control in MTDC• Effects of DC Voltage Control Strategies on Voltage Response on
Multi-Terminal HVDC Following a Disturbance
Terminal B
,AdcU
AP
Terminal A
dcUOperating
point
Inverter
Lower limit
Rectifier
“a”
Upper limit
upperPlowerP
,AdcU
AP
Slope mc
dcU
Initial operating pointInverter
Lower limitRectifier
“a”
Upper limit
upperPlowerP
,
a
dc refU
“b”
b
refP
b
refU
a
refP
(i) Voltage Margin Method (VMM)
(ii) Voltage-Droop Method (VDM)
F. Gonzalez-Longatt, J.M. Roldan, J.L. Rueda. “Impact of DC Control
Strategy on Dynamic Behaviour of Multi-Terminal Voltage-Source
Converter-Based HVDC after the Loss of Converter”. IEEE Powertech
2013. Grenoble, France. 16-20 Jun 2013 (Available online:
10.1109/PTC.2013.6652256).
F. Gonzalez-Longatt, J.M. Roldan. "Effects of DC Voltage Control Strategies
on Voltage Response on Multi-Terminal HVDC Following a Disturbance". 47th
International Universities' Power Engineering Conference (UPEC 2012).
London, UK. 4-7 Sept 2012. (Available online DOI:
10.1109/UPEC.2012.6398553)
F. Gonzalez-Longatt, S. Arnaltes, J. Rodríguez. “Dynamic Behaviour of Multi-
Terminal VSC-Based HVDC after a Converter Outage: DC Control Strategy”.
International Conference on Renewable Energies and Power Quality
(ICREPQ’16). Madrid (Spain), 4-6 May 2016.
@fglongatt

All
right
s re
serv
ed. N
o pa
rt o
f thi
s pu
blic
atio
n m
ay b
e re
prod
uced
or
dist
ribut
ed in
any
form
with
out p
erm
issi
on o
f the
aut
hor.
Cop
yrig
ht ©
201
7. h
ttp:w
ww
.fglo
ngat
t.org
Monterrey, Mexico, September 2017
Optimal Operation Scotland
9GW
Dogger Bank
13 GW
Hornsea
4GW
Norfolk
7GW
Belgium
4GW
Germany
24GW
Norway
1GW
Sco
tlan
d S
hore
Lin
e (5
GW
)
Norway Shore Line
Belgium Shore Line 3.5 GW
En
gla
nd
Sh
ore
Lin
e
(24G
W)
Germany
Shore
Line
(20GW)
Netherlands
12GW
Netherlands Shore
Line (10 GW)
England
Rounds
1&2
(6GW)
BritNed
Nema
Denmark
4GW
SK1-3
SK-4
NorN
ed2
NorN
ed
(7G
Q I
nte
rface
Cap
aci
ty)
Den
mark
Sh
ore
Lin
e
(3.5
GW
)
www.fglongatt.org.ve
Francisco Gonzalez-Longatt, PhDOctubre 2011
Manchester, UK
HVDC Transmission
AC Transmission
‘In Flight” or current
10GW5GW
Belgium
London
Hull
Glasgow
Norfolk Bank2GW
5GW
10GW
Firth of Forth5GW
5GW
5GW5GW
Norway
German WF
Dogger Bank
2
8
4ac
38ac
1 10ac101ac
9ac
9
4
1-2
VSC4
VSC9
2-10
VSC1
G10
UK1
3-7
2-3
3-6
8-9
3-92-5
1-4
5ac5VSC5
UK2
5ac
6ac6VSC6
UK3
7ac7
3acVSC3
2acVSC2
G1
G2
G3
G9
VSC8G8
Germany
UK
5ac
VSC7Zeebrugge
VSC8
VSC10
WF
WF
WF
www.fglongatt.org.veFrancisco Gonzalez-Longatt, PhD
January 2012Coventry, UK
4.30
5.00
0.703.60
13.60
10.00
5.30
4.50
5.10
5.00
10.00
8.75
43.45
35.00
1.15
4.70
4.73
2.00
4.26
1.86
4.0
G7
2.22
27.26
16.8
30.8
27.3
5.50
Pdc
Pac
DC-connected Power
Parks
Pdc,k
MTDC System
Meshed
DC
Network
Bulk generationBulk Transmission
TSO1
TSOk
TSOn
......
......
Power
Park 1
Power
Park m
......
Synchronous
Areas
Customers
DC
Independent
System
Operator
Single
Market
Service
Providers
.........
...
Grid Side
Converters
Transmission
System Operators
DC-Wide-Area
Supervision and Control Power Park
Converter
......
F. Gonzalez-Longatt, "Solution of AC/DC Power Flow on a Multi-Terminal
HVDC System: Illustrative Case Supergrid Phase I". 47th International
Universities' Power Engineering Conference (UPEC 2012). London, UK. 4-7
Sept 2012. (Available online DOI: 10.1109/UPEC.2012.6398554)
F. Gonzalez-Longatt. “Optimal steady-state operation of a MTDC system based on
DC-Independent System Operator Multi-objective”. The 11th International Conference
on AC and DC Power Transmission, ACDC 2015. 10-12 Feb 2015, Birmingham, UK.
(Available online DOI: 10.1049/cp.2015.0031)

All
right
s re
serv
ed. N
o pa
rt o
f thi
s pu
blic
atio
n m
ay b
e re
prod
uced
or
dist
ribut
ed in
any
form
with
out p
erm
issi
on o
f the
aut
hor.
Cop
yrig
ht ©
201
7. h
ttp:w
ww
.fglo
ngat
t.org
Monterrey, Mexico, September 2017
MTDC configurationsMTDC configuration: series or parallel
MTDC parallel configuration: radial or
meshed
I1
I2
I3
I4
I1 + I2 + I3+ I4 = 0
U1
U2
U3
U4
U1 + U2 + U3 + U4 = 0
Idc
b. Series MTDCa. Parallel MTDC
+ -Udc
+
-
+-
+
-+-
IdcIdc
Idc
+ -Udc
I1
Udc
+
-
+
-
+
-
+
-
I3
I2 I4
Udc
Udc
Udc
Ixy
y
x
x
+
-Udc
+
-
+
-
+
-
Udc
I1 I3
I4+
-
UxI2
I4
b. Mesh configurationa. Radial configuration
@fglongatt 2(+)
R12
R23
R13
1(+)3(+)
U2
U1
U3
+-
+-
Rgnd1
1(0)
2(0)
Rgnd2
Rgnd3
3(0)
+-
2(+)R12
2(-)
R23
R13
1(+)
1(-)
3(+)
3(-)
R12R23
R13
U2
U1
U3
+-
+-
+-
U1+-
+-
+-
U3
U2
Rgnd1
1(0)
3(0)
2(0)Rgnd2
Rgnd3
GSC1
N1
GSC2
N2
N3
WFC1
PWF1 = 0.80 p.u
WF1
AC1
AC2
R12
= 0
.0.07
3
F. Gonzalez-Longatt, J.L. Rueda, M.A.M.M. van der Meijden, “Effects
of Grounding Configurations on Post-Contingency Performance of
MTDC system: A 3-Terminal Example”. 50th International Universities
Power Engineering Conference (UPEC 2015). 1-4 Sept 2015. Stoke-on-
Trent, UK. (Available online: 10.1109/UPEC.2015.7339912)
@fglongatt
All
right
s re
serv
ed. N
o pa
rt o
f thi
s pu
blic
atio
n m
ay b
e re
prod
uced
or
dist
ribut
ed in
any
form
with
out p
erm
issi
on o
f the
aut
hor.
Cop
yrig
ht ©
201
7. h
ttp:w
ww
.fglo
ngat
t.org
Monterrey, Mexico, September 2017
DC Voltage Control in MTDC
0 0.2 0.4 0.6 0.8
1.05
1.1
1.15
Bus 6
Time (s)
Volt
aje
DC
(p.u
)
0 0.2 0.4 0.6 0.8
1
1.05
1.1
1.15Bus 7
Time (s)
Volt
aje
DC
(p.u
)
0 0.2 0.4 0.6 0.8
1
1.05
1.1
1.15Bus 8
Time (s)
Volt
aje
DC
(p.u
)
0 0.2 0.4 0.6 0.81
1.05
1.1
1.15Bus 9
Time (s)
Volt
aje
DC
(p.u
)
Margin
K=-2.0
K=-5.0
0 0.2 0.4 0.6 0.815
20
25
30
35DC Line 6-7
Time (s)
Po
wer
i-j
(M
W)
0 0.2 0.4 0.6 0.824
26
28
30
32DC Line 6-8
Time (s)
Po
wer
i-j
(M
W)
0 0.2 0.4 0.6 0.8
-10
-5
0
DC Line 7-9
Time (s)
Po
wer
i-j
(M
W)
0 0.2 0.4 0.6 0.810
12
14
16
18
DC Line 8-9
Time (s)
Po
wer
i-j
(M
W)
Margin
K=-5.0 K=-2.0
X
Contribution:
(1) Demonstrate a “Collaborative scheme" provided by Voltage-Droop
(2) Voltage margin control is capable to survive a converter outage just if this
converter is operating on constant power mode. 0 0.1 0.2 0.3 0.4 0.5 0.6 0.7 0.8-5
0
5
10
15
20
25DC Line 6-7
Time (s)
Po
wer
i-j
(M
W)
Outtage VSC37
Margin
K=-5.0
K=-2.0
F. Gonzalez-Longatt, J.M. Roldan. "Effects of DC Voltage Control
Strategies on Voltage Response on Multi-Terminal HVDC Following a
Disturbance". 47th International Universities' Power Engineering
Conference (UPEC 2012). London, UK. 4-7 Sept 2012. (Available
online DOI: 10.1109/UPEC.2012.6398553)
All
right
s re
serv
ed. N
o pa
rt o
f thi
s pu
blic
atio
n m
ay b
e re
prod
uced
or
dist
ribut
ed in
any
form
with
out p
erm
issi
on o
f the
aut
hor.
Cop
yrig
ht ©
201
7. h
ttp:w
ww
.fglo
ngat
t.org
Monterrey, Mexico, September 2017
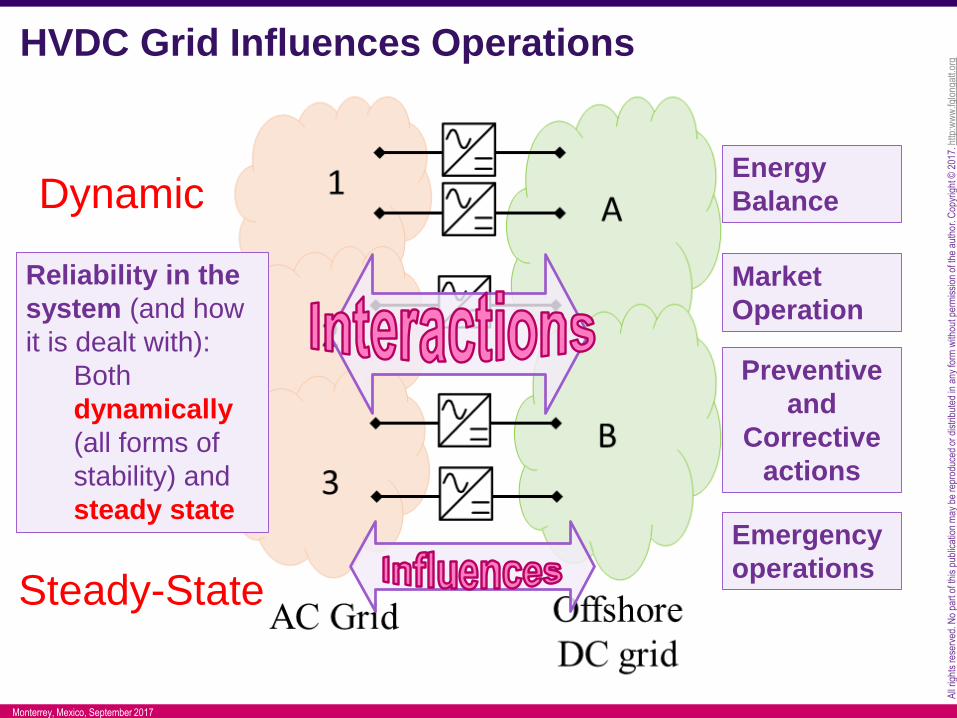
HVDC Grid Influences Operations
Emergency
operations
Energy
Balance
Market
Operation
Preventive
and
Corrective
actions
Reliability in the
system (and how
it is dealt with):
Both
dynamically
(all forms of
stability) and
steady state
Dynamic
Steady-State

All
right
s re
serv
ed. N
o pa
rt o
f thi
s pu
blic
atio
n m
ay b
e re
prod
uced
or
dist
ribut
ed in
any
form
with
out p
erm
issi
on o
f the
aut
hor.
Cop
yrig
ht ©
201
7. h
ttp:w
ww
.fglo
ngat
t.org
Monterrey, Mexico, September 2017
Frequency/Voltage Management:
• Solving unbalances through power injection adjustment (simplified).
• Outage of a converter station connecting the HVDC grid with AC grid 1, zone 1.
• Examples of Solutions:
1. Equal droop reaction causes all converters connected to the HVDC grid to contribute.
2. Control zone 1 of AC grid 1 takes the full unbalance over from the other systems.
P

All
right
s re
serv
ed. N
o pa
rt o
f thi
s pu
blic
atio
n m
ay b
e re
prod
uced
or
dist
ribut
ed in
any
form
with
out p
erm
issi
on o
f the
aut
hor.
Cop
yrig
ht ©
201
7. h
ttp:w
ww
.fglo
ngat
t.org
Monterrey, Mexico, September 2017
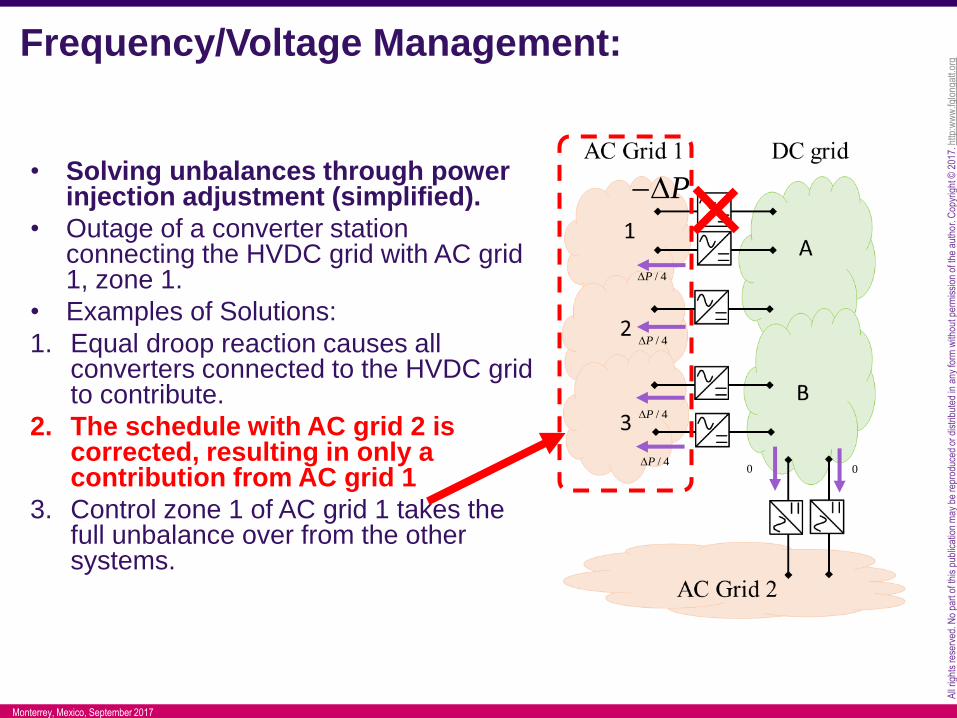
Frequency/Voltage Management:
• Solving unbalances through power injection adjustment (simplified).
• Outage of a converter station connecting the HVDC grid with AC grid 1, zone 1.
• Examples of Solutions:
1. Equal droop reaction causes all converters connected to the HVDC grid to contribute.
2. The schedule with AC grid 2 is corrected, resulting in only a contribution from AC grid 1
3. Control zone 1 of AC grid 1 takes the full unbalance over from the other systems.
P
/ 6P
/ 6P
/ 6P
/ 6P
/ 6P/ 6P
All
right
s re
serv
ed. N
o pa
rt o
f thi
s pu
blic
atio
n m
ay b
e re
prod
uced
or
dist
ribut
ed in
any
form
with
out p
erm
issi
on o
f the
aut
hor.
Cop
yrig
ht ©
201
7. h
ttp:w
ww
.fglo
ngat
t.org
Monterrey, Mexico, September 2017
Frequency/Voltage Management:
• Solving unbalances through power injection adjustment (simplified).
• Outage of a converter station connecting the HVDC grid with AC grid 1, zone 1.
• Examples of Solutions:
1. Equal droop reaction causes all converters connected to the HVDC grid to contribute.
2. The schedule with AC grid 2 is corrected, resulting in only a contribution from AC grid 1
3. Control zone 1 of AC grid 1 takes the full unbalance over from the other systems.
P
/ 4P
0 0
/ 4P
/ 4P
/ 4P

All
right
s re
serv
ed. N
o pa
rt o
f thi
s pu
blic
atio
n m
ay b
e re
prod
uced
or
dist
ribut
ed in
any
form
with
out p
erm
issi
on o
f the
aut
hor.
Cop
yrig
ht ©
201
7. h
ttp:w
ww
.fglo
ngat
t.org
Monterrey, Mexico, September 2017
Frequency/Voltage Management:
• Solving unbalances through power injection adjustment (simplified).
• Outage of a converter station connecting the HVDC grid with AC grid 1, zone 1.
• Examples of Solutions:
1. Equal droop reaction causes all converters connected to the HVDC grid to contribute.
2. The schedule with AC grid 2 is corrected, resulting in only a contribution from AC grid 1
3. Control zone 1 of AC grid 1 takes the full unbalance over from the other systems.
P
0 0
0
0
0
P
Still an action needed
to fix frequencies and
voltages

All
right
s re
serv
ed. N
o pa
rt o
f thi
s pu
blic
atio
n m
ay b
e re
prod
uced
or
dist
ribut
ed in
any
form
with
out p
erm
issi
on o
f the
aut
hor.
Cop
yrig
ht ©
201
7. h
ttp:w
ww
.fglo
ngat
t.org
Monterrey, Mexico, September 2017
Conclusions • As HVDC is increasingly present in power systems.
• New technology allows to provide new “services”.
• It is needed to adapt our operational procedures to make
HVDC operations an inherent part of system operations.
• Influence reaches far into neighbouring zones: both
positive and negative
• Coordination is needed.
• The framework in which the AC and DC systems are
operated will play a key role.

All
right
s re
serv
ed. N
o pa
rt o
f thi
s pu
blic
atio
n m
ay b
e re
prod
uced
or
dist
ribut
ed in
any
form
with
out p
erm
issi
on o
f the
aut
hor.
Cop
yrig
ht ©
201
7. h
ttp:w
ww
.fglo
ngat
t.org
Monterrey, Mexico, September 2017
Fully DC is a real option

All
right
s re
serv
ed. N
o pa
rt o
f thi
s pu
blic
atio
n m
ay b
e re
prod
uced
or
dist
ribut
ed in
any
form
with
out p
erm
issi
on o
f the
aut
hor.
Cop
yrig
ht ©
201
7. h
ttp:w
ww
.fglo
ngat
t.org
Monterrey, Mexico, September 2017
Smart DC Micro-grids
http://smgaznec.fglongatt.org/

All
right
s re
serv
ed. N
o pa
rt o
f thi
s pu
blic
atio
n m
ay b
e re
prod
uced
or
dist
ribut
ed in
any
form
with
out p
erm
issi
on o
f the
aut
hor.
Cop
yrig
ht ©
201
7. h
ttp:w
ww
.fglo
ngat
t.org
Monterrey, Mexico, September 2017
Challenge: Reduced Inertia

All
right
s re
serv
ed. N
o pa
rt o
f thi
s pu
blic
atio
n m
ay b
e re
prod
uced
or
dist
ribut
ed in
any
form
with
out p
erm
issi
on o
f the
aut
hor.
Cop
yrig
ht ©
201
7. h
ttp:w
ww
.fglo
ngat
t.org
Monterrey, Mexico, September 2017
Frequency Stability• “Frequency stability refers to the ability of a power
system to maintain steady frequency following a severe
system upset resulting in a significant imbalance between
generation and load.”
• Frequency stability analysis concentrates on studying the
overall system stability for sudden changes in the
generation-load balance.
@fglongatt
All
right
s re
serv
ed. N
o pa
rt o
f thi
s pu
blic
atio
n m
ay b
e re
prod
uced
or
dist
ribut
ed in
any
form
with
out p
erm
issi
on o
f the
aut
hor.
Cop
yrig
ht ©
201
7. h
ttp:w
ww
.fglo
ngat
t.org
Monterrey, Mexico, September 2017
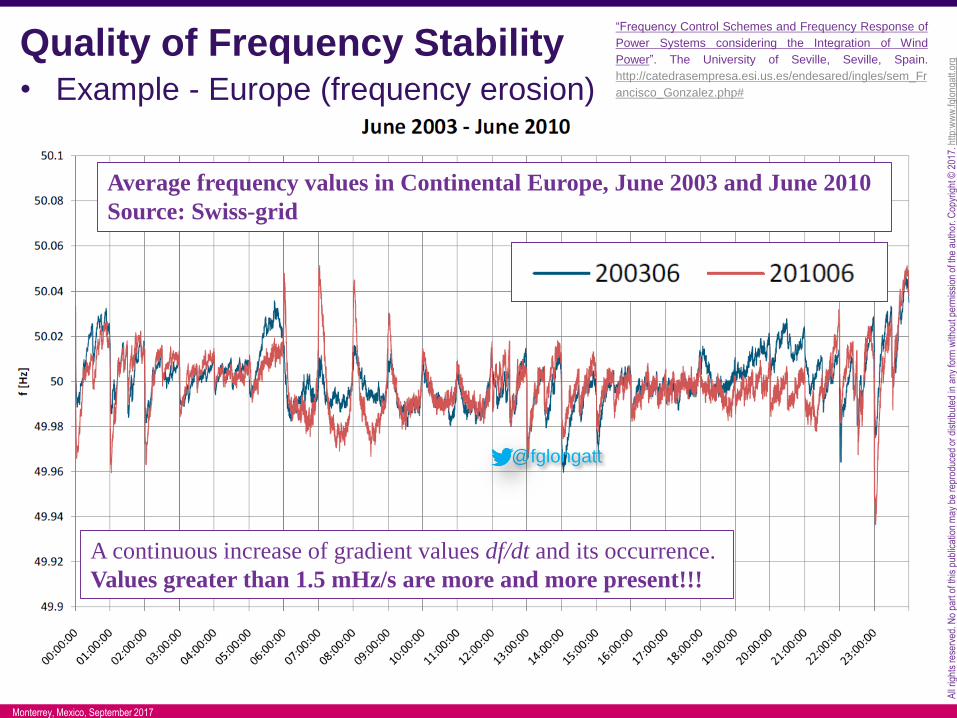
Quality of Frequency Stability • Example - Europe (frequency erosion)
Average frequency values in Continental Europe, June 2003 and June 2010
Source: Swiss-grid
A continuous increase of gradient values df/dt and its occurrence.
Values greater than 1.5 mHz/s are more and more present!!!
@fglongatt
“Frequency Control Schemes and Frequency Response of
Power Systems considering the Integration of Wind
Power”. The University of Seville, Seville, Spain.
http://catedrasempresa.esi.us.es/endesared/ingles/sem_Fr
ancisco_Gonzalez.php#

All
right
s re
serv
ed. N
o pa
rt o
f thi
s pu
blic
atio
n m
ay b
e re
prod
uced
or
dist
ribut
ed in
any
form
with
out p
erm
issi
on o
f the
aut
hor.
Cop
yrig
ht ©
201
7. h
ttp:w
ww
.fglo
ngat
t.org
Monterrey, Mexico, September 2017
Quality of Frequency Stability • Gradually declining in many locations around the world –
but not due to wind power!!!
• Market imperfections around full hour shift (frequency erosion)
• Systems operated closer to their limits
• Decreased damping of oscillations
• Looking forward – e.g. UK - nuclear units increasing - 1300 to 1800 MW
Evening Frequency Average Profile –Winters 2003 to 2008 (November to March – Monday to Friday)
UCTE, "UCTE ad-hoc group "frequency quality investigation, excerpt of the final report," Union for the Co-ordination of Transmission of Electricity, Tech. Rep., 2008, pp. 1-4. [Online]. Available
http://entsoe.eu/_library/publications/ce/otherreports/090330_UCTE_FrequencyInvestigationReport_Abstract.pdf
(*) P. W. Christensen. “Wind Power Plants and future Power System Frequency Stability”. Event on Future Power System Operation, Lund University, Sweden, June 12, 2012
@fglongatt
“Frequency Control Schemes and Frequency Response of Power Systems
considering the Integration of Wind Power”. The University of Seville, Seville, Spain.
http://catedrasempresa.esi.us.es/endesared/ingles/sem_Francisco_Gonzalez.php#

All
right
s re
serv
ed. N
o pa
rt o
f thi
s pu
blic
atio
n m
ay b
e re
prod
uced
or
dist
ribut
ed in
any
form
with
out p
erm
issi
on o
f the
aut
hor.
Cop
yrig
ht ©
201
7. h
ttp:w
ww
.fglo
ngat
t.org
Monterrey, Mexico, September 2017
Quality of Frequency Stability
75 mHz Criterion Summary - Short View - Year 2001-2011
Frequency quality behavior in Continental Europe during the last ten
years. Source: Swissgrid
It can clearly be observed how the
accumulated time continuously increases
with higher frequency deviations as well as
the number of corresponding events
@fglongatt
“Frequency Control Schemes and Frequency Response of Power
Systems considering the Integration of Wind Power”. The University
of Seville, Seville, Spain.

All
right
s re
serv
ed. N
o pa
rt o
f thi
s pu
blic
atio
n m
ay b
e re
prod
uced
or
dist
ribut
ed in
any
form
with
out p
erm
issi
on o
f the
aut
hor.
Cop
yrig
ht ©
201
7. h
ttp:w
ww
.fglo
ngat
t.org
Monterrey, Mexico, September 2017
Quality of Frequency Stability in GB
System Inertia (H) Changes for Gone Green Scenario at 70% Wind
Power Output

All
right
s re
serv
ed. N
o pa
rt o
f thi
s pu
blic
atio
n m
ay b
e re
prod
uced
or
dist
ribut
ed in
any
form
with
out p
erm
issi
on o
f the
aut
hor.
Cop
yrig
ht ©
201
7. h
ttp:w
ww
.fglo
ngat
t.org
Monterrey, Mexico, September 2017
Frequency Response
• All licensed generators in accordance with Grid Code mandatory
requirements generators offering enhanced commercial services
• Demand tripping by low frequency relay
• Unlicensed generators with a commercial agreement.
Who can provide it?
+
-

All
right
s re
serv
ed. N
o pa
rt o
f thi
s pu
blic
atio
n m
ay b
e re
prod
uced
or
dist
ribut
ed in
any
form
with
out p
erm
issi
on o
f the
aut
hor.
Cop
yrig
ht ©
201
7. h
ttp:w
ww
.fglo
ngat
t.org
Monterrey, Mexico, September 2017
Reduced Inertia in GB• The System Operability Framework (SOF) of the Great
Britain (GB) analysis indicates the system inertia (HT)
continues to decline because of the lack of synchronous
thermal power stations and high volume of converters
connected generation technologies such as solar PV, wind
power, and import across our High Voltage Direct Current
(HVDC) interconnectors.
Minimum system inertia
including the
contribution from
Embedded Generation
Gonzalez-Longatt, F. and S. M. Alhejaj
(2016). Enabling inertial response in
utility-scale battery energy storage
system. 2016 IEEE Innovative Smart
Grid Technologies - Asia (ISGT-Asia).
28 Nov.-1 Dec. 2016. DOI:
10.1109/ISGT-Asia.2016.7796453
@fglongatt

All
right
s re
serv
ed. N
o pa
rt o
f thi
s pu
blic
atio
n m
ay b
e re
prod
uced
or
dist
ribut
ed in
any
form
with
out p
erm
issi
on o
f the
aut
hor.
Cop
yrig
ht ©
201
7. h
ttp:w
ww
.fglo
ngat
t.org
Monterrey, Mexico, September 2017
New Technologies of Generation/Storage• A Simplified Model for Dynamic Behavior of Permanent Magnet
Synchronous Generator for Direct Drive Wind Turbines
Shaft
ModelmP
wP
Mechanical
power
Rotor
Speed
rRotor model
Model fo
direct drive
synchro-
usnous
generator
Pitch angle
controller
Rotor speed
controller
Terminal
voltage
controller
Wind
SpeedMechanical
Power
Rotor speed
Pitch
angle
Active power
set point
Reactive
power set
point
wv
turb
setP
setQ
acac QP ,Power
converter
Active and
reactive
power
sI
Stator
currents
Fundamental
frequency
grid model
acac QP ,
,sV f
Voltage
frequency
Active and
reactive
power
setP
x mK Idc
e mK +
-
,m mT +
-
Vdc
3
2 V
e
pKK
3
2 s
x
pLK
0 10 20 30 40 50
1.25
1.3
1.35
1.4
Time (s)
Ro
tor
Sp
eed
(p
.u)
Full model
Proposed model
0 10 20 30 40 500.4
0.5
0.6
0.7
0.8
0.9
1
Time (s)
Act
ive
Po
wer
(p
.u)
Full model
Proposed model
Contribution:
The development of a model of the PMSG that incorporates the control of the voltage regulation characteristic
and torque/load properties.
Generator-side
rectifier
Booster Grid-side
inverter
PMSG
N
N
NN
S
S
S
S
Grid
van
vbn
vcn
Cdc
iloadidcia
Ls+
-
Vdc
vab
+
-
ic
n
b
c
dc e m x m dcV K K I
GridIsUs
PMSG
ac/dc dc/ac
DC
link
Ir
UrN
N
NN
S
S
S
S
F. Gonzalez-Longatt, P. Wall, V. Terzija. “A Simplified Model for Dynamic Behaviour of Permanent Magnet Synchronous Generator for Direct Drive Wind Turbines”. IEEE
PowerTech 2011, Trondheim 19 - 23 Jun 2011. Trondheim Norway. (ISBN: 978-82-519-2808-3) (Available online DOI: 10.1109/PTC.2011.6019425)
All
right
s re
serv
ed. N
o pa
rt o
f thi
s pu
blic
atio
n m
ay b
e re
prod
uced
or
dist
ribut
ed in
any
form
with
out p
erm
issi
on o
f the
aut
hor.
Cop
yrig
ht ©
201
7. h
ttp:w
ww
.fglo
ngat
t.org
Monterrey, Mexico, September 2017
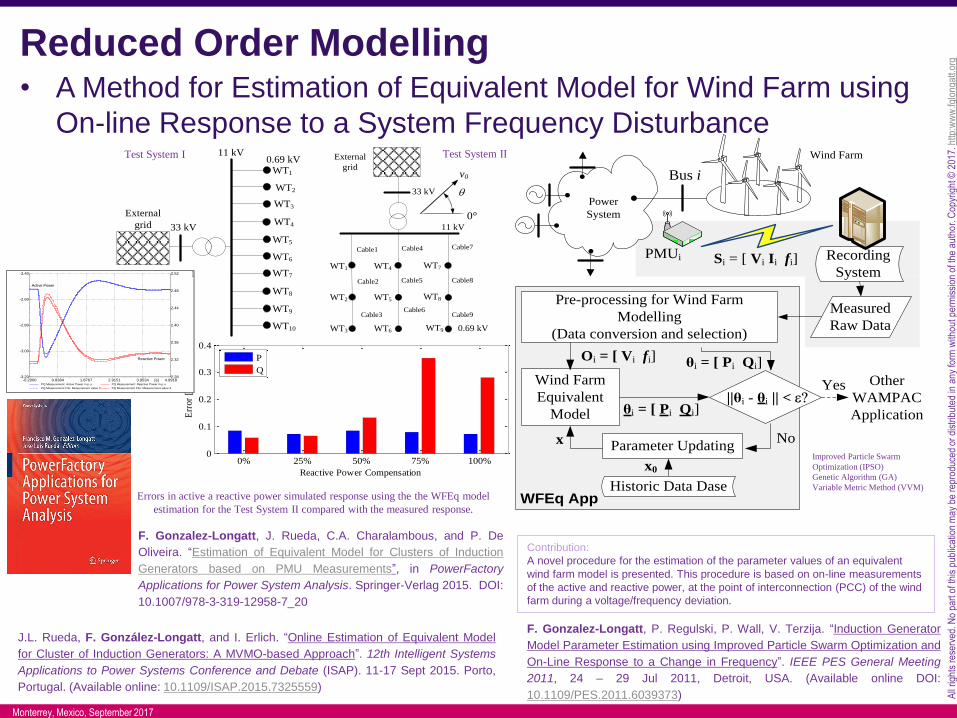
Reduced Order Modelling• A Method for Estimation of Equivalent Model for Wind Farm using
On-line Response to a System Frequency Disturbance
Power
System
PMUi Si = [ Vi Ii fi]
Bus i
Wind Farm
Recording
System
Pre-processing for Wind Farm
Modelling
(Data conversion and selection)
Wind Farm
Equivalent
Model
Oi = [ Vi fi] θi = [ Pi Qi]
θi = [ Pi Qi]||θi - θi || < e?
Parameter Updatingx
Historic Data Dase
x0
No
Yes
Measured
Raw Data
Other
WAMPAC
Application
WFEq App
Contribution:
A novel procedure for the estimation of the parameter values of an equivalent
wind farm model is presented. This procedure is based on on-line measurements
of the active and reactive power, at the point of interconnection (PCC) of the wind
farm during a voltage/frequency deviation.
0% 25% 50% 75% 100%0
0.1
0.2
0.3
0.4
Err
or
[%]
Reactive Power Compensation
P
Q
Errors in active a reactive power simulated response using the the WFEq model
estimation for the Test System II compared with the measured response.
WT10
0.69 kV11 kV
33 kV
External
grid
WT9
WT8
WT7
WT6
WT5
WT4
WT3
WT2
WT1
11 kV
33 kV
External
grid
Cable1
Cable2
Cable3
Cable4
Cable5
Cable6
Cable7
Cable8
Cable9
WT1
WT2
WT3 0.69 kV
WT4
WT5
WT6
WT7
WT8
WT9
v0
0°
4.99183.95342.91511.87670.8384-0.2000 [s]
-2.40
-2.60
-2.80
-3.00
-3.20
2.52
2.48
2.44
2.40
2.36
2.32
2.28
PQ Measurement: Active Power in p.u. PQ Measurement: Reactive Power in p.u.
PQ Measurement File: Measurement value 3PQ Measurement File: Measurement value 2
Active Power
Reactive Power
DIg
SIL
EN
T
Test System IITest System I
Improved Particle Swarm
Optimization (IPSO)
Genetic Algorithm (GA)
Variable Metric Method (VVM)
F. Gonzalez-Longatt, P. Regulski, P. Wall, V. Terzija. “Induction Generator
Model Parameter Estimation using Improved Particle Swarm Optimization and
On-Line Response to a Change in Frequency”. IEEE PES General Meeting
2011, 24 – 29 Jul 2011, Detroit, USA. (Available online DOI:
10.1109/PES.2011.6039373)
F. Gonzalez-Longatt, J. Rueda, C.A. Charalambous, and P. De
Oliveira. “Estimation of Equivalent Model for Clusters of Induction
Generators based on PMU Measurements”, in PowerFactory
Applications for Power System Analysis. Springer-Verlag 2015. DOI:
10.1007/978-3-319-12958-7_20
J.L. Rueda, F. González-Longatt, and I. Erlich. “Online Estimation of Equivalent Model
for Cluster of Induction Generators: A MVMO-based Approach”. 12th Intelligent Systems
Applications to Power Systems Conference and Debate (ISAP). 11-17 Sept 2015. Porto,
Portugal. (Available online: 10.1109/ISAP.2015.7325559)

All
right
s re
serv
ed. N
o pa
rt o
f thi
s pu
blic
atio
n m
ay b
e re
prod
uced
or
dist
ribut
ed in
any
form
with
out p
erm
issi
on o
f the
aut
hor.
Cop
yrig
ht ©
201
7. h
ttp:w
ww
.fglo
ngat
t.org
Monterrey, Mexico, September 2017
Releasing Inertia from Wind Turbines• Impact of Synthetic Inertia from Wind Power on The
Protection/Control Schemes of Future Power Systems.
Controller
Wind
External
turb set
P
meas
d
dtFiltersys 2H
measP ,r ref
,r meas
rPI
MPPTPConterter
“Hidden” inertia emulation
2sys
in sys
dP H
dt
r
P
MPPT
21
2
sm
base
JH
S
refP
0 5-15Time (s)
Fre
quen
cy (
Hz)
Phase 3
30
50.0
49.8
49.6
49.4
49.2
49.0
48.8
Without “Hidden Inertia”With “Hidden Inertia”
Phase 2
Phase 1
F. Gonzalez-Longatt, “Activation Schemes of Synthetic Inertia Controller on Full Converter Wind
Turbine (Type 4)”. IEEE PES General Meeting 2015. 26-30 Jul 2015. Denver, USA (Available
online DOI: 10.1109/PESGM.2015.7286430)
F. Gonzalez-Longatt, E. Chikuni, E. Rashayi.
“Effects of the Synthetic Inertia from wind power on
the total system inertia after a frequency
disturbance”. 2013 IEEE International Conference
on Industrial Technology (ICIT). 25-27 Feb 2013.
Cape Town, South Africa. (Available online DOI:
10.1109/ICIT.2013.6505779)

All
right
s re
serv
ed. N
o pa
rt o
f thi
s pu
blic
atio
n m
ay b
e re
prod
uced
or
dist
ribut
ed in
any
form
with
out p
erm
issi
on o
f the
aut
hor.
Cop
yrig
ht ©
201
7. h
ttp:w
ww
.fglo
ngat
t.org
Monterrey, Mexico, September 2017
Effect of Synthetic Inertia
Contribution:
The main contribution of this paper is to demonstrate (based on simulations) recovery period of
under-frequency transient on future power systems that integrate synthetic inertia capability not
completely avoid worse scenarios in terms of UFLS.
0
1
2
3
4
5
6
7
8
0.1 1 2.5 5 10To
tal
Sy
stem
In
erti
a H
T (
s)
Synthetic Inertia Hsyn (s)
III
III
IV
20%
10%
5%
2.5%
1%
0
5
10
15
Case
Load Shedding Case
Po
wer
(G
W)
III
III
IV
20%
10%
5%
2.5%
1%
0
5
10
15
Case
Load Shedding Case
Po
wer
(G
W)
III
III
IV
20%
10%
5%
2.5%
1%
0
5
10
15
Case
Load Shedding Case
Po
wer
(G
W)
III
III
IV
20%
10%
5%
2.5%
1%
0
5
10
15
Case
Load Shedding Case
Po
wer
(G
W)
III
III
IV
20%
10%
5%
2.5%
1%
0
5
10
15
Case
Load Shedding Case
Po
wer
(G
W)
III
III
IV
20%
10%
5%
2.5%
1%
0
5
10
15
Case
Load Shedding Case
Po
wer
(G
W)
(a) Base Case (b) Hsyn = 0.1s
(c) Hsyn = 1.0s (d) Hsyn = 2.5s
(e) Hsyn = 5s (f) Hsyn = 10s
fglongatt.org.
PowerFactory 14.0.525
Benchmark System
Francisco M. Gonzalez-Longatt 02/01/2012
Project: DPSP 2012
Graphic: Benchmark Model
Date: 2/13/2012
Annex:
Load Flow Balanced
Nodes
Line-Line Voltage, Magnitude [kV]
Voltage, Magnitude [p.u.]
Voltage, Angle [deg]
Branches
Active Power [GW]
Reactive Power [Gvar]
Loading [%]
Tail-Right
Core+Tail
MiddleLowest-Tail
Upper-Tail
TAIL
Upper Top
TOP
Top-Left Top-Rigth
2400.001.0018.52
1
395.400.9910.24
1a400.001.0015.81
6400.001.00-9.12
7400.001.00-4.01
5400.001.00-8.90
3400.001.000.00
4400.001.005.61
G~
G4(b)
7.206.7732.94
G~G2
9.50-5.4536.52
1a-2
II
-4.622.9510.54
4.75-2.7310.54
1a-2
I
-4.622.9510.54
4.75-2.7310.54
1a-1 I
10.44-4.1421.62
-9.885.0821.62
1a-1 II
10.44-4.1421.62
-9.885.0821.62
G~
G1
22.80-0.1376.00
L1
4.951.01
1-3
1-4 14.80-11.1636.09
-14.0112.4636.09
L1a
11.152.26
5-6
0.38-0.230.85
-0.380.230.85
5-7
8.65-4.7418.98
-8.215.4618.98
4-7
17.34-8.6137.26
-15.6611.3837.26
6-7
9.04-4.9419.83
-8.575.7219.83
3-7
7.06-3.9415.55
-6.764.4315.55
L7
16.143.28
3-4
9.94-5.3721.74
-9.376.3221.74
L6
26.055.29
G~G6
17.1111.2468.23
G~G7
11.409.4049.27
G~G5
9.518.7643.08
G~G3
8.644.6032.61
G~
G4(a)
20.20-5.4169.71
L5
17.343.52
L3
10.952.22
L4
14.132.87
DIg
SIL
EN
T
Gen LossWF30GW
F. Gonzalez-Longatt. “Impact of emulated inertia from wind power on under-
frequency protection schemes of future power systems”. Journal of Modern Power
Systems and Clean Energy: Vol. 1, No. 8. DOI: 10.1007/s40565-015-0143-x)

All
right
s re
serv
ed. N
o pa
rt o
f thi
s pu
blic
atio
n m
ay b
e re
prod
uced
or
dist
ribut
ed in
any
form
with
out p
erm
issi
on o
f the
aut
hor.
Cop
yrig
ht ©
201
7. h
ttp:w
ww
.fglo
ngat
t.org
Monterrey, Mexico, September 2017
BESS in GB• The current status (June 2016) of
the electricity energy storage systems in GB is oriented to the utility-scale sector.
• The residential-scale storage is still not economically viable, and the level of commercial and industrial storage, although unknown, is thought to be quite low.
• GB has around 30 operational battery energy storage (BES) projects, many of them are demonstration projects, and with only a few of them are operational projects larger than 1 MW in size.
30 Projects
3255 MW
Gonzalez-Longatt, F. and S. M. Alhejaj (2016). Enabling inertial response in utility-
scale battery energy storage system. 2016 IEEE Innovative Smart Grid
Technologies - Asia (ISGT-Asia). 28 Nov.-1 Dec. 2016. DOI: 10.1109/ISGT-
Asia.2016.7796453
@fglongatt

All
right
s re
serv
ed. N
o pa
rt o
f thi
s pu
blic
atio
n m
ay b
e re
prod
uced
or
dist
ribut
ed in
any
form
with
out p
erm
issi
on o
f the
aut
hor.
Cop
yrig
ht ©
201
7. h
ttp:w
ww
.fglo
ngat
t.org
Monterrey, Mexico, September 2017
Storage in GB Dinorwig Power Station
The Smarter Network Storage (SNS) project aims to carry
out a range of technical and commercial innovation to tackle
the challenges associated with the low-carbon transition and
facilitate the economic adoption of storage. It is differentiated
from other LCNF electrical storage projects by its
demonstration of storage across multiple parts of the electricity
system, outside the boundaries of the distribution network. By
demonstrating this multi-purpose application of 6MW/10MWh
of energy storage at Leighton Buzzard primary substation, the
project will explore the capabilities and value in alternative
revenue streams for storage, whilst deferring traditional
network
Gonzalez-Longatt, F. and S. M. Alhejaj (2016). Enabling inertial response in utility-
scale battery energy storage system. 2016 IEEE Innovative Smart Grid
Technologies - Asia (ISGT-Asia). 28 Nov.-1 Dec. 2016. DOI: 10.1109/ISGT-
Asia.2016.7796453

All
right
s re
serv
ed. N
o pa
rt o
f thi
s pu
blic
atio
n m
ay b
e re
prod
uced
or
dist
ribut
ed in
any
form
with
out p
erm
issi
on o
f the
aut
hor.
Cop
yrig
ht ©
201
7. h
ttp:w
ww
.fglo
ngat
t.org
Monterrey, Mexico, September 2017
Storage in GB• Preliminary analysis in UK suggest an additional storage
could be installed in the range of 1GW - 29GW under certainfuture scenarios by 2050, of which distribution storage isestimated to dominate bulk storage, due to the savings fromavoided distribution network costs.
• The largest BES project to date (May 2016) is KilrootAdvancion® Energy Storage Array.
• This 10 MW installation is led by AES UK & Ireland and located adjacent to coal-fired Kilroot Power Station, located north of Belfast, Northern Ireland.
• The array utilizes over 53,000 Li-ion batteries arranged in 136 separate nodes and will enhance grid reliability by providing fast response ancillary services (such as frequency regulation) as part of the System Operator Northern Ireland (SONI) existing Harmonised Ancillary Services systemGonzalez-Longatt, F. and S. M. Alhejaj (2016). Enabling inertial response in utility-scale battery energy storage system. 2016
IEEE Innovative Smart Grid Technologies - Asia (ISGT-Asia). 28 Nov.-1 Dec. 2016. DOI: 10.1109/ISGT-Asia.2016.7796453

All
right
s re
serv
ed. N
o pa
rt o
f thi
s pu
blic
atio
n m
ay b
e re
prod
uced
or
dist
ribut
ed in
any
form
with
out p
erm
issi
on o
f the
aut
hor.
Cop
yrig
ht ©
201
7. h
ttp:w
ww
.fglo
ngat
t.org
Monterrey, Mexico, September 2017
Enabling Synthetic Inertia in BESS
Charge
controler
Current
controller
PQ
controllers
Frequency
controller
Battery
Model
dm q
m
dcU
dcI
SOC
*
acP
,acV f
,acP i
acP
acV
f
*
,d pi *
,q qi
*
,d si *
,q si
di
qi
f
d
dt
df
dt*
acP2
synH
9.99337.97475.95603.93731.9187-0.1000 [s]
20.00
15.00
10.00
5.00
0.00
-5.00
Converter: Active Power/Terminal AC in MW
2.763 s-1.074 MW
0.223 s17.025 MW
9.893 s-0.003 MW
9.99337.97475.95603.93731.9187-0.1000 [s]
50.10
50.00
49.90
49.80
49.70
49.60
G1: Frequency in Hz
2.063 s49.663 p.u.
9.883 s49.689 p.u.
9.99337.97475.95603.93731.9187-0.1000 [s]
0.82
0.80
0.78
0.76
0.74
0.72
SimpleBattery: SOC
1.993 s 0.731
9.823 s 0.737
-0.073 s 0.800
DIg
SIL
EN
T
S.M Alhejaj, and F. Gonzalez-Longatt (2016). Investigation on grid-scale BESS providing Inertial Response Support. IEEE PES POWERCON 2016. Wollongong Australia. 28
Sept.-1 Oct. 2016 DOI: 10.1109/POWERCON.2016.7754049
S.M. Alhejaj, S. M. and F. M. Gonzalez-Longatt (2016). Impact of inertia emulation control of grid-scale BESS on power system frequency response. 2016 International
Conference for Students on Applied Engineering (ICSAE). DOI: 10.1109/ICSAE.2016.7810198
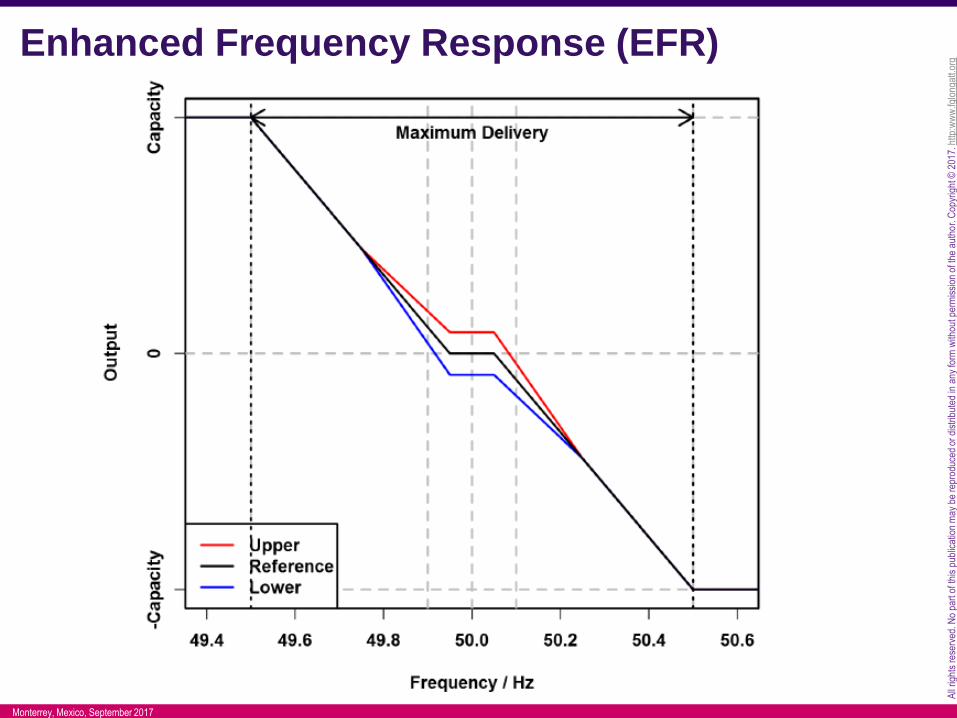
All
right
s re
serv
ed. N
o pa
rt o
f thi
s pu
blic
atio
n m
ay b
e re
prod
uced
or
dist
ribut
ed in
any
form
with
out p
erm
issi
on o
f the
aut
hor.
Cop
yrig
ht ©
201
7. h
ttp:w
ww
.fglo
ngat
t.org
Monterrey, Mexico, September 2017
Enhanced Frequency Response (EFR)

All
right
s re
serv
ed. N
o pa
rt o
f thi
s pu
blic
atio
n m
ay b
e re
prod
uced
or
dist
ribut
ed in
any
form
with
out p
erm
issi
on o
f the
aut
hor.
Cop
yrig
ht ©
201
7. h
ttp:w
ww
.fglo
ngat
t.org
Monterrey, Mexico, September 2017
EV to the Grid: Providing EFR
@fglongatt

All
right
s re
serv
ed. N
o pa
rt o
f thi
s pu
blic
atio
n m
ay b
e re
prod
uced
or
dist
ribut
ed in
any
form
with
out p
erm
issi
on o
f the
aut
hor.
Cop
yrig
ht ©
201
7. h
ttp:w
ww
.fglo
ngat
t.org
Monterrey, Mexico, September 2017
Declining Short Circuit Levels in the UKAs the short circuit level decreases, the
size of the area affected by a voltage dip
will increase.
The effects of transmission voltage dips
are not only observable across the
transmission network, but are also
observable on distribution networks in the
vicinity of the fault (the effects are “3-
dimensional”).
The critical role that reactive
current injection plays in the
response of the network to a
voltage depression.
http://www2.nationalgrid.com/UK/Industry-information/Future-of-Energy/System-Operability-Framework/

All
right
s re
serv
ed. N
o pa
rt o
f thi
s pu
blic
atio
n m
ay b
e re
prod
uced
or
dist
ribut
ed in
any
form
with
out p
erm
issi
on o
f the
aut
hor.
Cop
yrig
ht ©
201
7. h
ttp:w
ww
.fglo
ngat
t.org
Monterrey, Mexico, September 2017
Research Excellence
• The author with most reading in my institution couple times during 2016 and
also the author with most reading in my department for several weeks [data
are taken from Research Gate].
Member Advisory
Editorial Board
http://www.journals.elsevier.com/international-journal-of-
electrical-power-and-energy-systems/editorial-board

All
right
s re
serv
ed. N
o pa
rt o
f thi
s pu
blic
atio
n m
ay b
e re
prod
uced
or
dist
ribut
ed in
any
form
with
out p
erm
issi
on o
f the
aut
hor.
Cop
yrig
ht ©
201
7. h
ttp:w
ww
.fglo
ngat
t.org
Monterrey, Mexico, September 2017
Closing…
or Opening?

All
right
s re
serv
ed. N
o pa
rt o
f thi
s pu
blic
atio
n m
ay b
e re
prod
uced
or
dist
ribut
ed in
any
form
with
out p
erm
issi
on o
f the
aut
hor.
Cop
yrig
ht ©
201
7. h
ttp:w
ww
.fglo
ngat
t.org
Monterrey, Mexico, September 2017
Questions and Answers
Dr Francisco Gonzalez-Longatt
Copyright Notice
The documents are created by Francisco M. Gonzalez-Longatt and contain copyrighted material, trademarks, and other proprietary information. All rights reserved. No part of the documents may be reproduced or
copied in any form or by any means - such as graphic, electronic, or mechanical, including photocopying, taping, or information storage and retrieval systems without the prior written permission of Francisco M.
Gonzalez-Longatt . The use of these documents by you, or anyone else authorized by you, is prohibited unless specifically permitted by Francisco M. Gonzalez-Longatt. You may not alter or remove any
trademark, copyright or other notice from the documents. The documents are provided “as is” and Francisco M. Gonzalez-Longatt shall not have any responsibility or liability whatsoever for the results of use of the
documents by you.
Thank you!