Chaitanya India Fin Credit Private Limitedchaitanyaindia.in/docs/SMERA Grading Rating - M2 valid to...
29
SMERA MFI Grading Chaitanya India Fin Credit Private Limited Date of Report: 21 st January, 2017 Valid Till: 20th January, 2018 SMERA MFI Grading M2 (High capacity of the MFI to manage its operations in a sustainable manner)
Transcript of Chaitanya India Fin Credit Private Limitedchaitanyaindia.in/docs/SMERA Grading Rating - M2 valid to...

SMERA MFI Grading
Chaitanya India Fin Credit Private Limited
Date of Report:
21st January, 2017
Valid Till:
20th January, 2018
SMERA MFI
Grading
M2
(High capacity of
the MFI to
manage its
operations in a
sustainable
manner)

Conflict of Interest Declaration
The Rating Agency (including its holding company and wholly owned subsidiaries) has not been involved in any assignment of advisory nature for a period of 12 months preceding the date of the comprehensive grading. None of the employees or the Board members of the Rating agency have been a member of the Board of Directors of the MFI during for a period of 12 months preceding the date of the comprehensive grading.
Disclaimer
This Grading is based on the data and information (Data) provided by the MFI and obtained by SMERA from sources it considers reliable. Although reasonable care has been taken to verify the Data, SMERA, makes no representation or warranty, expressed or implied with respect to the accuracy, adequacy or completeness of any Data relied upon. SMERA is not responsible for any errors or omissions or for the results obtained from the use of the Grading or the Grading Report and especially states that it has no financial liability, whatsoever, for any direct, indirect or consequential loss of any kind arising from the use of its Gradings. A SMERA Grading does not constitute an audit of the graded entity and should not be treated as a recommendation or opinion or a substitute for investor's independent assessment of whether to buy, sell or hold any security. The SMERA Grading Report should not be distributed/ published/ reproduced in any form without SMERA’s prior written approval.
TABLE OF CONTENTS
SMERA’s MFI Grading Scale .................................................................................................................... 3
Company Profile ...................................................................................................................................... 4
Compliance with RBI’s Directives .......................................................................................................... 11
Grading Rationale ................................................................................................................................. 13
Graphs ................................................................................................................................................... 19
Financials ............................................................................................................................................... 21
Financial Ratios ..................................................................................................................................... 24
Grading Methodology ........................................................................................................................... 25

3
Grading Scale Definitions
M1 MFIs with this grade are considered to have highest capacity to manage their microfinance operations in a sustainable manner.
M2 MFIs with this grade are considered to have high capacity to manage their microfinance operations in a sustainable manner.
M3 MFIs with this grade are considered to have above average capacity to manage their microfinance operations in a sustainable manner.
M4 MFIs with this grade are considered to have average capacity to manage their microfinance operations in a sustainable manner
M5 MFIs with this grade are considered to have inadequate capacity to manage their microfinance operations in a sustainable manner.
M6 MFIs with this grade are considered to have low capacity to manage their microfinance operations in a sustainable manner.
M7 MFIs with this grade are considered to have very low capacity to manage their microfinance operations in a sustainable manner.
M8 MFIs with this grade are considered to have lowest capacity to manage their microfinance operations in a sustainable manner.
The MFI obtains comprehensive MFI grading of “M2”. It signifies high capacity of the MFI to
manage its operations in a sustainable manner.
SMERA’s MFI Grading Scale

4
Name of the MFI Chaitanya India Fin Credit Private Limited
Year of Commencement of
Operations 2007
Legal Status Non-Banking Finance Company (NBFC)
Business of the Company Engaged in business of microfinance under JLG model
Correspondence address
#98, 3rd Floor, Sirsi Circle
Near Nalanda Theater, Chamarajpet
Bangalore - 560 018
Karnataka
India
Geographical Reach
(As on 31/Dec/2016)
No of States : 02
No of Branches : 110
Total Employees
(As on 31/Dec/2016) 1136
Active Borrowers (As on
31/Dec/2016) 183,444
Total Portfolio Outstanding (in
crores) (As on 31/Dec/2016) 245.93
Operational Head Mr. Samit Shetty, Executive Director
Email ID: [email protected]
Statutory Auditor & Address
M/s Ramesh Ashwin & Karanth
Premier Presidency, #35/17,
1 st Floor, Langford Road,
Opp. St. Joseph College,
Bangalore – 560025
Tel: 080 – 41464630
Company Profile

5
Background
Chaitanya commenced its microfinance operations in October 2007 at Nayakanahatti village in
Chitradurga district for two years at NGO. Later in 2009 ) to carry out the business of financial
services in a sustainable manner with appropriate legal status the promoters of Chaitanya obtained
a Non Banking Finance Company (NBFC) license from Reserve Bank of India for a newly registered
company, Chaitanya India Fin Credit Pvt. Ltd. (Chaitanya).
Chaitanya provides loans to joint liability group who comes together for the purpose of availing
bank loan on individual basis or through group mechanism against mutual guarantee. Chaitanya
offers loans in the range of Rs.15,000 to Rs.75, 000 depending on client repayment capacity, type of
activity etc with tenure varying from 12 months to 24 months at an effective interest rate of 25%
(on a reducing balance). The NBFC-MFI also offers various non-JLG products like Gold Loans and
Two wheeler loans, which has a relatively lower share in the portfolio.
During nine month ended FY2017 (9MFY2017), Chaitanya reported a net profit of Rs 1.73 crore
(Provisional) and total income of Rs.32.06 crore (Provisional, including Securitization income) on a
asset base of Rs 284.64 crore (Provisional).
Shareholder’s –Equity Shares as on 30/Sep/2016
Name of Proprietor/ Partner / Shareholders Shares Shares in %
Chaitanya Rural Intermediation Development Services Pvt. Ltd.
18,291,566 100.00
Mr Anand Rao (Nominee Holder)
01 -
Total 18,291,567 100.00

6
Highlights of Microfinance Operations
Particulars 31-03-14 31-03-15 31-03-16 30-09-16 31-12-16
No. of states 1 1 2 2 2
No. of districts 10 15 21 23 22
No. of branches 29 47 83 100 110
No. of sub-groups 8,864 14,117 27,111 40,162 38,161
No. of centers 4,334 7,082 13,672 20,978 19,862
No. of total members (Registered)
69,711 74,306 135,860 181,644 183,444
No. of active borrowers 44,074 69,995 130,688 174,016 183,444
No. of active loans 46,329 74,306 135,860 181,644 193,551
No. of loans disbursed during the period
48,206 78,114 137,582 102,734 139,874
No. of total employees 237 414 785 972 1136
No. of field staff (Cos) 136 252 472 601 756
Loan disbursements during the period (Rs in thousands) 852,918 1,452,074 2,905,463 2,443,563 3,268,598
Net Loan portfolio outstanding 564,764 898,511 1,878,874 2,395,315 2,459,325
(Rs in thousands)
Loan amount outstanding per active loan (In Rs)
12,190 12,092 13,829 13,187 12,706
Active borrowers per field staff 324 278 277 290 243
Average Ticket Size (in Rs.) 17,693 18,589 21,118 23,785 23,368
Observations
As on Dec 2016, the company had an outstanding portfolio of Rs. 245.93 crores spread over 110
branches of 22 districts with about 183,444 borrowers. Further Chaitanya’s Assets under
Management (AUM) in FY 2016 witnessed robust growth of 109% over FY15 (59% growth seen in
FY2015).
In FY 2016, The Company expanded its borrower base by adding 36 new branches in its branch
network over FY2016 and 27 new branches in current financial year till date.(Dec 31,2016)
The disbursement almost doubled in FY 2016 compared to the previous year on account of good
funding from banks and financial institutions. Further company also raised funds through
securitization channel.
With Portfolio concentration in Karnataka and Maharashtra at ~ 98 per cent and ~ 02 per cent,
respectively (as on Dec 31, 2016), the company remains exposed to geographical concentration
risk. However as informed by the management, the company is planning to reduced concentration
in Karnataka and come with branches in Bihar to reduce the risk to certain extent

7
Product Profile
Product Description Loan size (Rs)
Repayment ( in
Months)
Interest Rate
(In %) Reducing Balance
Processing Fees (In %)
Insurance (In %)
JLG Loan
Livestock, vegetable vending,
family enterprises, artisans etc
5,000 to 90,000
12 months to 24
months 25.00 1.00 1.20
Vehicle Loan Purchase of
Vehicle
15,000 to
50,000
12 months to 24
months 25.00 1.00 1.20
Housing/Mortgage Housing
Loan
100,000 to
250,000
12 months to 48
months 22.00 1.00 1.20
Gold Loan Pledge of
Gold 2,000 to 100,000
12 months 25.00 1.00 1.20
8
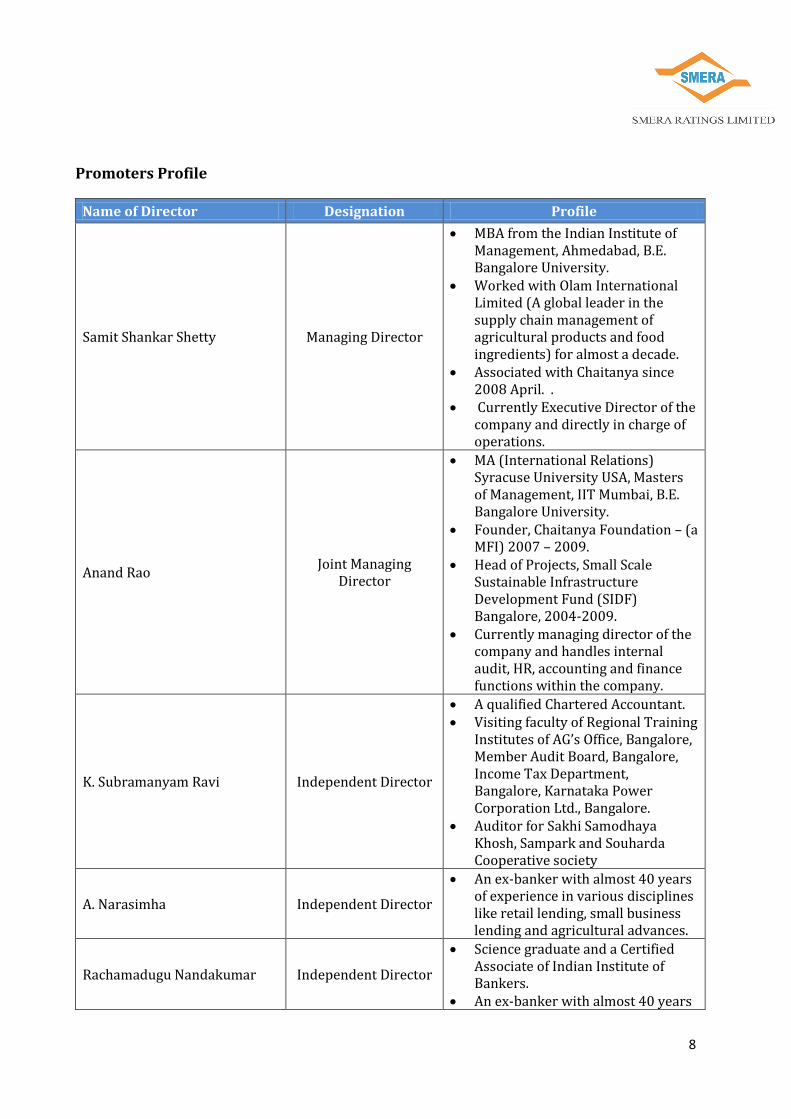
Promoters Profile
Name of Director Designation Profile
Samit Shankar Shetty Managing Director
MBA from the Indian Institute of Management, Ahmedabad, B.E. Bangalore University.
Worked with Olam International Limited (A global leader in the supply chain management of agricultural products and food ingredients) for almost a decade.
Associated with Chaitanya since 2008 April. .
Currently Executive Director of the company and directly in charge of operations.
Anand Rao Joint Managing
Director
MA (International Relations) Syracuse University USA, Masters of Management, IIT Mumbai, B.E. Bangalore University.
Founder, Chaitanya Foundation – (a MFI) 2007 – 2009.
Head of Projects, Small Scale Sustainable Infrastructure Development Fund (SIDF) Bangalore, 2004-2009.
Currently managing director of the company and handles internal audit, HR, accounting and finance functions within the company.
K. Subramanyam Ravi Independent Director
A qualified Chartered Accountant. Visiting faculty of Regional Training
Institutes of AG’s Office, Bangalore, Member Audit Board, Bangalore, Income Tax Department, Bangalore, Karnataka Power Corporation Ltd., Bangalore.
Auditor for Sakhi Samodhaya Khosh, Sampark and Souharda Cooperative society
A. Narasimha Independent Director
An ex-banker with almost 40 years of experience in various disciplines like retail lending, small business lending and agricultural advances.
Rachamadugu Nandakumar Independent Director
Science graduate and a Certified Associate of Indian Institute of Bankers.
An ex-banker with almost 40 years

9
of experience in various disciplines like Credit, Administration, General Banking, Audit, Finance and HR.
Chief Executive Officer of EMMVEE GROUP of companies.
Ramesh Sundaresan Nominee Director
Graduate from NIT Trichy and Post Graduate from Indian Institute of Management Lucknow.
Managing Director of Invenio, a subsidiary of Singapore based multinational Olam International Limited
Davis Frederick Golding Nominee Director
Investor’s nominee Director at Chaitanya.
Graduate from Duke University 1981 He is the Director of Equator Capital Partners based in USA which is engaged in providing fund management services.
Observations
CHAITANYA has seven-member board as on Sept-2016 having extensive experience in the
banking and finance segment. The board has two promoter directors, two nominee directors
(representatives from Investors) and three independent directors with banking &
finance/Microfinance expertise.
The board meets on a quarterly basis and if required frequency of the meeting increases. Board
is actively involved in strategy formulation, developing & approving business plans, fund
mobilization. Board meetings also cover the overall performance, recruitment, updating policy,
to ensure the use of resources, approve annual work plan and budgets, implement programmes
that are in line with the mission and vision, monitor MFI’s performance and review monthly
reports. The management team updates the board regularly on operations and key
developments in each department.

10
Senior Management Profile
Name Designation
Vasudeva S.B Financial Controller
Srinivasan C V Chief Financial Officer
Ganesh K V Head - Operations
Ganesh K V President Operations
Rakesh Mattar Accounts & MIS Manager
Guruswamy S M Audit Manager
Dimple J Shah Company Secretary
Jignesh J Balani IT Manager
Shreepad Mohan Vaze HR Manager
Jeyaseelan L Divisional Manager
Vinayak S. Patil Divisional Manager
Nagaraj C Divisional Manager

11
RBI’s Direction CHAITANYA Status Compliance 85% of total assets to be in the nature of
qualifying assets
Qualifying assets forms 91.29% of
total assets as on 31/Dec/2016 Complied
Net worth to be in excess of Rs 5 Crore Net Owned Funds stood at Rs
48.31 cr as on 31/Dec/2016 Complied
Income of borrower not to exceed Rs
100,000 in the rural areas and Rs
160,000 in the urban and semi-urban
areas*
CHAITANYA extends loans to
households whose income does
not exceed Rs 100,000 in rural and
Rs 160,000 in urban areas
Complied
Loans size not to exceed Rs 60,000 in
first cycle and Rs 100,000 in subsequent
cycles*
CHAITANYA offers loan in the
range of Rs 5000 to Rs 90,000
depending on client repayment
capacity, type of activity etc
Complied
Total indebtedness of the borrower not
to exceed Rs 100,000 (excl medical and
education loans)*
Apart from taking declaration
from the client, CHAITANYA
conducts credit check on the loans
outstanding through credit
bureaus
Complied
Tenure of loans not to be less than 24
months for loan amount in excess of Rs
30,000, with prepayment without
penalty*
CHAITANYA offers loans of Rs
15,000 for a tenure of 12 months
and loans of Rs 20,000 to Rs
30,000 for a period of 18 months
and loans above Rs 30,000 for 24
months
Complied
Pricing guidelines are to be followed
Loans are provided in range of
22% to 25.00% reducing balance
basis which meets the RBI criteria. Complied
Transparency in interest rates to be
maintained
Interest, Processing fees and
insurance premium charged are
duly mentioned in the loan card
provided to the client
Complied
Not more than two MFIs lend to the
same client
CHAITANYA verifies the same
though credit check from credit
bureaus
Complied
Compliance with RBI’s Directives

12
RBI’s Direction CHAITANYA Status Compliance
Loan pricing to include processing fee
(not exceeding 1% of the loan amount)
CHAITANYA is charging
processing fee of 1.00% on the
disbursed loan amount plus
applicable service tax
Complied
Collateral free loans
CHAITANYA does not accept
any
Collateral for extending the credit. Complied
MFIs shall not collect any Security
Deposit / Margin from the borrower.
CHAITANYA does not collect any
security deposit / margin from the
borrower.
Complied
No late payment or prepayment
penalties
CHAITANYA does not take late
payment or prepayment penalties
from the clients. Complied
Share complete client data with at least
one Credit Information Company (CIC)
established under the CIC Regulation
Act 2005, as per the frequency of data
submission prescribed by the CIC.
CHAITANYA shares its client data
with Crif Highmark, Equifax,
Xperian and CIBIL.
Complied
Aggregate amount of loans, given for
income generation, is not less than 50
per cent of the total loans given by the
MFIs
CHAITANYA provides 91.29% of
total loans for income generation
activities. Complied
NBFC-MFIs shall maintain a capital
adequacy ratio consisting of Tier I and
Tier II Capital which shall not be less
than 15 percent of its aggregate risk
weighted assets.
As per provisionals CRAR of
CHAITANYA stood at 27.3 % as of
31st Dec 2016 which complies
with the minimum CRAR
requirement of 15% for NBFC-
MFIs as prescribed by RBI.
CHAITANYA does not have any
exposure in Andhra Pradesh.
Complied
The aggregate loan provision to be
maintained by NBFC-MFIs at any point
of time shall not be less than the higher
of a) 1% of the outstanding loan
portfolio or b)
50% of the aggregate loan instalments
which are overdue for more than 90
days and less than 180 days and 100%
of the aggregate loan instalments
which are overdue for 180 days or
more’.
The statutory auditor has certified
the appropriate provisions have
been made Complied

13
Operating Environment
SMERA estimates the MFI sector to grow at a CAGR of 20%-25% and is expected to touch
Rs.100000 crore by the end of FY2019.
MFIs have reported an increase of ~58% in average loan per borrower in FY2016 as compared
to FY2014. SMERA believes seasoned customer profile over multiple loan cycles have helped
MFIs to increase its loan ticket size.
The fund flow to the sector has improved on account of increased confidence on MFI sector
coupled with reduction in interest rate (100-150 bps). Further large MFIs are exploring the
route of Non-convertible debentures (NCDs) and Pass through Certificates (PTCs); whereas
small –mid size MFIs have an increased access to funds from banks and financial institutions
SMERA expects licensing of small finance banks to MFIs to fuel competition for deposits and
bring innovative banking solutions to customers
Support systems such as Self Regulatory Organisations (SRO), Credit Information Bureaus (CIB)
among others have been established to ensure credit check and process adherence among
MFIs. This regulatory framework will bring more accountability and transparency within the
sector.
Despite all developments in the sector the inherent risk exist such as unsecured nature of
lending, vulnerable customer profile, exposure to vagaries of political situation in states, and
cash handling (though which is expected to reduce with demonetization step taken by
Government), and so on.
On the contrary, SMERA believes recent demonetization drive to restrain MFIs disbursement
and collection process which is expected to put pressure on MFIs liquidity in the short term (3-
6 months). Having said that the large MFIs with adequate reserves and liquidity to sustain the
short term problem.
Grading Rationale

14
Reasonable track record of operations and extensive industry experience of promoters
Chaitanya commenced its microfinance operations in October 2007 at Nayakanahatti village in
Chitradurga district for two years at NGO. Later in 2009 ) to carry out the business of financial
services in a sustainable manner with appropriate legal status the promoters of Chaitanya
obtained a Non Banking Finance Company (NBFC) license from Reserve Bank of India for a
newly registered company, Chaitanya India Fin Credit Pvt. Ltd. (Chaitanya).
Chaitanya has seven-member board as on Sept-2016 having extensive experience in the
banking and finance segment. The board has two promoter directors, two nominee directors
(representatives from Investors) and three independent directors with banking &
finance/Microfinance expertise. The board meets on a quarterly basis and if required frequency
of the meeting increases. Among the board members, Mr. Anand Rao and Mr. Samit Shetty are
takes strategic decisions and are actively involved in the day-to-day business operations.
Mr. Anand Rao with strong understanding of local business and social environment in
Karnataka has been involved with an NGO for over 5 years before setting up the NBFC-MFI
along with Mr. Samit Shetty who worked with Olam International Limited (A global leader in
the supply chain management of agricultural products and food ingredients) for almost a
decade.
Diversified resource profile
As on Dec 31,2016 CHAITANYA has developed funding relationships with a large number of
lenders i.e 39 lenders (including 10 PSU banks) however their resources profile continues to
remain concentrated towards borrowings from NBFCs which stood at ~ 68% of total
borrowings. The borrowings from IFMR Capital accounts for ~ 14.41% of the total borrowings
(outstanding debt) as on Dec 31, 2016.
The cost of funds (COF) for CHAITANYA is relatively higher at 15.79% in FY 2016 on account of
increase in borrowings from NBFCs. While these relationships with NBFCs have helped
Chaitanya in meeting its funding requirements to meet the projected growth, however the
company would have to increase its funding mix from banks to bring down the cost of
borrowing.
15
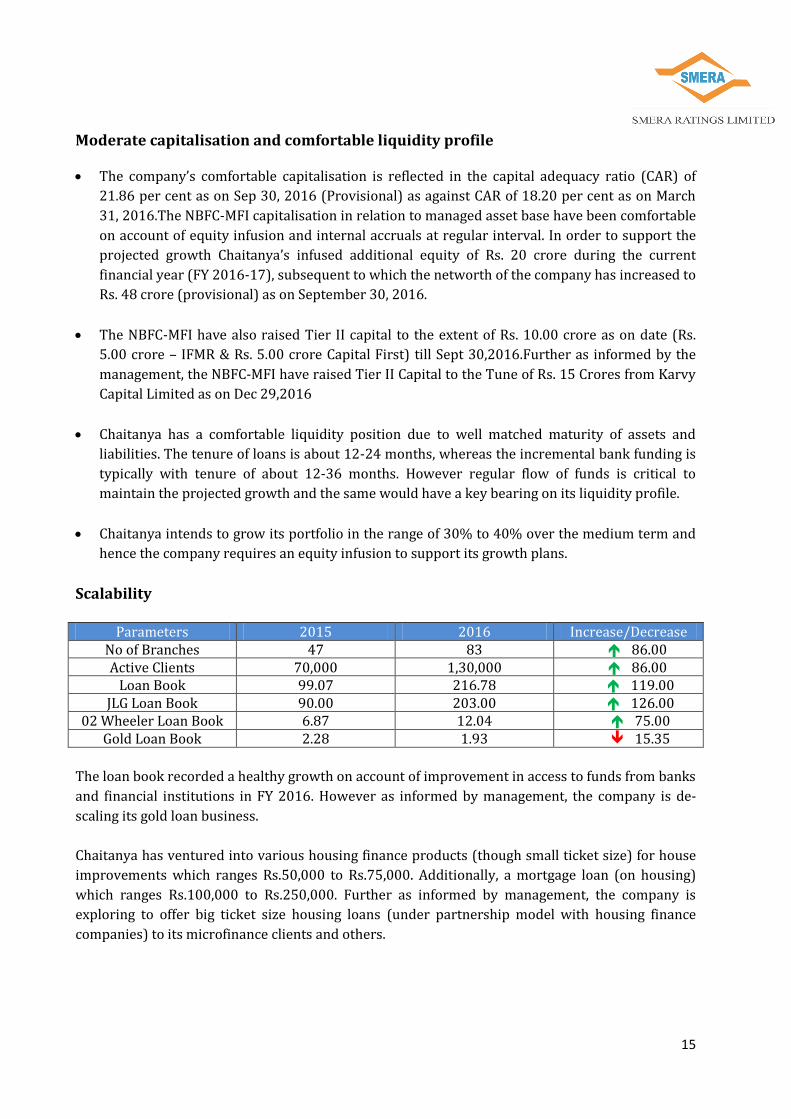
Moderate capitalisation and comfortable liquidity profile
The company’s comfortable capitalisation is reflected in the capital adequacy ratio (CAR) of
21.86 per cent as on Sep 30, 2016 (Provisional) as against CAR of 18.20 per cent as on March
31, 2016.The NBFC-MFI capitalisation in relation to managed asset base have been comfortable
on account of equity infusion and internal accruals at regular interval. In order to support the
projected growth Chaitanya’s infused additional equity of Rs. 20 crore during the current
financial year (FY 2016-17), subsequent to which the networth of the company has increased to
Rs. 48 crore (provisional) as on September 30, 2016.
The NBFC-MFI have also raised Tier II capital to the extent of Rs. 10.00 crore as on date (Rs.
5.00 crore – IFMR & Rs. 5.00 crore Capital First) till Sept 30,2016.Further as informed by the
management, the NBFC-MFI have raised Tier II Capital to the Tune of Rs. 15 Crores from Karvy
Capital Limited as on Dec 29,2016
Chaitanya has a comfortable liquidity position due to well matched maturity of assets and
liabilities. The tenure of loans is about 12-24 months, whereas the incremental bank funding is
typically with tenure of about 12-36 months. However regular flow of funds is critical to
maintain the projected growth and the same would have a key bearing on its liquidity profile.
Chaitanya intends to grow its portfolio in the range of 30% to 40% over the medium term and
hence the company requires an equity infusion to support its growth plans.
Scalability
Parameters 2015 2016 Increase/Decrease No of Branches 47 83 86.00 Active Clients 70,000 1,30,000 86.00
Loan Book 99.07 216.78 119.00 JLG Loan Book 90.00 203.00 126.00
02 Wheeler Loan Book 6.87 12.04 75.00 Gold Loan Book 2.28 1.93 15.35
The loan book recorded a healthy growth on account of improvement in access to funds from banks
and financial institutions in FY 2016. However as informed by management, the company is de-
scaling its gold loan business.
Chaitanya has ventured into various housing finance products (though small ticket size) for house
improvements which ranges Rs.50,000 to Rs.75,000. Additionally, a mortgage loan (on housing)
which ranges Rs.100,000 to Rs.250,000. Further as informed by management, the company is
exploring to offer big ticket size housing loans (under partnership model with housing finance
companies) to its microfinance clients and others.

16
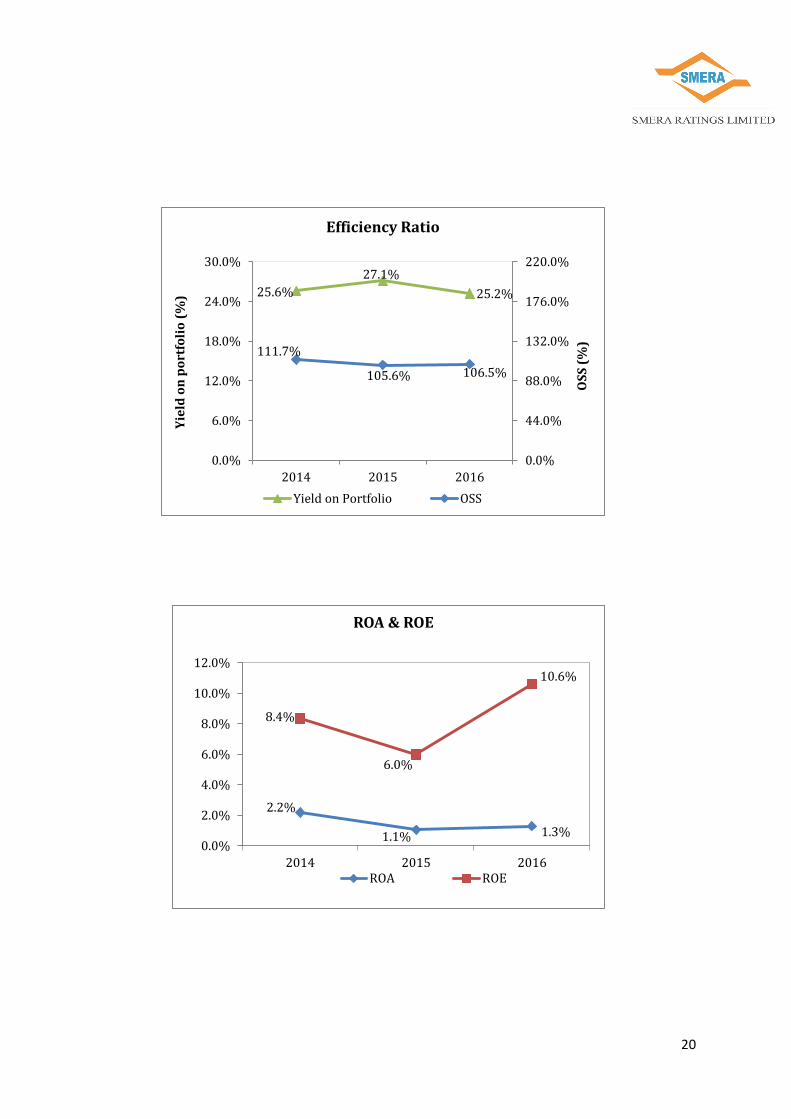
Profitability
The company reported a profit before tax of Rs. 2.27 Crore (ROA of 1.3%) on total income of
Rs.37.24 crore in FY2016 and Rs.1.08 crores (ROA 1.1%) on Rs 20.11 crore in FY2015 compared to
Rs.1.13 crores (ROA 2.2%) on Rs 10.85 crore in FY2014. The Reduction in ROA during FY2016 and
FY 2015 was largely increase in the size of assets towards end of the year supported by significant
increase in disbursements. Futher The company’s operating costs as a proportion of managed
advances reduced to about 10.5% for FY2016 as compared to 12.30% for FY2014.
Return of Equity (ROE) increased in FY 2016 over previous year was largely due to rise in profits
driven by significant increase in portfolio with marginal increase in capital base.
Profitability / Sustainability Ratios 2014 2015 2016
Operational Self Sufficiency (%) 111.7% 105.6% 106.5%
Operating Expense Ratio (OER) 12.3% 12.0% 10.5%
Funding Expense Ratio (FER) 15.73% 16.17% 15.79%
Return on Assets (RoA) 2.2% 1.1% 1.3%
Portfolio at Risk (>30 days) 0.13% 0.40% 0.30%
Return on Equity (RoE) 8.4% 6.0% 10.6%
Moderate Geographical Reach
CHAITANYA’s operations concentrated in 02 states i.e Karnataka and Maharashtra at ~ 98 per
cent and ~ 02 per cent, respectively (as on Dec 31, 2016), As informed by management, the
company is planning to start its microfinance presence in Bihar and reduce its concentration in
the state of Karnataka.
SMERA believes that the company is exposed to political uncertainty in the state of Karnataka
where the company has majority of the microfinance operations. Any political intervention in
the existing states would materially affect the company’s asset quality indicators.
It would be key grading sensitivity factor for the company to replicate its systems, processes
and sound asset quality in the newer geographies while improving portfolio diversity.

17
Sound asset quality
Loan O/S*
FY 2014 FY 2015 FY2016 31-Dec-16
No. of Active
borrower
Portfolio o/s
No. of Active
borrower
Portfolio o/s
No. of Active
borrower
Portfolio o/s
No. of Active
borrower
Portfolio o/s
(Rs. in Crore)
(Rs. in Crore)
(Rs. in Crore)
(Rs. in Crore)
On Time 44,013 56.40 69,801 98.69 130,290 216.11 163,939 261.49
1-30 days 10 0.00 2 0.00 26 0.01 14,712 22.42
31-60 days
1 0.00 3 0.00 6 0.00 4,465 6.82
61-90 days
1 0.00 5 0.00 - 0.00 58 0.06
91-180 days
49 0.07 96 0.20 206 0.35 58 0.04
181-360 days -
0.00 88
0.18 160
0.26 212 0.13
> 360 days 0.00 0.01 0.05
TOTAL 44,074 56.48 69,995 99.08 130,688 216.78 183,444 290.96
*It includes owned as well as Securitized Portfolio
Although Chaitanya’s Assets under Management (AUM) in FY 2016 witnessed robust growth of
109% over FY15 (59% growth seen in FY2015), the NBFC-MFI has maintained sound asset
quality with over 99.60% over the same period. Adequate credit appraisal processes,
monitoring and risk management mechanisms have supported the company to keep asset
quality indicators under control.
Impact of De-monetization on Asset Quality
The step of De-monetization impacted the Microfinance industry as a whole the resultant of
which collection ratio declined to 80% in the first week. However Subsequent increased in
supply of new currencies by RBI had led to improvement in collections in the fourth week. The
below table (Shared by client) represents the collection efficiency of Chaitanya post de-
monetization.
Week Dates Collection Efficiency (in %) 1st 14th Nov – 18th Nov 86.77
2nd 21st Nov – 25thNov 88.71 3rd 28th Nov – 2nd Dec 92.59 4th 5th Dec – 9th Dec 93.07
5th 12th Dec – 16th Dec 97.01
6th 19th Dec – 23rd Dec 99.02
7th 26th Dec – 30th Dec 99.43
8th 2nd Jan – 6th Dec 99.37

18
Adequate IT Systems Audit Mechanism
Last year Chaitanya migrated from Oracle 10-G to MIFOS-X as its CORE-IT platform which is
originally developed by the Grameen Foundation and currently managed by Conflux
Technologies. It has custom built Credit Risk Management Software that assists in credit
assessment for JLG loans. Further the Collateral Management System in it is useful to manage
Jewellery loan book. The current system is robust has enabled the Head Office to access to
access comprehensive microfinance solutions.
Considering the significant increase in scale of operations, Chaitanya have strengthened its
internal audit team. The audit plan is proposed and the frequency of audit is determined on the
basis of outstanding loan portfolio, risk assessment, portfolio at risk and previous audit
findings. The audit team comprises of one Audit Officer per region headed by Audit Manager,
which carries out branch and field audits according to a pre-defined plan.
Apart from internal audit team, the company has appointed an external audit firm to undertake
accounts and administrative audit every quarter. Every quarter both the field audit and the
accounting audit findings are submitted to the audit committee.
Inherent risk prevalent in the microfinance sector
Chaitanya’s business risk profile is susceptible to regulatory and legislative risks, along with the
inherent risk exist such as unsecured nature of lending, vulnerable customer profile, exposure
to vagaries of political situation in states, and cash handling associated with the NBFC-MFI
sector. However, MFSL has an experienced team of professionals that monitors regulatory,
compliances and frame policies to mitigate the probability of such risks.

19
`
Financial Strength Graphs
476,772
898,511
1,878,874
2,459,325
0
500,000
1,000,000
1,500,000
2,000,000
2,500,000
3,000,000
2014 2015 2016 9M2017
(00
0's
)
Gross Outstanding Portfolio
3,506 3,566
3,981
3,253 324
278 277 243
0
900
1,800
2,700
3,600
4,500
0
80
160
240
320
400
2014 2015 2016 9M2017
INR
(0
00
s')
In N
o.
Productivity Ratio
Gross portfolio o/s per Field Executive
Field Executive Productivity
20
25.6%
27.1%
25.2%
111.7%
105.6% 106.5%
0.0%
44.0%
88.0%
132.0%
176.0%
220.0%
0.0%
6.0%
12.0%
18.0%
24.0%
30.0%
2014 2015 2016
Yie
ld o
n p
ort
foli
o (
%)
OS
S (
%)
Efficiency Ratio
Yield on Portfolio OSS
2.2%
1.1% 1.3%
8.4%
6.0%
10.6%
0.0%
2.0%
4.0%
6.0%
8.0%
10.0%
12.0%
2014 2015 2016
ROA & ROE
ROA ROE

21
Profit & Loss Account (Rs. In Thousands)
Financial Year FY 2014 FY 2015 FY 2016
Months Covered By P/L 12 12 12
Income
Financial revenue from operations 97,055 186,425 350,393
Income from Securitization 5,609 3,000 4,014
Other Operating Revenue 5,840 11,685 17,993
Less: Financial expenses from operations 46,308 103,697 193,896
Gross financial profit 62,196 97,413 178,504
Less: Provision for Loan Loss 4,085 4,330 10,012
Net financial profit 58,111 93,083 168,492
Less: Operating expenses
Depreciation and Amortization Expense 1,829 3,941 5,836
Personnel Expense 28,732 48,342 88,036
Administration Expense 16,152 30,045 51,929
Net income Before Tax 11,398 10,755 22,691
Less: Income Tax 3,441 2,417 7,767
Net income After Tax 7,957 8,338 14,924
Above financials are audited
Financials
22
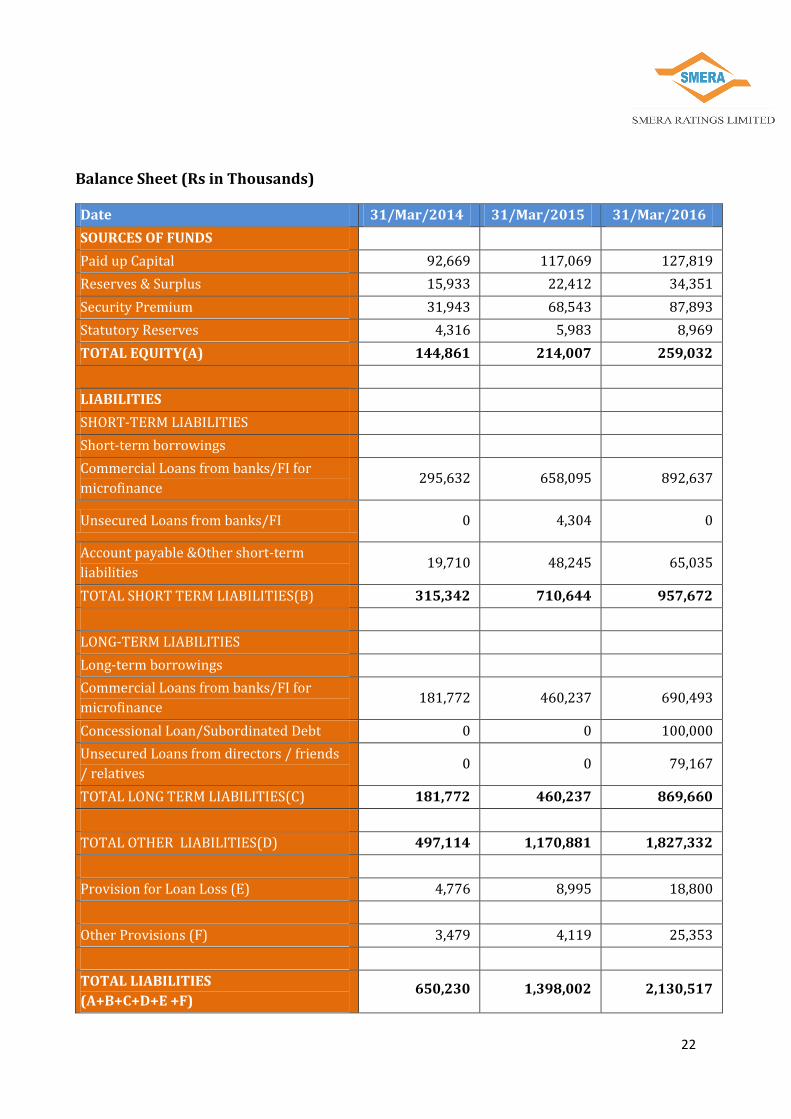
Balance Sheet (Rs in Thousands)
Date 31/Mar/2014 31/Mar/2015 31/Mar/2016
SOURCES OF FUNDS
Paid up Capital 92,669 117,069 127,819
Reserves & Surplus 15,933 22,412 34,351
Security Premium 31,943 68,543 87,893
Statutory Reserves 4,316 5,983 8,969
TOTAL EQUITY(A) 144,861 214,007 259,032
LIABILITIES
SHORT-TERM LIABILITIES
Short-term borrowings
Commercial Loans from banks/FI for
microfinance 295,632 658,095 892,637
Unsecured Loans from banks/FI 0 4,304 0
Account payable &Other short-term
liabilities 19,710 48,245 65,035
TOTAL SHORT TERM LIABILITIES(B) 315,342 710,644 957,672
LONG-TERM LIABILITIES
Long-term borrowings
Commercial Loans from banks/FI for
microfinance 181,772 460,237 690,493
Concessional Loan/Subordinated Debt 0 0 100,000
Unsecured Loans from directors / friends
/ relatives 0 0 79,167
TOTAL LONG TERM LIABILITIES(C) 181,772 460,237 869,660
TOTAL OTHER LIABILITIES(D) 497,114 1,170,881 1,827,332
Provision for Loan Loss (E) 4,776 8,995 18,800
Other Provisions (F) 3,479 4,119 25,353
TOTAL LIABILITIES
(A+B+C+D+E +F) 650,230 1,398,002 2,130,517

23
APPLICATION OF FUNDS 31/Mar/2014 31/Mar/2015 31/Mar/2016
Fixed Assets
Fixed Assets 10,803 16,856 27,115
Less: Depreciation 4,001 7,825 13,157
Net Fixed Assets(A) 6,802 9,031 13,958
Cash and Bank Balances(B) 83,657 330,188 51,837
Investments in Fixed Deposit Including
Margin Money (C) 71,884 133,312 135,079
Loan Portfolio *
Gross Loan Portfolio 476,772 898,511 1,878,874
Less: Impairment Loss Allowance - - -
Net Loan Portfolio(D) 476,772 898,511 1,878,874
Accounts Receivable and Other
Assets(E) 9,468 22,234 40,970
Deferred Tax (F) 1,376 3,800 7,859
Intangibles (G) 271 926 1,940
TOTAL ASSETS (A+B+C+D+E+F+G) 650,230 1,398,002 2,130,517

24
Financial Ratios 31/Mar/2014 31/Mar/2015 31/Mar/2016
Capital Adequacy Ratio (CAR)
Capital Adequacy Ratio (%) 33.11% 22.46% 18.20%
Productivity / Efficiency Ratios*
No. of Active Borrowers Per Staff Member 186 169 166
No. of Active Borrowers per field executives 324 278 277
Gross Portfolio o/s per field executive
(Rs in thousands) 3,506 3,566 3,981
Average Outstanding Balance Per
borrower
(In Rs)
12,814 12,837 14,377
Cost Per Active borrower (In Rs) 1060 1176 1116
Asset / Liability Management
Yield on Portfolio (%) 25.6% 27.1% 25.2%
Profitability / Sustainability Ratios
Operational Self Sufficiency (%) 111.7% 105.6% 106.5%
Operating Expense Ratio (OER) 12.3% 12.0% 10.5%
Funding Expense Ratio (FER) 12.74% 13.0% 13.44%
Return on Assets (RoA) 2.2% 1.1% 1.3%
Portfolio at Risk (>30 days) 0.13% 0.40% 0.30%
Return on Equity (RoE) 8.4% 6.0% 10.6%
Financial Ratios

25
Annexure: Methodologies
A) Operational Track Record
Business Orientation and Outreach of the MFI is an important parameter to gauge the growth strategies of the MFI and to assess its strategies for development. This parameter is analysed using the following sub-parameters.
Direction & Clarity Ability to raise funds Degree of association with promoter institution Alternate avenues for funds Outreach (No. of offices, No. of clients, No. of employees, Portfolio diversification)
B) Promoters & Management Profile
The elements in this parameter helps in assessing the Promoter & management quality evaluated on the basis of the basic educational qualification, professional experience of the entrepreneur; and business attitude that is related to the motivation of carrying out the business and pursuing business strategies. This parameter is analysed using the following sub-parameters.
Past experience of the management Vision and mission of the management Profile of the Board Members Policies and Processes Transparency and corporate governance
C) Financial Performance
SMERA analyses the credit worthiness of the organization through the following financial parameters. Various financial adjustments are done to get more accurate ratios for comparison. Financial analysis helps the MFI to know its financial sustainability. This parameter is analysed using the following sub-parameters.
Capital adequacy Profitability/Sustainability ratios
Grading Methodology

26
Productivity and efficiency ratios Gearing and Liquidity ratios

27
D) Asset Quality
The loan portfolio is the most important asset for any MFI. SMERA analyses the portfolio quality of the MFIs by doing ageing analysis, sectoral analysis, product wise analysis etc. SMERA compares the portfolio management system with organizational guidelines and generally accepted best practices. This parameter is analysed using the following sub-parameters.
Ageing schedule Arrears Rate / Past Due Rate Repayment Rate Annual Loan Loss Rate
E) System & Processes
SMERA analyses the polices and processes followed by the MFIs, their ability to handle volume of financial transactions, legal issue and disputes, attrition among the employees and client drop out which impact the productivity of the organization. SMERA also analyses asset liability maturity profile of the MFI, liquidity risk and interest rate risk. This parameter is analysed using the following sub-parameters.
Operational Control Management Information System Planning & Budgeting Asset Liability Mismatch
F) Financial Performance
SMERA analyses the credit worthiness of the organization through the following financial parameters. Various financial adjustments are done to get more accurate ratios for comparison. Financial analysis helps the MFI to know its financial sustainability. This parameter is analysed using the following sub-parameters.
Capital adequacy Profitability/Sustainability ratios Productivity and efficiency ratios Gearing and Liquidity ratios
Thus an evaluation of MFI would be comprehensive assessment based on the financial and non-financial parameters of any MFI.

28
About SMERA SMERA Ratings Limited is a joint initiative of Small Industries
Development Bank of India (SIDBI), Dun & Bradstreet Information
services India Private Limited (D&B) and leading public and private
sector banks in India. SMERA commenced its operations in 2005 and is
empanelled as an approved rating agency by the National Small
Industries Corporation Ltd. (NSIC) under the 'Performance & Credit
Rating Scheme for Micro & Small Enterprise’ of the Ministry of MSME,
Government of India. SMERA is registered with the securities and
Exchange Board of India (SEBI) as a Credit Rating Agency and is
accredited by Reserve Bank of India (RBI) as an External Credit
Assessment Institution (ECAI), under BASEL- II norms for undertaking
Bank Loan Ratings.
Ahmedabad | Bengaluru | Chennai | Coimbatore | Hyderabad | Jaipur | Kolkata | New Delhi | Surat
Corporate Office 102, Sumer Plaza
Marol Maroshi Road, Marol
Andheri (East)
Mumbai - 400 059
Tel: +91 22 6714 1111
E-mail: [email protected]
Website: www.smera.in