CHAIR’S LECTURE: CALIFORNIA ENERGY FUTURES STUDY RESULTS · CHAIR’S LECTURE: CALIFORNIA ENERGY...
73
CHAIR’S LECTURE: CALIFORNIA ENERGY FUTURES STUDY RESULTS July 15, 2011 Jane C. S. Long
Transcript of CHAIR’S LECTURE: CALIFORNIA ENERGY FUTURES STUDY RESULTS · CHAIR’S LECTURE: CALIFORNIA ENERGY...
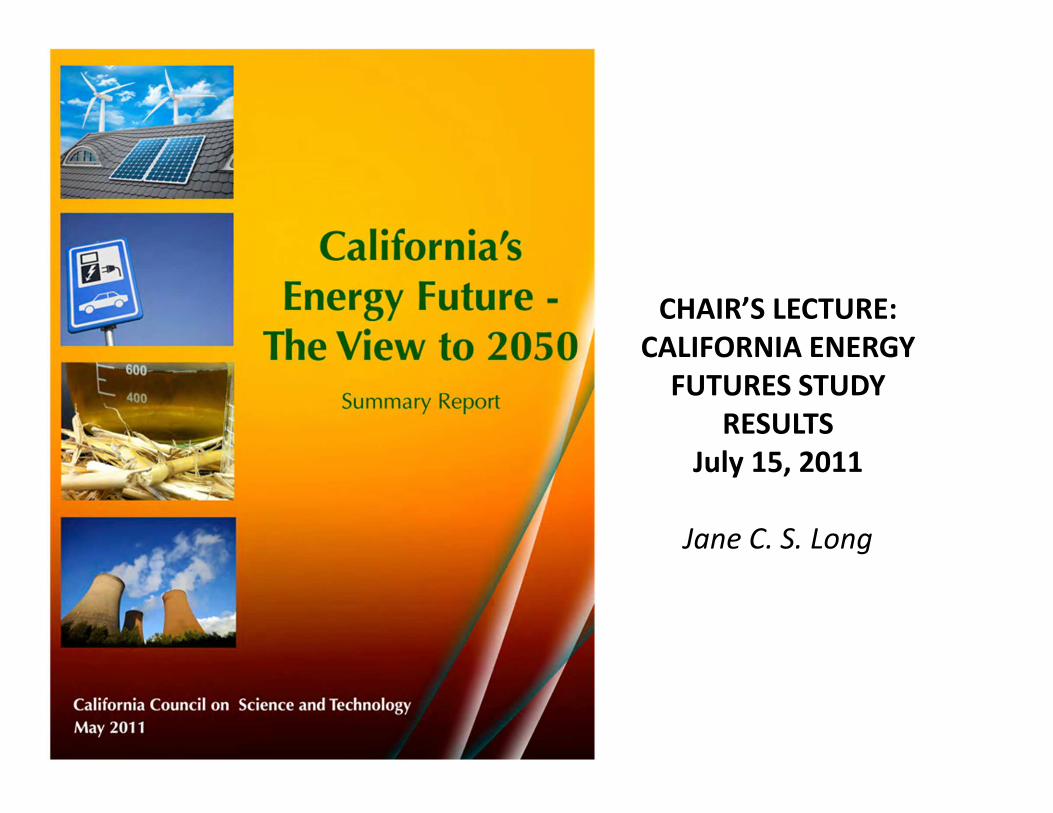
CHAIR’S LECTURE:
CALIFORNIA ENERGY
FUTURES STUDY
RESULTS
July 15, 2011
Jane C. S. Long

California Context
• AB 32 Requires reducing GHG emissions to
1990 levels by 2020 - a reduction of about 25
percent,
• Governor’s executive order S-3-05 (2005)
requires an 80 percent reduction below 1990
levels by 2050.
• We must go from 480 mmT CO2e today to 80
mmT CO2e in 40 years

• “Existence proof”: Can it be done, and what
needs to change to allow us to get there?
• Focus on technology, GHG emissions and
other impacts, not economics
Approach
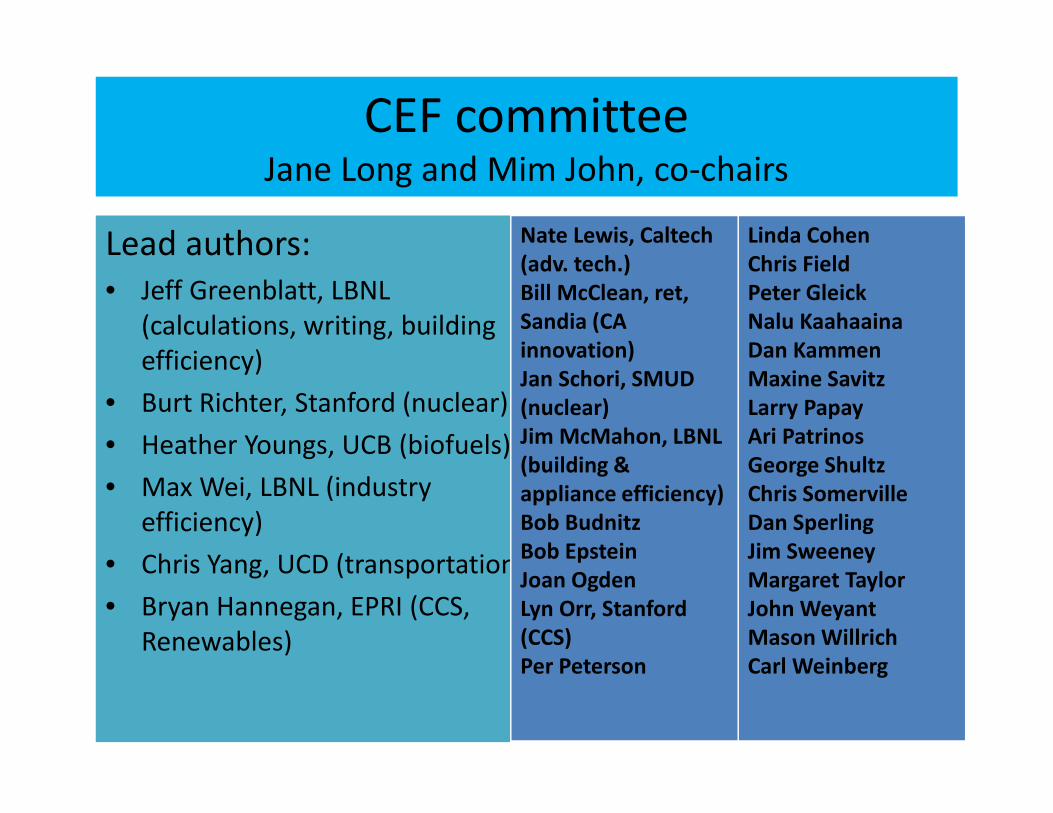
CEF committeeJane Long and Mim John, co-chairs
Lead authors:
• Jeff Greenblatt, LBNL
(calculations, writing, building
efficiency)
• Burt Richter, Stanford (nuclear)
• Heather Youngs, UCB (biofuels)
• Max Wei, LBNL (industry
efficiency)
• Chris Yang, UCD (transportation)
• Bryan Hannegan, EPRI (CCS,
Renewables)
Nate Lewis, Caltech
(adv. tech.)
Bill McClean, ret,
Sandia (CA
innovation)
Jan Schori, SMUD
(nuclear)
Jim McMahon, LBNL
(building &
appliance efficiency)
Bob Budnitz
Bob Epstein
Joan Ogden
Lyn Orr, Stanford
(CCS)
Per Peterson
Linda Cohen
Chris Field
Peter Gleick
Nalu Kaahaaina
Dan Kammen
Maxine Savitz
Larry Papay
Ari Patrinos
George Shultz
Chris Somerville
Dan Sperling
Jim Sweeney
Margaret Taylor
John Weyant
Mason Willrich
Carl Weinberg

The short answer: Yes, we can
• We can achieve 80% cuts in emissions and still meet our energy needs.
• We can get ~60% of the cuts with technology we largely know about.– We basically know how to do this
– A lot of this technology is in demonstration. • Deployment will depend on policy and innovation.
• Note: We excluded extremely expensive technology
• We can get the rest of the cuts to 80% below 1990, but this will require new technology innovation and development.
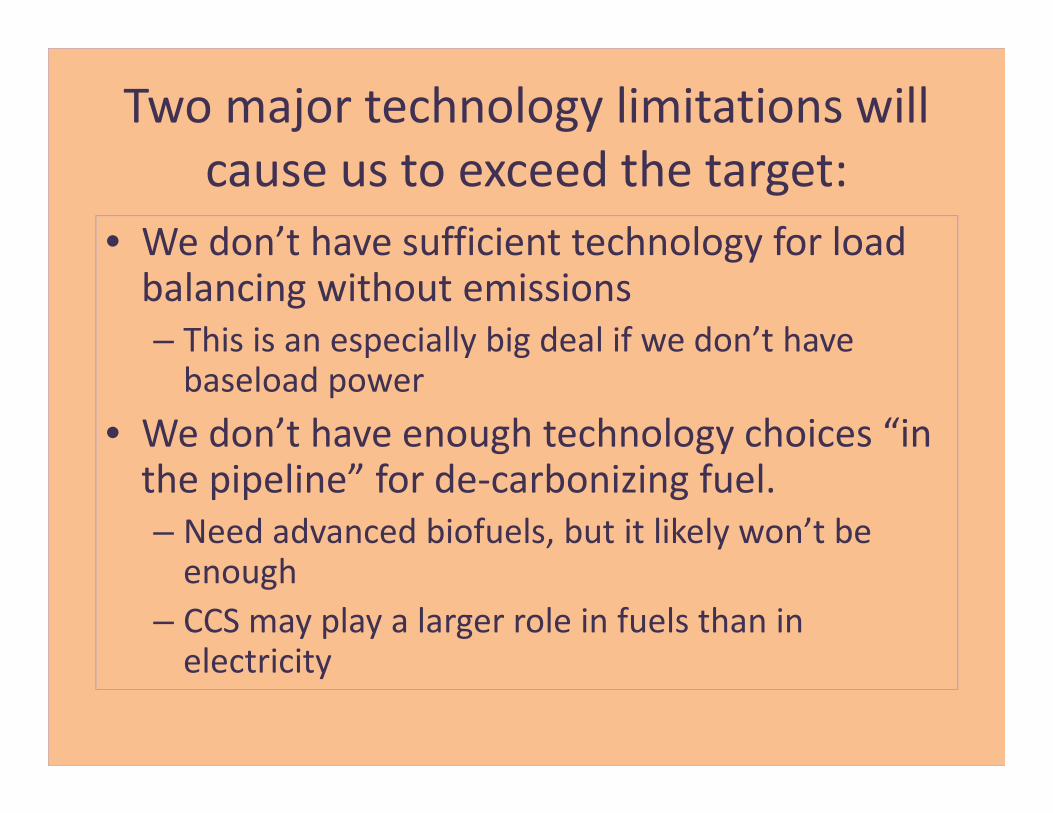
Two major technology limitations will
cause us to exceed the target:
• We don’t have sufficient technology for load balancing without emissions
– This is an especially big deal if we don’t have baseload power
• We don’t have enough technology choices “in the pipeline” for de-carbonizing fuel.
– Need advanced biofuels, but it likely won’t be enough
– CCS may play a larger role in fuels than in electricity
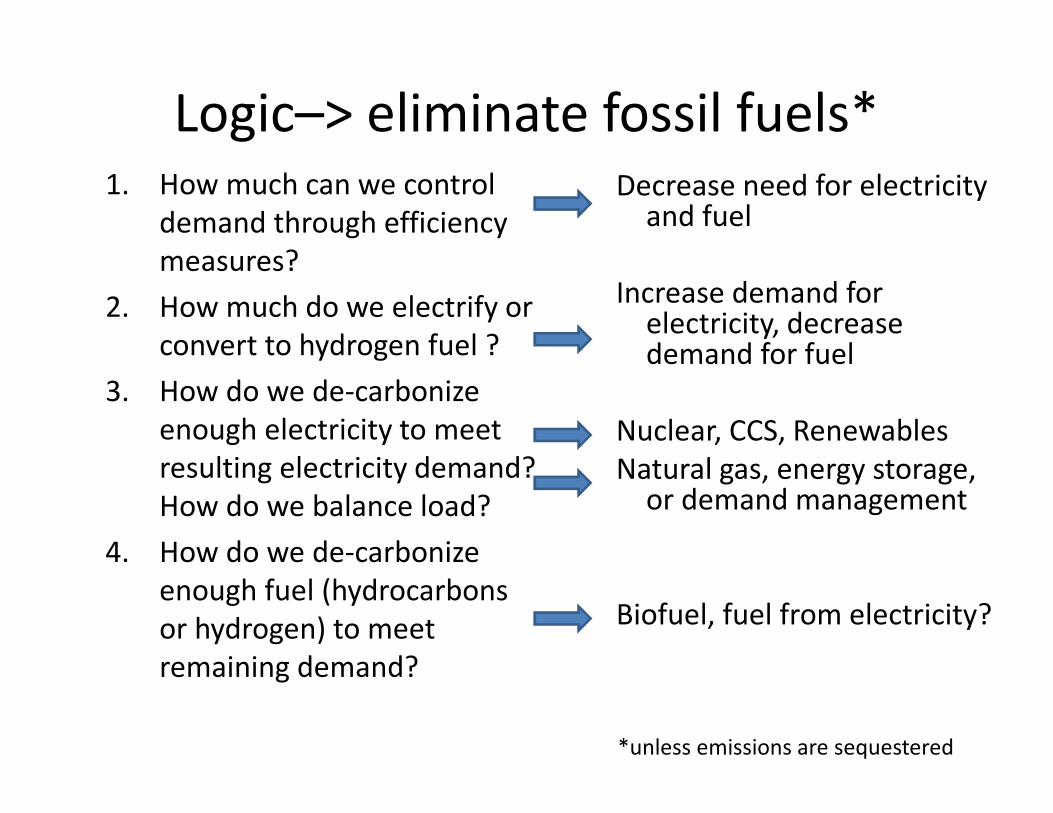
Logic–> eliminate fossil fuels*1. How much can we control
demand through efficiency
measures?
2. How much do we electrify or
convert to hydrogen fuel ?
3. How do we de-carbonize
enough electricity to meet
resulting electricity demand?
How do we balance load?
4. How do we de-carbonize
enough fuel (hydrocarbons
or hydrogen) to meet
remaining demand?
Decrease need for electricity and fuel
Increase demand for electricity, decrease demand for fuel
Nuclear, CCS, Renewables
Natural gas, energy storage, or demand management
Biofuel, fuel from electricity?
*unless emissions are sequestered
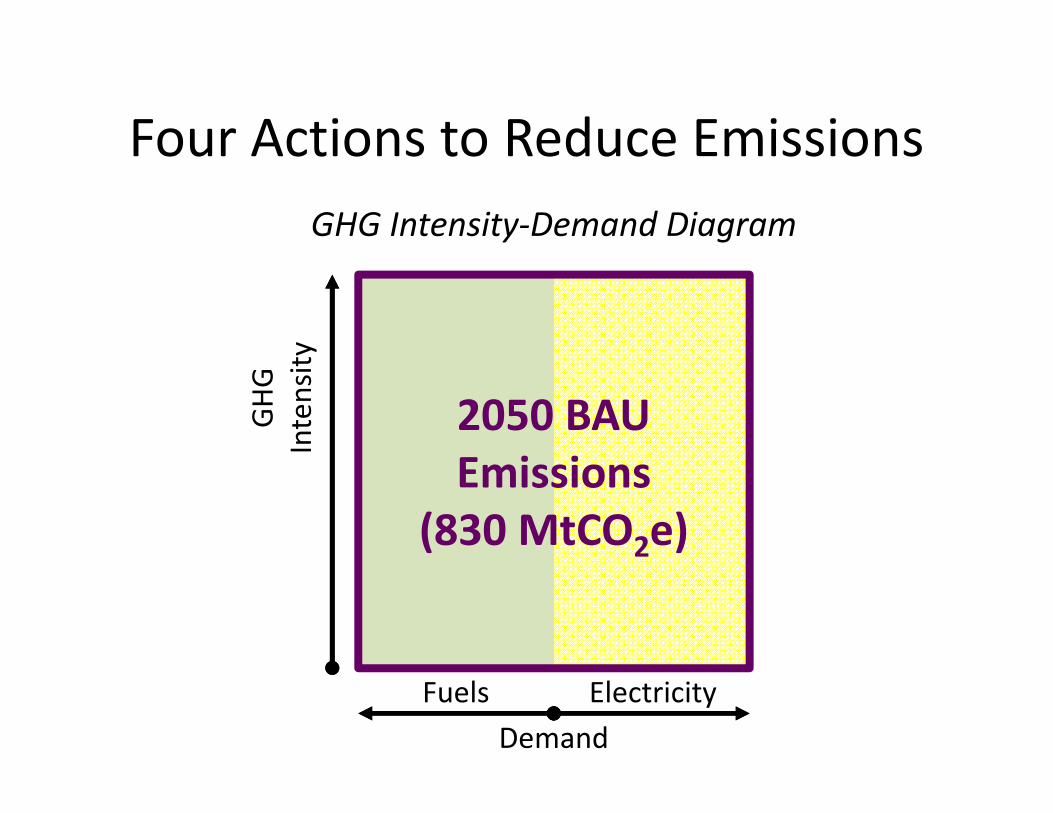
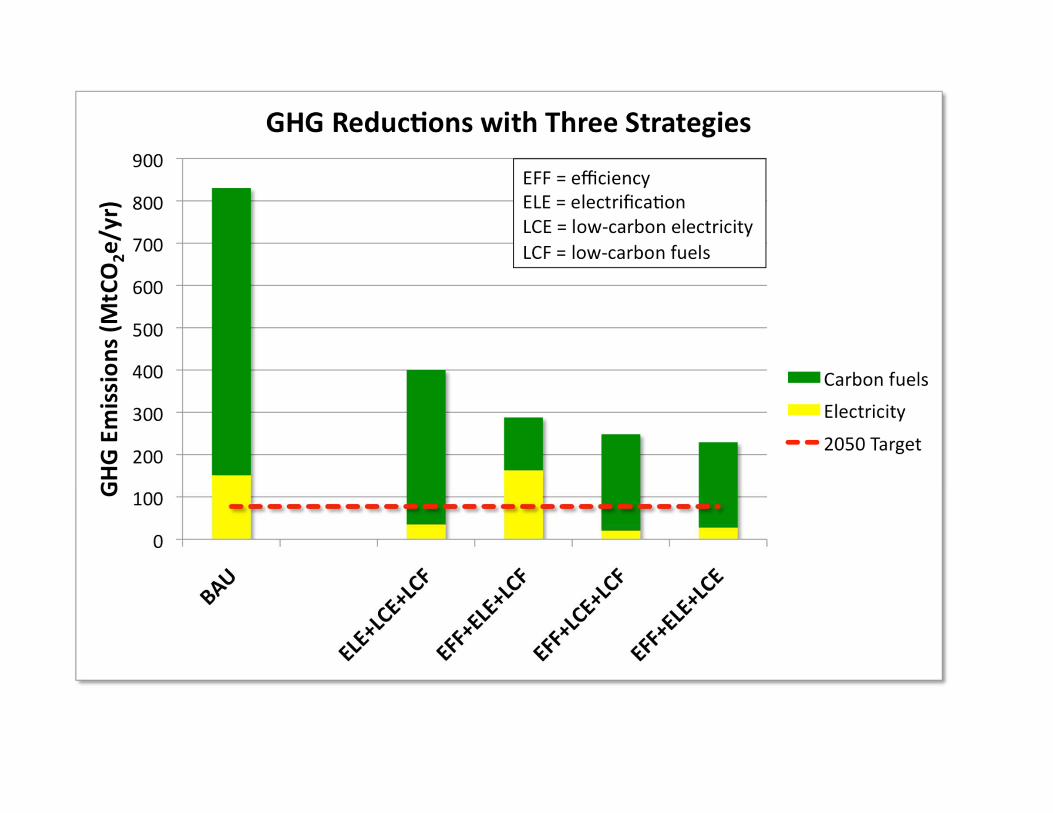
2050 BAU
Emissions
(830 MtCO2e)
Demand
GH
G
Inte
nsi
ty
Fuels Electricity
Four Actions to Reduce Emissions
GHG Intensity-Demand Diagram

GH
G
Inte
nsi
ty
Demand
Fuels Electricity
1. Efficiency

Demand
Fuels Electricity
2. Electrification

GH
G
Inte
nsi
ty
Demand
Fuels Electricity
3 + 4. “Low-Carb” Fuels + Electricity

“Low-Carb”
Fuels + Electricity
GH
G
Inte
nsi
ty
Electrification Efficiency
Demand
Fuels Electricity
2050 Target
Emissions
(80 MtCO2e)
Summary

Technology bins
Bin 1: Deployed at scale now
Bin 2: Has been demonstrated,
not available at scale
Bin 3: In development
Bin 4: Research concept

Three sectors of efficiency
and electrification
– Buildings
– Industry
– Transportation

Building efficiency
New
Retrofit
New
Retrofit
Cumulative energy decrease
Building stock turnover
Pre-2010New
Retrofit
Efficiency decrease in energy from BAU
Ene
rgy
decr
ease
rel
ativ
e to
BA
U
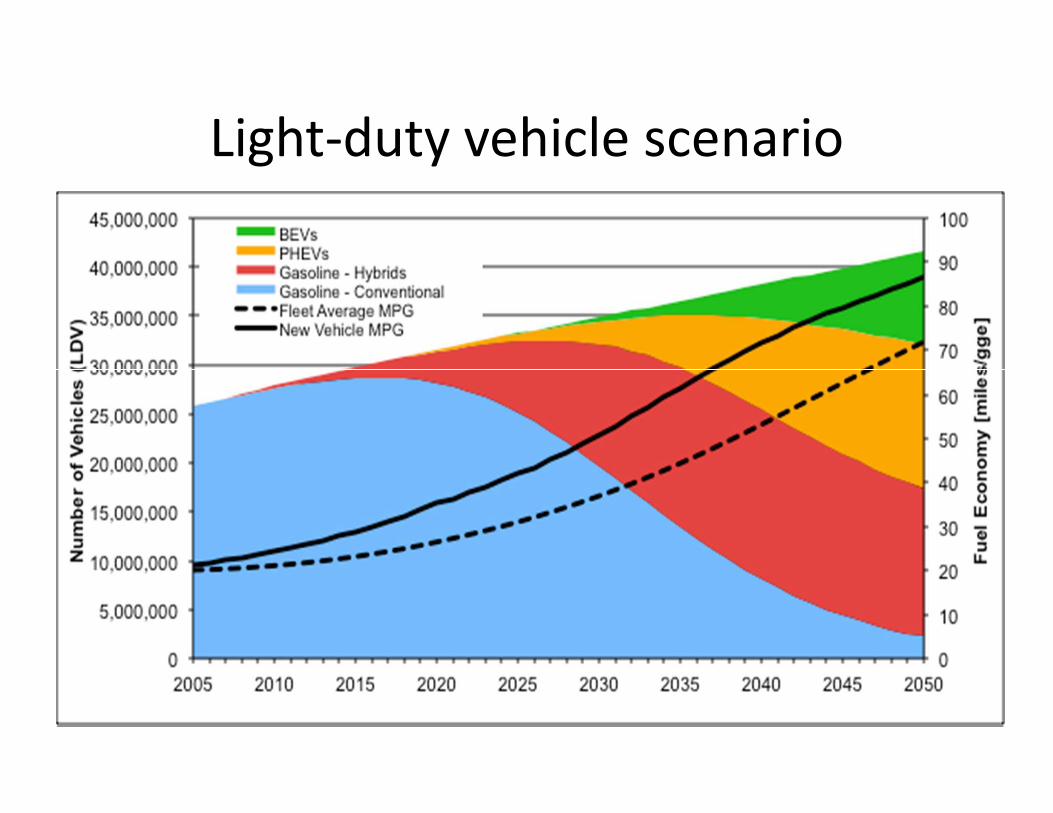
Light-duty vehicle scenario

Efficiency Summary
Percent energy decrease from BAU
Buildings 40% Cars 60%
Industry 0-15%* Trucks 30%
* BAU 30-40% fr. 2005 Airplanes 50%
Electricity 31% Bus, Rail 0%
Fuels 52% Marine 40%
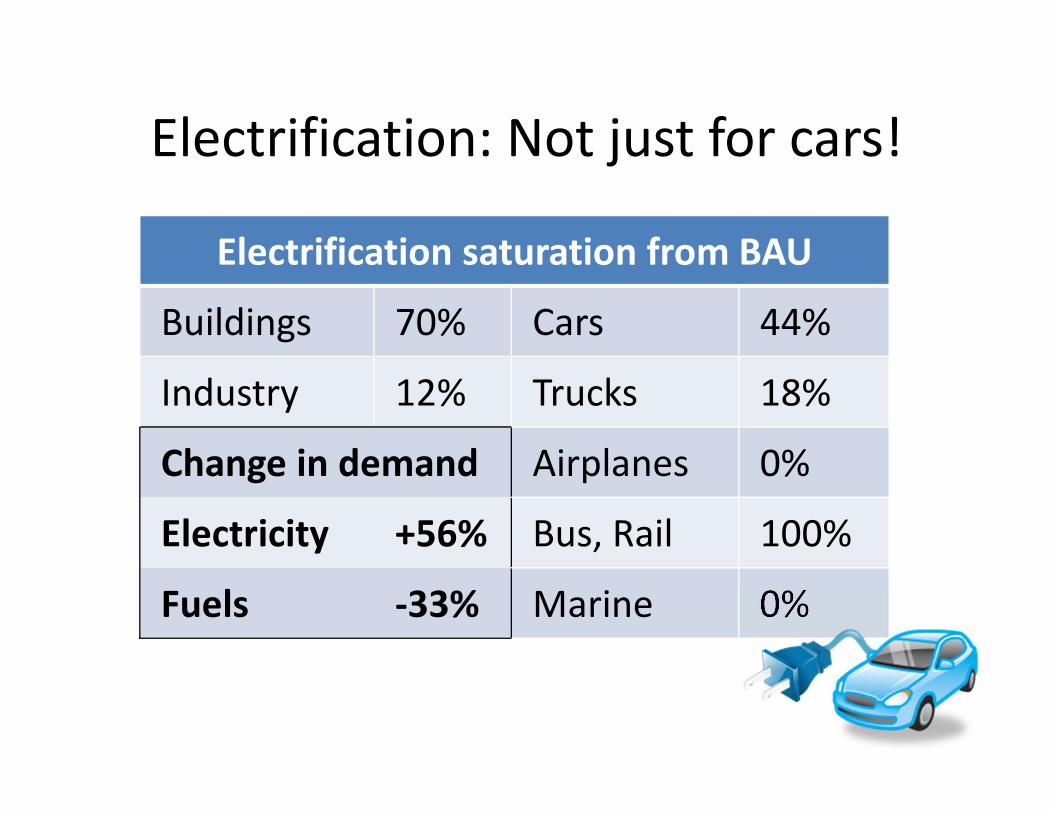
Electrification: Not just for cars!
Electrification saturation from BAU
Buildings 70% Cars 44%
Industry 12% Trucks 18%
Change in demand Airplanes 0%
Electricity +56% Bus, Rail 100%
Fuels -33% Marine 0%

Buildings efficiency technologyBin no.
Space conditioning and building envelope
Water heating Appliances Electronics Other
1 High efficiency furnaces (including heat pumps), high efficiency air conditioning equipment, occupancy sensors, fiberglass super-insulation, cool roofs
High efficiency water heaters, on-demand water heaters
Energy Star appliances (~20%), soil sensing clothes-and dishwashers, horizontal- axis clothes washers, high-spin clothes dryers
Automatic sleep mode, more efficient transformers
More efficient motors and fans, LED lighting, magnetic induction cooktops
2 Vacuum panel insulation, whole-building optimal energy management
Heat pump water heaters, solar hot water, waste heat recovery, whole-system integration
Higher efficiency appliances (~40-50%)
Network proxying Organic LED lighting
3 Non-invasive insulation retrofits
4 Magnetic refrigeration

Industry technology maturity –> complex
Bin Technologies
1 Ultra high efficiency furnaces, controls and monitoring systems, waste heat recovery systems
2 Membrane technology for separations, super boilers, advanced/hybrid distillation, solar boiler systems
3 Integrated & predictive operations/sensors, advanced materials and processing, electrified process heating (e.g. microwave), process intensification
4 New membrane materials, advanced materials/coatings
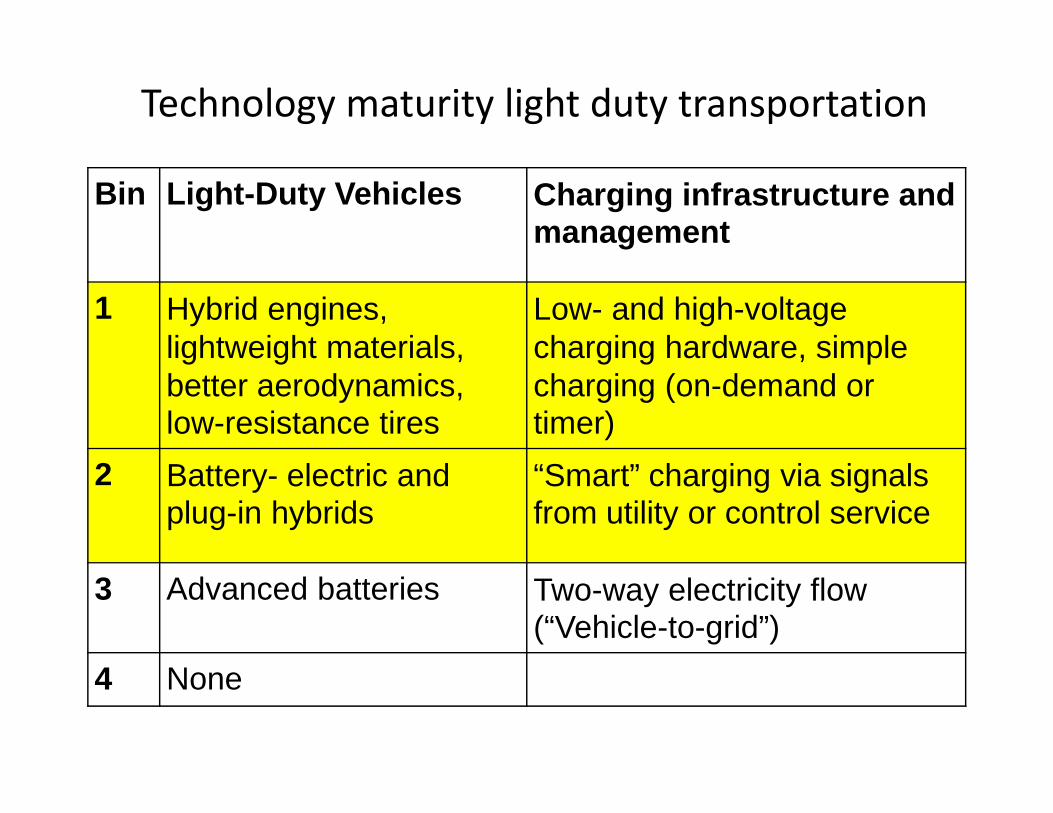
Technology maturity light duty transportation
Bin Light-Duty Vehicles Charging infrastructure and management
1 Hybrid engines, lightweight materials, better aerodynamics, low-resistance tires
Low- and high-voltage charging hardware, simple charging (on-demand or timer)
2 Battery- electric and plug-in hybrids
“Smart” charging via signals from utility or control service
3 Advanced batteries Two-way electricity flow (“Vehicle-to-grid”)
4 None
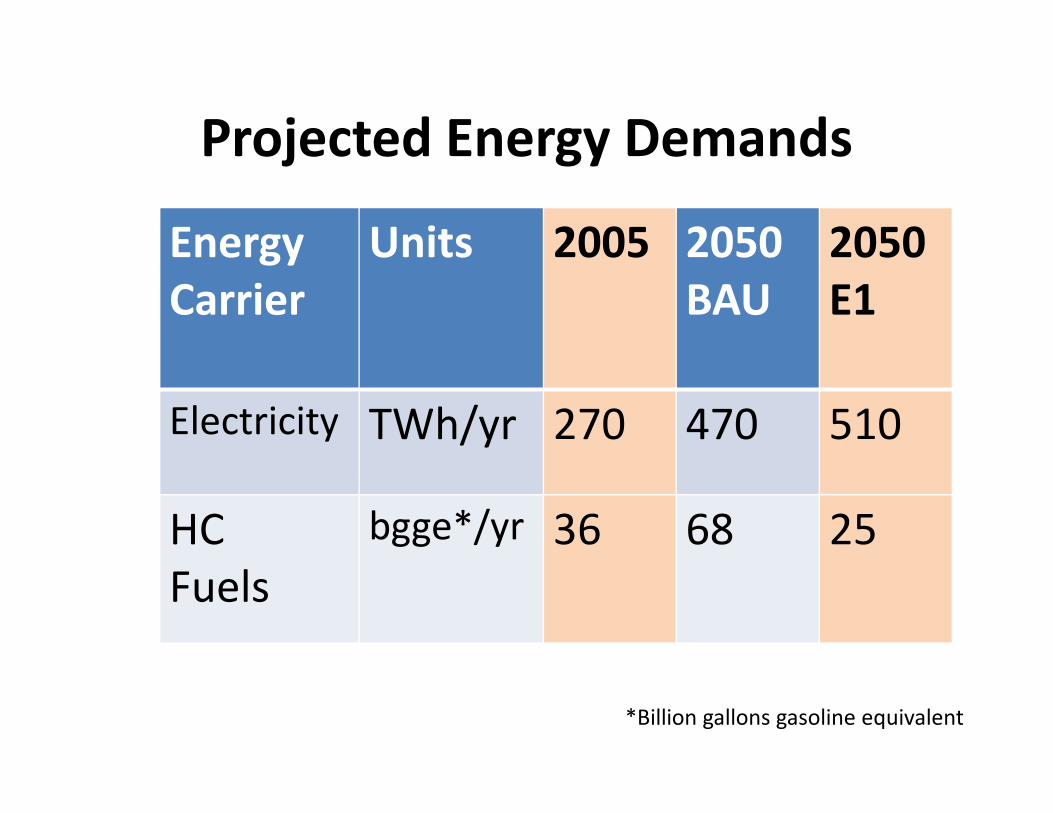
Projected Energy Demands
Energy
Carrier
Units 2005 2050
BAU
2050
E1
Electricity TWh/yr 270 470 510
HC
Fuels
bgge*/yr 36 68 25
*Billion gallons gasoline equivalent

Double electricity and de-carbonize it
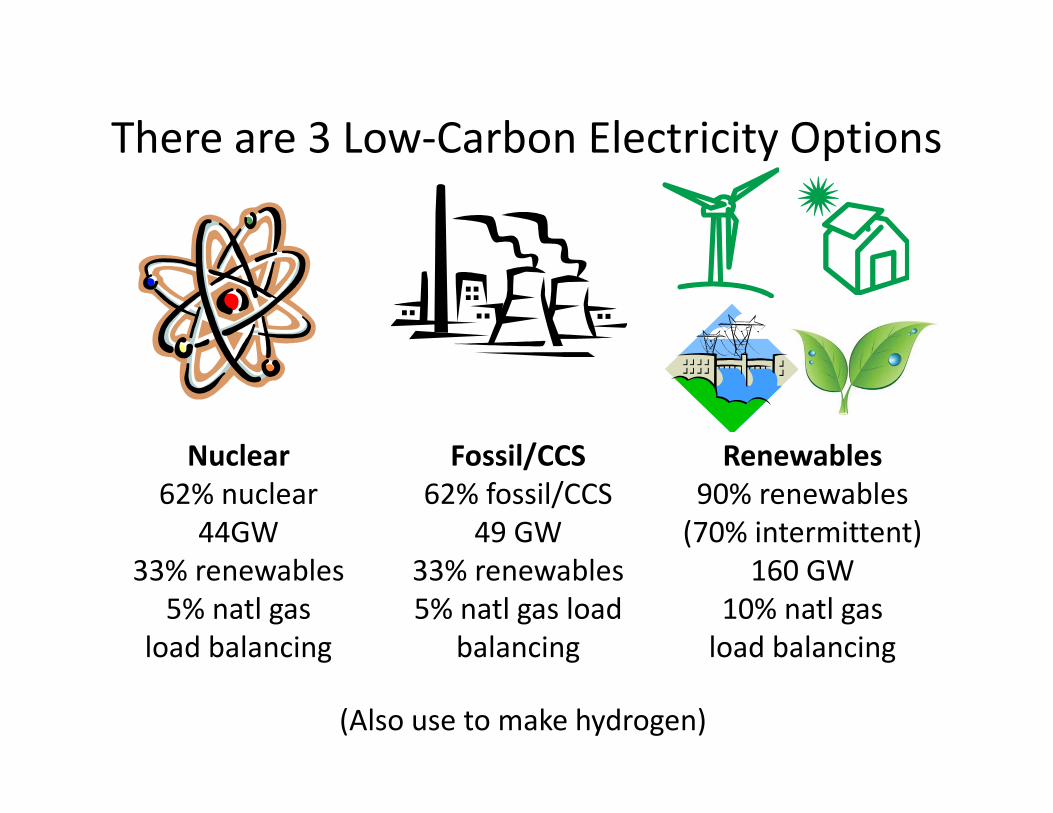
There are 3 Low-Carbon Electricity Options
Nuclear
62% nuclear
44GW
33% renewables
5% natl gas
load balancing
Fossil/CCS
62% fossil/CCS
49 GW
33% renewables
5% natl gas load
balancing
Renewables
90% renewables
(70% intermittent)
160 GW
10% natl gas
load balancing
(Also use to make hydrogen)
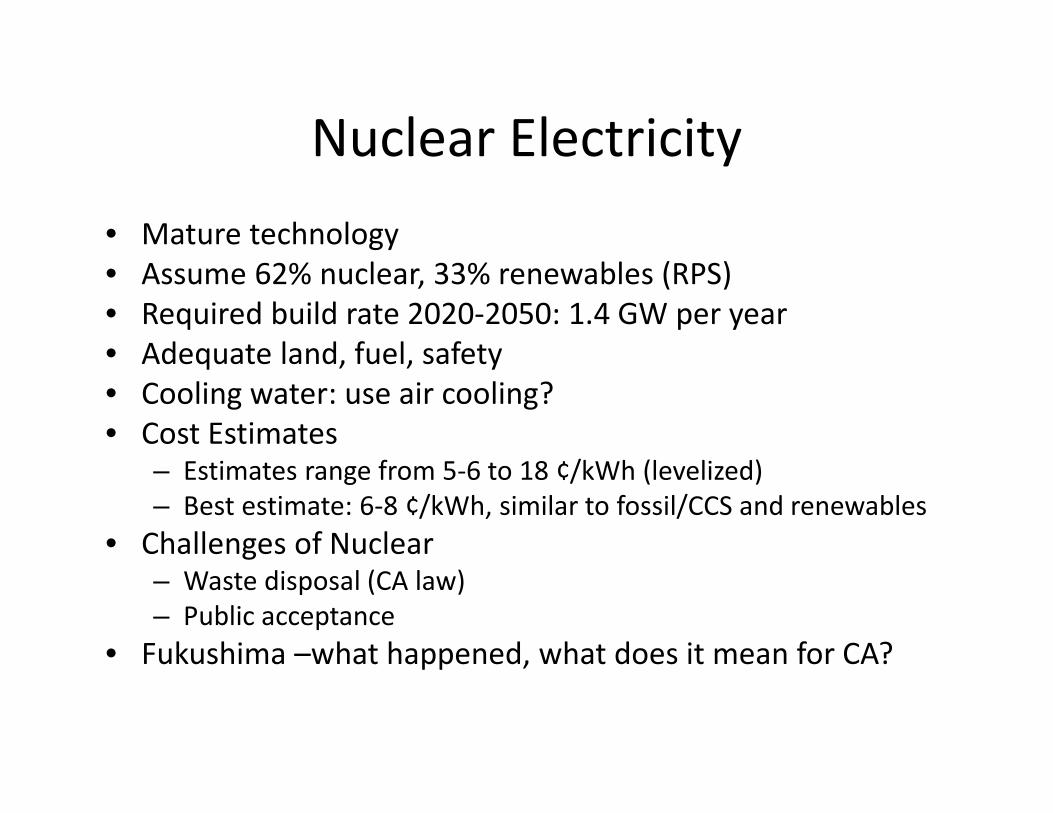
Nuclear Electricity
• Mature technology
• Assume 62% nuclear, 33% renewables (RPS)
• Required build rate 2020-2050: 1.4 GW per year
• Adequate land, fuel, safety
• Cooling water: use air cooling?
• Cost Estimates– Estimates range from 5-6 to 18 ¢/kWh (levelized)
– Best estimate: 6-8 ¢/kWh, similar to fossil/CCS and renewables
• Challenges of Nuclear– Waste disposal (CA law)
– Public acceptance
• Fukushima –what happened, what does it mean for CA?

Coal or Gas with CCS has emissions
• Coal or gas with CCS can provide 100% of projected 2050 energy demand assuming full electrification and aggressive energy efficiency 48 GW.
• Emissions: At 90% capture rate, residual emissions =
– 28 mmt CO2e – for coal – about 1/3 the total budget
– 13 mmt CO2e --- about 1/6th the total budget
• Using gas without saline reservoirs, about ~60 years capacity exists in state
• Massive new infrastructure required with high transportation costs

Renewable Electricity
*About 1.4% of California land area

Strategy Requirements and build
rateStrategy
Assumed
plant size
Total plant
capacity
needed in 2050
Build rate
2011-2050
(Plants/year)
Nuclear 1.5 GW 44 GW 0.7
Fossil/CCS 1.5 GW 49 GW 0.8
Renewables Mix 160 GW
Wind 500 MW 59 GW 3
Central Solar
(CSP and PV)
500 MW 57 GW 3
Distrib’d. Solar PV 5 kW 19 GW 100,000
Biomass/CCS 500 MW 7 GW 0.3
CA Biofuels 50 Mgge/yr 5,500 Mgge/yr 3
H2 (onsite NG) 0.5 Mgge/yr 800 Mgge/yr 40
H2 (central plant) 440 Mgge/yr 7,200 Mgge/yr 0.4
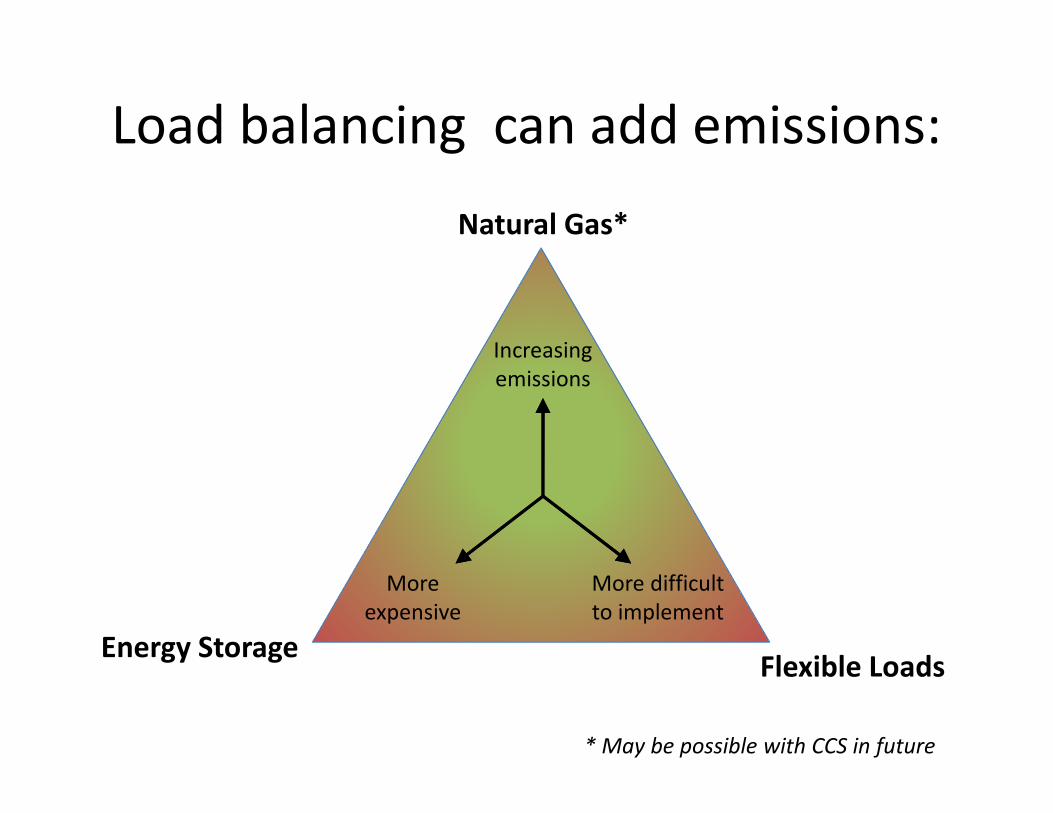
Natural Gas*
Flexible LoadsEnergy Storage
Increasing
emissions
More difficult
to implement
More
expensive
Load balancing can add emissions:
* May be possible with CCS in future

Zero-Emission Load Balancing (ZELB)

ZELB
• More challenging for the maximum renewables case
– GW-days of storage needed
– Smart grid solution is a challenge
• Smart meter fiasco
• Completely change business model to demand follows load vs load follows demand
• Need whole different system of system control – but will this ever solve the GW-day problem?
• Would be easier to have significant baseload power
– No more hydro likely
– Renew interest in geothermal energy
– Choose nuclear or CCS

Summary: Electricity
Nuclear
Fewest plants
Less load balancing
Existing laws,
safety, public
opinion, waste, etc.
Fossil/CCS
Similar to nuclear,
CO2 infrastructure
Reserve CCS for
decarbonized fuel?
Has emissions: 90%
capture
Renewables
3x plants as baseload
(160 vs. 50 GW)
More load balancing
and commitment to
ZELB

Are we going to have base load power?
• If yes, then:– Do we want to deal with the issues of nuclear power
or
– Can we do CCS /fossil for baseload?
• If no, then– Accept the emissions associated with load balancing with
natural gas?
– Commit to completely restructure the electric utility?)
– Will there be a major breakthrough in energy storage technology to handle GW-days of demand?
– Should we decide to give up on electricity reliability?

Nuclear and CCS technology binsBin Nuclear
Technology Coal or Natural Gas CO2 Capture CO2 Storage
1 Generation III+ reactors
High-efficiency coal gasification, high-efficiency natural gas combined cycle, ultra-supercritical pulverized coal combustion, solid-oxide fuel cell (SOFC), solvent separation
Injection into oil/gas reservoirs
2 Small modular reactors (LWR)
Post-combustion CO2 capture technologies with 90% capture efficiency, integrated gasification systems with CCS, amine solvent separation
Saline aquifer injection
3 Generation IV (including small modular Na-cooled reactors)
New capture methods with >90% effectiveness, lower cost CO2 capture technologies of all kinds, metal-organic framework separations, membrane separation
Coal bed injection
4 None None Shale injection

Renewable technology binsBin Wind Concentra-
ted Solar Power (CSP)
Solar Photovol-taic (PV)
Geothermal Hydro and Ocean
Biomass
1 Onshore, shallow offshore turbines
Parabolic trough, central receiver
Silicon PV, Thin-film PV, Concen-trating PV
Conventional geothermal
Conven-tional hydro
Coal/bio-mass co-firing, direct fired biomass
2 Dish Stirling Biomass gasification
3 Floating (deepwater) offshore turbines
”Third generation” PV
Wave, tidal and river turbines
4 High-altitude wind
Enhanced geothermal systems (EGS)

Load balancing technology bins
Bin Natural Gas
Storage* Demand Side Management
1 Combustion turbine
Pumped hydro Commercial-scale critical peak demand response
2 “First generation” compressed air energy storage (CAES), battery technologies (Na/S, advanced Pb/Acid, Ni/Cd, Li ion as found in electric vehicles)
Commercial time-of-use demand-side management
3 Variable fossil generation with CCS
Battery technologies (some advanced Pb/Acid, Vanadium redox, Vanadium flow, Zn/Br redox, Zn/Br flow, Fe/Cr redox, some Li ion), flywheel, “second generation” CAES
Residential time-of-use demand-side management

The median electricity case
• About equal parts of nuclear/renewable/CCS
• A robust choice
• Meets current RPS, but doesn’t exceed it
• ZELB “WAG”: Assume
– ½ load balancing is without emissions
– ½ is with natural gas
• Almost all emissions from electricity are from
load balancing

• Can’t electrify– Heavy duty transport
– Airplanes
• Plus fuel for– Load following
– High quality heat
• Biofuels are the choice in the pipeline– How much biomass?
– How green?
Still need
27 billion gge/yr fuel
that can’t have CCS

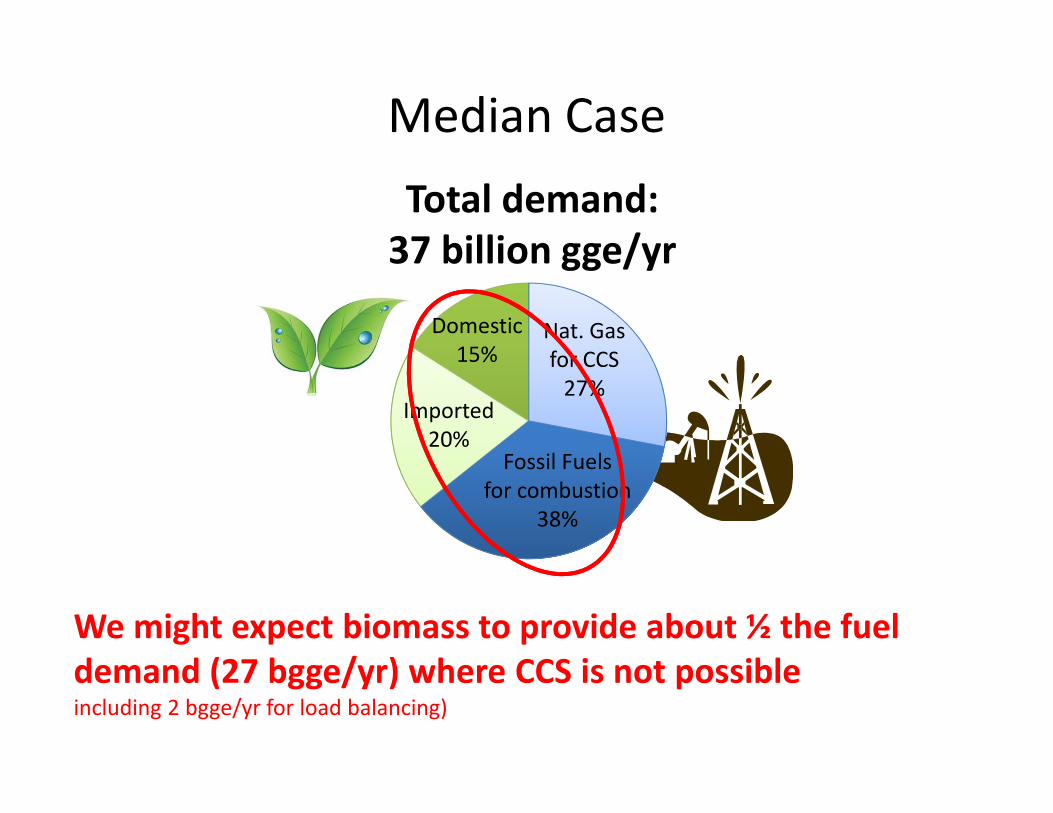
Meeting the demand for fuel
• Total demand: 37 billion gge/yr
• About 10 billion gge/yr are for gas based
electricity generation with CCS
• 27 billion gge/yr can not have CCS
– Heavy duty transport
– Airplanes
– Load following
– High quality heat
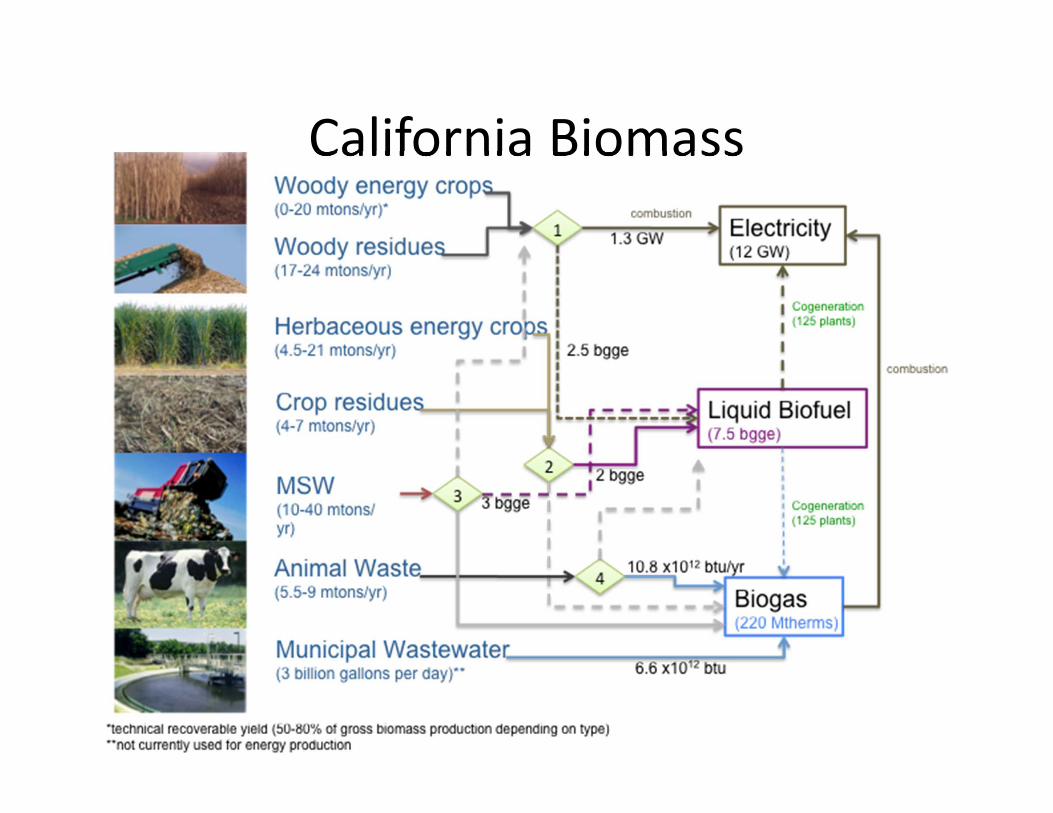
California Biomass

41-121
mdt/yr
3-10
bgge/yr
California Biomass

41-121
mdt/yr
5.5
bgge/yr
3 GW(2.0 bgge/yr)
+
7.5
bgge/yr
+
Imported
Median Case

5.5
bgge/yr
7.5
bgge/yr
+
Median Case
Fossil Fuels
for combustion
38%
Nat. Gas
for CCS
27%Imported
20%
Domestic
15%
Total demand:
37 billion gge/yr
13
bgge/yr
Median Case
Fossil Fuels
for combustion
38%
Nat. Gas
for CCS
27%Imported
20%
Domestic
15%
Total demand:
37 billion gge/yr
We might expect biomass to provide about ½ the fuel
demand (27 bgge/yr) where CCS is not possibleincluding 2 bgge/yr for load balancing)
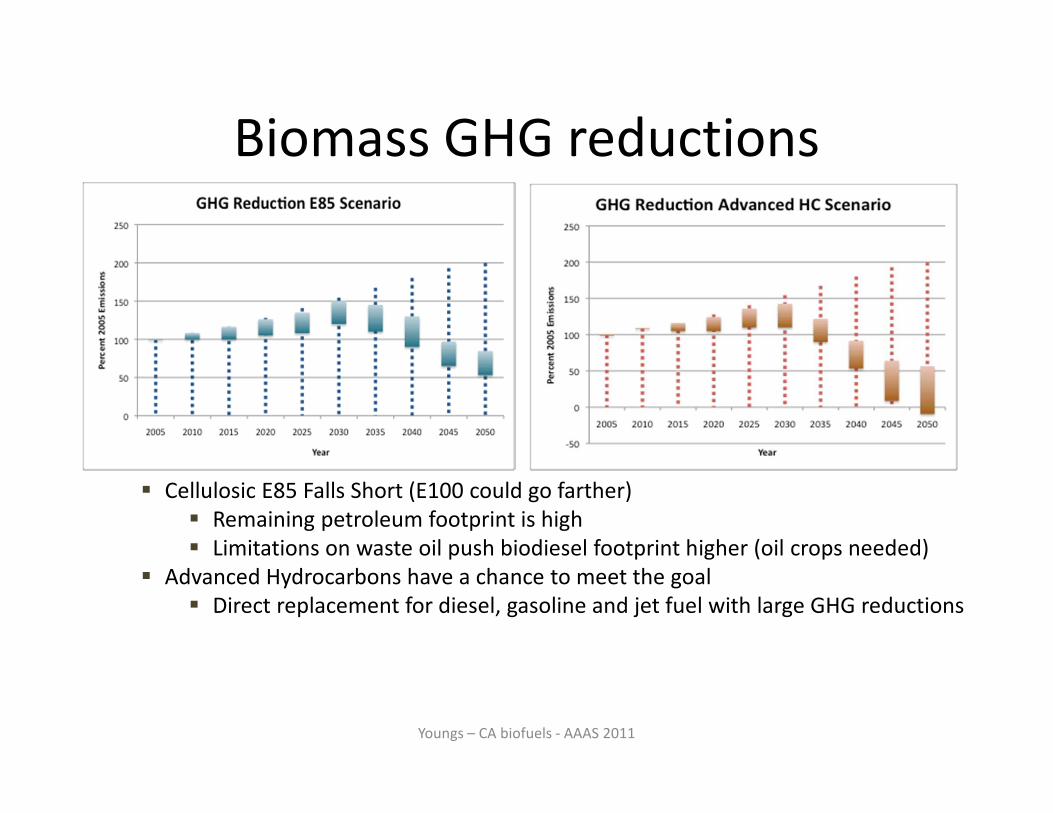
Biomass GHG reductions
Youngs – CA biofuels - AAAS 2011
� Cellulosic E85 Falls Short (E100 could go farther)
� Remaining petroleum footprint is high
� Limitations on waste oil push biodiesel footprint higher (oil crops needed)
� Advanced Hydrocarbons have a chance to meet the goal
� Direct replacement for diesel, gasoline and jet fuel with large GHG reductions
Best estimate: 80% below fossil

Biomass GHG Intensity and Supply

Historical and BAU Emissions
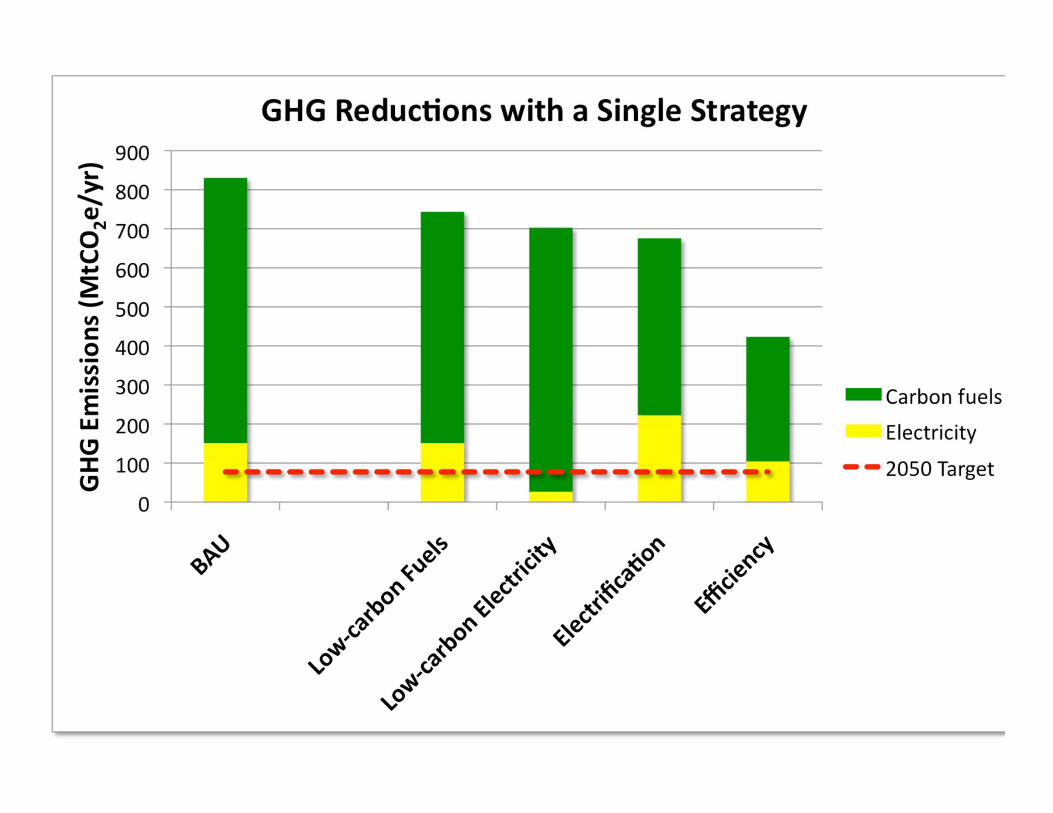
Getting to 60%: Any Single Action
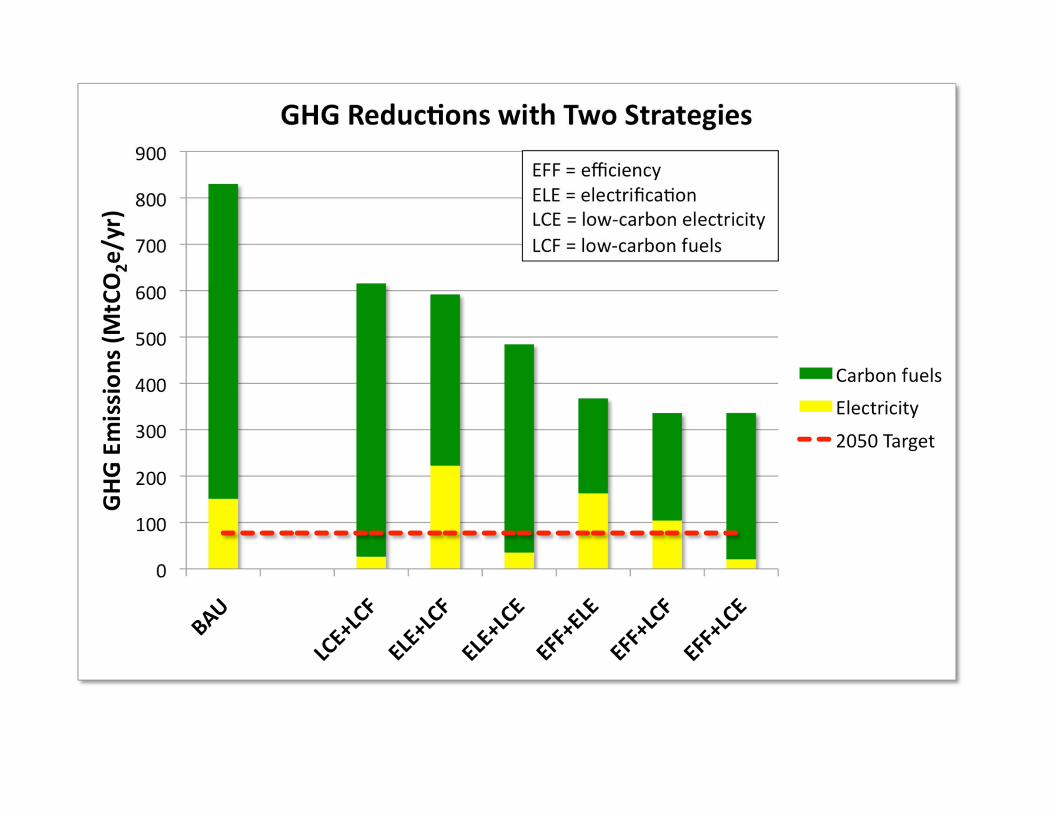
Getting to 60%: Any 2 Actions
Getting to 60%: Any 3 Actions

Getting to 60%: All 4 Actions
150
MtCO2e
per year

Efficiency Electrification
Low-Carb Fuels Low-Carb Electricity
Electrification saturation from BAU
Buildings 70% Cars 44%
Industry 12% Trucks 18%
Change in demand Airplanes 0%
Electricity +56% Bus, Rail 100%
Fuels -33% Marine 0%
Percent energy decrease from BAU
Buildings 40% Cars 60%
Industry 0-15%* Trucks 30%
*BAU 30-40% fr. 2005 Airplanes 50%
Electricity 31% Bus, Rail 0%
Fuels 52% Marine 40%
Nuclear
31%
Fossil/CCS
31%
Renewables
(incl. biomass)
33%
Load
Balancing
5% Nat. Gas
(+5% Flex. Load)
Fossil Fuels
for combustion
38%
Nat. Gas
for CCS
27%Imported
20%
Domestic
15%
20% GHG of
fossil fuels
Total demand: 37 billion gge/yr Total demand: 520 billion kWh/yr
Population: 50% increase from 2005 to 2050 GDP: 2.8% per year growth from 2005 to 2050
Components of a 60% solution

Strategies for Getting to 80%
1. 100% effective CCS
2. Eliminate fossil/CCS (use nuclear instead)
3. 100% ZELB for load balancing
4. Net-zero GHG biomass
5. Behavior Change (10% reduction in demand)
6. Biomass/CCS (20% of electricity, offsets fuels)
7. Hydrogen (30% replacement of HC fuels)
8. Double biomass supply
9. Biomass/Coal/CCS (make fuels + electricity)
10. Fuel from sunlight (need net-zero carbon source)
11. Fusion electricity
12. Others?

1.2 MWh
biomass/CCS
electricity
1 dry ton
biomass
80 gge
biofuels
-0.73 tCO20.11 tCO2
80 gge
fossil fuels
0.62 tCO2
+
Net GHG :
-0.1 tCO2
Net GHG:
0.1 tCO2
Biofuels Biomass/CCSvs.
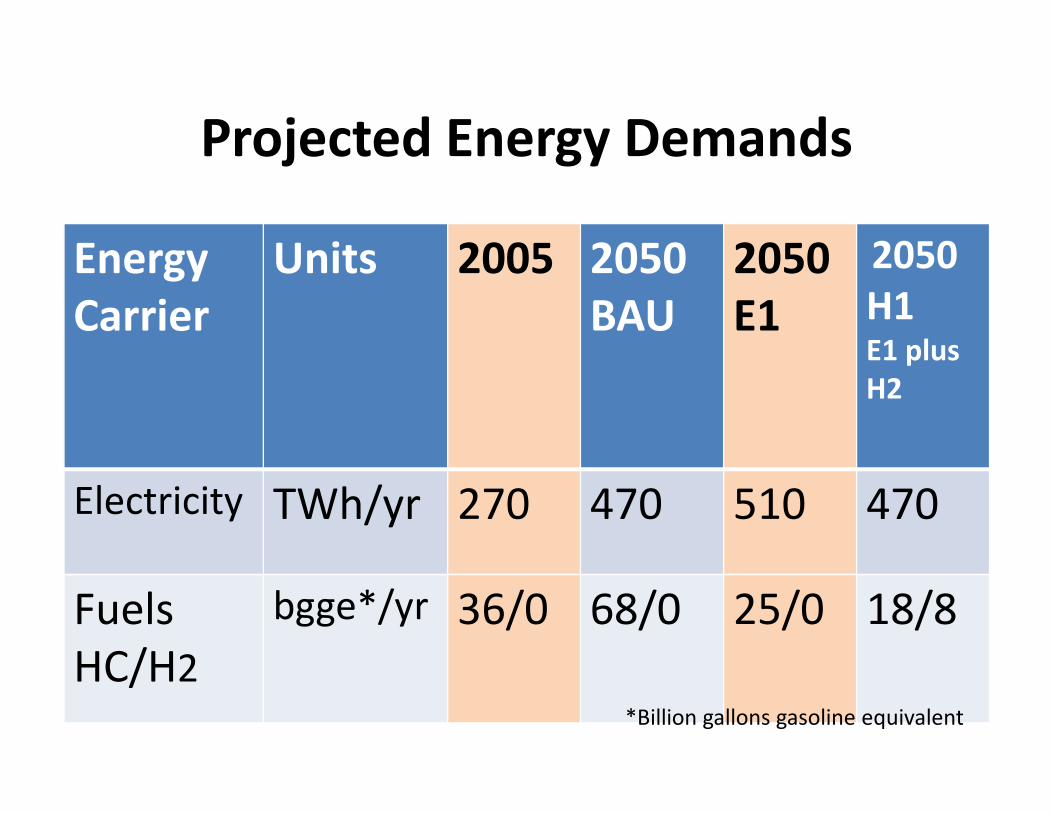
Projected Energy Demands
Energy
Carrier
Units 2005 2050
BAU
2050
E1
2050
H1E1 plus
H2
Electricity TWh/yr 270 470 510 470
Fuels
HC/H2
bgge*/yr 36/0 68/0 25/0 18/8
*Billion gallons gasoline equivalent

Hydrogen case
H2 demand rel. to median case
Buildings 0% Cars 22%
Industry 21% Trucks 9%
Fuel shifts Airplanes 0%
Electricity -49 TWh Bus 100%
Fuels -7.7 bgge Rail 0%
Hydrogen 8.0 bgge Marine 0%
H2H2 H2H2
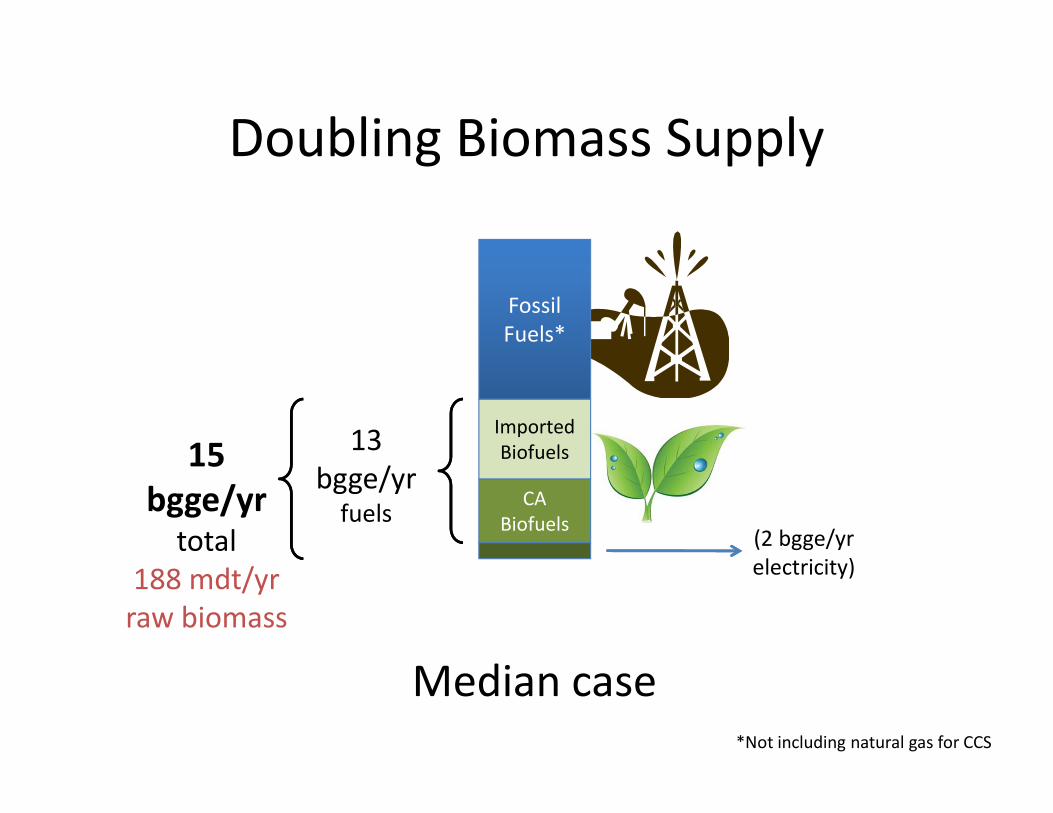
Doubling Biomass Supply
15
bgge/yrtotal
188 mdt/yr
raw biomass
CA
Biofuels
Imported
Biofuels
Fossil
Fuels*
(2 bgge/yr
electricity)
13
bgge/yrfuels
Median case*Not including natural gas for CCS

Doubling Biomass Supply
CA
Biofuels
Imported
Biofuels
Additional
CA
Biofuels
30
bgge/yrtotal
376 mdt/yr
raw biomass (2 bgge/yr
electricity)
CA grown?
Requires 62%
of CA land!

Doubling Biomass Supply
CA
Biofuels
Imported
Biofuels30
bgge/yrtotal
376 mdt/yr
raw biomass (2 bgge/yr
electricity)
Imported?
Requires 3x
base imports
(22.5 bgge/yr)

Getting to 80%: Single Strategies from
the median

Getting to 80%: Example Combinations
from the median

Advanced Technologies
• Fuel from sunlight
• Fusion: Really cheap electricity?
• What else could help?

Getting to 80%: Conclusions
• Biofuels are a promising, but risky, bet
• Alternative fuel pathways needed, e.g.,:– Hydrogen
– Fuel from sunlight (or cheap electricity = fusion)
– Probably others
• Other high-impact items important, e.g.,:– Zero-emissions load balancing (ZELB)
– Behavior change
• Multiple strategies required to get to 80%
H2H2

Conclusions
• Yes, we can: Achieve 60% below 1990 level
with technologies we largely know about
– The magnitude of the changes required and the
pace of implementation will not occur without
sustained and substantial capital investment and
policy interventions.

Key challenges:
• Need aggressive efficiency and electrification– not a technology issue
• Base load: Nuclear power and Fukushima incident vsCCS
• Load balancing without emissions needed – Especially for predominant without baseload
– Storage and smart grid technology gaps
• Biofuels are important and uncertain, and probably not sufficient
• Getting to 80% below 1990 level requires advanced approaches especially for fuel

Extra slides

Recommendation #1:
Achieving more than a 20% reduction
• Strengthen existing AB32-related laws and rules
• Ensure that aggressive performance standards are aligned with price signals to customers
• Ensure that the electricity infrastructure (e.g. vehicle recharging facilities and distribution transformers)
• Continually examine the low carbon fuel standard to ensure that it adequately addresses potential impacts on water, land, food, biodiversity, and perhaps social impacts (especially for biofuelsimports).

Recommendation #2
Getting to a 60% reduction• Ensure that all existing buildings are retrofit or replaced
• Effect rapid and ubiquitous electrification
• Ensure that new clean electricity is being developed at a rate of about 1.5 GW/yr (baseload) or 4.5 GW/yr (intermittent)
• Decide whether to develop this de-carbonized electric generation system with, or without, nuclear power
• Fill the low-carbon fuel gap with multiple strategies
• Advance carbon capture and storage, especially as a technology that supports low-carbon fuel production.
• Develop a plan for emission-free reliable electric load balancing

Recommendation #3
Monitor the implementation rate
• Monitor the rate of actual implementation for efficiency, electrification, clean electricity generation and de-carbonized fuel production, and provide an annual report of progress against plan, with a listing of the specific actions that are required to keep progress on target.
• The state needs to almost double the production of electricity by 2050, and at the same time decarbonize this sector. So, we need an average of 1.5 GW (baseload) or 4.5 GW (intermittent) near-zero carbon electricity generation every year from now until 2050.
• In 2050, the state will also need about 70% as much fuel as we use today.
• A standard part of the Integrated Energy Policy Report (IEPR) should look at the rate of new construction and implementation compared to the needed rate and remove barriers that can be eliminated without risk to public health and safety.

Recommendation #4:
Support the innovation needed to achieve
an 80% reduction• The State of California should foster, support and promote an
innovation ecosystem in energy including
– universities,
– national laboratories,
– small business,
– innovation hubs,
– regional clusters, etc.
• The California delegation should support federal funding for this activity

Recommendation #5:
Put in place the structure needed to
inform future portraits
• Consider the potential utility of the energy system-wide analytical tools (such as those developed for this project) in strategic planning and evaluate how to manage the future use of such tools to inform strategic decisions and investments.
• Keep track of all end-use requirements, sources of energy, energy delivery mechanisms and associated emissions – no cheating!
• The assumptions used in this report are very likely to change over time
• The tool can help to show the system-wide effects of policy choices.

Recommendation #6:
Maintain a long-term plan
• Determine the most desirable
2050 energy system
configurations from a
combination of economic, policy
and technology perspectives.