
Charles Denham, MD Chairman, TMIT Co-chairman, NQF Safe Practices Consensus Committee

REGULATION OF CHEMICALS: PRODUCT AND PROCESS TECHNOLOGY
AS A DETERMINANT OF THE COMPLIANCE RESPONSE
by
ADAM BENJAMIN AFFE
B.S., Massachusetts Institute of Technology(1976)
SUBMITTED IN PARTIAL FULFILLMENTOF THE REQUIREMENTS FOR THE
DEGREE OF
MASTER OF SCIENCE
at the
MASSACHUSETTS INSTITUTE OF TECHNOLOGY
SEPTEMBER, 1977
Signature of Author.................. ---Department of Chemical Engineering, Sep p 1be 5, 1977
Certified by..I
Thesis Supervisors........
Thesis Supervisors
Accepted by ........................... ...................................Chairman, Department Committee
1
ARCHIVES
MAR 1319780 .1~*h ~9

REGULATION OF CHEMICALS: PRODUCT AND PROCESS TECHNOLOGY
AS A DETERMINANT OF THE COMPLIANCE RESPONSE
by
ADAM BENJAMIN JAFFE
Submitted to the Department of Chemical Engineering
on September 15, 1977 in partial fulfillment of the requirements
for the Degree of Master of Science.
ABSTRACT
The relationship between the nature of a technology affected by an
environmental or safety regulation and the nature of the responses that
emerge as a result of the regulation is explored. A conceptual framework
for investigation is developed which may be applicable to many different
regulatory situations. In order to make a preliminary application of
this framework, the regulations affecting four chemical hazards (vinyl
chloride, polychlorinated biphenyls, mercury, and lead) are documented
and the affected technologies and the responses that emerged as a result
of these regulations are identified via literature research, contacts
with regulatory agencies, and interviews with affected firms. This
information is examined in terms of the conceptual framework, and
preliminary hypotheses about the technology-response relationship are
advanced.
It is hoped that this work will facilitate the construction of more
cost-effective regulations. There are two ways in which it could do
this. (1)It should help to identify the aspects of a particular tech-
nology which should be considered in designing a regulation that will
affect that technology; and (2)it should improve the ability of the
regulator to predict the consequences of regulations and to tailor
regulations to achieve particular objectives.
Thesis Supervisors: Nicholas A. Ashford
Senior Research Associate
Lawrence B. Evans
Professor of Chemical Engineering

ACKNOWLEDGMENTS
This thesis was written under the supervision of Dr. Nicholas A.
Ashford, Senior Research Associate at the MIT Center for Policy Alterna-
tives. My association with Dr. Ashford and the Center has been both
interesting and rewarding.
There are several individuals associated with the Center whom I
would like to thank for their contributions to this thesis. Dr. Dale
Hattis was a frequent source of ideas and suggestions. Dr. James
Utterback was kind enough to discuss my ideas with me and direct me to
some useful literature. I am particularly pleased to acknowledge the
help of Mr. George R. Heaton, Jr. George's door was always open, and his
cogent suggestions and criticisms were invaluable to me at every stage in
the development of this work.
The time and interest of the individuals in the regulated firms was
also appreciated. This work could not have been carried out without
their cooperation.
Finally, I would like to thank the National Science Foundation for
supporting this research, and the NSF and the Alfred P. Sloan Foundation
for supporting me personally during my graduate studies.

CONTENTS
ABSTRACT ............................................................. 2
ACKNOWLEDGMENTS .............................................. ....... 3
LIST OF TABLES AND FIGURES.......
CHAPTER ONE: INTRODUCTION
1.1 Background and Motivation.....
1.2 The Study of Regulation.......
1.3 Problem Definition ............
1.4 Research Design...............
References From Chapter One...
CHAPTER TWO: CONCEPTUAL FRAMEWORK
2.1 Introduction...................................
2.2 The Productive Segment and the Productive Unit
2.3 Characterizing Technologies...................
2.4 Characterizing the Compliance Response.........
2.5 A Priori Expectations Regarding the Compliance
Innovativeness ...........................
Caomprehensiveness........................
Hazard Isolation.........................
Cost......................................
Product Utility..........................
References From Chapter Two...................
Response.
................................... . 7
S8
S9
.12
.14
.16
..18
..18
.. 20
S.30
..34
..35
..37
..38
.,39
.. 39
..41
CHAPTER THREE: THE REGULATIONS AND THE PRODUCTIVE SEGMENTS
3.1 Selection of the Sample ....................................42
3.2 The Regulations ............................................ 44
4

Vinyl Chloride........................................44
PCB's.............................. ...................... 45
Mercury ............................................... 46
Lead .................................................. 47
3.3 The Productive Segments and Their Technologies ............. 49
Vinyl Chloride Monomer ................................ 51
Polyvinyl Chloride Resin .............................. 52
Polyvinyl Chloride Fabrication ........................ 53
PCB Manufacture ............. ......................... 54
PCB Substitute Manufacture............................. 54
Capacitor Manufacture.................................54
Transformer Manufacture...............................55
Chlorine-Caustic Production ........................... 55
Pesticide Formulation.................................56
Paint Formulation.....................................56
Pigment Manufacture...................................57
Paint Additive Manufacture ............................ 58
Gasoline Anti-Knock Manufacture ....................... 58
Petroleum Refining and Gasoline Production............59
References From Chapter Three .............................. 62
CHAPTER FOUR: THE OBSERVED RESPONSES
4.1 Introduction...............................................64
4.2 Vinyl Chloride.............................................66
4 .3 PCB 's...................................................... 72
4.4 Mercury....................................................75
4 .5 Lead ....................................................... 80
References From Chapter Four ............................... 84
CHAPTER FIVE: RESULTS AND TENTATIVE HYPOTHESES
5.1 Introduction.................................................87
5.2 General Observations.......................................89
5.3 Regulation of the Fluid Stage .............................. 90
5.4 Regulation of the Segmented Stage .......................... 92
5
5.5 Regulation of the Rigid Stage...............
5.6 Implications for Regulatory Design..........
The Fluid Stage.......................
The Segmented Stage...................
The Rigid Stage.......................
5.7 Assessment of the Approach and Suggestions
for Further Work .......................
...95
. .97
...98
...98
...99
............... 100
APPENDIX ONE: HAZARD SELECTION ..................................... 106
APPENDIX TWO: GLOSSARY OF ABBREVIATIONS............................108
.. ..... ... ...
.............

TABLES AND FIGURES
Table 2.1:
Table
Table
2.2:
2.3:
Figure 2.1:
Table
Table
Table
Table
Table
3.1:
3.2:
4.1:
4.2:
5.1:
Table 5.2:
Table 5.3:
Table 5.4:
Table 5.5:
Woodward's Classification of Technologies
by "Technical Canomplexity" .......................... 22
Hickson's Workflow Rigidity Scale ...................... 25
Hickson's Specificity of Evaluation
of Operations Scale ................................ 25
Product and Process Innovation in the
Abernathy-Utterback Model........................... 27
Regulations and Affected Productive Segments........... 50
Classification of Sample Productive Segments
by Stage of Technological Rigidity..................61
Sources of Information About Responses................. 65
Mercury in Paint as of 1977 ............................ 79
Classification of Sample Productive Segments
by Stage of Technological Rigidity..................88
Suggested Scale for Measuring Degree of Custom
Product Design.....................................102
Suggested Scale for Measuring the Innovativeness
of the Response...................................102
Suggested Scale for Measuring the Comprehensiveness
of the Response...................................104
Suggested Scale for Measuring Hazard Isolation
and Substitution..................................105

CHAPTER ONE
INTRODUCTION
1.Background and Motivation*
In recent years there has been an expanding awareness of the
problems of environmental degradation and hazards associated with the
workplace and consumer products. Environmental goals and concern about
these health risks have been injected into the political process, where
they sometmes compete with other social, economic and political goals.
The design of public policies involves making difficult trade-offs among
these goals. This work will not attempt to address those policy choices.
However, once a policy choice is made it must then be implemented.
One major tool for implementing policies relating to environmental and
safety problems is regulation. The purpose of this research work is to
facilitate the design of cost-effective and technologically appropriate
regulations.
Designing a regulation to achieve a particular policy goal is often
a difficult task, partly because it is not possible to know in advance
what the affected firms will do in response to the regulation. The
difficulty is compounded because regulations must not vary too much over
*The research underlying this work was supported by a National ScienceFoundation grant to the MIT Center for Policy Alternatives entitled"Environmental/Safety Regulation: Technological Responses and Innova-tion" (Grant No. PRA76-21368). Any opinions expressed herein are thoseof the author and do not neccesarily represent the views of the NSF, theCenter for Policy Alternatives or MIT.

time. Complying with these regulations frequently requires large sunk
capital costs; firms are not likely to make such investments if they are
not convinced that the regulation the investment is designed to meet is
permanent. If a regulation is changed, firms which complied originally
may incur extra costs in complying with the changes, while firms which
dragged their feet originally would then have an advantage. Therefore,
to achieve compliance and preserve their credibility, regulators have to
be prepared to stick with actions once taken. As a result, it would be
useful to improve the ability of the regulator to predict the outcome of
particular regulatory actions, and to distinguish situations which should
be treated differently for the purpose of regulation.
2. The Study of Regulation
Before describing the approach taken by this study, it is useful to
examine the findings of others who have studied regulation. Environmen-
tal and safety regulations on a large scale are fairly recent phenomena;
researchers have only recently begun to study them systematically.
However, there is an established body of literature on economic regula-
tion, which has a much longer history. (It is generally dated from the
Interstate Commerce Act of 1887.) There have been many detailed studies
of its effects. There is an accepted methodology for studying its impact
on technological change in the regulated industries.1 However, this
methodology is very specifically designed for predicting the effects of
traditional modes of economic regulation (rate-of-return constraints,
fixed markups, ceiling prices, barriers to entry, etc.). The constraints
imposed by regulations of this kind can easily be incorporated into the

economic analytical framework, allowing calculation of their effects
based on a specification of a production function and a behavioral
assumption (such as profit-maximization). The effects of constraints
imposed by an environmental or safety regulation cannot be predicted so
easily by this econanmic analytical framework. For this reason, this
particular methodology is not useful for the purpose of this study.*
In spite of the short history of environmental and safety regula-
tion, it is possible to identify at least three areas of investigation
relative to it:
* the politics of regulation and the process of agenda-set-ting and decision-making;
* evaluation of the costs and benefits of particular regula-tions or sets of regulations; and
* discussions of regulatory strategies and alternatives.
The first area is the domain of political scientists and general
social commentators. Particular attention has been paid to the problem
of air pollution: its transformation from a local problem to a national
problem, the passage of the 1970 Clean Air Act Amendments, and the
subsequent debate over the auto emission standards.2'3 This literature
is interesting as an insight into the political process and the various
public perceptions of these problems, but it is generally descriptive and
does not attempt to draw conclusions useful in the design of effective
*Even if the method were applicable to environmental and safety regula-tions, it would not yield the kind of answers sought here. The methodo-logy is used to predict general tendencies (such as a preference forcapital over labor as an input), not specific technological changes inresponse to regulation. Additional limitations of economic methods forthe purpose at hand will be discussed in Chapter Two, section 3.

regulations.
No particular discipline has a monopoly on the second area of
inquiry. Economists, lawyers, political scientists and others have
attempted to document the effects of regulation of drugs, chemi-
5 . 6 . 7 8cals, air pollution, water pollution, product safety, occupa-
tional safety, and other forms of regulation. This literature is
concerned with the evaluation of specific policy choices, and the
determination of the nature of the tradeoffs among those affected. It is
not concerned with drawing generalizable conclusions about the determi-
nants of regulatory outcomes.
In contrast, the last area is more directly relevant to the problem
at hand. There has been much analysis by many different experts of
particular regulatory tools,10 '1 1 '12
'1 3 ,14 and suggestions, mainly by
economists, of alternatives to traditional regulation.15,16,17 The
main problem with this literature is that it is primarily speculative,
with only anecdotal information on which to base its conclusions. Of
course, our experience with regulation is quite limited; as it increases
it will be possible to draw conclusions about different regulatory tools.
The regulatory choice does not produce a unique outcome by itself;
it does so only through the actions of the people and institutions which
are regulated. Obviously, different institutions may respond differently
to similar regulations. To design effective regulations, it would be
useful to understand what attributes of the regulated entity are impor-
tant determinants of the outcome of regulation. This understanding could
then be combined with the knowledge of different regulatory mechanisms to

design the appropriate regulation for different situations.
The regulatory half of the problem has been and is intensively
studied. This work will investigate the regulated entity as a determi-
nant of the response. Ideally, to do this one would like to examine the
outcomes of similar regulations on a variety of different regulatory
objects. Unfortunately, such a "natural experiment" does not exist; the
regulations affecting different entities are usually also different.
Since one cannot "control" for regulatory differences as determinants of
differences in outcomes, it may be difficult to draw definite conclusions
about how the attributes of the regulated entity determine the outcome.
Both influences must be kept in mind and an attempt must be made to try
to sort out cases where one or the other is dominant.
Because of this difficulty, and because there is no previous work in
this area upon which to draw, it will not be the goal of this work to
produce proven conclusions about the determinants of regulatory out-
comes. Rather, an attempt will be made to construct preliminary hypo-
theses about the process, which can serve as a framework for later
research and verification.
3.Problem Definition
The outcome of a regulatory action has no precise boundaries; it is
a sum of effects which propagate through the economy and society.
However, a large term in this sum, and the key to all the others, is
likely to be the first one: the direct response of the institutions being
regulated. This response will determine most of the environmental,
economic and social impacts.

This response will usually have several dimensions; it may involve
legal and political action, organizational change, and technological
change. Similarly, the attributes of the responding unit which determine
these various responses may be organizational, economic, personal,
technological, etc. Most likely a combination of such factors will
interact with regulation to yield the various kinds of responses.
To make a useful initial contribution to the understanding of such a
complex system it is necessary to narrow the focus to the dimensions
which are most important and useful in designing regulations. In the
long run, the important environmental, health, and economic effects will
result from the technological changes that occur; the legal and poli-
tical responses are primarily important because they may delay or modify
the technological response. For this reason, this study will consider
the technological response. In addition, it will be limited to the
changes which come about as a direct result of regulation. The term
compliance response will be used to mean the sum of all changes in the
product or processes of the affected unit which are implemented to move
the unit towards compliance with the regulation. To speak of a canp-
liance response does not imply that compliance is achieved; the response
may only move in that direction. Of course, it is also possible that
there will be no compliance response at all.
The technology employed by a regulated unit before a regulation
arises obviously constrains the changes that the unit can undertake, and
it may deeply affect the way it perceives and approaches the problem
posed by regulation. Therefore, existing technology is likely to be an

important determinant of the compliance response. Moreover, understan-
ding of the role played by technology in determining the response could
be easily incorporated into regulatory design because information about
the technology is readily available and regulations frequently are
addressed to technologically homogeneous groups. Information about
personal or organizational factors is harder to obtain and to use in
regulatory design. Economic factors can be and are frequently consi-
dered. This very fact of frequent use suggests that they are better
understood and are not in as great a need of exploration.
4.Research Design
The first task in this research effort is to develop a conceptual
framework for addressing the problem of technology as a determinant of
the compliance response. This requires a specification of the entities
which will be considered to respond to regulation, the development of a
way to characterize technologies, the development of a scheme for
characterizing compliance responses, and consideration of a priori
expectations with respect to the technology-response relationship.
The second task is the identification of a sample of regulations and
affected technologies for an initial application of the conceptual
framework. This involves the selection of some regulations and suffi-
cient documentation of those regulations to understand the responses, and
the identification of the affected technologies and the characterization
of those technologies according to the approach developed in the first
task.
The third task is to document the changes that emerged in response

to the regulations, and to characterize those responses according to the
approach developed in the first task.
The fourth and final task is the construction of simple hypotheses
about the role of technology as a determinant of the cacmpliance res-
ponse. These hypotheses will be developed from the conceptual framework
in conjunction with the observations made in the initial sample applica-
tion.
A chapter of this report is devoted to the discussion of each of
these tasks. Chapter Two is devoted to the development of the conceptual
framework. Chapter Three explains the sample selection and describes the
regulations and technologies contained in the sample. Chapter Four is
devoted to the responses. Chapter Five brings together the a priori
expectations and the lessons of the observed sample to yield likely
hypotheses, speculates on the implications of this work for regulatory
design, asesses the overall usefulness of the approach, and makes scme
suggestions for useful future work.

REFERENCES FROM CHAPTER ONE
1. Capron, William, ed., Technological Change in Regulated Industries,Brookings, 1971
2. Jones, Charles 0., Clean Air, University of Pittsburgh Press, 1975
3. Ingram, Helen, "The Political Rationality of Innovation: The Clean
Air Act Amendments of 1970," mimeo (1976)
4. e.g. Pelzman, S., "An Evaluation of Consumer Protection Legisla-
tion: The 1962 Drug Amendments," Journal of Political Economy, 81:5, p. 1049 (1973)
5. e.g. MIT Center for Policy Alternatives, The Impact of GovernmentRestrictions on the Production and Use of Chemicals, CPA-76-3 (1976)
6. e.g. National Academy of Sciences-National Academy of Engineering,Costs and Benefits of Automobile Emission Control, report to theCanmittee on Public Works of the U.S. Senate, 93-24 vol. 4
7. e.g. Peskin, H.M., ed., Cost-benefit Analysis and Water Pollution
Policy, Urban Intstitute, 1975
8. e.g. Kelman, S., "Regulation by the Numbers--the Consumer Product
Safety Commission," The Public Interest, 36: 82 (1974)
9. e.g. MIT Center for Policy Alternatives, Economic and Social Impact
of Occupational Noise Exposure Regulations, EPA 550/9-77-352 (1977)
10. Rosenberg, Nathan, "The Direction of Technolgical Change: Induce-
ment Mechanisms and Focusing Devices," Economic Development and
Cultural Change," 18: 1 (1969)
11. Atkinson, Scott E. and Donald H. Lewis, "Cost-effectiveness Analysisof Alternative Air Quality Control Strategies," Journal of Environ-
mental Economics and Management, 1: 237 (1974)
12. Greenfield, S.M., "Incentives and Disincentives of EPA Regulations,"
Research Management, 17: 11 (1974)
13. Schwartz, W.F., "Mandatory Patent Licensing of Pollution Control
Technology," Virginia Law Review, 57: 719 (1971)
14. Crocker, T.D., "On Air Pollution Control Instruments," Loyola
University Law Review, 5: 280 (1972)
15. ibid

16. Irwin, W.A. and R.A. Liroff, Economic Disincentives for PollutionControl: Legal, Political, and Administrative Dimensions, EPAOffice of Research and Development, July, 1974
17. Spence, Michael, and Martin Weitzman, "Regulatory Strategies forPollution Control," mimeo (1976)

CHAPTER TWO
CONCEPTUAL FRAMEWORK
1. Introduction
The first section of this chapter defines what is meant by "a unit
responding to regulation." The second section distills from the sociolo-
gical literature on technology a way of distinguishing technologies which
may be likely to yield different compliance responses. The next section
develops a set of attributes of responses which captures the aspects
important to regulatory design. The final section brings these together
to suggest the likely role of technology in determining the response.
2. The Productive Segment and the Productive Unit
The entity or entities which are identified as responding to regula-
tion must employ a single identifiable technology if conclusions about
technology as a determinant of the response are to be drawn. In this
work, two related concepts--the productive segment and the productive
unit--will be used for this purpose.
The productive segment is comprised of all economic activities
employing a particular technology to produce a line of related products.
Obviously, the typical productive segment includes parts of many diffe-
rent firms. Conversely, a large, integrated firm would not be classified
within one productive segment.
The productive unit is that member of a particular productive

segment which is contained within a single firm. (Alternatively, it
could be defined as that portion of a particular firm which employs a
distinct technology.) Thus, both the segment and the firm are sets of
productive units; the units in the firm have different technologies but
the same ownership, while the units in the segment have different owner-
ship but the same technologies.
The decisions about how to respond to a regulation are made within
the productive unit and the firm. These decisions will be influenced
partly by firm-specific and non-technological factors. Therefore, all of
the units in a segment may not respond to a regulation in the same way.
However, to the extent that technology is a major determinant of the
response, one would expect similarity among the responses in a particular
segment. This work will consider the response of a productive segment to
regulation, i.e. the set of responses emerging from the units within that
segment. In each case the degree of uniformity of such responses within
the segment as a whole will be noted.
The units making up productive segments are not fixed over time. If
the technology employed by different units within a segment evolves
differently over time, then at some point what was considered a distinct
segment no longer has a single identifiable technology. The units that
were in that segment now comprise two or more distinct segments. Regula-
tion may induce such a change if the responses of the units in a pre-re-
gulation segment are radically different from each other.
The segment or segments which respond to a particular regulation
will not in general be limited to those directly regulated. They may be

customers of or suppliers to the regulated segments, or any other segment
that perceives the regulation as a market opportunity.
3. Characterizing Technologies
It is possible to identify at least three contexts in which people
have attempted to characterize technologies: economics, organizational
sociology, and management science. Economists specify the technology of
a firm using a production function. The specification of a production
function can generally tell one the following things about a technology:
* the inputs to the process and their relative contributionto the final product,
* the elasticity of substitution among the inputs, and
* the "returns to scale" inherent in the technology.
The main purpose of the production function specification is to calculate
the cost-minimizing input combination and from that to derive the cost
function for the firm and the supply function for the industry.
Unfortunately, this abstract characterization does not capture the
detailed qualitative distinctions among technologies which may be crucial
in determining the differential responses to regulation. Further, it is
a static model, and the object of our inquiry is the change that may be
likely to emerge from a particular technology under regulation. There-
fore, the characterization of technologies by production function is not
suitable for the purpose at hand.
Sociologists have been interested for some time in the role played
by technology in determining the organizational structure of the working
group or firm.* In the course of investigating this issue, they have
*In passing, it should be noted that this question is itself relevant tothis research. If technology does affect organizational structure, then
20

developed methods of characterizing technologies. Several of these will
be discussed here, in the approximate order in which they were developed.
James Thomson and Frederick Bates suggested "rigidity" as a charac-
terization of technologies. This depends on "the extent to which the
appropriate mechanics, knowledge, skills and raw materials can be used
for other products." 2
Joan Woodward has identified eleven catagories of production techno-
logies. As illustrated in Table 2.1, the categories consist of a nine-
point scale of "technical complexity" and two "mixed categories" which
involve combinations of the others.3 Woodward also points out that the
scale is one of chronological development; "the production of unit
articles to customers' individual requirements being the oldest and
simplest form of manufacture, and the continuous-flow production of
dimensional products, the most advanced and complicated." 4
Charles Perrow has suggested that technologies be placed along a
continuum from "routine" to "nonroutine." Further, he distinguishes two
dimensions to the notion of routineness: (1)the number of exceptional
cases encountered in the work, and (2)the degree to which logical analy-
tical procedures are employed to deal with exceptions when they do
arise. As examples he cites the aerospace industry (nonroutine: many
(continued from previous page)what appear to be effects of the technology on responses may be due in
part to organizational effects, in which case conclusions about the
causal mechanism involved in the technology-response relationship would
be difficult to draw. Unfortunately, this issue has not been resolved.
Some researchers claim to have found significant co relation betweentechnological factors and organizational structure, but other resear-
chers dispute these findings.7,9

TABLE 2.1
WOODWARD'S CLASSIFICATION OF TECHNOLOGIES BY
"TECHNICAL COMPLEXITY"
1. Production of units to customers' requirements
2. Production of prototypes
3. Fabrication of large equipment in stages
4. Production of small batches to customers orders
5. Production of large batches
6. Production of large batches on assembly lines
7. Mass production
8. Intermittent production of chemicals in multi-purpose plant
9. Continuous flow production of liquids, gases, and crystalline
substances
10. Production of standardized components in large batches subse-
quently assembled diversely
11. Process production of crystalline substances subsequently
prepared for sale by standardized methods.

exceptions, no analytical methods), craft industries (intermediate: few
exceptions but no analytical methods), heavy machinery (intermediate:
many exceptions but analytical methods), and steel mills (routine: few
exceptions and analytical methods). 5
Amber and Amber have developed a ten-fold characterization of the
"order of automanaticity" of a technology.6 The factor which determines
the order of automaticity is the human attribute which is mechanized.
The ten categories correspond to the mechanization of no human attri-
butes, then energy, dexterity, diligence, judgment, evaluation, learning,
reasoning, creativeness and dominance. Examples range through shovels,
electric hand tools, machine tools, production lines, process control,
dynamic positioning, sophisticated dispatching and weather forecasting.
(Amber and Amber leave examples of the higher orders of automaticity to
the imagination of science fiction writers.)
Perhaps most important among the sociologists, David Hickson and his
colleagues at the University of Aston distinguish three facets of tech-
nology:7
* operations technology,
" materials technology, and
* knowledge technology.
James Taylor uses a similar formulation in his study of technology as a
determinant of organizational change.8
Hickson, el. al. note that Perrow's "number of exceptions encoun-
tered" is an aspect of materials technology, and his "use of analytical
methods" is an aspect of knowledge technology. They go on to develop a

detailed characterization of operations technology. They call their
characterization "workflow integration", and it consists of four subcon-
cepts:
* automaticity,
* continuity,
* workflow rigidity, and
* specificity of evaluation of operations.
For the first subconcept they use Amber and Amber's scale, and for
continuity they use a modification of Woodward's "complexity" scale. For
workflow rigidity they developed the scale presented in Table 2.2.
Essentially, this scale measures the degree of interdependence of the
operation steps as well as the rigidity of the process in the Thomson and
Bates sense of applicability to a variety of purposes. Finally, they
developed the three-point scale presented in Table 2.3 for specificity of
evaluation operations.
Peter Blau, et. al. constructed a somewhat similar scale, based
solely on automaticity and a modification of Woodward's complexity
scale. They suggest that this scale yields results similar to those
of Hickson, el. al, and has the virtue of simplicity.
In the management literature, the work of primary importance for the
purpose at hand is that of Abernathy and Utterback.10,11 They are
concerned with the management of technological enterprises, improvement
of productivity, and technological innovation. They combine the ideas of
complexity, rigidity, and integration of operations technology (which
they call process technology) with a parallel idea of product techno-

TABLE 2.2
HICKSON'S WORKFLOW RIGIDITY SCALE
One point is assigned for a positive answer to any of the following
conditions, yielding an eight point scale:
In the event of a breakdown all workflow stops immediately
No waiting time possible
No buffer stocks and no delays possible
Single source input
Single purpose equipment
No rerouting of work possible
In the event of a breakdown, some workflow stops immediately
Production or service line or lines
TABLE 2.3
HICKSON'S SPECIFICITY OF EVALUATION OF OPERATIONS SCALE
1. Personal evaluation only
2. Partial measurement (some aspects of outputs)
3. Measurements used over virtually the whole output(s), to
compare against precise specification (blueprint or the equi-valent)
logy.* They then argue that the rate and direction of technological
change in a productive unit depends on the nature of its product and
process.
Utterback and Abernathy visualize an evolutionary process whereby
product and process technology develop together fr6m an initial stage in
which the product is poorly defined and rapidly changing and the process
is uncoordinated and based on general purpose equipment, through an
intermediate stage in which the product begins to standardize and por-
tions of the process are automated and optimized, to a final stage in
which the product is a highly standardized commodity and the process is
automated, integrated and large scale. As shown schematically in Figure
2.1, in the initial stage the product changes rapidly while little
attention is paid to the process; as the product begins to be standar-
dized this makes possible a rapid increase in process change; finally
the rates of both kinds of change level off as product and process become
standardized.
The early stage is characterized by the attempt to maximize the
performance of the product; price may not be important within some
range. As standardization progresses, the emphasis may shift to sales
maximization as the enterprise tries to grow and insure a market share
for itself when the product market stabilizes. In the final stage, the
emphasis shifts once again, this time to cost-minimiztion, and canompeti-
tion is on the basis of price because all the competing products are
*This notion of the separate but parallel existence of process andproduct technology is a major contribution of Abernathy and Utterback'swork.

Process
Uncoordinated Segmented Systemic
FIGURE 2.1
PRODUCT AND PROCESS INNOVATION IN THE ABERNATHY-UTTERBACK MODEL

similar in quality. Abernathy and Utterback call the three stages
uncoordinated, segmented, and systemic.
In Abernathy and Utterback's work, rigidity is used simultaneously
to mean the inherent physical rigidity of a technology and also the
historical change or lack of change in a productive segment. That is, a
fluid segment is characterized by both an inherently fluid product and
uncoordinated process and by a recent history of frequent product
change; a rigid segment is characterized by both a standardized product
and highly integrated process and a recent history of little product or
process change. Further, Utterback and Abernathy's work suggests that
the likely future pattern of change can be predicted based on the recent
past, and hence can also be predicted based on the physical rigidity of
the technology at a given point in time.
In the present work, segments and units will be characterized as
rigid or fluid without reference to historical trends. However, based on
the Abernathy-Utterback model, the historical pattern of change will be
inferred from the physical rigidity of the technology at the time when a
regluation is imposed.
This study is concerned with technological change in response to
regulation. If units respond to regulation in exactly the same way that
other technological changes are undertaken, then the Utterback-Abernathy
model would suggest that the kind of response that is most likely can be
predicted by examining the physical* rigidity of the segment. Although
*Henceforth the word "physical" will be omaitted; rigidity will always beused in the sense of inherent physical rigidity of a technology at aspecific point in time.

the simultaneous stimulus and constraint imposed by regulation may be a
unique situation for the productive unit, generalizations from the
"normal" pattern of change may still apply. Since there is no model to
be used of the process of responding to regulation, the best approach is
to start with a general model, such as that suggested by Abernathy and
Utterback's work, and proceed to try to determine what modifications are
necessary to account for the unique features of regulation.
An additional reason for using some notion of rigidity for charac-
terizing technologies is the fact that a number of different workers in
different areas have arrived at fairly similar (or at least related)
characterizations of technology. As the above discussion shows, Thomson
and Bates' "rigidity," Woodward's "complexity," Perrow's "routineness,"
Amber and Amber's "automaticity," Hickson's "integration," and Abernathy
and Utterback's "stages of development" all are somewhat different
aspects of the same notion. There is a rough overall continuum that runs
from less rigid, less complex, less routine, less automated, less inte-
grated and more fluid to more rigid, more complex, more routine, more
automated, more integrated and more systemic. Because of the exploratory
nature of this study, it is not necessary to choose a particular scale or
measure of technology to begin with. Rather, it would seem most useful
to use the general notion of rigidity, keeping in mind the aspects of
rigidity suggested by different workers, and the notions of materials,
operations, product, and knowledge technology. To summarize, in charac-
terizing technology the following aspects of rigidity will be considered:
* narowness of equipment function and interdependence ofprocess steps (Thomson and Bates and Hickson, et. al.),

* degree of automaticity (Amber and Amber),
* continuity of the production process (Woodward and
Hickson, et. al.),
* degree of standardization of inputs (Perrow) and outputs
(Abernathy and Utterback), and
* price versus quality as the basis of competition
(Abernathy and Utterback).
As in Abernathy and Utterback's work, the continuum of rigidity will
be abstracted into three stages, recognizing that the lines between them
may not be clearly drawn. Since a strictly operational measure of
rigidity is lacking, it would be impossible to rank segments absolutely
along the continuum; but it is not hard to group than into approximate
stages. Since productive units and productive segments both were defined
as having a single identifiable technology, either can be characterized
at any point in time as fluid, segmented, or rigid. Of course, a unit or
segment may become more or less rigid over time. Regulation may, in
fact, result in a change in the rigidity of a unit or segment.
4. Characterizing the Compliance Response
One characteristic of a response which is useful to identify is
simply whether it involves product change, process change, or both. As
indicated earlier, the Abernathy-Utterback model predicts that one or the
other is more likely in different stages of rigidity. When a given
regulation could be met with either product or process change, it would
be useful to predict which is more likely.
Beyond the product-process distinction, it is necessary to develop a
method of characterizing responses which can assist in forming the basis

for the evaluation of responses in the regulatory context. It must
capture elements of the response which determine the broadly construed
costs and benefits of the outcome.
This study will not, however, attempt to quantify the environmental
and health effects which were the explicit goal of the regulations
considered. Although it is a crucial task, and one which regulators
routinely attempt to perform, it is beyond the purpose of this study.
Instead, the consequences of the particular method chosen to meet the
regulation (i.e. the compliance response) will be explored. The specific
nature of the compliance response will determine both the direct and
indirect costs of compliance and the indirect environmental effects
beyond those intended by the specific regulation.
A set of attributes important for evaluating the effects of the
compliance response has been developed. It includes:
* the degree to which the response is innovative,
* the degree to which the response is comprehensive,
* the degree to which the response results in greateroverall isolation of hazards from the environment, orsubstitution of safer materials for hazardous ones,
* the net cost of the response to the affected unit, and
* any effects on the utility of the unit's product.
An innovative response is one that incorporates a new technological
idea, or an existing idea in a context or manner significantly different
from that of its previous use. To be innovative, a change need not be a
major (i.e. camprehensive) one; a minor modification is innovative if the
idea is new. The innovativeness of the response is important because new

technologies may provide improved solutions for other problems or for
similar problems in another industry. Thus there is a potentially
signigicant external benefit in innovation.
The comprehensiveness of the response applies both to the product
and the process. It measures the extent to which the response permeates
the entire process or product. Just as a change need not be canprehen-
sive to be innovative, a change need not be a new idea (i.e. innovative)
to be caomprehensive. Both quantitative canprehensiveness (e.g. every
valve in the process checked or replaced) and qualitative comprehensive-
ness (some segment of the product or process completely redesigned) are
important.
Sametimes, environmental and safety problems can only be solved by
transferring the hazard from one place to another (e.g. from the work-
place to the atmosphere or from the atmosphere to the water), or by
replacing a hazardous material with which may also cause environmental or
safety problems. Ultimately, it would be desirable to permanently
isolate the hazards fran both people and the environment. Therefore, an
indicator of possible indirect health and envrionmental effects is the
degree to which the response results in greater overall hazard isola-
tion. This may be achieved by improving the physical integrity of the
production process to prevent hazard release or by replacing the hazar-
dous material with one which is known to be safer. Together with compre-
hensiveness, this will indicate whether the problem is likely to crop up
in a new form at a future date.
The net cost of compliance to the firm must take into account money,

manpower, and other resources expended, any loss in output that results,
and any benefits, such as material savings, which accrue. Transition
costs associated with the process of change and continuing costs of
compliance must be distinguished, though both are relevant.
Finally, if the utility of the product is improved or lessened by
the compliance technology, this is an important element of the response.
These dimensions are not wholly independent; for example, other
things being equal, a more comprehensive response will cost more. But
each dimension tells something about the response not captured by the
others; knowing a response was more comprehensive makes a difference
above and beyond the cost difference. Also, these are obviously not the
only dimensions that could be considered. However, in thinking about the
universe of possible responses, these features have been identified as
the most important for evaluating possible compliance technologies in the
context of regulatory decision-making.
It should be emphasized that an attempt will not be made to perform
actual evaluations of technologies. Whether innovativeness or comprehen-
siveness is good or bad is not the issue here; indeed, each is almost
surely good in some cases and bad in others. The intent here is to
improve the ability of the regulator to tune the systemi to yield techno-
logies with particular attributes, not to try to decide which attributes
are in fact desirable.
Part of the purpose of applying this conceptual framework to a
sample of observations will be to determine if these attributes are
possible to identify and if they seem adequate to capture the crucial

differences among responses. It is hoped that this formulation for
characterizing responses can be improved upon in the process.
5.A Priori Expectations Regarding the Compliance Response
In order to facilitate the process of examining a sample of regula-
tions, technologies and responses, it is desirable to enunciate expecta-
tions with respect to the problem being studied. Otherwise, there would
be no guideposts for the examination of the data, and it is unlikely that
useful hypotheses would emerge.
This is not to say that these expectations are hypotheses to be
tested and then either accepted or rejected as they stand. Rather, they
will be examined in the light of the sample and educated judgment will be
used to modify them if possible and if necessary to arrive at what seem
to be likely hypotheses. Such freedom and judgment are crucial at this
exploratory stage.
The Abernathy-Utterback model makes direct predictions about the
degree and kind of change likely from productive segments in different
stages of rigidity operating in a stable political and economic environ-
ment. Fluid segments are likely to yield major product change, while the
process, being general-purpose and uncoordinated, is unlikely to be ripe
for any kind of change. In the intermediate (segmented) stage, the
process is ready for major change, while the product has somewhat less
flexibility and so is somehat less likely to change. In the final stage
there is little rooan for product change; the process, being highly
integrated, is subject to incremental modification but not major change.
To construct a priori expectations about likely responses to regula-

tion, this "normal" model must be examined to try to foresee circum-
stances in which the response to a regulatory stimulus might diverge from
the normal pattern of change. In this section are discussed the implica-
tions of the "normal" model for each of the attributes (introduced in the
previous section) of product and process change, along with some
suggestions of likely deviations from the normal pattern in the case of
regulation. A priori expectations will be formed using the predictions
from the normal model in cases where there is no obvious reason to
believe that these are inapplicable, and modifications of the normal
model where these appear to be necessary.
Innovativeness
With respect to the likely innovativeness of the response, it would
seem that the normal model would apply to responses emerging from the
fluid and segmented stages. That is, in the fluid stage, product innova-
tion is expected to be quite likely, because such innovation is easy due
to the flexibility of the product, and because the trend in such segments
is usualy product innovation. Process innovation is not likely, because
the primitive nature of the process makes it hard to work with, and
because the emphasis in the segment is on product rather than process
modification.
Thus, if the product of a fluid segment is regulated, an innovative
product modification or substitution might be expected to result; the
process is unlikely to change. If the process is regulated one might
still expect the fluid segment to attempt to comply via a product

change,* since process change is so difficult and unfamiliar. This
product change may very well be innovative.
In the segmented stage, product innovation is still a possibility,
but it is somewhat less likely because the product has begun to be
standardized and the emphasis has shifted to process change. Process
innovation is quite likely because the process has begun to be rationa-
lized and is ripe for change, and because process improvement is the
major concern of such segments.
Product regulations affecting the segmented stage may lead to
product innovation, although it is less likely than in the fluid stage.
Process regulations can be expected frequently to lead to process innova-
tion.
In the rigid state, deviation from the normal pattern is expected.
The normal model would predict little product or process innovation
because the product has become highly standardized, the process highly
integrated, and the whole product-process system optimized in its present
configuration. However, regulation my simply demand a change. Since the
product is highly standardized and product change has not been pursued
for a long time, any change would probably be highly innovative. Since
the process is so integrated, major change is not likely to occur without
total redesign, which may very well also be innovative.
Thus, one would not expect product regulation of the rigid stage to
result in innovation, although occasionally a highly innovative product
*Note that process regulation can sometimes be met with a product change(e.g. if the process is leaking a hazardous material the product can beredesigned without the material as an ingredient), but a product regula-tion cannot be met solely by process change.
36
change may result. Process regulation is likely to lead to minor non-
innovative process changes, but occasionally a highly innovative response
may result.
Obviously, all of these results depend to some degree on the "seve-
rity" of the regulation. A very non-severe regulation is unlikely to
elicit any change from the affected segments. However, the effective
severity of a regulation is derived from the inherent ability or inabi-
lity for change of a technology, in addition to the actual magnitude of
the change which is mandated. Thus a "severe" regulation (such as
requiring a very large reduction in worker exposure to a chemical) may,
in fact, not have severe effects, while a "non-severe" regulation (requi-
ring a smaller reduction) may be a very difficult one with which to
comply if the technology is difficult to change.
Comprehensiveness
With respect to comprehensiveness, the expected results parallel
those expected for innovativeness. In the fluid stage, product regula-
tion would be expected to lead to major product change and little process
change. Process regulation may produce some process change, but it is
unlikely to be comprehensive because a certain degree of order in the
process is necessary before really comprehensive process change can be
undertaken. Again, if a process regulation can be met with a product
change, this is quite likely in the fluid stage.
In the segmented stage, product regulation may lead to some product
change, but it is not as likely to be comprehensive as in the fluid
stage. Process regulation will quite likely to lead to comprehensive

process change.
In the rigid stage, product regulation is unlikely to be successful
in comprehensively changing the product, although if change is absolutely
necessary radical change (such as total substitution) is made quite
likely by the fact that any change will require total process redesign,
thus eliminating any savings from sticking with minor changes. Process
regulations are likely to yield incremental, minor process change, but
the difficulty and expense of such changes may occasionally stimulate
total process redesign.
Overall Hazard Isolation
Overall isolation of hazards from the environment is very difficult
in the fluid stage. Such isolation requires a certain degree of organi-
zation and integration. Further, because of the flexible nature of the
product, there is a danger that regulation of one hazardous material will
result in a simple switch to another material the effects of which are
unknown. Thus, product regulation on the fluid stage is likely to lead
to substitution; the substitutes may or may not be safer than the regu-
lated hazard. Process regulation may cause the hazard to be moved around
(e.g. ventilation) but it is unlikely to lead to greater overall isola-
tion of the regulated hazard. It may lead to product change, yielding
the same possibilities as product regulation.
In the segmented stage, hazard substitution becomes less likely,
reducing the chance of eliminating the hazard completely, but also
reducing the chance of a more dangerous substitute. As the process
becomes more and more organized, there is more opportunity to isolate the

production system by integrating separate steps and recycling.
Product regulation can therefore be expected to lead to little
overall change in exposure to hazards, although an occasional substitu-
tion may occur which could either increase or decrease such exposure.
Process regulation has a very good chance of improving the overall
isolation through process change.
In the rigid stage, product change is unlikely, but when it does
occur its direction is unpredictable, so there is no way of predicting if
the substitute will be better or worse. Process regulation may be quite
successful in achieving an overall isolation (although this may be
costly), since a completely integrated system provides the best chance
for such isolation.
Cost
The cost of the compliance technology may be difficult to predict,
since it obviously depends on the severity of the regulation. However,
it might be expected that a flexible segment, simply by virtue of having
more options available, would be more likely to find a lower cost solu-
tion. As one moves toward more and more rigid technologies, the inherent
technological constraints become more binding, and costs would be
expected to rise.
Product Utility
Obviously, changes in the utility of the product are dependent on
there being a change in the product. Such changes are most likely in the
fluid stage, and become less and less likely in more rigid stages. Since
fluid segments are generally already trying to maximize the performance

of their product, it seems unlikely that regulation would increase the
utility, but decreases are certainly possible.*
This section completes the conceptual phase of the overall project.
The next chapter describes the selection of regulations for study, and
the productive segments affected. The following chapter describes the
observed compliance responses. The last chapter attempts to analyze this
data and modify the conceptual framework and expectations in light of it.
*Obviously, the utility of the product is improved in a sense if ahazard is eliminated, but that would be accounted for as a direct envi-ronmental or safety effect. Included here are only changes in theutility other than any intended by the regulation.
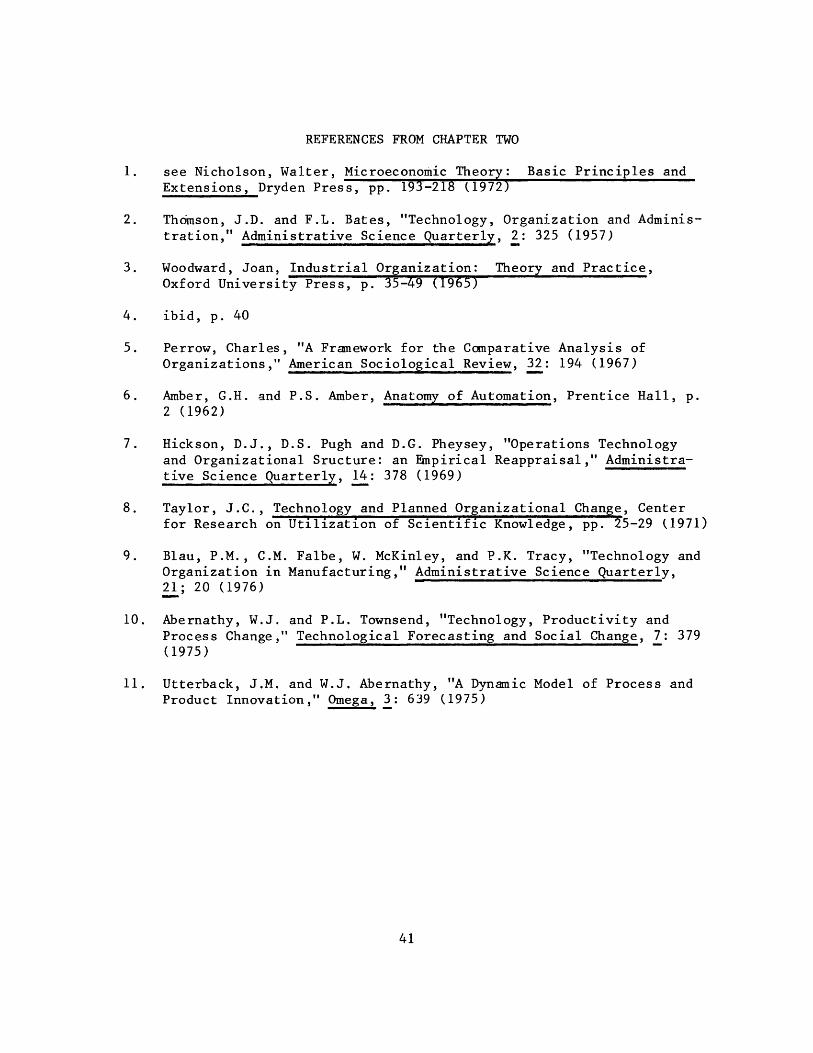
REFERENCES FROM CHAPTER TWO
1. see Nicholson, Walter, Microeconomic Theory: Basic Principles andExtensions, Dryden Press, pp. 193-218 (1972)
2. Thomson, J.D. and F.L. Bates, "Technology, Organization and Adminis-
tration," Administrative Science Quarterly, 2: 325 (1957)
3. Woodward, Joan, Industrial Organization: Theory and Practice,Oxford University Press, p. 35-49 (1965)
4. ibid, p. 40
5. Perrow, Charles, "A Framework for the Comparative Analysis of
Organizations," American Sociological Review, 32: 194 (1967)
6. Amber, G.H. and P.S. Amber, Anatomy of Automation, Prentice Hall, p.
2 (1962)
7. Hickson, D.J., D.S. Pugh and D.G. Pheysey, "Operations Technology
and Organizational Sructure: an Empirical Reappraisal," Administra-
tive Science Quarterly, 14: 378 (1969)
8. Taylor, J.C., Technology and Planned Organizational Change, Center
for Research on Utilization of Scientific Knowledge, pp. 25-29 (1971)
9. Blau, P.M., C.M. Falbe, W. McKinley, and P.K. Tracy, "Technology and
Organization in Manufacturing," Administrative Science Quarterly,21; 20 (1976)
10. Abernathy, W.J. and P.L. Townsend, "Technology, Productivity and
Process Change," Technological Forecasting and Social Change, 7: 379(1975)
11. Utterback, J.M. and W.J. Abernathy, "A Dynamic Model of Process and
Product Innovation," Omega, 3: 639 (1975)

CHAPTER THREE
THE REGULATIONS AND THE PRODUCTIVE SEGMENTS
1. Selection of the Sample
Everything said to this point could apply equally well to many
different regulations affecting many different industries.* In this work
the applicability of this approach to the regulation of the chemical
industry will be investigated. Such regulation is among the most impor-
tant there is both in terms of health and environmental concerns and
economic impact. In the concluding chapter the possibility of gener-
alizing these results to other industries will be discussed.
There are several major kinds of regulation pertaining to chemicals,
including:
* water pollution (Federal Water Pollution Control Act asamended (FWPCA))
* air pollution (Clean Air Act as aniended)
* solid waste disposal (Solid Waste Disposal Act andResource Conservation and Recovery Act)
* occupational safety and health (Occupational Safety andHealth Act (OSHA))
* pesticide registration (Federal Environmental PesticideControl Act)
* food additive registration (Food, Drug and Cosmetic Act)
*The Abernathy-Utterback model was developed to apply to integralproducts (output measured by the number of units) as opposed to dimen-sional products (output measured by weight or volume). However, theearlier work on characterizing technology was completely general, encom-passing integral and dimensional products as well as service industries.
42

* consumer product safety (Consumer Product Safety Act(CPSA) and Federal Hazardous Substance Control Act(FHSA)), and
* toxic substance control (Toxic Substance Control Act(TSCA)).
The regulation of drugs under the Food, Drug, and Cosmetic Act was
omitted from this study because it was felt that it is such a special
kind of regulation that its effects are not likely to be predictable on
the same basis as the others.
An extensive search of the regulations promulgated in each of these
areas yielded a list of approximately 150 chemicals with respect to which
some government action had been taken. This list included highly regu-
lated hazards as well as some with repect to which only preliminary
action had been taken. This list was reduced to 40 hazards that had been
regulated under more than one kind of regulation in a way likely to
affect more than one industrial segment. From this list, eleven hazards
were selected which had the widest distribution across kinds of regu-
lation and segments within the chemical industry. These three lists of
hazards are presented in Appendix One.
It was determined that these eleven hazards represented more res-
ponses than could be documented in detail within the limitations of this
project. Therefore, four of the eleven were chosen for study. These
four have all had significant regulatory action taken with respect to
them sufficiently long ago that the responses could be observed.
By choosing regulations known to have had a significant impact, the
sample is obviously being biased towards more substantial responses.
This was necessary to insure in this initial effort that there would be

something to observe. It should not affect the results with respect to
the role of technology in determining the nature of the response, except
that, as noted earlier, more severe regulations will likely lead to more
radical changes.
The four hazards are vinyl chloride, polychlorinated biphenyls
(PCB's), mercury and lead. The next section will describe the regula-
tions pertaining to each.
2. The Regulations
Government actions with respect to the four hazards were documented
in order to understand the technical problems posed by these actions for
industry. It should be emphasized that such "actions" cannot be limited
to formal regulations in final form. Informal "government scrutiny" may
have significant effects and produce observable technological responses.
Because the role of the regulations in determining the response is
not the issue here, the following discussions do not go into great detail
about the regulations. In addition, some regulations, which were not
judged to have had significant technological effects, were excluded from
the study and so are not discussed.
Vinyl Chloride
On April 5, 1974, the Occupational Safety and Health Administration
(OSHA) promulgated an emergency temporary standard which lowered permis-
sible levels of worker exposure from 500 parts per million by volume
(ppmv) to 50 ppmv. On October 4, 1974, a final standard (to be effective
April 1, 1975) was promulgated setting the maximum exposure at 1 ppm time
weighted average (TWA) for an eight hour period with a maximum 5 ppmv

exposure for any 15 minute period.1 These two actions will be referred
to collectively as the OSHA vinyl chloride regulation.
The EPA has declared vinyl chloride to be a hazardous air pollutant
under Section 112 of the Clean Air Act. In October, 1976, EPA promul-
gated regulations (effective January 1, 1977) limiting stack emissions to
10 ppmv, and requiring control of fugitive emissions and stripping of PVC
resins to remove residual vinyl chloride monomer (RVCM).2 This regula-
tion affected only vinyl chloride monomer and PVC resin plants. (See
discussion of the vinyl chloride/PVC industry in section 3.) These
requirements will be referred to as the EPA vinyl chloride regulation.*
There have been several other government actions with respect to
vinyl chloride taken by EPA, the CPSC, and the FDA. All of these are
either not yet final or have had little technological impact on the
regulated segments.
PCB's
Concern about the problem of PCB's in the environment goes back to
the late 60's. In 1971, Monsanto, the sole U.S. PCB producer, volun-
tarily restricted PCB sales to "closed" uses (capacitors and transfor-
mers). The responses to that action will not be considered. Subse-
quently, the New York State Department of Environmental Conservation
brought action against the General Electric Company for release of PCB's
*This regulation has been challenged in the D.C. Circuit Court of
Appeals by the Environmental Defense Fund. Pursuant to an agreement
reached i3 that case, EPA has proposed amending this standard to inake itstricter. The final status of this regulation is uncertain at
present, but it is still possible to observe the response to the originalstandard.

into the Hudson river, EPA proposed national water effluent standards,
Congress (in the Toxic Substances Control Act) banned PCB's after
October, 1979, Monsanto announced it would cease PCB production in
October, 1977, and GE was threatened with private liability suits arising
out of PCB misuse. It is somewhat difficult to separate out the effects
of these various actions. These actions will be referred to collectively
as the PCB regulation.
OSHA has also regulated PCB's and FDA has set PCB tolerances for
certain foods, but these actions have not resulted in significant
technological change.
Mercury
In 1970, after a flurry of publicity about fish being contaminated
in the Great Lakes region, the Justice Department brought suit (under the
Rivers and Harbors Act) against ten chlorine-caustic producers (who use a
mercury-cell technology--see section 3) to halt their discharges of
mercury into various bodies of water. At about the same time, there were
a series of state, local and private civil actions with the same intent.
Mercury effluents were eventually limited to about .1 lb/day from
chlorine-caustic producers, and these limitations were incorporated into
discharge permits under the FWPCA after that act was passed in 1972.
These actions will be referred to as the mercury water regulations.4
EPA has also designated mercury a hazardous air pollutant, and
promulgated regulations under section 112 to limit its emission.5
Chlorine-caustic makers are supposed to limit their mercury air emissions
to 2300 gm./day. However, it is difficult to measure most of the
emissions because they escape through leaks and cracks in the walls and
through the ventilation system. Therefore, compliance is assumed if a
series of housekeeping rules is observed and emissions from the stack are
limited to 1000 gm./day. This will be called the -mercury air regulation.
Also in 1970, the registration for Panogen, an alkyl mercury seed
treatment, was suspended and then cancelled (an action equivalent to its
being banned).6 In addition, tort liability cases were brought
against the maker of Panogen and the federal government on behalf of a
family poisoned by eating meat from a hog fed alkyl mercury-treated
grain.7 These actions will be referred to as the mercury pesticide
regulation.
In 1972, EPA began hearings on banning phenyl mercurial pesticides
from use in paint (where they preserve the paint in the can and protect
against mildew and fungi on the paint film). In early 1976, the adminis-
trator announced that EPA was banning all such uses. The ban was stayed
pending appeal, but before the appeal was resolved, EPA reversed itself
and reinstated mercury for use in water based paints. The ban on mercury
in oil based paints was allowed to go into effect.8 In addition,
concern has been expressed about tort liability with respect to mercury-
containing paints.9 These actions will be called the mercury paint
regulation.
Actions by OSHA and FDA with respect to mercury have not had
significant technological effects.
Lead
In 1971, Congress enacted the Lead Based Paint Poison Prevention Act

(LBPPPA) which, among other things, banned the use of lead based paint in
all federally subsidized housing. "Lead based paint" was defined as any
paint containing more than 1% lead by weight in the dried film. In
1973,Congress lowered this level to .5%, and dictated that it drop to
.06% on December 31, 1974, unless the Chairman of the Consumer Product
Safety Commission (CPSC) determined prior to that date that a level
between .5% and .06% was safe. On December 23, 1974, the Chairman
determined, based on the health effects information available at that
time, that the .5% level was indeed safe. In June of 1976, Congress
again amended the LBPPPA, extending the ban on lead based paint to
cooking, eating, and drinking utensils, furniture, and toys. In
addition, they required the definition of lead based paint to drop to
.06% on June 22, 1977, unless the Chairman of the CPSC could once again
determine that a higher level was safe. This time, a more formal
procedure for that determination was mandated, and on February 16, 1977,
the chairman decided that he could not determine that any level over .06%
was safe. Therefore, after June 22, 1977, all paint for use in federally
subsidized housing, utensils, toys, and furniture must dry to a film
containing less than .06% lead by weight.
In a parallel regulatory process, leaded paint has been regulated
under the Federal Hazardous Substances Control Act (FHSA). In March of
1972, the Food and Drug Administration (FDA) issued a regulation de-
claring that household paints containing more than .5% lead were banned
hazardous substances. Further, they ruled that after December 31, 1973
the level would be lowered to .06%. However, the latter part of the

regulation was indefinitely stayed. The CPSC, which took over adminis-
tration of the FHSA from FDA as a result of the Consumer Product Safety
Act, has proposed putting the .06% level into effect under a new stan-
dard, to be issued under the Consumer Product Safety Act.* 10 These
regulations will be referred to as the lead based paint regulations.
The Clean Air Act gave EPA the authority to regulate any Imotor
vehicle fuel additive that interferes with the performance of a certified
emission control device.11 When the catalytic converter (which is
rendered inoperative by lead in the fuel) was introduced in 1974, EPA
used this authority to require any service station pumping Imore than
200,000 gallons of gas per year to offer for sale a fuel with less than
.05 gm lead/gallon.12 This requirement will be referred to as the
un-leaded gas regulation.
EPA has also been trying since 1973 to promulgate a regulation
requiring a general reduction of the lead levels in gasoline, based on
the health threat of the lead itself. However, legal challenges delayed
the regulation to the point where the growth in the number of cars
requiring un-leaded fuel because of the converter has substantially
lessened its impact. Still, the possibility of this regulation elicited
some interesting technological developments which will be discussed.
This regulation will be referred to as the gasoline lead phase-down
regulation.
*The CPSC has a choice whether to regulate under the FHSA or the CPSA.Because the procedural requirements are easier under the latter, theyhave proposed abandoning the FHSA lead regulations and starting over withCPSA regulations.

TABLE 3.1
REGULATIONS AND AFFECTED PRODUCTIVE SEGMENTS
Hazard
Vinyl Chloride
Regulation
OSHA
EPA
PCB's
Mercury Water
Air
Pesticide*
Paint
Lead Paint
Unleaded gas
Gas lead phase-down
Productive Segment
PVC resin manufacturePVC fabrication
Vinyl chloride monomermanufacture
PVC resin manufacture
PCB'sPCB substitutesTransformer manufac-
tureCapacitor manufacture
Chlorine-causticproduction
ditto
Pesticide formulation
Paint foirmulationPaint additives
Paint formulationPaint additivesPigments
Petroleum refiningLead Alkyls
Petroleum refiningLead alkyls
*Farmers are obviously also affected by pesticide regulation, but since
agriculture is qualitatively different from manufacturing, no attempt was
made to identify and characterize agricultural productive segments.
SIC
28213079
28692821
28692869
36123629
2812
2879
28512869
285128692816&2865
29112869
29112869

Actions by OSHA with respect to lead, and other EPA actions have not
resulted in technological change in the chemical industry.
3. The Productive Segments and Their Technologies
Table 3.1 lists these regulations, and indicates the productive
segments affected by them. Although only regulations on the chemical
industry were examined, productive segments outside that industry were
included if they were affected indirectly by such regulations. The
fourteen segments include at least one from each of the Standard Indus-
trial Classification (SIC) groups within Chemicals and Allied Products
(SIC 28), except Drugs (283), Soaps and Detergents (284), and Miscella-
neous Chemical Products (289). In addition, there are segments from
Electric Transmission and Distribution Equipment (316), Electrical
Industrial Apparatus (362), Miscellaneous Plastics Products (307), and
Petroleum Refining (291).
Vinyl Chloride Monomer
Vinyl Chloride Monomer (VCM) is manufactured using a highly inte-
grated continuous process. There are about 15 plants in the U.S. with an
average annual capacity of about 500 million pounds each. (The largest
plant produces about one billion pounds per year.) The dominant
process is based on chlorination of ethylene to yield ethylene dichloride
(EDC), which is thermally cracked to yield VCM and hydrogen chloride
(HC1) which is then reacted in a separate step (called oxychlorination)
with ethylene and air or oxygen to yield additional EDC. Because of this
14HCI recycle step, this process is called the "balanced" process. An
older route, based on direct addition of HC1 to acetylene, has essen-

tially been abandoned in the U.S. Because of the very large scale and
highly integrated and continuous nature of VCM manufacture, this is a
highly rigid segment.
Polyvinyl Chloride Resin
VCM is polymerized to yield PVC resin using four distinct technolo-
gies, each of which produces resin with different properties suitable for
different end uses. PVC polymerizers are more numerous than VCM makers,
with an average plant capacity of about 150 million pounds per year.
Although the four technologies are somewhat different, they are all more
labor intensive and segmented than VCM manufacture.15
The suspension process is used to produce 78% of all PVC in this
country. It is a batch process, with polymerization carried out in
water, the VCM being suspended with the aid of surface active agents.
The average reator capacity is 3000 to 6000 gallons, but the trend has
been towards increased size, with 35,000 gallon reactors now in use.
After reaction, the slurry of PVC is stripped to remove much of the
unreacted VCM, then dried, and bagged or otherwise stored.16
The dispersion or emulsion polymerization process accounts for 13%
of PVC production. This process is quite similar to the suspension
process, except that larger amounts of dipersants and detergents are
added, resulting in a smaller particle size. To preserve this advantage,
spray driers are usually used. Some dispersion resins are not dried at
all; that is, they are used as a liquid or "latex" in various coatings
and paints.17
The bulk or mass polymerization process, accounting for 6% of PVC

capacity, is a two stage batch process in which an initiator is added
directly to VCM liquid. In a "pre-polymerization" reactor, conversion of
VCM to PVC is only 7 to 12 percent. The mixture is then transferred to a
second reactor where the reaction is carried to 85-90% completion.
Because no water is present, bulk resins do not have to be dried. Bulk
resins are characterized by a high chemical purity, since it is not
necessary to use any suspending agents. They have superior optical
clarity, heat stability, and fusion properties.18
The solvent polymerization process, accounting for 3% of capacity,
is a continuous process, used primarily to produce copolymers of vinyl
chloride (75-90%) and vinyl acetate (10-25%). Solvent (usually n-bu-
tane), monomer, and initiator are continuously added to a reactor
vessel; a slurry of PVC is continuously drawn off the bottom. Again, no
drying step is necessary. Solvent resins are also of a high purity and
19command a premium price.
PVC resin manufacture is in the segmented stage. This is because
there are a few different processes and product lines, and all of these
except one are somewhat disjointed batch processes, though some process
steps have been automated.
PVC Fabrication
PVC resin is fabricated into final products at about 8000 plants
which vary tremendously in size and the technology they employ. The
major processes are extrusion (50%), calendering (22%), dispersions
(11%), injection molding (6%), comapression molding (6%), and blow molding
(3%)20 Fabrication is a fluid segment because of the great diversity

in products and processes, and the relatively small scale of the indivi-
dual operations.
PCB Manufacture
Since 1971 U.S. PCB production has been about 40 million pounds per
year, all produced at a single Monsanto plant.21 PCB manufacture is a
fairly simple batch process, based on direct chlorination of biphenyl
over a ferric chloride catalyst. Various fractions with different
chlorine content are separated by distillation. Because it uses a fairly
large scale batch process and the products are a line of related
mixtures, PCB manufacture is in the segmented stage.
PCB Substitute Manufacture
The PCB substitute makers are difficult to characterize because the
PCB substitutes themselves differ greatly. (This will be discussed in
Chapter Four.) In most cases a company realized that materials similar
to ones they were already selling for another purpose had properties
which made them suitable as a PCB substitute. Because of this lack of
uniformity, PCB substitute makers cannot really be characterized as fluid
or rigid. (It is not really a distinct productive segment.)
Capacitor Manufacture
Although obviously not part of the chemical industry, capacitor
manufacturers are severly impacted by regulation of PCB's. Since 1971,
65 to 70 percent of the PCB's sold in the U.S. went to the capacitor
industry, where they were used as a dielectric in 90-95% of all liquid-
impregnated capacitors.
Capacitor manfacture is a segmented process with a series of

semi-automated steps. First the cans are fabricated from metal sheets
and the capacitor paper or film is wound with aluminum foil. Then the
capacitor is assembled and leak tested. After being subjected to vacuum
and high temperature to insure thorough drying, the capacitors are
flooded with the liquid dielectric, sealed, cleaned and tested.2 2
Transformer Manufacture
Most transformers (90-95%) are manufactured using mineral oil as the
dielectric fluid. Askarels (blends of 60-70% PCB's with trichloroben-
zene) are used only in transformers for use in locations where the fire
hazard presented by mineral oil is not acceptable.
About 5000 askarel or askerel substitute transformers are manufac-
tured per year, each containing between 500 and 20,000 pounds of
liquid.23 Each tranformer is virtually custom designed and assembled.
For this reason, and because of the undeveloped nature of the process,
this is a fluid segment.
Chlorine-Caustic Production
Chlorine and Sodium or Potassium Hydroxide (caustic) are joint
products of the electrolysis of brine (water saturated with NaCl or
KCI). There are two processes that are used, which differ in the manner
in which the anode and cathode electrolysis products are isolated from
each other. The older of the two technologies employs an asbestos
diaphragm. The other technology employs a flowing mercury electrode,
which amalgamates the sodium ions produced. This amalgam is reacted with
water in a separate chamber to produce sodium hydroxide and hydrogen.
Both are continuous processes.24 The mercury-cell process requires a

larger capital investment but produces a more concentrated and purer
caustic. Only the mercury-cell process is affected by mercury regula-
tions. About 10 million tons of chlorine were produced in the U.S. in
1975, with the average output per plant about 300 million pounds per
25year. Because of this high volume, the continuous nature of the
process, and the commodity-like nature of the product, this is a rigid
segment.
Pesticide Formulation
Pesticides are mixtures of various pesticide compounds with a
carrier and various inert ingredients. A wide variety of different
formulations are produced by a wide variety of companies. Some of the
pesticide syntheses may be quite complex, and they are done on a fairly
small scale in batch processes. The formulation steps are simple batch
processes. Pesticide formulation is a fluid segment because the products
are so complex and varied and because formulation is a non-rigid process
technology.
Paint Formulation
Paint formulation is a non-capital-intensive industry where raw
material costs dominate the production economics. There are some
economies of scale achievable with large batches, but there is a demand
for a wide variety of specialty products, and transportation costs are
high, so many small companies survive serving special or local customers.
The process technology consists of various measuring, grinding, and
mixing operations. The expertise in the industry is devoted to deter-
mining the optimum combination of the various ingredients for particular

uses. Even the smallest of companies generally produce more than
one paint, and it is a highly diversified market.
The basic ingredients common to all paints are:26
1. Resins- bind the pigment into a homogeneous film.Polyvinyl acetate (sometimes combined with PVC) is usedin water based paints and oil-modified alkyds are used inoil based paints.
2. Pigments- color the paint and increase its protectivepower. Important pigments include titanium, zinc andiron oxides, lead chromates, and various insolubleorganic dye ccmpounds.
3. Solvent- facilitates application of the paint. Eitherwater or organic solvents such as white spirit, xylene,and trichloroethylene are used.
4. Extenders- cheapen paint and improve its physicalproperties. These include barytes, blanc fixe, whitingand china clay.
5. Additives- include driers which catalyze cross-linkingof oil-modified alkyd resins, a polymerization initiatorin water based paints, surfactants, anti-settling agents,bactericides and fungicides.
The driers are naphthenates of heavy metals, including lead, and the
bactericides and fungicides may be mercury compounds.
Like pesticides, this is a fluid segment because it involves batch
formulation of a complex product.
Pigment Manufacture
With the exception of white pigments like titanium dioxide, pigments
are manufactured on a fairly small scale. Total production of inorganic
colored pigments in 1972 was 119 thousand tons. The lead chromates
27accounted for about 30 thousand tons. Production of organic pigments
of all types was also about 30 thousand tons.28 Pigment manufacture
may be considered a fluid segment because of the large number of differ-

ent pigments and the relatively small volume of each.
Paint Additives
All of the paint additives are in the category of specialty cheni-
cals, and are manfactured on a small scale using batch processes. The
additive manufacturers seem to have significant technical expertise, and
often assist the smaller paint companies with formulation problems.
Production of specialty products is always a fluid technology.
Manufacture of Gasoline Anti-Knock Compounds
Prior to the unleaded-gas regulation, tetraethyl lead (TEL) and
tetrimethyl lead (TML) were the major anti-knock compounds produced.
They are fairly large volume chemicals; U.S. capacity in 1975 was 850
million pounds at six plants.29 TEL and TML are made by autoclaving of
a sodium lead alloy with ethyl or methyl chloride. In addition, TML is
made by one small producer via electrolysis of a mixture of methyl
magnesium chloride and methyl chloride using a lead anode. Although both
of these are batch processes, they are fairly rigid because of the severe
reaction conditions and the high volume.
The only commercially available non-lead anti-knock compound is
methylcyclopentadienylmanganese tricarbonyl (MMT). This was developed in
the late 1950's by Ethyl Corporation (the first and largest anti-knock
maker) as a complement to the lead alkyls.30 By 1976, it accounted for
10-15% of anti-knock sales on a dollar basis.31 (See Chapter Four.) At
the present time MMT is made at only one plant in the U.S. (Production
figures are apparently unavailable.) Like the lead alkyls, it requires
some fairly complicated chemistry to produce, and so involves a fairly

complex production technology. Because of these complexities and the
large volume, this would be considered a rigid segment. In spite of the
fact that they are produced by the same company, the lead alkyls and MMT
are not produced at the same plant.
Petroleum Refinining and Gasoline Production
Petroleum refining is probably the most capital intensive of all
major industrial categories. It consists of continuous distillation of
the crude into various fractions, followed by various types of processing
steps which convert less desirable products into more valuable ones. In
the U.S. this consists mainly of catalytic cracking and reforming to
isomerize n-alkanes into isoalkanes and dehydrogenate cycloalkanes to
yield aromatics. These two constituents are needed to improve the octane
rating of gasoline.3 2
Because of its high capital intensity and the use of continuous
processes, this is a fairly rigid productive segment, although there are
aspects of petroleum refining which lessen somewhat its inherent rigi-
dity. First of all, the input feedstocks are quite variable, adding a
"non-routine" element (in the sense of Perrow; see Chapter Two) to the
technology. Also, the product stream has flexibility in the sense that
any particular need (such as a gasoline of a specified octane) can be
achieved in several different ways.
An important contributor to this flexibility has always been the use
of the anti-knock compounds. These additives (TEL, TML and MMT), used in
the range of 1-2 grams/gallon, can substantially reduce the need for the
cracking and reforming operations mentioned earlier.3 3
The classification of these segments according to rigidity is
summarized in Table 3.2. The next chapter describes the responses that
emerged from these segments, allowing the technologies and responses to
be related in Chapter Five.

TABLE 3.2
CLASSIFICATION OF SAMPLE PRODUCTIVE SEGMENTS BY
STAGE OF TECHNOLOGICAL RIGIDITY
Fluid Segments:
PVC Fabrication
Transformer Manufacture
Pesticide Formulation
Paint Formulation
Pigment Manufacture
Paint Additive Manufacture
Segmented Segments
PVC Resin Manufacture
Capacitor Manufacture
PCB Manufacture
Rigid Segments
VCM Manufacture
Chlorine-Caustic Production
Lead Alkyl Manufacture
Petroleum Refining and Gasoline Production
Not Classifiable
PCB Substitute Manufacture
REFERENCES FROM CHAPTER THREE
1. 39 Federal Register 35891
2. 40 Code of Federal Regulations 61.60 Subpart F
3. Environment Reporter (Current Developments), 7: 48, p.1 8 24 (4/1/77)
4. 40 CFR 415.60-65
5. 40 CFR 61.50-55
6. MIT Center for Policy Alternatives, The Impact of Government
Restrictions on the Production and Use of Chemicals, op cit, Alkyl
Mercury Case Study
7. First National Bank of Albequerque v. Nor-Am, 537 F2nd 682 and First
National Bank of Albequerque v. U.S. No. 9705 (D.N.M. 1975)
8. Environment Reporter (Current Developments) 7: 18, p.6 8 7 (9/3/76)
9. interview with paint additive firm
10. The entire chronology of leaded paint regulation is outlined in:
U.S. Consumer Product Safety Commission, Final Environmental ImpactStatement on Lead Content in Paint, May, 1977
11. Section 211 of the 1970 Clean Air Act amendments
12 40 CFR 79.32
13. U.S. Environmental Protection Agency, Standard Support and Environ-
mental Impact Statement: Emission Standard for Vinyl Chloride,EPA-450/2-75-009
14. ibid
15. ibid
16. ibid
17. ibid
18. ibid
19. ibid

20. Stanford Research Institute, Chemical Economics Handbook, p.580.1882H (1976)
21. U.S. Environmental Protection Agency, PCB's in the U.S.: Industrial
Use and Environmental Distribution, EPA-560/6-76-005
22. ibid
23. ibid
24. Reuben, B.G. and M.L. Burstall, The Chemical Economy, Longman Group,Ltd, p. 387 (1973)
25. Chlorine Institute, North American Chlor-alkali Industry Plants andProduction Data Book, Chlorine Institute pamphlet #10 (1977)
26. Reuben and Burstall, op cit, p. 272
27. SRI Chemical Economics Handbook, p. 577.5100
28. ibid, p. 577.5500
29. Chemical Marketing Reporter, 6/28/76, p.9
30. Chemical Engineering, 11/25/74, p.4 0
31. Ethyl Corporation, 1976 Annual Report, p.9
32. Reuben and Burstall, op cit, p.159
33. interview with petroleum refining company

CHAPTER FOUR
THE OBSERVED RESPONSES
1. Introduction
In this chapter the technological changes that occurred in the
various productive segments as a result of the regulations will be
described. The information used to document these changes cane from
three sources:
* trade and technical journals,
* documents published by regulatory agencies and conversa-
tions with individuals in these agencies, and
* telephone conversations and interviews with affected
firms and publications supplied by such firms.
Within the last category, a total of nine interviews, averaging about two
hours each, were conducted with eight different firms.* Substantial
information was collected from three additional firms by telephone and in
writing. As Table 4.1 indicates, the eleven firms represented eleven of
the fourteen productive segments, and information about one additional
segment (pigments) was obtained indirectly from the paint formulators.
The productive units to be interviewed within each productive
segment were chosen on the basis of geographic convenience and the
existence of contacts suggested by regulatory agency personel or the MIT
Industrial Liason Program. Where several firms were available, those
*The interviews were conducted under a promise of confidentiality, so no
firms will be identified by name and an attempt has been made to omit
information which might permit identification.

TABLE 4.1
SOURCES OF INFORMATION ABOUT RESONSES
VCM
PVC Resin
PVC Fabrication
PCB's
PCB substitutes
Capacitors
Transformers
Chlorine-Caustic
Pesticide
Paint
Pigments**
Paint Additive
Anti-Knock
Gas ol ine
Journals andOtherPublishedLiterature
x
x
x
RegulatoryAgencies
Interview*
(E.A.)
(both E.A.)
(E.A.)
OtherPersonal
Contact*
1 (E.A.)
1 (T)
2 (both T)
(T)
(E.A. and T)
1 (E.A. and T)
(M)
(T)
(E.A. and T)
*E.A.= Spoke with representative of environmental or regulatory affairs
group
T = Spoke with technical (i.e. R&D or operations) expert
M = Spoke with general manager of operating unit
**Additional information about pigments was obtained from the interview
with the paint unit.

that were known from the technical literature survey to have had a major
role in the technological developments arising from the regulation were
chosen.
An attenpt was made to speak with two individuals in each productive
unit: one who was familiar with the regulation and its broad effects on
the unit (usually someone from an "environmental" or "regulatory affairs"
group), and one who was familiar with the technical details of the
response (someone from an R&D or operating group, depending on the
firm). Table 4.1 indicates the extent to which this attempt was success-
ful. These people were asked to describe their perception of the
important regulatory events and the technical details of the compliance
response they developed. In addition, the interviewees were asked how
typical for the segment as a whole their response was. Also, part of the
interview was devoted to the attempt to identify any unique features of
the productive unit being interviewed which might be judged to render it
unrepresentative.* In general, the congruence of the responses identi-
fied from the literature, the agencies, and the firms was sufficient to
understand the response of the entire segment.
2.Vinyl Chloride
The OSHA vinyl chloride regulation impacted primarily on the PVC
resin manufacturers, with less impact on the fabricators and on the VCM
manufacturers. The EPA regulation also had its largest effect on the
resin makers and less effect on the VCM producers; the fabricators were
*In addition, questions were asked for the related NSF study about the
organizational process by which the response was developed.

not covered by the EPA regulation. Because the responses to the two
regulations are interrelated, the response of each segment to both
regulations will be discussed together.
The fabricators' problem resulted from residual, unreacted vinyl
chloride monomer (RVCM) which remained in the resins as they came from
the polymerizers. Previous to any regulation, polymerizers had stripped
(i.e. removed the unreacted monomer from) the resins for two reasons.
First, it allowed them to raise their overall efficiency of conversion
(which saves materal costs). Second, the RVCM can adversely affect the
physcial properties of the resin itself. However, the economics of
recovery and the severity of the physical degradation problem were such
that resins typically contained 600-1000 ppm by weight (ppmw) of RVCM.
Because the fabrication processes generally involve heating, the RVCM was
driven off into the atmosphere of the fabricating plant. Of course, with
the pre-regulation Threshold Limit Value for VCM of 500 ppmv, this was
never considered a problem.
When the regulations were imminent, the fabricators' first action
was to try to find out what were the VCM levels in their plants. Same
hired outside laboratories to do measurements, but at least one installed
gas chromatography equipment in each plant and trained their employees to
use it do these measurements.
The fabricators reduced their VCM problem with some combination of
three approaches. The simplest, and one which was widely employed, was
extra ventilation. Ventilation is a non-innovative, non-comprehensive
solution that transfers the hazard outdoors.

The second approach is to attempt to drive off most of the RVCM in a
controlled way during the first processing step. The gas can then be
vented to the atmosphere, and the need for ventilation around subsequent
processing steps is reduced. The first step is usually dry-blending of
the PVC resin with the plasticizer and other additives. If extra heat
and air are added during this step, RVCM in the dryblend can be reduced
to as low as 5-10ppmw, as opposed to 100 ppmw with conventional tech-
niques.2 This approach is more innovative and somewhat more comprehen-
sive than simple ventilation. It costs more to install, but operating
costs are lower. Of course, it still results in venting of the VCM to
the atmosphere.
Finally, worker exposures can be minimized by automating materials
handling tasks, thus removing the worker from the highest danger areas.
There are many different ways this can be done, and probably most were
incorporated to some degree. 3
Of course, the permanent solution to the fabricators' problem is to
contain all the unreacted VCM within the resin plant. This was, in fact,
the ultimate solution which emerged. PVC resins as they arrive at the
fabricators usually now contain about 50 ppmw or less RVCM.4
The problem is more complex for the resin manufacturer because VCM
is a direct material input. Whereas the fabricators had a fairly
constant, low level problem, the resin manufacturers have a highly
variable problem including temporary or localized high level situations
resulting from reactor openings and leaks or malfunctions. As a result,
one aspect of the response has been the installation of continuous

monitoring at several locations within the plant; an alarm is automa-
tically triggered if the standard is exceeded. Action can then be taken
immediately to locate the source of the leak and correct the situation.
In the mean time, local ventilation can be activated to reduce the
immediate hazard. This is superior to permanent general ventilation,
because it costs less and also because such general ventilation would
make it more difficult to find and repair leaks when they do occur.5
The occurence of leaks has also been reduced through the use of dual seal
pumps and dual rupture disks on the reactors.
Another major source of employee exposure is reactor maintenance.
In the early days of PVC manufacture, the polymerization reactor was
opened after each batch, and employees would manually scrape the insides
of the reactor to remove accumulated resin. Eventually, it was found
that this led to a disease of the hands called acroosteolysis.6 As a
result, efforts were underway to reduce this particular exposure even
before the OSHA action. Two approaches were taken simultaneously: the
reactant recipe was modified to reduce resin buildup inside the reactor,
and automated reactor cleaning systems (using a solvent such as tetrahy-
drofuran or jets of high pressure water) were developed which did not
require that the reactor be opened.7 '8 These developments were
undoubtedly speeded up by the OSHA regulation. One firm indicated
that their plant now averaged 45-50 days between reactor openings.10
As mentioned earlier, the resin manufacturers improved their VCM
stripping to reduce the fabricators' OSHA problem. This obviously
reduced their own problems from resin handling as well. B.F. Goodrich

Chemical Co. has developed a new stripping technology which employs steam
in a countercurrent tower.* Goodrich has made this technology available
for licensce, and some other firms have apparently adopted it. Some
other units have simply improved or increased their previous stripping
efforts.
Except for ventilation, these changes also helped in complying with
the EPA vinyl chloride regulations. Specifically, the EPA regulation
requires dual seal pumps, dual rupture disks, and improved stripping. In
addition, the EPA regulation requires reduction of the VCM concentration
in the process vent-gas stream. This requires some combination of
condensation, adsorption or incineration.
Overall, the response of the PVC resin manufacturers to these two
regulations was fairly comprehensive, and did involve some innovative
development work, even if the basic technology already existed. The net
effect was a further isolation of the hazard from the environment. The
costs were fairly high, both in terms of capital and operating costs.
(B.F. Goodrich, the largest resin manufacturer, has estimated a total
capital cost for VCM control of $42 million, spread over six years.11 )
In a sense, the utility of the product was improved by the removal of the
RVCM. However, certain resin lines which are difficult to strip were
abandoned altogether.12
As mentioned earlier, the VCM manufacturers were not significantly
*It is not completely clear whether this was an OSHA or an EPA res-
ponse. It was announced before the EPA regulations were final, but
knowledge that the air regulations were impending may have contributed to
its development. In any event, it helps solve both problems.

impacted by the OSHA regulation. The reason for this last fact is that
VCM plants are generally outdoors so that VCM does not build up in the
air. In addition, the continuous, integrated process has less potential
for escape of VCM, and less direct worker intervention in the process.
They were able to comply through the use of a program of tightening
valves and fixing leaks. However, the EPA regulation does require new
technology. Most have apparently turned to incineration to reduce the
vent-gas streams (particularly from the oxychlorination reactor) to 10
ppm.13 ,14
This is an interesting example of technological rigidity limiting
the comprehensiveness of the response. The VCM unit which was inter-
viewed indicated that they had considered the possibility of more radical
change, analagous to the new stripping column. For example, the air
emission problem is less severe if pure oxygen rather than air is used in
the oxychlorination step.* Such technology is used, but unfortunately,
it is not feasible with an integrated technology to make a change (like
switching from air to oxygen) in an existing plant without incurring
substantial expense. Thus, it was more economical to simply use incine-
ration.15
The vinyl chloride case is interesting because the VCM/PVC industry
spans the three stages of technological rigidity. The fabricators, being
fluid, were unable to effectively deal with their problems by process
*The emissions from the oxychlorination step result because the recycledHCI is contaminated with VCM. If air is used, large quantities ofnitrogen must be vented fron the system, and this venting carries VCMwith it.

change. The resin makers, being segmented, were able to institute
comprehensive process change, though it was not terribly innovative. The
VCM manufacturers, being rigid, were limited to end-of-pipe controls,
even though an alternative process (using oxygen instead of air) would
have reduced the problem.
3. PCB'S
The response to the PCB regulation originally took two directions:
the search for substitutes and the attempt to continue the use of PCB's
but reduce the hazard associated with their use. The latter of these was
ultimately abandoned, but it is interesting none the less.
In the early 1970's Monsanto introduced a new PCB mixture for use in
capacitors (Aroclor 1016) which contained a much higher fraction of the
lower chlorinated biphenyl isomers, which are much more biodegradable
than the higher isomers.16 In addition, at least one capacitor firm
(Westinghouse) reduced the amount of PCB's used in each capacitor by 66%
through redesign of the capacitor itself.17
Westinghouse also attempted to reduce the release of PCB's resulting
from capacitor manufacture. This effort included "housekeeping" steps
such as closing drains, separating PCB and non-PCB laden waters, and the
use of sawdust on the floors to trap spilled PCB's. In addition,
Westinghouse attempted a major process change; they went from flood-
filling of the capacitors to individual manifold filling. Unfortunately,
this led to greater capacitor failure because of air entrapment, and the
effort had to be abandoned.18
Eventually, it became clear that PCB's would have to be replaced.

Five substitutes have emerged, four for capacitor use and one for
transformer use. Each will be discussed in turn.
The replacement for transformers was polydimethylsiloxane (a
"silicone"). Silicones had apparently been considered as transformer
fluids many years ago, but had never been pursued because of their high
price.19 When PCB's were called into question, silicones were deve-
loped for tranformer use independently by Dow Corning (a major silicone
producer) and General Electric (a silicone producer and a transformer
manufacturer).
Because the silicones have a higher viscosity (and so are poorer
heat exchangers) and lower resistance to electrical "creep," the trans-
formers had to be redesigned to achieve the same performance with
silicones. However, the production process is essentially un-
changed. 2 0 The silicones are considerably more expensive than the
PCB's.
The substitutes for PCB's in capacitors are isopropyl naphthalene,
butylated monochlorodiphenyl oxide, di-isononyl phthalate ester, and a
mixture of di-octyl phthalate ester with trichlorobenzene.2 1' 2 2 The
first and last of these were developed by capacitor firms; the second
and third were developed by chemical firms in conjunction with capacitor
firms. The monochlorodiphenyl oxide had been considered as a liquid
dielectric long ago, but the others are new to this field. The phthalate
esters are manufactured in large quantities for use as a PVC plastici-
zer; the others were not made in significant quantities before their
introduction as PCB substitutes.2 3

All of these are more flammable than PCB's. In addition, the
phthalate esters may be suspected carcinogens, and highly toxic dioxins
may be formed as degradation products of the monochlorodiphenyl
24oxide. The monochlorodiphenyl oxide* is more expensive than PCB's,
but the others are considerably cheaper.2 5
Because these compounds are more flammable than PCB's, the capacitor
manufacturers introduced a pressure switch which shorts the capacitor to
prevent an explosion if the capacitor begins to break down. However,
this technology was established for other uses; it was necessary only to
modify the capacitor design to incorporate it.
Thus there were a diversity of responses as a result of PCB
regulation. Sane were innovative; some were less so. Sane aimed at
process change (at least initially); some introduced new products. Some
came from the users of the PCB's; some cane from new entrants; some
came from cooperative efforts between a user and a new entrant.
Interestingly, none came from Monsanto, the PCB producer. Overall the
PCB regulation resulted in fairly comprehensive product change, and
little process change. New injection of PCB's into the environment has
ceased, although the problem of PCB's in existing units remains and there
are some unresolved questions about the safety of the substitutes. The
cost of tranformers has increased, and capacitor fluids are no longer
non-flammable, but capacitor fluids are much cheaper. It is interesting
that the innovative substitutes came from new entrants to the liquid
*No evidence was found that indicated that any capacitor firms areactually using the monochlorodiphenyl oxide.

dielectric market, working in conjunction with existing capacitor firms.
In order to understand the responses to the PCB regulation, it is
important to understand that there were strong insitutional forces acting
against the replacement of PCB's. Many local fire codes and insurance
regulations specifically mandated PCB's for certain capacitors and
transformers. This was certainly a disincentive over the years to
perform research into alternative liquid dielectrics. Even when it
became clear that PCB's had to go, the makers of the substitutes had an
uphill battle to get themn accepted.
4.Mercury
The mercury water regulation has led to two basic changes in the
mercury-cell chloralkali process. First, process water and cooling water
streans have been separated. The cooling water (which is by far the
larger volume) is now given no opportunity to come into contact with
mercury. All of the sewer pipes were dug up, inspected for trapped
mercury, and cleaned or replaced. 2 6
The process water stream is now treated to renove almost all of the
mercury. About 90% of the mercury-cell plants use some variation of a
sulfide precipitation process.27 Generally, mercury-laden waters are
treated with Na2S under controlled pH conditions and then filtered to
yield a clean (less than 3 ppb Hg) filtrate, which is discharged, and a
mercury sulphide filter cake. This cake is then cmabined with muds from
the brine pretreatment clarifier which contain chlorine, caustic and some
mercury. The mercury is dissolved as a complex ion, and this slurry is
filtered again; the mercury-laden brine is recycled to the mercury

cells, and the filter cake (containing 20-30 ppm Hg) is sent to land-
fill. 28
Although the idea of sulfide precipitation is not new, its applica-
tion in this area is somewhat innovative. The use of such an add-on
technology is not a very comprehensive approach, although the rebuilding
of the sewer pipes was a fairly comprehensive response in a quantitative
sense. The mercury is somewhat better isolated from the environment,
although some of the mercury which was in the water is now in landfill.
The capital costs are moderate ($500,000-1,000,000 for an average sized
plant) and operating costs are also significant.29 The products are
unaffected.
As discussed earlier, the mercury air regulation has two parts. One
is the specification of a series of housekeeping rules to be followed.
Such rules, while they may impose substantial expense, do not require
true technological change.* The other part, limiting end-box emissions
to 1000 gm/day, requires some technology to reduce those emissions.
Several different approaches have been taken by various chloralkali
producers. The mercury mist and vapor in the gas strean are removed
*They require things like epoxy floors to prevent mercury buildup incracks, tight covers for mercury containers, and the like. Although thequestion of whether the regulators' immediate environmental goal was metby regulation is not a direct concern here, it should be noted that cellroom emissions do not appear to have been reduced to anywhere near 1300gm/day by the observation of these rules. The mercury cell companiesconsume something like half a pound of mercury per ton of chlorineproduced; this amounts to something over 100 pounds of mercury per dayfor an average plant. Very little of this can be accounted for by waterand solid waste discharges. Sane may be lost through theft and inventorybuildup, but it seems unlikely that these could account for the remainingmercury.

using some combination of mist eliminators, refrigeration, chemical
scubbing, "molecular sieves" and carbon adsorption.3 1 )3 2 Usually, most
of the captured mercury is recycled, although the adsorption techniques
require disposal of the spent adsorbant. In any case, it would appear
that these technologies are adequate to achieve the 1000 gm/ day level.
The overall costs of air emission controls would appear to be on the
33same order as the costs of water effluent control. None of these
technologies is particularly innovative or comprehensive. They are
achieving some overall reduction of environmental mercury contact.
An additional effect of the combined mercury regulations has been a
halt to new construction of mercury cell plants, although the mercury
cell had been emerging as the dominant technology prior to regulation.
Also, a handfull of plants have closed and a few have converted to
diaphragm cells. 3 4
A final development which is at least partially attributable to
these regulations is the development of an alternative to both the
mercury cell and the asbestos diaphragm processes. This a membrane cell
which employs a perfluorosulfonic acid resin membrane (DuPont tradename
35"Nafion") to separate the anode and cathode compartments. This
membrane allows production of mercury cell-quality caustic without the
use of mercury. Although work on the membrane has been in progress for
many years, it has almost certainly been speeded by the mercury regula-
tions. Unfortunately, at the moment the membrane technology suffers from
poor durability of the membrane itself, which leads to poor electrical
efficiency as the membrane ages. Several plants using the membrane cell
are in commercial production, both in North America and Japan, and the
membrane cell developers (DuPont in conjunction with Hooker Chemicals and
Diamond Shamrock, two chloralkali firms) are hard at work to improve its
efficiency.
Overall, the mercury air and water regulations resulted primarily in
end-of-pipe solutions in this rigid segment. Capital and operating costs
were significant. The devlopment of an alternative process was encou-
raged and new use of the existing process was halted completely.
When alkyl mercury seed treatments were banned in 1970, the manufac-
turers simply abandoned the product and went into related product lines.
Other companies supplied previously developed substitutes such as maneb,
pentachloronitrobenzene, hexachlorobenzene and phenyl mercury acetate.
Some farmers stopped treating their seeds, some used the substitutes, and
some turned to farmer organizations and agricultural extension services
to develop new substitutes. 36
The main response to the mercury paint regulation has been the
substitution of organic compounds for the mercurials in some paints.
Some of these have been around for many years, but at least one new one
has been registered with EPA since the concern over mercury deve-
loped.37 Even where existing compounds were used, substantial work on
the actual paint formulation may be necessary to achieve the desired
properties.
It appears that the larger companies have switched to the non-mer-
curials more readily than the smaller ones. 3 8 ' 3 9 ' 4 0 This may be
because they are better able to do the research necessary to modify a
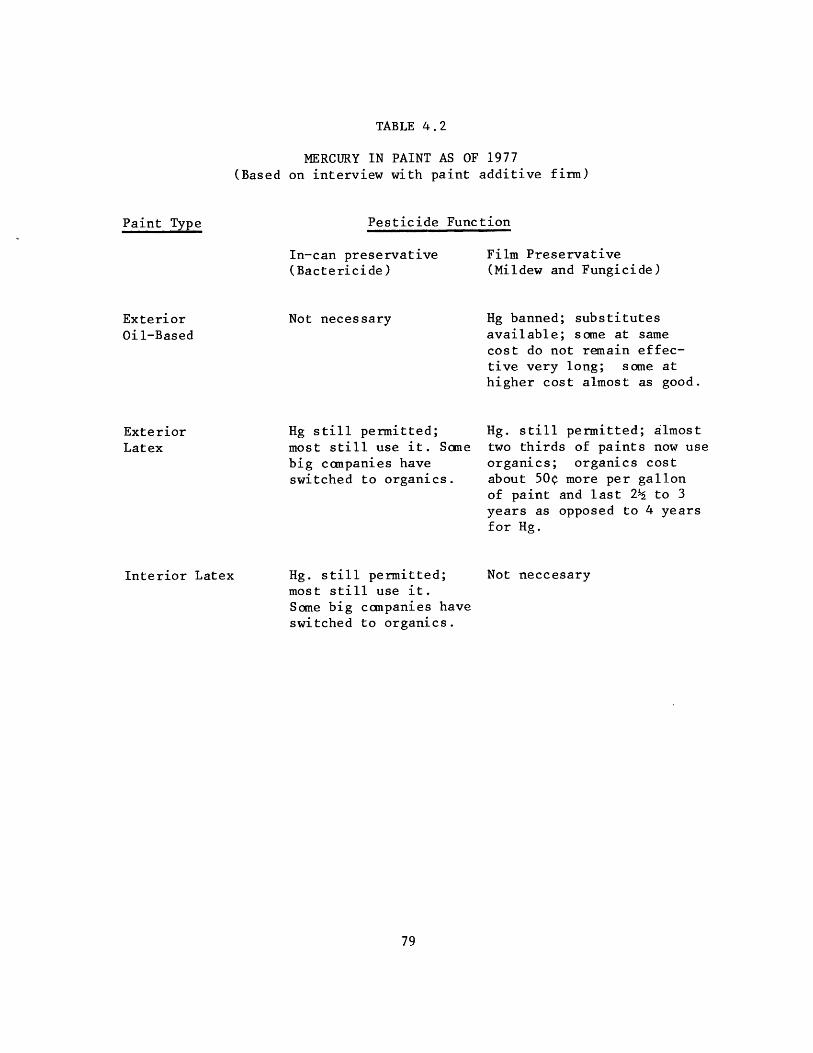
TABLE 4.2
MERCURY IN PAINT AS OF 1977(Based on interview with paint additive firm)
Paint Type Pesticide Function
In-can preservative(Bactericide)
Not necessary
Hg still permitted;most still use it. Somebig companies haveswitched to organics.
Film Preservative
(Mildew and Fungicide)
Hg banned; substitutes
available; some at samecost do not remain effec-
tive very long; some at
higher cost almost as good.
Hg. still permitted; almost
two thirds of paints now use
organics; organics cost
about 50¢ more per gallon
of paint and last 22 to 3
years as opposed to 4 years
for Hg.
Interior Latex Hg. still permitted;most still use it.Some big companies haveswitched to organics.
Not neccesary
Exterior
Oil-Based
ExteriorLatex

paint formula. It may also be that the smaller firms cater more to
specialty needs where it is more difficult to go without the mercurials.
The overall response is summarized in Table 4.1. While the phenyl
mercury ccmpounds served both as in-can preservatives and film preserva-
tives, none of the substitutes perform both functions. Of the two, the
in-can preservative problem seems to have been the more difficult. Only
a few of the largest companies have abandoned mercury for this use. For
the mildewicide and fungicide function, substitutes are available for
oil-based paints (in which mercury is banned). However, these compounds
are susceptible to hydrolysis and so are not as stable in water based
paints. Still, some two thirds of the water-based paint fungicides sold
by one maker are now non-mercurials.41
This response does not seem to have been either very innovative or
very comprehensive. The mercury has been partially eliminated, but there
are some doubts about the safety of the organic substitutes. The cost of
paint has increased slightly, and the utility may have been slightly
impaired by reduced mildew and fungus resistance.
The mercury pesticide and paint regulations are a case of fairly
easy product modifications and substitution in the fluid stage. However,
none of the responses was very innovative.
5.Lead
Taken together, the LBPPPA and the FHSA and CPSA lead paint regula-
tions limit the lead content of household paints to .5% by weight in 1973
and .06% in 1977. Also in 1977, the limit is being extended to paints
for use on toys furniture and other items to be sold for household use.

The effect of the .5% level is to prohibit the use of lead pigments; the
.06% level prohibits the use of the lead driers.
The response to both of these regulations has been simple substitu-
tion of existing substances.42'43 In the pigment case, various
organics had already been in use in some paints, and these uses were
expanded to include those formerly met with the lead chromates.* As for
the driers, various combinations of calcium, zinc, zirconium, and lead
had been used; the lead is being removed and replaced with additional
quantities of the others.
The organic pigments are somewhat more expensive than the lead
chromates. The non-lead driers are no more expensive, but do not work
quite as well, so that paint drying is impaired under conditions of low
termperature and high humidity. 4 5
As in the mercury paint case, these responses demonstrate easy
product modification. The changes were not innovative, but they did not
need to be; there was a stock of substitutes available. The changes
were comprehensive in terms of eliminating the regulated substance,
although the safety of the substitutes has not been unequivocably
proven. Costs were incurred, but they were easily passed on in a
price-insensitive market. Sane minor losses in the utility of certain
products were accepted.
The major gasoline producers knew in 1970 that the auto companies
were going to use the catalytic converter to meet the Clean Air Act's
*At least one paint company had already voluntarily eliminated the 4 ead
chromates because of concern over the carcinogenicity of chromium.

auto emission standards for carbon monoxide (CO) and hydrocabons
(HC).46 Thus they had three or four years to prepare for the require-
ment to market unleaded fuel.* In spite of this, no particularly
innovative responses emerged. Ethyl Corp. began marketing MMT, on which
it had been working for years. Most refiners now use MMT** to some
degree, in conjunction with additional processing, to achieve the octane
requirements of the new cars.47 (The engines of catalytic converter-
equiped cars are designed with a lower compression ratio and so do not
need as high an octane fuel as older cars.) At most, technological
change in response to the regulation consisted of a somewhat increased
rate of introduction of new catalysts for reforming developed in the
sixties.
One interesting development indirectly related to this regulation
has been a massive effort on the part of both the oil companies and the
chemical companies who produce the anti-knocks to develop systems for
control of CO and HC that would not require lead-free gasoline. This
effort has included work on lead-tolerant catalysts, a non-catalytic
"thermal reactor" which would perform the same function, and alternative
power plants such as the stratified charge engine. 5 1'52'5 3 It is
difficult to assess the success of this work from a technical viewpoint,
*Unleaded fuel was marketed voluntarily by some companies as early as1970. However, it never sold well (presumably because o4 8 its cost) until
the catalytic converter-equipped cars were on the roads.
**MMT itself has recently been called into question. The auto companies
claim that it increases hydrocarbon emissions and plugs the catalytic
converters. Ethyl has lowered the recommended maximum concentration from
.125 to .06 gm/gallon, and supended const uction of a new MMT plant
pending an EPA decision on the additive.

but it has certainly been a commercial failure. The auto companies
remain committed to their original approach.
The story of the response to the gasoline lead phase-down regulation
is somewhat similar. Again, both the oil companies and chemical firms
have been at work on technologies which would allow them to preserve
their products intact. In this case, the goal was a "lead trap," a
device that would capture the lead in the exhaust and prevent its release
to the environment. This work does appear to have been technically
successful,54 but the adoption of the catalytic converter has made it
unusable. (The lead-trap would not be efficient enough to prevent the
poisoning of the catalyst.)
As mentioned earlier, the anti-knocks gave a crucial element of
flexibility to an otherwise rigid industry. This may be one reason why
the industry tried so hard to save them.
Thus in response to the gasoline lead regulations two rigid indus-
tries failed to achieve an innovative or comprehensive solution when
their product was regulated. Yet, they were quite innovative in pursuing
technologies which would have protected their existing product line.
There is no way of knowing if this contrast is in fact a result of the
rigidity of these segments, or if the regulations were simply inherently
difficult ones with which to comply.
This concludes the discussion of the responses to the selected
regulations. In the next Chapter the lessons of these observations will
be discussed.

REFERENCES FROM CHAPTER FOUR
1. interview with PVC fabricator firm
2. Plastics Technology, December, 1974, p.4 3
3. ibid
4. interview with fabricator firm
5. Gideon, J.A, K.S. Schoultz and J.H. Bochinski, Engineering Control
Assessment of the Plastics and Resin Industry, Case Study: Manufac-
ture of PVC by Bulk Polymerization, NIOSH mimeo (1977)
6. Adams, Georjean L., Toxic Substance Control: Vinyl Chloride,Department of Technology and Human Affairs and Center for Development
Technology at Washington University, Report No. THA/CDT-77/1, p. 22
(1977)
7. Chemical Engineering, 11/24/75, p. 25
8. interviews with PVC resin firms
9. ibid
10. ibid
11. Oil and Gas Journal, 6/9/75, p. 25
12. interview with PVC firm
13. interview with VCM firm
14. U.S. Environmental Protection Agency, Standard support document forVinyl Chloride, op cit
15. interview with VCM firm
16. Kerns, Bernard, statement representing Westinghouse Electric Corp.,in National Conference on PCB's, Nov. 19-21,1975, EPA-560/6-75-004
17. Sawyer, R.B., "Manufacturing," Westinghouse Distribution Apparatus
Division mimeo
18. ibid
19. interview with transformer firm
20. interview with capacitor firm

21. U.S. Environmental Protection Agency, PCB's in the U.S ... , op cit
22. interview with PCB substitute maker
23. ibid
24. U.S. Environmental Protection Agency, PCB's in the U.S...., op cit,p. 230-232
25. ibid
26. interview with chlorine-caustic producer
27. ibid
28. Chemical Engineering, 2/3/75. p. 36
29. letter, dated 10/23/75 from Edmund J. Laubusch (Chlorine Institute)to Edwin A. Gee (National Commission on Water Quality)
30. U.S.E.P.A. Office of Enforcement and General Counsel, Report ofMercury Source Investigation of Diamond Shamrock (8/75), Penwalt(8/73), and B.F. Goodrich (11/73)
31. Chemical and Engineering News, 2/19/72, p. 15
32. interview with chlorine-caustic producer
33. Laubusch letter, op cit
34. ibid
35. Chemical Week, 3/24/76, p. 33
36. MIT Center for Policy Alternatives, The Impacts of GovernmentRestrictions on the Production and Use of Chemicals, Alkyl MercuryCase Study, op cit
37. interview with paint additive maker
38. ibid
39. interview with paint formulator
40. Chemical Marketing Reporter, 3/29/76
41. interview with paint additive firm
42. ibid

43. interview with paint formulator
44. ibid
45. interview with paint additive firm
46. interview with petroleum refiner
47. ibid
48. Wall Street Journal, 2/11/70, p.3 8 , 4/3/70, p.ll, and 2/19/74, p.1
49. Environment Reporter (Current Developments), 7: 45, p.1 7 2 1 (3/11/77),8: 6, p.2 2 5 (6/10/77), and 8: 9, p.3 4 3 (7/1/77)
50. interview with petroleum refiner
51. ibid
52. interview with lead alkyl maker
53. Ethyl Corporation 1976 annual report
54. interview with lead alkyl maker

CHAPTER FIVE
RESULTS AND TENTATIVE HYPOTHESES
1.Introduction
Table 5.1 is a reproduction of Table 3.2, showing the classification
of the productive segments affected by the sample regulations into the
stages of rigidity. This classification is based on the criteria out-
lined in Chapter Two and the descriptions of the technologies in Chapter
Three. Although there might be some disagreement about a few of the
segments, these assignments should be adequate for this exploratory
effort.
In Chapter Two, section 5, a priori expectations with respect to
each response attribute were discussed. This was useful conceptually
because it helped to introduce and explain the attributes themselves.
However, since regulators will be conscious of the nature of the segments
they propose to regulate, it is more useful for regulatory design to
express the hypotheses in terms of what is to be expected fran productive
segments in each stage of rigidity. Of course, the two methods of
presentation contain the same information and are interchangeable. In
this chapter, some general observations will be presented, followed by
tentative hypotheses about the likely outcome of regulations affecting
segments in the different stages. Of course, these results can only be
expected to be valid if other factors (particularly the nature of the
regulations) are constant. The last two sections of this chapter specu-
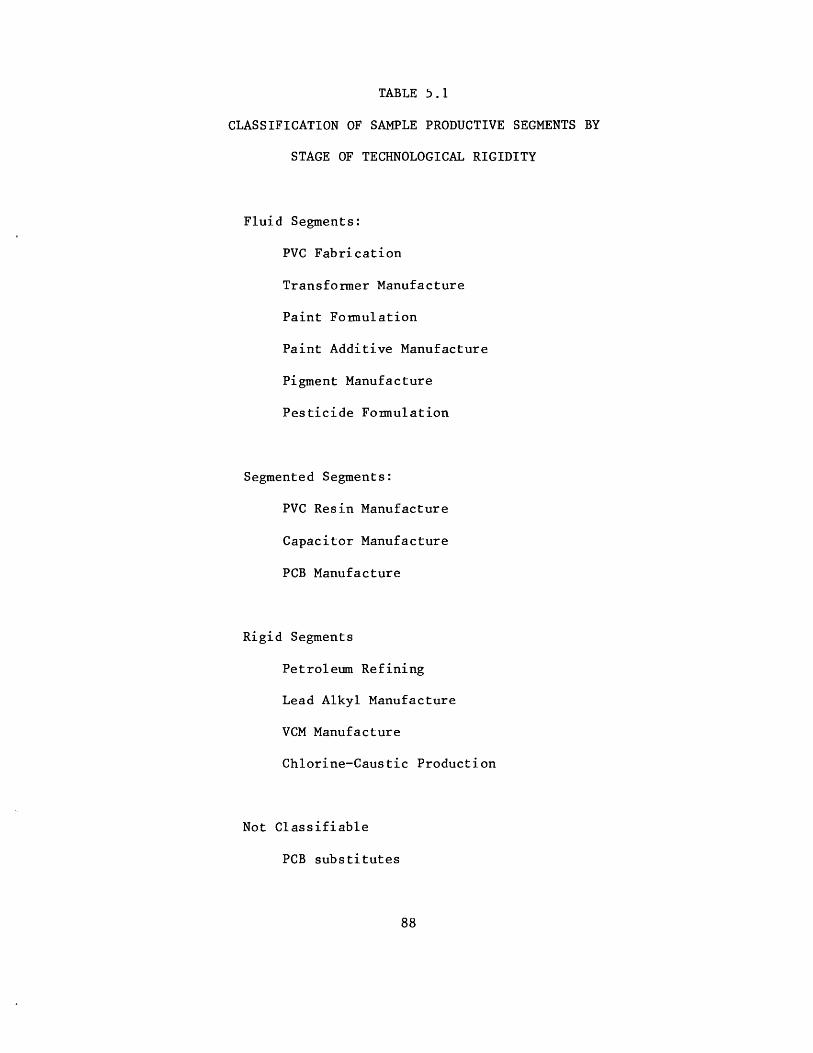
TABLE 5.1
CLASSIFICATION OF SAMPLE PRODUCTIVE SEGMENTS BY
STAGE OF TECHNOLOGICAL RIGIDITY
Fluid Segments:
PVC Fabrication
Transformer Manufacture
Paint Formulation
Paint Additive Manufacture
Pigment Manufacture
Pesticide Formulation
Segmented Segments:
PVC Resin Manufacture
Capacitor Manufacture
PCB Manufacture
Rigid Segments
Petroleum Refining
Lead Alkyl Manufacture
VCM Manufacture
Chlorine-Caustic Production
Not Classifiable
PCB substitutes

late on the implications and limitations of this work, and suggest future
work which might prove to be fruitful.
2.General Observations
Although this thesis is not primarily concerned with categorizing
and characterizing regulations, one distinction among regulations emerges
as being crucial for understanding the interaction with technology. This
is whether the particular regulation impinges primarily on the product or
the process of each productive segment. It was argued earlier that the
distinction between product and process change is important in the
response; clearly the emphasis of the regulation on product or process
will affect whether the response is likely to be a product or process
change. To be sure, product regulations may affect the process and vice
versa, but the locus of the immediate impact is important.
One hypothesis, suggested by the PCB case, is that product regula-
tion (particularly a partial or complete ban) is more likely to lead to
new entrants offering a solution to the problem. Such entrants can
perceive the need to be filled in the absence of the regulated product,
and produce a product of their own to meet that need. In fact, the
phthalate ester PCB substitute offered by a non-PCB chemical firm was
among the most innovative responses seen in this study. On the other
hand, when it comes to process regulation (especially attempts to limit
exposure to a substance), the existing units are likely to have an edge
because of developed expertise and proprietary knowledge.
Another general conclusion is that "cost" is an attribute of the
response which has no simple measure. There are many different kinds of

costs. For instance, a capital cost and an increased material cost
because of sustitution for a banned product each accrue to different
groups and over different time periods. Perhaps, the best that can be
done is to anticipate the kinds of costs which are likely to be important
in different cases. This will be attempted in the subsequent sections.
3.Regulation of the Fluid Stage
To recapitulate briefly, the expected results of regulations affec-
ting the fluid stage were:
* easy product change, quite possibly innovative and compre-hensive, as a possible response to both product and processregulation,
* little process change, and non-comprehensive change if any,
* little overall isolation of hazards from the environment viaprocess change, and product substitutes which may or may notbe safe,
* relatively lower cost solutions, and,
* possible product utility losses.
The observed regulations on transformers (PCB's), paints, paint
additives and pigments (lead and mercury), and pesticides (mercury) were
all product regulations. These all led to some combination of product
modification and product substitution. In the tranformers, the PCB's
were replaced with a new substance and the tranformers were redesigned.
In the paint cases, substitutes existed; the paints were reformulated.
In the pesticide case, substitutes also existed. Thus, change does occur
easily as a result of product regulation in these cases. Note that there
was little effect on the process in every case.
An interesting result which is counter to expectations is the lack

of innovative change; for the most part product substitutes and
modifications* which had already been developed were used. The only
possible exception is the introduction of the silicone transformer
fluids; even that had been considered earlier.
On further reflection, this does not seem so unlikely. If the fluid
segment had seen a lot of product innovation in the absence of regula-
tion, that really makes it less likely that an additional innovation will
be required to meet the regulation. Precisely because the segment had
been innovative and rapidly changing, it has a large store of alterna-
tives ready when the regulation occurs. When one looks at fluid segments
for innovation in response to regulation, it is not found, simply because
it was made unnecessary by previous developments.
The one case of process regulation on a fluid segment resulted, as
expected, in little change. The ultimate solution to the PVC Fabrica-
tors' OSHA problem emerged from the PVC resin manufacturers.
There were also examples of the danger (inherent in the fluid
segment) of being unable to isolate the production process from the
environment and of substituting one hazardous substance for another. The
fabricators simply ventilated until the RVCM was removed, and the substi-
tutes for the lead pigments, the mercury paint biocides, and the mercury
pesticide are all of questionable safety.
The costs associated with these responses resulted primarily from
the increased costs of substitutes. (There was also a small amount of
*Note that minor modifications which are new are considered to beincremental innovations.
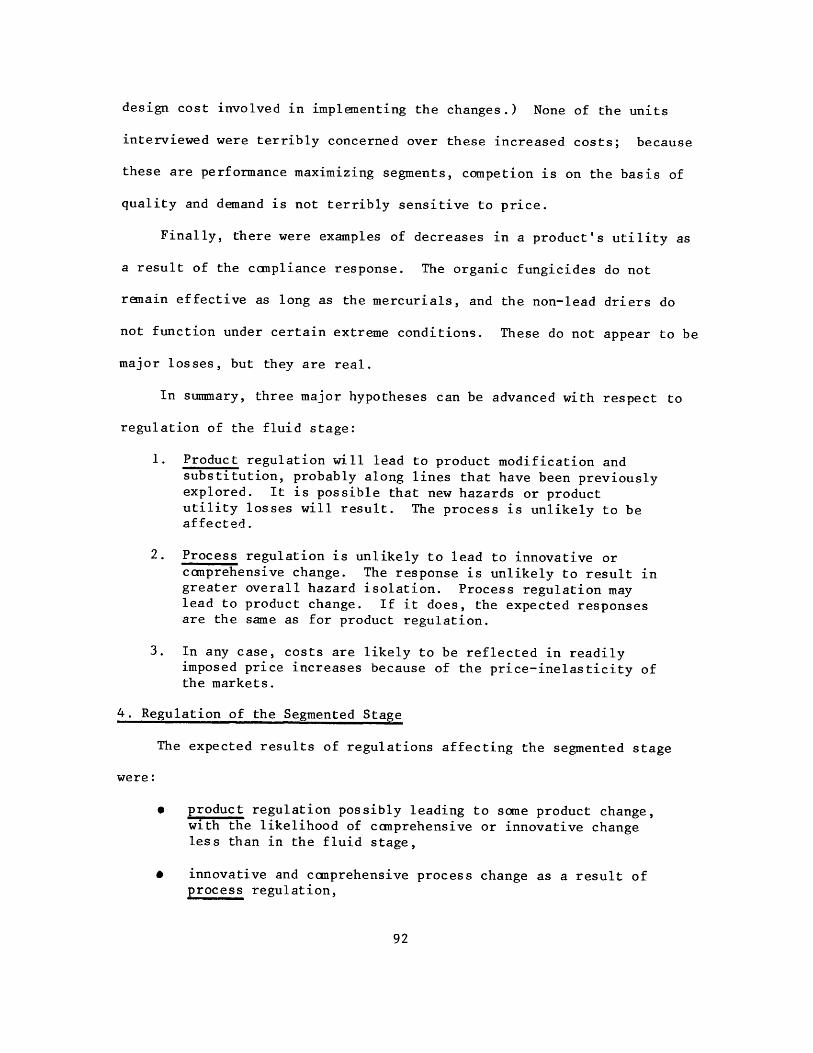
design cost involved in implementing the changes.) None of the units
interviewed were terribly concerned over these increased costs; because
these are performance maximizing segments, competion is on the basis of
quality and demand is not terribly sensitive to price.
Finally, there were examples of decreases in a product's utility as
a result of the cmapliance response. The organic fungicides do not
remain effective as long as the mercurials, and the non-lead driers do
not function under certain extreme conditions. These do not appear to be
major losses, but they are real.
In summary, three major hypotheses can be advanced with respect to
regulation of the fluid stage:
1. Product regulation will lead to product modification andsubstitution, probably along lines that have been previouslyexplored. It is possible that new hazards or productutility losses will result. The process is unlikely to beaffected.
2. Process regulation is unlikely to lead to innovative orcomprehensive change. The response is unlikely to result ingreater overall hazard isolation. Process regulation maylead to product change. If it does, the expected responsesare the same as for product regulation.
3. In any case, costs are likely to be reflected in readilyimposed price increases because of the price-inelasticity ofthe markets.
4. Regulation of the Segmented Stage
The expected results of regulations affecting the segmented stage
were:
* product regulation possibly leading to some product change,with the likelihood of comprehensive or innovative changeless than in the fluid stage,
* innovative and comprehensive process change as a result ofprocess regulation,

* increased isolation of hazards from the environment as aresult of process regulation and some chance of substitutesas a result of product regulation,
* costs of an intermediate magnitude, and
* few product utility changes.
From the observed cases, the most striking fact that emerges with
respect to the segmented stage is the multiplicity and diversity of
responses. This was true for process regulation (on PVC resin manufac-
ture and to some degree on capacitors) and for product regulations
(capacitors). The PVC resin makers, because of the segmented nature of
the technology, were able to attack the problem using a variety of
approaches aimed at different segments of the process. In the PCB-capa-
citor case, three distinct approaches were taken initially: manifold
filling, PCB substitutes and capacitors that needed less PCB's. The
first of these is a process change, the latter two are product changes.
It would seem that the intermediate position of the segmented stage,
where the product retains some flexibility while the process begins to be
integrated, provides an opportunity for many kinds of responses.
The PVC resin case was an example of comprehensive process change in
the segmented stage. An entire new operation (column stripping) was
introduced, and major changes in reactor operation were implemented. In
addition, overall release of the hazardous material was greatly reduced;
the vinyl chloride stripped from the resins and purged from the reactor
is almost entirely recycled. It is interesting to note that such
recycling requires greater overall integration of the process. Hence,
one effect of process regulations affecting the segmented stage may be to

increase the tendency towards integration and therefore towards rigidity.
As far as the innovativeness of the responses is concerned, the same
situation that occurred with respect to product change in the fluid stage
may exist here with respect to process change. All of the process
changes observed were based partly upon previous lines of effort,
although substantial additional development and engineering may have been
required. Again this may not be indicative of a lack of innovativeness,
but rather of a wealth of previous innovative work upon which to draw.
The PCB-capacitor case showed that product change in the segmented
stage is not impossible, although a preference for process change might
be inferred from the fact that that was the direction initially taken.
In any event, the capacitor makers were able to replace the PCB's and
incorporate a pressure switch in the product to partially make up for
lost resistance to fire.
This lost resistance does represent a product utility loss. In
addition, in the PVC resin case the number of resin lines was reduced.
This represents some loss. Since product line diversity is an indicator
of fluidity, it also represents another way in which the regulation moved
the segment towards increased rigidity.
It is hard to draw any conclusions from these observations about the
cost of compliance in the segmented stage. In the PVC resin case, the
costs were fairly substantial in terms of both capital outlay and opera-
ting expense. The price of PVC was probably affected, but by how much is
not clear. It is also not clear how the price of capacitors was affec-
ted; the substitute dielectrics are generally cheaper, but the need for

the pressure switch adds to the expense.
To summarize, six major hypotheses can be advanced with respect to
regulations affecting the segmented stage:
1. Responses to both product and process regulations arelikely to be quite diverse, with a preference for processchange where possible.
2. Although process change is preferred by such segments, ifthe product is regulated, it may change. Such change isless likely to be comprehensive than in the fluid stage.
3. Process regulation is likely to lead to comprehensiveprocess changes following previously established directions.
4. Greater overall hazard isolation is likely to be achievedthrough increased integration of the process. If productchange occurs, substitutes may or may not be safer.
5. Capital and operating costs arising from process changesmay be significant; price rises are less likely than inthe fluid stage.
5. The utility of the product may be affected, particularly byreducing product line diversity.
5.Regulation of the Rigid Stage
The expected results of regulations affecting the rigid stage were:
* little change as a result of product regulation, with anoccasional innovative and comprehensive response,
* non-cmanprehensive and non-innovative process change as aresult of process regulation, with an occasional majorprocess redesign,
6 a high degree of overall hazard isolation with littlechance of product substitution, and
* relatively high cost solutions.
For the most part, these expectations were realized. The VCM
manufacturers, chlorine-caustic producers, and petroleum refiners essen-
tially chose end-of-the-pipe controls or minor process modifications.

The chlorine-caustic and VCM manufacture cases were examples where a
completely new process may have received a boost from regulation. Also
in these cases, no product change resulted. In the un-leaded gasoline
case, a new product (unleaded gasoline) was mandated, and it was pro-
duced. MMT was also used, but it was not really new, in the sense that
it had already been developed and was conceptually similar to lead
alkyls. (Both are in the broad category of organometallic compounds.)
In spite of the non-comprehensive nature of the changes, both the
VCM manufacturers and the chlorine-caustic producers did improve the
overall isolation of their respective hazards. The gasoline makers did
get some of the lead out, but the questions about MMT make it difficult
to judge if this response represents an overall hazard reduction.
The costs in the VCM and chlorine-caustic cases included both
capital and operating expenses. Again, the effect on the prices is hard
to determine but was probably small. The unleaded gasoline is noticeably
more expensive, presumably because of processing costs.
An interesting unanticipated result was the extensive, fairly
innovative effort by the lead alkyl makers and the refiners to develop
technologies which they hoped would prevent the need for any regulation
of their products. Apparently, the combination of large resources with a
large committment to a particular technology was sufficient to produce
this effort, in spite of the low probability of success.
To summarize, four hypotheses can be advanced regarding regulations
affecting the rigid stage:
1. Process regulation is likely to lead to process change.
Because of the inability to achieve comprehensive change in

existing processes, the development of alternative pro-
cesses may be encouraged.
2. Product regulation is unlikely to lead to product change
unless absolutely necessary; if necessary it may or may
not be innovative and/or comprehensive.
3. Costs are least likely in this stage to be passed on as
price increases because of the generally price-elastic
nature of the markets.
4. Substantial and possibly innovative efforts may be made by
some units in rigid segments to obviate the need for
regulation that would require product changes.
6.Implications for Regulatory Design
Sane hypotheses about the kinds of responses to regulation that can
be expected fraom productive segments in the three stages of technological
rigidity were advanced in the previous section. In spite of the tenta-
tive nature of these hypotheses, their implications for regulatory design
should be considered. Specific policy recommendations would require a
careful examination of these hypotheses in the context of particular
regulatory decisions. Such a detailed examination is beyond the scope of
this research, but it is possible to suggest some general considerations.
The most obvious implication of this research is that regulators
should attempt to assess the technological rigidity of segments likely to
be affected by regulations. Further, they should attempt to go beyond
the directly regulated segments in looking for those which may respond,
particularly when a regulation of a product is being considered and
possible substitutes are being identified. The suppliers and customers
of the regulated segments are likely candidates for producing a response,
but it is also possible that an unanticipated response will emerge from a
new entrant.

Fluid- Stage
In the case of product regulations affecting fluid segments, the
alternative substitutes should be identifiable in advance, based on
previous developments within the segments. Such substitutes should be
scrutinized for unexpected health or environmental consequences and
utility losses as well as cost.
If a hazard is associated with the process of a fluid segment (e.g.
an occupational hazard) regulators should be skeptical about the likeli-
hood of achieving an ultimate solution in the fluid stage through direct
process regulation. Rather, it may be necessary to look for input or
product modification to achieve the desired result without creating a new
problem.
Segmented Stage
By contrast, such process-related problems should be solvable in the
segmented stage and hence process regulation may be desirable and effec-
tive. Such segments can draw on previous development work to deal with
those portions of the process that are a problem and integrate the
process overall.
In addition, regulators should be cognizant of the multiplicity of
responses that may develop in such segments. If the qualitatively
different approaches that may develop can be identified in advance,
regulators may be able to direct developments towards technologies that
are consistent with long range goals. For example, if process change is
being attempted, the regulator may perceive that a product change would
be a better ultimate solution in this case. Such change may be possible,
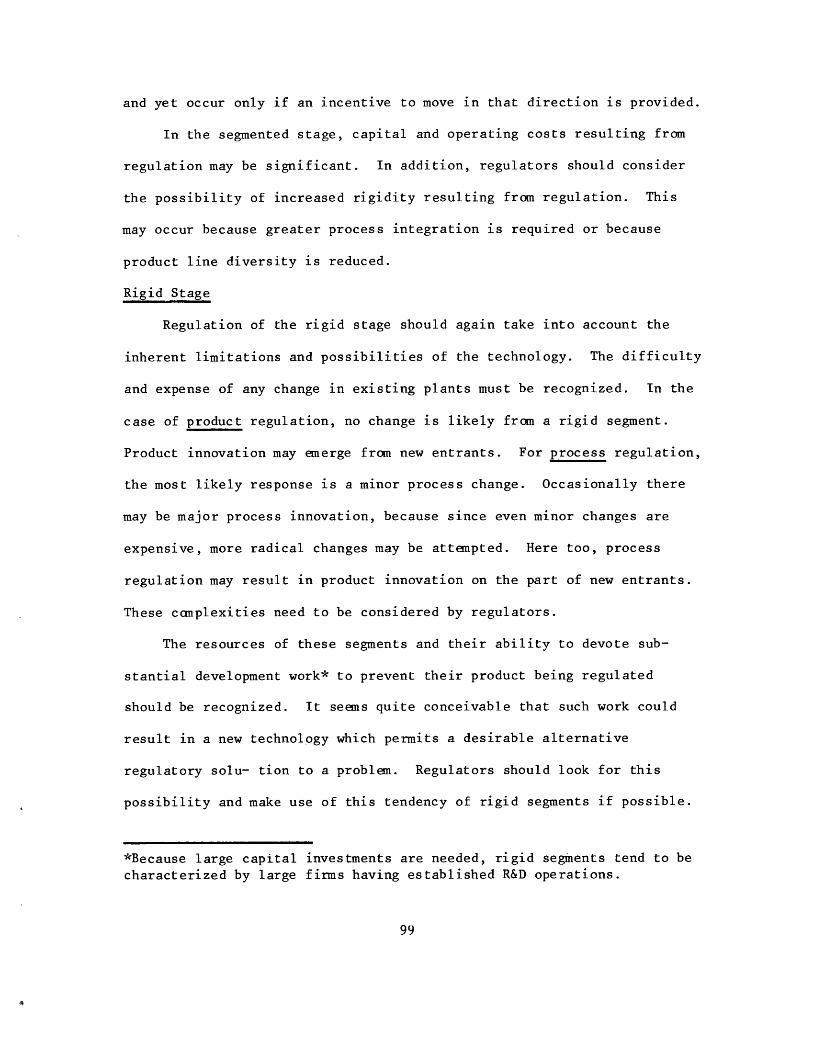
and yet occur only if an incentive to move in that direction is provided.
In the segmented stage, capital and operating costs resulting from
regulation may be significant. In addition, regulators should consider
the possibility of increased rigidity resulting from regulation. This
may occur because greater process integration is required or because
product line diversity is reduced.
Rigid Stage
Regulation of the rigid stage should again take into account the
inherent limitations and possibilities of the technology. The difficulty
and expense of any change in existing plants must be recognized. In the
case of product regulation, no change is likely from a rigid segment.
Product innovation may emerge from new entrants. For process regulation,
the most likely response is a minor process change. Occasionally there
may be major process innovation, because since even minor changes are
expensive, more radical changes may be attempted. Here too, process
regulation may result in product innovation on the part of new entrants.
These complexities need to be considered by regulators.
The resources of these segments and their ability to devote sub-
stantial development work* to prevent their product being regulated
should be recognized. It seems quite conceivable that such work could
result in a new technology which permits a desirable alternative
regulatory solu- tion to a problem. Regulators should look for this
possibility and make use of this tendency of rigid segments if possible.
*Because large capital investments are needed, rigid segments tend to be
characterized by large firms having established R&D operations.
Finally, great care should be taken in imposing regulations that may
increase the rigidity of these already rigid segments. Sometimes there
may be no choice, but the possibility of such increased rigidity should
be considered in regulatory decisions.
7. Assessment of the Approach and Suggestions for Future Work
Much effort was devoted at the beginning of this study to the
development of a conceptual framework for studying the technology-res-
ponse relationship. On the basis of an initial application, a prelimi-
nary assessment of that framework is possible. Based on that assessment,
some areas of additional study that are likely to prove fruitful can be
suggested.
First of all, the concept of technological rigidity seems fairly
easy to apply. In addition, although the results contained herein are
not conclusive, it would seem that rigidity is useful in predicting the
nature of the response.
Of course, it is necessary that this notion be applied to other
kinds of industries if its relevance to the technology-response relation-
ship is to be established generally. The basis of the idea is in fact
quite general, so there is no reason at this point to believe that it
cannot be generalized. Further, in this study the approach seemed
equally applicable to the chemical industry and to the non-chemical
segments which were included because the regulations impacted on them
indirectly.
If the applicability is to be rigorously established, an operational
measure of technological rigidity is needed. For this purpose, the five
100

"aspects" of technological rigidity summarized in Chapter Two (narrowness
of equipment function, automaticity, continuity, degree of standardiza-
tion and price vs. quality as the basis of competition) could be con-
densed to a three dimensional scale. One dimension would be "continu-
ity," and Woodward's scale (Table 2.1) or the modified Woodward scale
used by Hickson, et. al. could be used to measure it. The second dimen-
sion would be "integration" and an appropriate measure would be Hickson's
"workflow rigidity" scale (Table 2.2). Finally, some scale of product
standardization and degree of emphasis on performance maximization is
needed. This would have to be based on the subjective judgement of an
individual in the productive segment. The five-point scale in Table 5.2
is suggested as a measure of this dimension.
Of course, this notion of "physical" rigidity is inherently more
limited than a notion which encompasses the historical trends exhibited
by a segment. This limitation was accepted in order to make the charac-
terization of segments by rigidity more straightforward. However, a
characterization which also included an historical examination would be
expected to be an even better predictor of future technological change.
It would also seem to be useful to try to identify important attri-
butes of technologies that are independent of rigidity. Although this
thesis has argued that there are important ways in which (for example)
transformer manufacture and paint formulation are similar, there are also
obvious differences. Saome of these are likely to be important for
regulation.
With respect to the characterization of the responses, additional
101

TABLE 5.2
SUGGESTED SCALE FOR MEASURING
DEGREE OF CUSTOM PRODUCT DESIGN
1. custom designed products made to individual specifications
2. large number of related products which do not compete with eachother on the basis of price
3. distinct product lines exist; differentiation among lines is largeboth in terms of price and quality
4. small number of product lines with smaller degree of price andquality differentiation
5. standardized commodity with virtually no quality differences amongcampeting products
TABLE 5.3
SUGGESTED SCALE FOR MEASURING THE
INNOVATIVENESS OF THE RESPONSE
1. technology was already in commercial use in similar situation
2. technology was already in commercial use but some adaptation required
3. technology was not previously in commercial use but some developmentwork had been done
4. idea had been considered but no significant development work hadbeen done
5. totally new idea
102

work is needed to develop workable measures and to investigate the
usefulness of the concepts in more case studies involving different
regulations and different industries. Though subjective judgments are
required, "innovativeness," "comprehensiveness" and "degree of hazard
isolation" do seem to be possible to apply to different situations.
Suggested five-point scales for evaluating each are presented in Tables
5.3 through 5.5. On the other hand, the attempt to compare costs and
product utility losses in different cases is frequently frustrated by
apparently incommensurable outcomes. Perhaps these concepts need to be
further subdivided to yield attributes that can be compared across
different cases.
The tentative conclusions about likely responses from segments in
different stages of rigidity will only be established by investigation of
different segments and regulations. There is also clearly room for
further exploratory work to discover additional relationships between
technological features and responses. In addition, regulation does
result in indirect and long-run changes in industries, which were not
investigated in this study. The interaction of technological factors
with those effects needs exploration.
Finally, there is a need to combine this line of investigation with
an understanding of attributes of regulations which are determinants of
the response. Such an integration would express what is known about this
process in the form most useful to regulators.
103
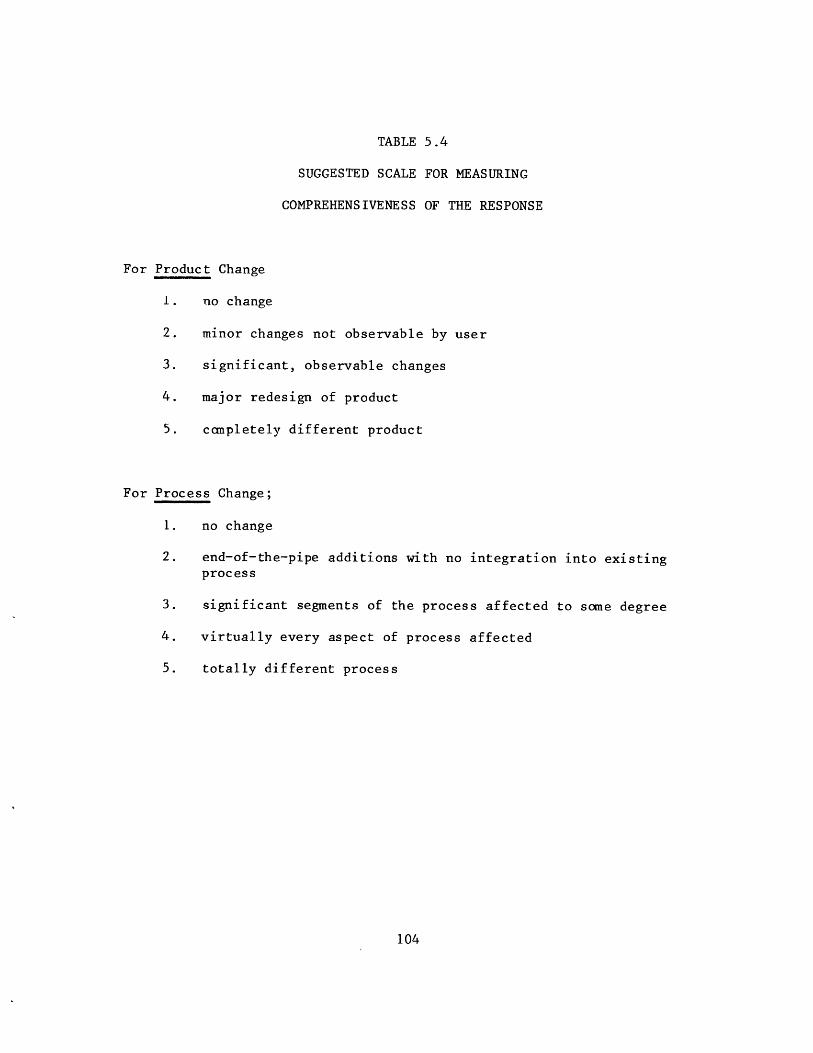
TABLE 5.4
SUGGESTED SCALE FOR MEASURING
COMPREHENSIVENESS OF THE RESPONSE
For Product Change
1. no change
2. minor changes not observable by user
3. significant, observable changes
4. major redesign of product
5. canpletely different product
For Process Change;
1. no change
2. end-of-the-pipe additions with no integration into existingprocess
3. significant segments of the process affected to some degree
4. virtually every aspect of process affected
5. totally different process
104

TABLE 5.5
SUGGESTED SCALE FOR MEASURING
HAZARD ISOLATION AND SUBSTITUTION
For Product Change:
1. substitute for regulated material is even more hazardous thanthe regulated material itself
2. substitute equally hazardous
3. safety of substitute uncertain
4. substitute is clearly somewhat safer than regulated material
5. substitute is of unquestionable safety
For Process Change:
1. hazardous material is now released to the environment which was
previously contained
2. overall release of hazardous material to the environment isunchanged
3. hazardous material which was previously released is now cap-tured and destroyed or sent to scientific landfill
4. hazardous material which was previously released is now recycled
5. hazardous material which was previously released now has noopportunity to escape from process
105

APPENDIX ONE
HAZARD SELECTION
1.Hazards Identified as Regulated
asbestos13 carcinogensvinyl chlorideammoniaberylliumexplosive materials6 ketoneskeponecarbolic acidleadsulfur dioxidetoluenetrichloroetheylenealkylbenzenecyclohexaneozoneacetyleneacrylamideallyl chloridecarbon dioxideepichlorohydrinhydrogen cyanidehydrogen sulfidemethyl parathiontetrachloroethylenecadmiumcarbon tetrachloridechlorinechloroformmercurymethyl alcoholmethyl chloroformoxalic acidnitric acidnitrogen oxidephenolsilicaaluminum sulphateparathionbutanes
formaldehydeoil of bergamotsodium hydroxidepotassium hydroxidecyanide saltshydrochloric acidsulfuric acidsilver nitratemineral spiritnickeloctanespentanespetroleum naphthaphosgenestoddard solventbenzidineethylene dichloridehydrogen fluoridexylenehypochlorous acidpotassium hydroxide
solutionred dye #2polychlorinatedbiphenyls
phosphatemirexstrobanealdrin/dieldrinchlorobenzilateDDTDDDDDEendrinpanogennitrosaminesphotochemical oxidantssodium azidenitrogen dioxidecalcium hydroxide
silverzincsolventsbutadienecyanoacylate adhesivesacrylic termpolymer
sealantpolyurethane foamtris (2,3 dibromopropylphosphate)
methylene chlorideacetoneacrylonitrileethylene oxidecaptan2,4,5-Tlinear alkylbenzenesulfonate (LAS)
carbaryldicambaguthionlead arsenatechlorofluorocarbonsamitrolealuminum chloridehydrogen peroxidecalcium carbidepotassium dichromatetitanium dioxidefatty acidsiodineglycerineureaBOD/CODbenzeneflammable fabricscalcium chloridehydrocarbonscalcium oxidepotassium sulfate
106

carbon disulfidehexanes4,4'diaminodiphenyl-
methanekeroseneturpentinecarbon monoxideparaphenylenediamineepoxy resinscopper sulfateferrous sulfatelead monoxide
fluoridesphosphoric acid
particulatessulfatestoxaphene
barium
nitrate
selenium
cuprous oxide
hydrogen
manganese sulfate
sulfur trioxide
sodium carbonatesodium dichromatesodium chloridesodium silicatesodium sulphiteammonium chloridealuminum fluorideammonium hydroxideacetic acidchromic acidnickel sulfatelithium carbonate
2.Hazards Affecting More than One Productive Segment
asbestosacrylonitrilecarbon tetrachloridevinyl chloridehydrogen sulfidecadmiumPCB'sparticulatesfluoridestoluenephosphatesnitriteschlorofluorocarbons
ammoniachromiumtrichloroethylenehydrogen cyanidesulfuric acidberylliumbutadieneBODleadtoxapheneseleniumred dye #2
arsenicchlorinechloroformcyanide saltsbenzeneacids/alkaliesreactive hydrocarbonsflammable fabricsmercurynitric acidalkylbenzene sulfonateethylene oxide
3.Widely Distributed and Highly Regulated Hazards
arsenicbenzene, toluene and
xylenetoxaphene
carbon tetrachloridePCB'sleadphosphates
vinyl chloridereactive hydrocarbonsmercurynitrites
107

APPENDIX TWO
GLOSSARY OF ABBREVIATIONS
CFR: Code of Federal RegulationsCO: carbon monoxideCPA: MIT Center for Policy AlternativesCPSA: Consumer Product Safety Act
CPSC: Consumer Product Safety Commission
EDC: ethylene dichlorideEPA: U.S. Environmental Protection Agency
FDA: Food and Drug AdministrationFHSA: Federal Hazardous Substances Control Act
FWPCA: Federal Water Pollution Control Act
HC: hydrocarbonsHg: mercuryKCI: potassium chlorideLBPPPA: Lead Based Paint Poison Prevention Act
MMT: methylcyclopentadienyl manganese tricarbonyl
NaC1: sodium chlorideNIOSH National Institutes of Occcupational Safety and Health
OSHA: Occupational Safety and Health Act or
Occupational Safety and Health Administration
PCB's polychlorinated biphenyls
ppm: parts per million; ppmv: parts per million by volume;
ppmw: parts per million by weight
PVC: polyvinyl chlorideRVCM: residual vinyl chloride monomer
SIC: Standard Industrial CodeSRI: Stanford Research InstituteTEL: tetraethyl lead
TML: tetramethyl leadTSCA: Toxic Substances Control Act
TWA: Time Weighted AverageVCM: vinyl chloride monomer
108