Chabot College 2012 Facilities Master Plan MND/Initial …€¦ · Chabot College 2012 Facilities...
333
Chabot College 2012 Facilities Master Plan MITIGATED NEGATIVE DECLARATION/ INITIAL STUDY Chabot Las Positas Community College District Draft September 2017 Prepared by: PLACEMAKERS Fehr & Peers Geoffrey H. Hornek JAS Environmental Consulting
Transcript of Chabot College 2012 Facilities Master Plan MND/Initial …€¦ · Chabot College 2012 Facilities...
Chabot College 2012 Facilities Master Plan MITIGATED NEGATIVE DECLARATION/ INITIAL STUDY
Chabot Las Positas Community College District Draft September 2017 Prepared by: PLACEMAKERS Fehr & Peers Geoffrey H. Hornek JAS Environmental Consulting
Chabot Las Positas
Community College District
NOTICE OF INTENT TO ADOPT A MITIGATED NEGATIVE DECLARATION FOR THE CHABOT COLLEGE 2012 FACILITIES MASTER PLAN
PROJECT TITLE: Chabot College 2012 Facilities Master Plan
PROJECT LOCATION: 25555 Hesperian Boulevard, Hayward, CA 94568
PROJECT SPONSOR: Chabot Las Positas Community College District (District)
DATE OF PUBLIC NOTICE: September 22, 2017
PUBLIC REVIEW PERIOD: September 25, 2017 to October 24, 2017
DATE OF PUBLIC HEARING: November 14, 2017 – 6:30 pm
LOCATION OF PUBLIC Chabot Las Positas Community College District HEARING: 7600 Dublin Boulevard – 3rd Floor Dublin, CA 94568 Project Description: The Chabot College 2012 Facilities Master Plan (FMP) would replace and upgrade existing obsolete facilities, improve on-campus pedestrian and vehicular circulation, enhance daily student activity and open up vistas from and to the campus and the community. The FMP would be implemented in four phases over the next 17 years with construction starting in 2017 and ending in 2034. The FMP would construct eight new buildings, with six of the new buildings constructed on the sites of existing buildings which would be demolished; renovate three existing buildings and undertake improvements to existing athletic facilities. Environmental Review: An Initial Study (IS) has been prepared under the requirements of the California Environmental Quality Act (CEQA) for review and action by the District. The IS evaluates the potential environmental impacts of the proposed Project. Based on the results of the IS prepared according to CEQA Guidelines, it has been determined the Project will not have a significant effect on the environment and a Mitigated Negative Declaration (MND) has been prepared. The Project has been modified to incorporate mitigation measures identified in the IS that will reduce any potentially significant impacts to a less-than-significant level. Public Review: The Draft MND/IS is available for public review at the District office at 7600 Dublin Boulevard – 3rd Floor, Dublin, CA 94568. The MND/IS is also available on the District website at: http://www.clpccd.org/bond/. Any interested party may comment on the proposed MND/IS. All comments received will be considered by the District prior to finalizing the MND/IS and making a decision on the Project. Written comments must be received no later than 4:00 pm on October 24, 2017 and sent to: Doug Horner, Vice Chancellor, Facilities/Bond Programs and Operations 7600 Dublin Boulevard – 3rd Floor
Dublin, CA 94568 Email: [email protected]
Draft – September 2017
Chabot College 2012 Facilities Master Plan MND – 1
MITIGATED NEGATIVE DECLARATION
PROJECT DESCRIPTION The proposed Project is the Chabot College 2012 Facilities Master Plan (2012 FMP) which comprises the following elements:
• Library Building: located at the site of the Grand Court and immediately south of the existing library building, which will be demolished.
• Student Union Building: located at the site of the cafeteria, learning center and other student services building, which will be demolished.
• Administration Building: located at the site of the existing Administration Building, which will be demolished.
• TV and Radio Broadcast Building: located at the site of the existing Building 3600, which will be demolished.
• Biology Building: located at the site of the existing Biology Building 2100 which will be demolished.
• Science Facility: located at the site of the existing Math & Science Faculty Building 2000, which will be demolished.
• Renovation of Engineering Department Labs Building: this will be a full renovation including new exterior, seismic upgrade, hazardous material removal, new restrooms and new mechanical systems.
• Renovation of Performing Arts Building: this will include new paint, carpet, upholstery, lighting, audio, and updates to the backstage area. An addition at the front of the building will incorporate a larger lobby, ticket/concession area, restrooms and elevators to reach seating at the mezzanine level.
• School of the Arts (SOTA) Building: the existing one-story SOTA building will be demolished and replaced with a new two-story building at the same site.
• Addition to Maintenance & Operations Warehouse Building: an addition to the existing Building 3400 will provide space for storage and vehicle maintenance.
• New Garage Annex for Automotive Area: A new garage annex will be constructed to house ten BMW’s, used for study, in a safe utilitarian environment.
• Athletic Field Site Improvements: The baseball field will be completely removed and rebuilt with turf, bleachers, site lighting, dugouts, batting cages and scoreboard; and the adjacent restroom building will be renovated. The practice field will be dug up to place new pipes, and covered with new turf to improve drainage. The upper deck of the pool deck will be renovated. New accessible bleachers, stadium lighting and a scoreboard will be installed at the football stadium. A javelin area will be provided on the soccer field.
Draft – September 2017
Chabot College 2012 Facilities Master Plan MND – 2
Buildout of the 2012 FMP would occur in four development phases: Phase 1: 2017 – 2022; Phase 2: 2021 – 2026; Phase 3: 2025 – 2030; and Phase 4: 2029 - 2034. Phase 1 is anticipated to begin in Spring 2017. Construction hours would 7:00 am to 4:00 pm Monday through Friday. If it is necessary to occasionally conduct construction activities on Saturdays, construction activities will start at 9:00 am.
PROJECT LOCATION Chabot College 25555 Hesperian Boulevard Hayward, CA 94545
PROJECT SPONSOR Chabot Las Positas Community College District 7600 Dublin Boulevard – 3rd Floor Dublin, California 94568
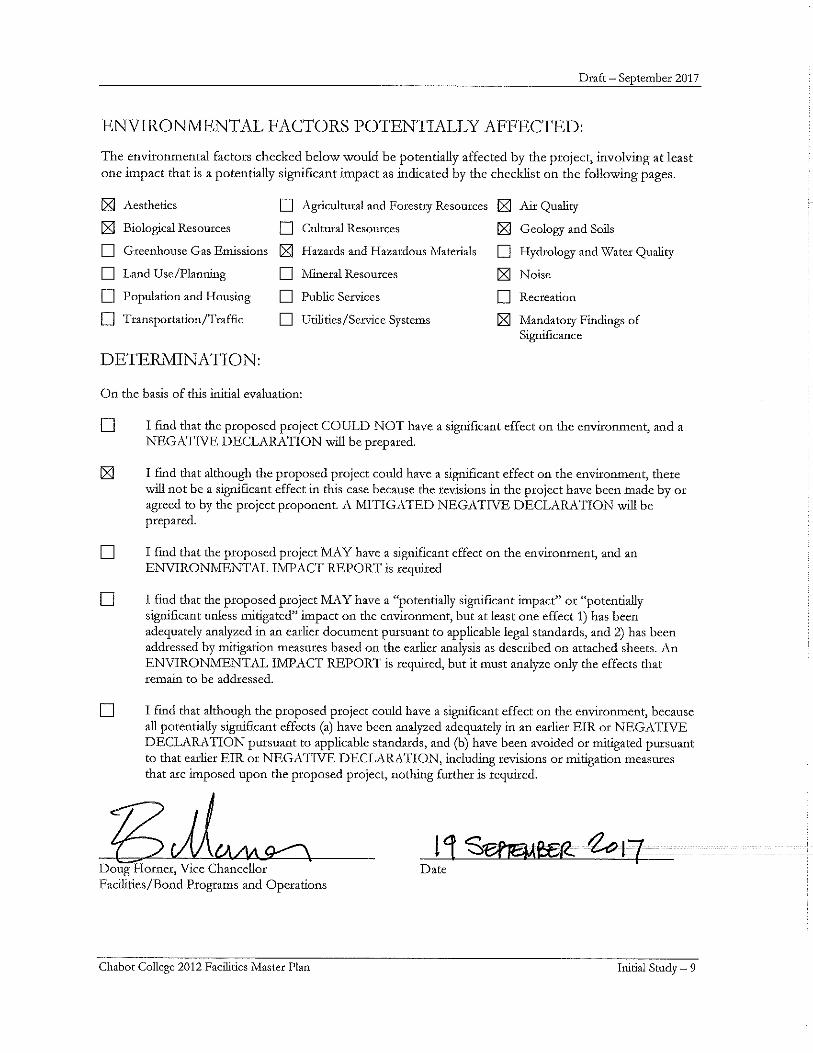
FINDING The Project will not have a significant effect on the environment based on the Initial Study prepared according to CEQA Guidelines. Mitigations have been incorporated into the Project to reduce the identified potentially significant impacts to a less-than-significant level.
POTENTIALLY SIGNIFICANT IMPACT The attached Initial Study indicates that the Project could adversely affect the environment. Potentially significant impacts were identified and are presented below.
MITIGATION MEASURES In the interest of reducing the potential impact to the point where the net effect of the Project is insignificant, mitigation measures are recommended. A discussion of the potential impacts of interest and the associated mitigation measures is provided below.
AESTHETICS
Impact: Site and security lighting would be installed at the existing baseball field, which represents a potentially significant light and glare impact to nearby residences.
Mitigation Measure:
AES-1 A lighting plan, which includes a photometric study, shall be prepared for the proposed lighting of the existing baseball field. The lighting plan shall include the location of all light poles. Light poles shall be equipped with hooded lamps to cast light downwards to illuminate the baseball field and adjacent areas only. There will be no light spillover onto adjacent residences located to the west and north of the baseball field.
Residual Impact: Less than significant with implementation of the recommended mitigation measure.
Draft – September 2017
Chabot College 2012 Facilities Master Plan MND – 3
AIR QUALITY
Impact: Buildout of the 2012 Facilities Master Plan would result in short-term air pollution emissions as a result of construction activities during each development phase.
Mitigation Measure:
AIR-1 Project reactive organic gases (ROG) emissions from architectural coating application shall be reduced to 54 lbs/day or less through the implementation of any of the following measures or some combination thereof as required:
• Stretch out the architectural coating applications phases for any building constructed under the FMP to 3 weeks or more, and assure that the finishing phases of any two concurrently constructed buildings do not overlap;
• Use architectural coatings with a lower ROG content than BAAQMD regulations require; and/or
• Use building components that have had their surfaces factory-finished and so reduce the need for on-site painting or finishing with ROG-containing paints.
Prior to the beginning of any construction, final plans shall be submitted for CLPCCD approvals that demonstrate attainment of the BAAQMD 54 lbs. /day limit on ROG emissions during construction.
Residual Impact: Less than significant with implementation of the recommended mitigation measure.
BIOLOGICAL RESOURCES
Impact: Buildout of the 2012 FMP could result in significant adverse impacts to swallows nesting on the Chabot College campus.
Mitigation Measures:
BIO-1 Chabot College shall continue its building maintenance program to prevent swallows from nesting in College buildings. Methods to discourage nesting swallows shall include but are not limited to:
• Netting to prevent access to building eaves.
• Enclosing and/or covering openings in building accessible to swallows for nest building.
• Inspecting buildings on an annual basis to replace and/or repair netting and cover openings.
BIO-2 Between March 15 and August 15 (nesting/breeding period), prior to the demolition or exterior modernization of College buildings, the buildings shall be surveyed by a qualified biologist 30 days in advance of the construction activity to determine if nests are present and in use during this period. If nests are in use, construction activity at the building shall be delayed and a qualified biologist shall continue the surveys until it has been determined that any young have fledged and are no longer using the nest. If construction activities occur outside of the nesting/breeding period, surveys will not be required.

Draft – September 2017
Chabot College 2012 Facilities Master Plan MND – 4
Residual Impact: Less than significant with implementation of the recommended mitigation measures.
GEOLOGY AND SOILS
Impact: Strong ground shaking may be expected at the Chabot College campus during the design lifetime of the proposed buildings identified in the 2012 Facilities Master Plan.
Impact: Liquefaction hazards may exist throughout the campus.
Mitigation Measure:
GEO-1 Detailed geotechnical investigations shall be performed prior to the design of each of the six proposed new buildings. The geotechnical investigations shall include borings and laboratory testing to provide supporting data for geotechnical design recommendations.
Residual Impact: Less than significant with implementation of the recommended mitigation measure.
HAZARDS
Impact: There is the potential that buildings proposed for demolition and renovation may contain asbestos-containing building materials, lead-containing building materials, loose & peeling lead containing paint, and/or polychlorinated biphenyl (PCB)-containing building materials.
Impact: Grading and excavation and potential off-haul of soil during each development phase may disturb soils containing hazardous substances or materials based on historical or current use at the building sites.
Mitigation Measures
HAZ-1 Prior to the demolition of the five buildings and renovation of the two buildings identified in the 2012 FMP, a Hazardous Materials Building Survey shall be prepared for each building. The Hazardous Materials Building Survey shall include identification of suspect asbestos-containing building materials, lead-containing building materials, loose & peeling lead containing paint, mercury light tubes, mercury thermostat switches, and polychlorinated biphenyl (PCB)-light ballasts, and PCB-containing building materials that may be impacted during the demolition of the five buildings. If the inspection confirms the presence of asbestos-contain materials (ACMs) or other hazardous building materials in any of the building, the hazardous materials shall be removed from these buildings prior to demolition and be transported in compliance with State and federal requirements.
HAZ-2 Prior to the initiation of grading and excavation activities, a Phase I Environmental SA. The Phase I ESA Report for the subject property shall be prepared in accordance with the American Society for Testing and Materials Standard Practice for Environmental Site Assessments: Phase I Site Assessment Process E 1527-13 and the United States Environmental Protection Agency (US EPA) 40 CFR Part 312 Standards and Practices for All Appropriate Inquiries (AAI) – Final Rule adopted November 1, 2006 and amended December 30, 2013.
Residual Impact: Less than significant with implementation of the recommended mitigation measures.
Draft – September 2017
Chabot College 2012 Facilities Master Plan MND – 5
NOISE
Impact: During Project construction activities, noise levels in on-campus areas adjacent to the construction sites would temporarily increase with potential adverse noise and vibration impacts on instruction/research/work activities.
Mitigation Measures:
NOISE-1 The following Best Management Practices shall be incorporated into the Project construction documents:
• Provide enclosures and noise mufflers for stationary equipment, shrouding or shielding for impact tools, and barriers around particularly noisy activity areas on the site.
• Use quietest type of construction equipment whenever possible, particularly air compressors.
• Provide sound-control devices on equipment no less effective than those provided by the manufacturer.
• Locate stationary equipment, material stockpiles, and vehicle staging areas as far as practicable from sensitive receptors.
• Prohibit unnecessary idling of internal combustion engines.
• Require applicable construction-related vehicles and equipment to use designated truck routes when entering/leaving the site.
• Designate a noise (and vibration) disturbance coordinator at the CLPCCD who shall be responsible for responding to complaints about noise (and vibration) during construction. The telephone number of the noise disturbance coordinator shall be conspicuously posted at the construction site. Copies of the project purpose, description and construction schedule shall also be distributed to the surrounding residences.
• Prohibit project construction activity between the hours of 6:00 p.m. Saturday to 7:00 a.m. Monday; 8:00 p.m. to 7:00 a.m. on Monday, Tuesday, Wednesday and Thursdays; 8:00 p.m. Friday to 9:00 a.m. on Saturday or at all on city-observed holidays.
NOISE-2 To the extent feasible, in instances where vibration-intensive construction equipment is located next to on-campus vibration-sensitive receptors that would result in major disruption, the District shall temporarily re-locate the vibration-sensitive receptors to minimize disruption.
Residual Impact: Less-than-significant with the recommended mitigation measures.
Draft – September 2017
Chabot College 2012 Facilities Master Plan MND – 6
This page intentionally left blank
Draft – September 2017
Chabot College 2012 Facilities Master Plan Initial Study – i
CHABOT COLLEGE FACILITIES MASTER PLAN INITIAL STUDY
TABLE OF CONTENTS
Page
PROJECT INFORMATION 1 PROJECT DESCRIPTION 9 ENVIRONMENTAL FACTORS POTENTIALLY AFFECTED 9 DETERMINATION 9 EVALUATION OF ENVIRONMENTAL IMPACTS 10 ENVIRONMENTAL CHECKLIST 10 1. Aesthetics 10 2. Agriculture and Forestry Resources 12 3. Air Quality 14 4. Biological Resources 26 5. Cultural Resources 29 6. Geology and Soils 30 7. Greenhouse Gas Emissions 33 8. Hazards and Hazardous Materials 39 9. Hydrology and Water Quality 43 10. Land Use and Planning 55 11. Mineral Resources 57 12. Noise 58 13. Population and Housing 68 14. Public Services 69 15. Recreation 71 16. Transportation and Circulation 72 17. Utilities and Service Systems 90 18. Mandatory Findings of Significance 92 AGENCY DISTRIBUTION LIST 94 APPENDICES
A. Transportation Modeling Data A-1
Draft – September 2017
Chabot College 2012 Facilities Master Plan Initial Study – ii
Page
LIST OF FIGURES
Figure 1 Project and Regional Location 2 Figure 2 Existing Chabot Campus Plan - 2012 4 Figure 3 Proposed Chabot College 2012 Facilities Master Plan 6 Figure 4 Noise Measurement Locations Map 60 Figure 5 Project Site Vicinity and Study Intersection Locations 73 Figure 6 Project Trip Distribution 81
LIST OF TABLES
Table 1 Chabot College Athletic Events 3 Table 2 Chabot College Facilities Master Plan Building Program 8 Table 3 Local Ambient Air Quality Monitoring Summary 15 Table 4 CEQA Air Quality Significance Thresholds for Criteria Air Pollutant Emissions 16 Table 5 Project Construction Criteria Pollutant Emissions 18 Table 6 Project Daily Operational Criteria Pollutant Emissions 20 Table 7 Project Daily Operational Criteria Pollutant Emissions 21 Table 8 Project Daily Operational Criteria Pollutant Emissions 23 Table 9 Cumulative TAC Impacts on Existing Sensitive Receptors in the Project Site Zone of
Influence (within 1,000 feet of Chabot College campus) 24 Table 10 Chabot College Greenhouse Gas Emissions 37 Table 11 Chabot College Campus/Vicinity Noise Measurement Data (weekday afternoon –
January 17, 2017) 59 Table 12 FTA Incremental Transportation Source Noise Impact Criteria 64 Table 13 Modeled Construction Noise Levels 65 Table 14 Level of Service Methodology – Signalized Intersections 76 Table 15 Level of Service Methodology – Unsignalized Intersections 77 Table 16 Intersection LOS Summary – Existing Conditions 78 Table 17 Project Trip Generation Summary 80 Table 18 Intersection LOS Summary Existing and Existing Plus Project Conditions 82 Table 19 Intersection LOS Summary Background and Background Plus Project Conditions 84 Table 20 Intersection LOS Summary Cumulative and Cumulative Plus Project Conditions 86 Table 21 Parking Demand Summary 87 Table 22 CMP Roadway Network Analysis 88
Draft – September 2017
Chabot College 2012 Facilities Master Plan Initial Study – 1
ENVIRONMENTAL REVIEW – INITIAL STUDY
PROJECT INFORMATION
Project Title: Chabot College 2012 Facilities Master Plan Lead Agency Name and Address: Chabot Las Positas Community College District
7600 Dublin Boulevard – 3rd Floor Dublin, CA 94568
Contact Person and Email Address: Doug Horner, Vice Chancellor
Facilities/Bond Programs and Operations Facilities & Bond Program Email: [email protected] Phone: 510.723.7631
Project Location: 25555 Hesperian Boulevard
Hayward, CA 94545 Project Sponsor’s Name and Address: Chabot Las Positas Community College District
7600 Dublin Boulevard – 3rd Floor Dublin, CA 94568
General Plan Designation: Public/Quasi Public Zoning Designation: RS-Single Family Residential
PROJECT DESCRIPTION
PROJECT LOCATION
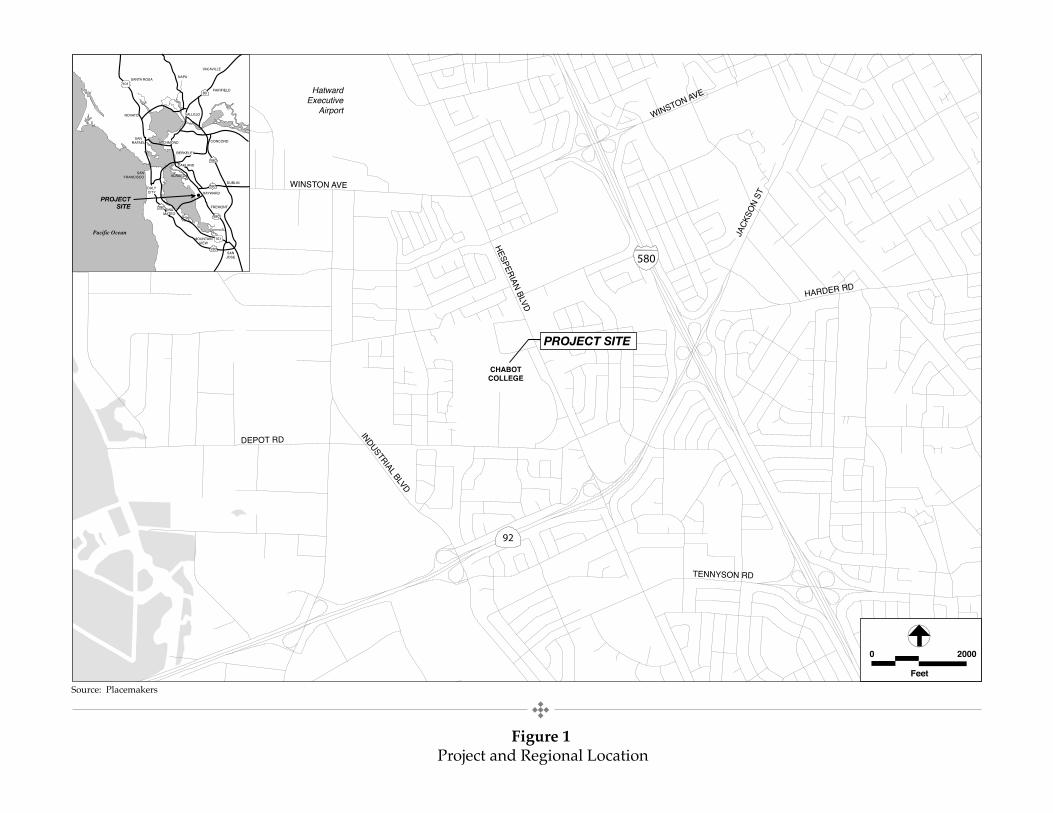
Chabot College is located in Hayward, California. The campus is located on the northwest corner of Hesperian Boulevard and Depot Road. Hesperian Boulevard connects with Highway 92 (about 0.2 mile to the south) which provides access to Interstate 880, located about 0.5 mile east of the campus. Figure 1 shows the Project and regional location.
BACKGROUND
Chabot College was established in 1965. In 2005, a Facilities Master Plan (2005 FMP) was prepared for the campus identifying new buildings and infrastructure and renovation of existing buildings (Chabot-Las Positas Community College District 2005a). A Mitigated Negative Declaration (MND) was completed for the 2005 FMP and concluded all potentially significant impacts would be reduced to less than significant with implementation of the recommended mitigation measures identified in the MND (2005 Chabot-Las Positas Community College District 2005b).
HESPERIAN BLVD
DEPOT RD
WINSTON AVE
HARDER RD
WINSTON AVE
JACK
SON
ST
INDUSTRIAL BLVD
TENNYSON RD
HatwardExecutive
Airport
CHABOTCOLLEGE
92
580
Pacific Ocean
NOVATO
SANRAFAEL
MOUNTAINVIEW
SANJOSE
FREMONT
HAYWARD
DUBLIN
CONCORD
SANTA ROSANAPA
FAIRFIELD
ALAMEDASAN
FRANCISCO
DALYCITY
BERKELEY
VALLEJO
VACAVILLE
SANMATEO
OAKLAND
RICHMOND
101
80
680
580
280
280
880
101
PROJECTSITE
Figure 1 Project and Regional Location
Source: Placemakers
20000
Feet
PROJECT SITE
Draft – September 2017
Chabot College 2012 Facilities Master Plan Initial Study – 3
The Chabot College campus is undergoing a process of renewal. Over the last ten years, the College’s headcount has fallen from 14, 696 (Fall Semester 2007) to 12,593 (Spring Semester 2017 preliminary count). Student enrollment has stabilized and is not projected to result in significant increases in headcount on the campus over the next ten years. Consequently, the 2012 FMP emphasizes upgrading and replacing existing obsolete facilities, improving on-campus pedestrians and vehicular circulation, enhancing daily student activity and opening up vistas from and to the campus and the community. (Chabot-Las Positas Community College District 2012). Measure A was passed in June 2016 and will provide funds to implement the 2012 FMP for Chabot College.
For the Fall Semester 2016 there were 14,317 registered students. Of these, 1,432 took online courses, 146 students were Saturday only, 2,546 went to evening and Saturday classes, 3,221 went both day and evening/Saturday and 6,972 went to weekday classes only. The total number of weekday students was 10,193 students. The College projects about a one percent increase per year in registered weekday students, about 100 students, for a total of about 950 students by 2026.
EXISTING CONDITIONS
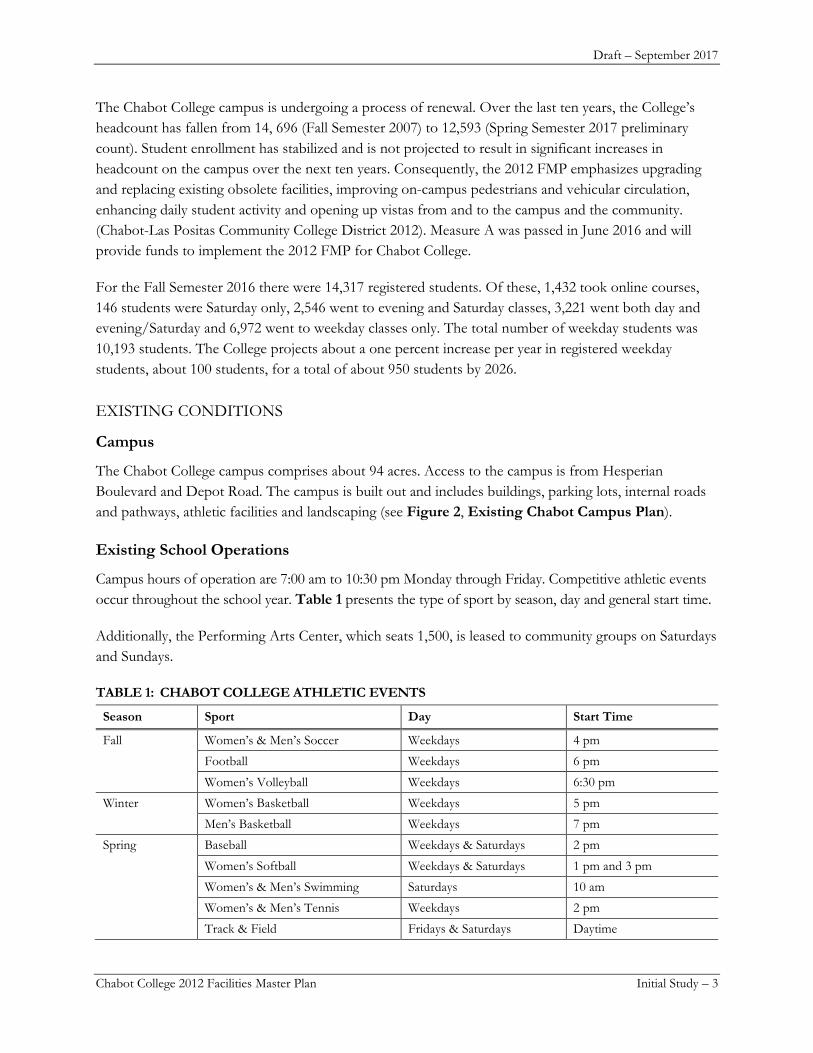
Campus
The Chabot College campus comprises about 94 acres. Access to the campus is from Hesperian Boulevard and Depot Road. The campus is built out and includes buildings, parking lots, internal roads and pathways, athletic facilities and landscaping (see Figure 2, Existing Chabot Campus Plan).
Existing School Operations
Campus hours of operation are 7:00 am to 10:30 pm Monday through Friday. Competitive athletic events occur throughout the school year. Table 1 presents the type of sport by season, day and general start time.
Additionally, the Performing Arts Center, which seats 1,500, is leased to community groups on Saturdays and Sundays.
TABLE 1: CHABOT COLLEGE ATHLETIC EVENTS
Season Sport Day Start Time
Fall Women’s & Men’s Soccer Weekdays 4 pm
Football Weekdays 6 pm
Women’s Volleyball Weekdays 6:30 pm
Winter Women’s Basketball Weekdays 5 pm
Men’s Basketball Weekdays 7 pm
Spring Baseball Weekdays & Saturdays 2 pm
Women’s Softball Weekdays & Saturdays 1 pm and 3 pm
Women’s & Men’s Swimming Saturdays 10 am
Women’s & Men’s Tennis Weekdays 2 pm
Track & Field Fridays & Saturdays Daytime
Figure 2 Existing Chabot College Campus Plan – 2012
Source: Chabot-Las Positas Community College District 2012 Facilities Master Plan
Draft – September 2017
Chabot College 2012 Facilities Master Plan Initial Study – 5
Surrounding Land Uses
Land uses surrounding the campus include: residential along the northwest campus boundary and Anthony W. Ochoa Middle School along the southwest campus boundary; residential and Fry Farmstead along the north campus boundary; commercial, retail and residential to the east across Hesperian Boulevard; and residential to the south across Depot Road.
PROPOSED FACILITIES MASTER PLAN PROGRAM
Presented below are the proposed elements of the 2012 FMP. Figure 3, Proposed Chabot College 2012 Facilities Master Plan, shows proposed new construction and renovation and existing buildings to remain.
New Library Building (B100)
The new Library Building will include study rooms, computer classrooms, open labs, tutoring areas, and Center for Teaching and Learning.
New Student Union Building (B2300)
The new Student Union Building will include dining area, food service kitchen, and servery. The building will also house student government, work space for student clubs, the Mass Communications Journalism program, Student Health Center, Veteran’s Resource Center, Disabled Students Resource Center and campus security. The new student union building will be located near the new library building.
Administration Building (B200)
This building will house the President’s and Vice President’s suites, tiered lecture hall, large meeting room for use by all campus groups, reception/information area, mail room, and copy center.
New TV and Radio Broadcast Building (B3600)
The new TV and Radio Broadcasting Building will house the 24/7 TV and Radio Program and a 700-seat theater.
New Biology Building (B2100)
The new two-story Biology Building will house labs and prep rooms for use by biology, botany and anatomy, classrooms. A third story may be added to house faculty offices. The Environmental Studies Program is planned to be housed in this building. It is anticipated the building will be designed as a “green” building to be used as part of the educational curriculum with sustainable features that the students can learn from.
25 2012 Facilities Master Plan Update
Chabot-Las Positas Community College District
Figure 2.12 Chabot College 2012 Facilities Master Plan
Chabot College
Figure 3Proposed Chabot College 2012 Facilities Master Plan
Source: Chabot-Las Positas Community College District 2012 Facilities Master Plan
Draft – September 2017
Chabot College 2012 Facilities Master Plan Initial Study – 7
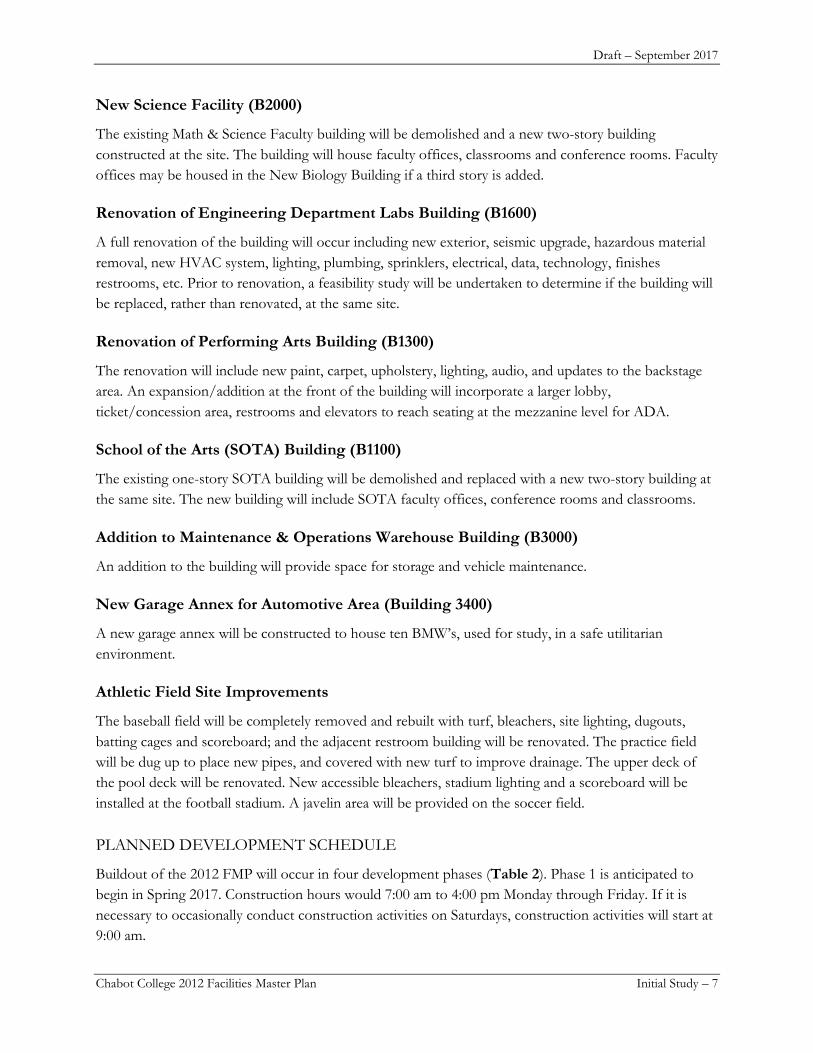
New Science Facility (B2000)
The existing Math & Science Faculty building will be demolished and a new two-story building constructed at the site. The building will house faculty offices, classrooms and conference rooms. Faculty offices may be housed in the New Biology Building if a third story is added.
Renovation of Engineering Department Labs Building (B1600)
A full renovation of the building will occur including new exterior, seismic upgrade, hazardous material removal, new HVAC system, lighting, plumbing, sprinklers, electrical, data, technology, finishes restrooms, etc. Prior to renovation, a feasibility study will be undertaken to determine if the building will be replaced, rather than renovated, at the same site.
Renovation of Performing Arts Building (B1300)
The renovation will include new paint, carpet, upholstery, lighting, audio, and updates to the backstage area. An expansion/addition at the front of the building will incorporate a larger lobby, ticket/concession area, restrooms and elevators to reach seating at the mezzanine level for ADA.
School of the Arts (SOTA) Building (B1100)
The existing one-story SOTA building will be demolished and replaced with a new two-story building at the same site. The new building will include SOTA faculty offices, conference rooms and classrooms.
Addition to Maintenance & Operations Warehouse Building (B3000)
An addition to the building will provide space for storage and vehicle maintenance.
New Garage Annex for Automotive Area (Building 3400)
A new garage annex will be constructed to house ten BMW’s, used for study, in a safe utilitarian environment.
Athletic Field Site Improvements
The baseball field will be completely removed and rebuilt with turf, bleachers, site lighting, dugouts, batting cages and scoreboard; and the adjacent restroom building will be renovated. The practice field will be dug up to place new pipes, and covered with new turf to improve drainage. The upper deck of the pool deck will be renovated. New accessible bleachers, stadium lighting and a scoreboard will be installed at the football stadium. A javelin area will be provided on the soccer field.
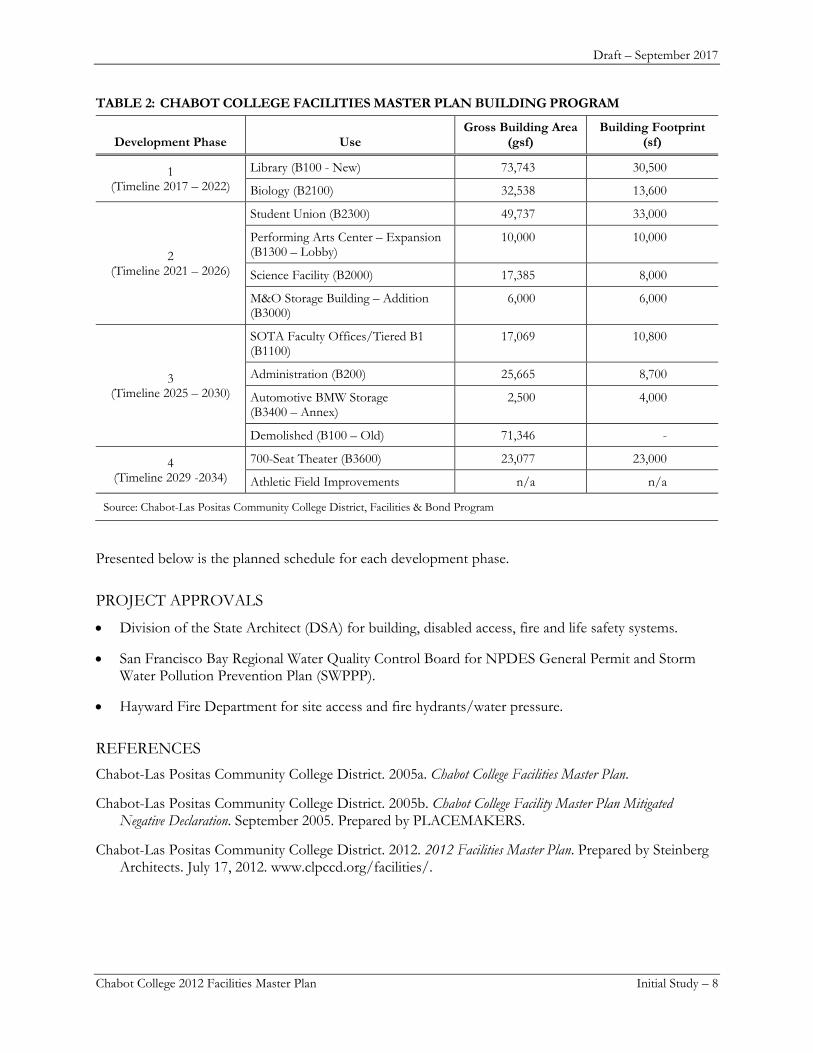
PLANNED DEVELOPMENT SCHEDULE
Buildout of the 2012 FMP will occur in four development phases (Table 2). Phase 1 is anticipated to begin in Spring 2017. Construction hours would 7:00 am to 4:00 pm Monday through Friday. If it is necessary to occasionally conduct construction activities on Saturdays, construction activities will start at 9:00 am.
Draft – September 2017
Chabot College 2012 Facilities Master Plan Initial Study – 8
TABLE 2: CHABOT COLLEGE FACILITIES MASTER PLAN BUILDING PROGRAM
Development Phase Use Gross Building Area
(gsf) Building Footprint
(sf)
1 (Timeline 2017 – 2022)
Library (B100 - New) 73,743 30,500
Biology (B2100) 32,538 13,600
2 (Timeline 2021 – 2026)
Student Union (B2300) 49,737 33,000
Performing Arts Center – Expansion (B1300 – Lobby)
10,000 10,000
Science Facility (B2000) 17,385 8,000
M&O Storage Building – Addition (B3000)
6,000 6,000
3 (Timeline 2025 – 2030)
SOTA Faculty Offices/Tiered B1 (B1100)
17,069 10,800
Administration (B200) 25,665 8,700
Automotive BMW Storage (B3400 – Annex)
2,500 4,000
Demolished (B100 – Old) 71,346 -
4 (Timeline 2029 -2034)
700-Seat Theater (B3600) 23,077 23,000
Athletic Field Improvements n/a n/a
Source: Chabot-Las Positas Community College District, Facilities & Bond Program
Presented below is the planned schedule for each development phase.
PROJECT APPROVALS
• Division of the State Architect (DSA) for building, disabled access, fire and life safety systems.
• San Francisco Bay Regional Water Quality Control Board for NPDES General Permit and Storm Water Pollution Prevention Plan (SWPPP).
• Hayward Fire Department for site access and fire hydrants/water pressure.
REFERENCES Chabot-Las Positas Community College District. 2005a. Chabot College Facilities Master Plan.
Chabot-Las Positas Community College District. 2005b. Chabot College Facility Master Plan Mitigated Negative Declaration. September 2005. Prepared by PLACEMAKERS.
Chabot-Las Positas Community College District. 2012. 2012 Facilities Master Plan. Prepared by Steinberg Architects. July 17, 2012. www.clpccd.org/facilities/.
Draft – September 2017
Chabot College 2012 Facilities Master Plan Initial Study – 10
EVALUATION OF ENVIRONMENTAL IMPACTS A brief explanation is required for all answers except “No Impact” answers if these answers are adequately supported by the information sources listed in the References section for each environmental issue.
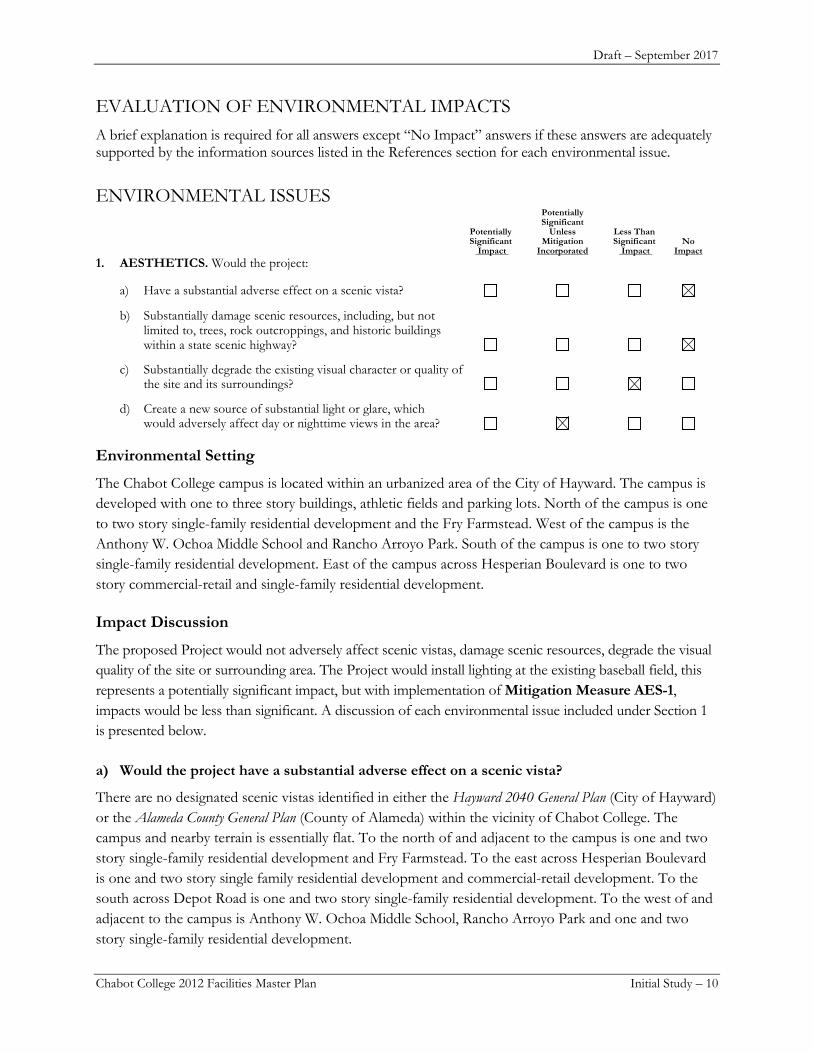
ENVIRONMENTAL ISSUES Potentially Significant Potentially Unless Less Than Significant Mitigation Significant No Impact Incorporated Impact Impact 1. AESTHETICS. Would the project:
a) Have a substantial adverse effect on a scenic vista?
b) Substantially damage scenic resources, including, but not limited to, trees, rock outcroppings, and historic buildings within a state scenic highway?
c) Substantially degrade the existing visual character or quality of the site and its surroundings?
d) Create a new source of substantial light or glare, which would adversely affect day or nighttime views in the area?
Environmental Setting
The Chabot College campus is located within an urbanized area of the City of Hayward. The campus is developed with one to three story buildings, athletic fields and parking lots. North of the campus is one to two story single-family residential development and the Fry Farmstead. West of the campus is the Anthony W. Ochoa Middle School and Rancho Arroyo Park. South of the campus is one to two story single-family residential development. East of the campus across Hesperian Boulevard is one to two story commercial-retail and single-family residential development.
Impact Discussion
The proposed Project would not adversely affect scenic vistas, damage scenic resources, degrade the visual quality of the site or surrounding area. The Project would install lighting at the existing baseball field, this represents a potentially significant impact, but with implementation of Mitigation Measure AES-1, impacts would be less than significant. A discussion of each environmental issue included under Section 1 is presented below.
a) Would the project have a substantial adverse effect on a scenic vista?
There are no designated scenic vistas identified in either the Hayward 2040 General Plan (City of Hayward) or the Alameda County General Plan (County of Alameda) within the vicinity of Chabot College. The campus and nearby terrain is essentially flat. To the north of and adjacent to the campus is one and two story single-family residential development and Fry Farmstead. To the east across Hesperian Boulevard is one and two story single family residential development and commercial-retail development. To the south across Depot Road is one and two story single-family residential development. To the west of and adjacent to the campus is Anthony W. Ochoa Middle School, Rancho Arroyo Park and one and two story single-family residential development.
Draft – September 2017
Chabot College 2012 Facilities Master Plan Initial Study – 11
The new buildings identified in the 2012 FMP would be similar in scale and height to existing campus buildings (see Subsection 1c below) maintaining the overall campus profile. Consequently, views of the campus from adjacent and nearby properties would be similar as with existing conditions. Buildout of the 2012 FMP would not adversely affect any scenic views from properties adjacent to the campus or within the immediate vicinity of the campus. Buildout of the 2012 FMP would result in less than significant impacts to scenic resources.
b) Would the project substantially damage scenic resources, including but not limited to, trees, rock outcroppings, and historic buildings within a scenic highway?
The Chabot College campus is not within a designated scenic highway (County of Alameda). There are no rock outcroppings or historic buildings on the campus. The proposed Project would not impact scenic resources.
c) Would the project substantially degrade the existing visual character or quality of the site and its surroundings?
The proposed Project represents the planned buildout of the Chabot College campus as identified in the 2012 FMP. Although the proposed new buildings have not yet been designed, the new buildings would be similar in scale and height, ranging from one to three stories, to existing buildings on the campus. The Project will follow the Chabot College Design Guidelines (Chabot Las Positas Community College District 2007). The Design Guidelines address:
• Site organization to include views, gateways and circulation.
• Landscape and site elements to include planting, irrigation, paving, site furniture, plaza areas, streetscapes, parking lot design, lighting, and signage.
• General and specific guidelines to ensure campus-wide sustainable practices.
The proposed Project would not substantially degrade the existing visual quality or character of the campus or surrounding area. New campus buildings and landscaping would be designed to complement the existing campus and visual impacts would be less than significant.
d) Would the project create a new source of substantial light or glare, which would adversely affect day or nighttime views in the area?
The 2012 FMP proposes a new wayfinding program that will include landscape lighting to direct pedestrians and vehicles. As specified in the Chabot College Design Guidelines, lighting should be adequate to provide safety and security. Light fixtures are to be LEED-compliant, full cut-off to limit the amount of light emitted into the sky and focus light on the ground. The introduction of new security and wayfinding lighting is not considered a significant impact as it would be shielded to prevent light spillover onto adjacent properties and minimize glare.
The proposed lighting of the existing ball field would introduce a new source of light and represents a potentially significant impact if the pole lights result in light spillover onto the adjacent residential
Draft – September 2017
Chabot College 2012 Facilities Master Plan Initial Study – 12
properties to the northern, western and southern perimeter of the baseball field. Additionally, there is the potential for glare. However, with implementation of Mitigation Measure AES-1, potentially significant light and glare impacts associated with the installation of lighting at the existing baseball field would be less than significant. New lighting would be installed at the football stadium to replace existing stadium lighting. This represents a potentially significant light and glare impact, but with implementation of Mitigation Measure AES-1, potentially significant light and glare impacts associated with new football stadium lighting would be less than significant.
Mitigation Measures
AES-1 A lighting plan, which includes a photometric study, shall be prepared for the proposed lighting of the existing baseball field. The lighting plan shall include the location of all light poles. Light poles shall be equipped with hooded lamps to cast light downwards to illuminate the baseball field and adjacent areas only. There will be no light spillover onto adjacent residences located to the west and north of the baseball field.
References County of Alameda. Alameda County General Plan, Scenic Route Element. Available on the Alameda County
website at: https://www.acgov.org/cda/planning/generalplans/documents/Scenic_Route_Element_General_Plan_1966.pdf)
Chabot Las Positas Community College District. 2007. Chabot College Design Guidelines. Prepared by Royston Hanamoto Alley & Abey and Carducci & Associates, Inc. August 3, 2007.
Potentially Significant Potentially Unless Less Than Significant Mitigation Significant No Impact Incorporated Impact Impact 2. AGRICULTURE AND FORESTRY RESOURCES.
In determining whether impacts to agricultural resources are significant environmental effects, lead agencies may refer to the California Agricultural Land Evaluation and Site Assessment Model (1997) prepared by the California Dept. of Conservation as an optional model to use in assessing impacts on agriculture and farmland. In determining whether impacts to forest resources, including timberland are significant environmental effects, lead agencies may refer to information compiled by the California Department of Forestry and Fire Protection regarding the state’s inventory of forest land, including the Forest and Range Assessment Project and the Forest Legacy Assessment project; and forest carbon measurement methodology provided in Forest protocols adopted by the California Air Resources Board. Would the project:
a) Convert Prime Farmland, Unique Farmland, or Farmland of Statewide Importance (Farmland), as shown on the maps prepared pursuant to the Farmland Mapping and Monitoring Program of the California Resources Agency, to non-agricultural use?
b) Conflict with existing zoning for agricultural use, or a Williamson Act contract?
Draft – September 2017
Chabot College 2012 Facilities Master Plan Initial Study – 13
Potentially Significant Potentially Unless Less Than Significant Mitigation Significant No Impact Incorporated Impact Impact 2. AGRICULTURE AND FORESTRY RESOURCES (cont.)
c) Conflict with existing zoning for, or cause rezoning of, forest land (as defined in Public Resources Code section 12220(g)), timberland (as defined by Public Resources Code section 4526), or timberland zoned Timberland Production (as defined by Government Code section 51104(g))?
d) Result in the loss of forest land or conversion of forest land to non-forest use?
e) Involve other changes in the existing environment which, due to their location or nature, could result in conversion of farmland, to non-agricultural use or conversion of forest land to non-forest use?
Environmental Setting
The project site is the Chabot College campus. The campus is surrounded by residential and commercial development. The campus is developed with buildings, athletic fields and parking lots. The Chabot College campus does not contain any agricultural or forest land.
Impact Discussion
There would be no impacts to agricultural and forestry resources due to the proposed Project. A discussion of each environmental issue included under Section 2 is presented below.
a) Would the project convert Prime Farmland, Unique Farmland, or Farmland of Statewide Importance (Farmland), as shown on the maps and prepared pursuant to the Farmland Mapping and Monitoring Program of the California Resources Agency, to non-agricultural use?
The Project site is developed with the Chabot College campus. Buildout of the 2012 FMP would not affect any agricultural land.
b) Would the project conflict with existing zoning for agricultural use, or a Williamson Act contract?
The Chabot College campus is zoned RS – Single Family Residential (City of Hayward). The campus is not under a Williamson Act contract.
c) Would the project conflict with existing zoning for, or cause rezoning of, forest land (as defined in Public Resources Code section 12220(g)), timberland (as defined by Public Resources Code section 4526), or timberland zoned Timberland Production (as defined by Government Code section 51104(g))?
The site is zoned RS – Single Family Residential. Lands surrounding the Chabot College campus are urbanized development including residential, commercial and public facilities. The proposed Project would not adversely affect any lands zoned forest land or timberland.
Draft – September 2017
Chabot College 2012 Facilities Master Plan Initial Study – 14
d) Would the project result in the loss of forest land or conversion of forest land to non-forest use?
The Project contains no forest land.
e) Would the project involve other changes in the existing environment which, due to their location or nature, could result in conversion of farmland, to non-agricultural use or conversion of forest land to non-forest use?
The Project would not result in the conversion of any farmland or forest land for other uses. See Subsections 2a - 2d above.
Mitigation Measures
None required.
References City of Hayward. Zoning Map. Available on the City of Hayward website at: https://www.hayward_
ca.gov/discover/maps. Potentially Significant Potentially Unless Less Than Significant Mitigation Significant No Impact Incorporated Impact Impact 3. AIR QUALITY. Where available, the significance criteria
established by the applicable air quality management or air pollution control district may be relied upon to make the following determinations. Would the project:
a) Conflict with or obstruct implementation of the applicable air quality plan?
b) Violate any air quality standard or contribute substantially to an existing or projected air quality violation?
c) Result in a cumulatively considerable net increase of any criteria pollutant for which the project region is non-attainment under an applicable federal or state ambient air quality standard (including releasing emissions, which exceed quantitative thresholds for ozone precursors)?
d) Expose sensitive receptors to substantial pollutant concentrations?
e) Create objectionable odors affecting a substantial number of people?
Environmental Setting
According to the Bay Area Air Quality Management District (BAAQMD), the City of Hayward is in the Southwestern Alameda County climatological sub-region of the Bay Area. The air pollution potential of this sub-region is relatively high in the summer and fall when regional winds can transport pollutants from other areas and where the confining terrain of the East Bay hills can concentrate them locally.
Draft – September 2017
Chabot College 2012 Facilities Master Plan Initial Study – 15
Hayward contains a variety of stationary industrial/commercial air pollution sources, most being concentrated in the industrially/commercially zoned western (i.e., west of Industrial Boulevard) and southern (i.e., south of Industrial Parkway West) areas of the city. But there are two notable stationary sources of air pollutants in the campus vicinity that operate under BAAQMD permits: a motor vehicle fueling station (i.e., A&M at 26115 Hesperian Boulevard) and an emergency diesel-powered generator (i.e., Pacific Bell at 1880 Depot Court). Traffic on I-880 and State Route 92 are also major sources of air pollution, but they pass more than 1000 feet east and south of the campus, respectively.
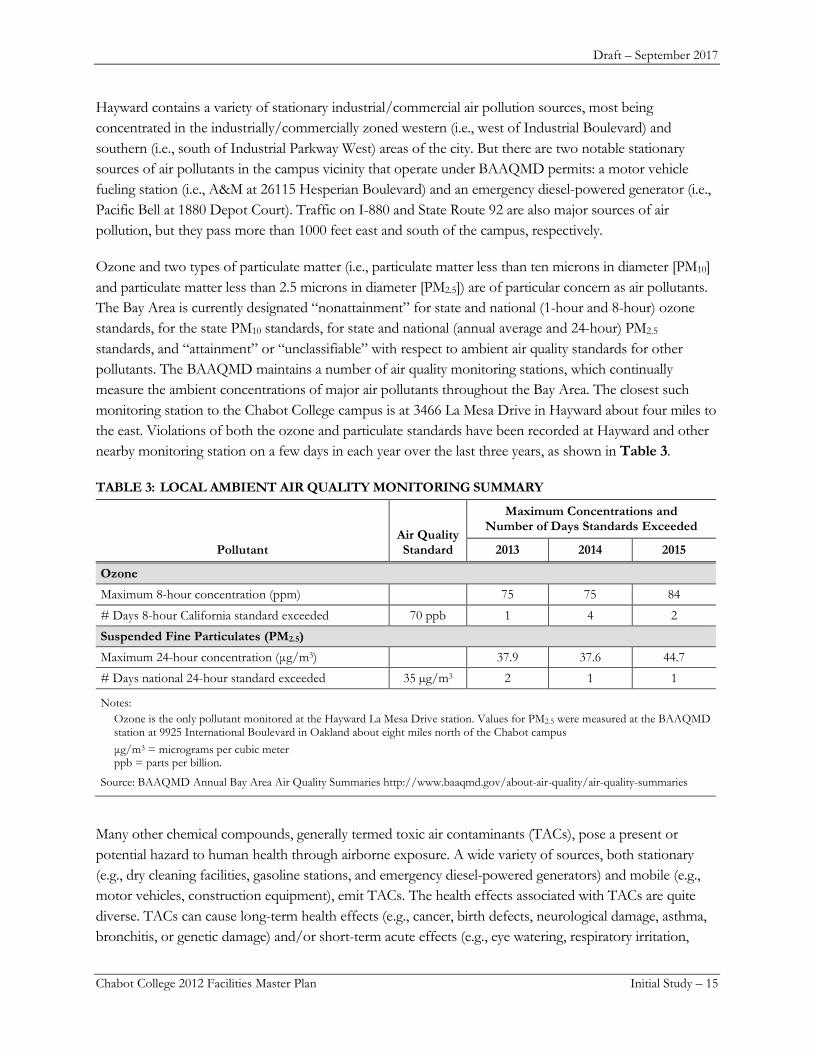
Ozone and two types of particulate matter (i.e., particulate matter less than ten microns in diameter [PM10] and particulate matter less than 2.5 microns in diameter [PM2.5]) are of particular concern as air pollutants. The Bay Area is currently designated “nonattainment” for state and national (1-hour and 8-hour) ozone standards, for the state PM10 standards, for state and national (annual average and 24-hour) PM2.5 standards, and “attainment” or “unclassifiable” with respect to ambient air quality standards for other pollutants. The BAAQMD maintains a number of air quality monitoring stations, which continually measure the ambient concentrations of major air pollutants throughout the Bay Area. The closest such monitoring station to the Chabot College campus is at 3466 La Mesa Drive in Hayward about four miles to the east. Violations of both the ozone and particulate standards have been recorded at Hayward and other nearby monitoring station on a few days in each year over the last three years, as shown in Table 3.
TABLE 3: LOCAL AMBIENT AIR QUALITY MONITORING SUMMARY
Pollutant Air Quality Standard
Maximum Concentrations and Number of Days Standards Exceeded
2013 2014 2015
Ozone Maximum 8-hour concentration (ppm) 75 75 84
# Days 8-hour California standard exceeded 70 ppb 1 4 2
Suspended Fine Particulates (PM2.5) Maximum 24-hour concentration (μg/m3) 37.9 37.6 44.7
# Days national 24-hour standard exceeded 35 µg/m3 2 1 1
Notes: Ozone is the only pollutant monitored at the Hayward La Mesa Drive station. Values for PM2.5 were measured at the BAAQMD station at 9925 International Boulevard in Oakland about eight miles north of the Chabot campus μg/m3 = micrograms per cubic meter ppb = parts per billion.
Source: BAAQMD Annual Bay Area Air Quality Summaries http://www.baaqmd.gov/about-air-quality/air-quality-summaries
Many other chemical compounds, generally termed toxic air contaminants (TACs), pose a present or potential hazard to human health through airborne exposure. A wide variety of sources, both stationary (e.g., dry cleaning facilities, gasoline stations, and emergency diesel-powered generators) and mobile (e.g., motor vehicles, construction equipment), emit TACs. The health effects associated with TACs are quite diverse. TACs can cause long-term health effects (e.g., cancer, birth defects, neurological damage, asthma, bronchitis, or genetic damage) and/or short-term acute effects (e.g., eye watering, respiratory irritation,
Draft – September 2017
Chabot College 2012 Facilities Master Plan Initial Study – 16
running nose, throat pain, and headaches). In the Bay Area, most of the estimated carcinogenic/chronic health risk can be attributed to relatively few airborne compounds, the most important being particulate matter from diesel-fueled engines (DPM). The California Air Resources Board (CARB) has identified DPM as being responsible for about 80 percent of the cumulative cancer risk from all airborne TAC exposures in California. (CARB, 1998)
Regulatory Setting
This air quality analysis was performed using the methodologies recommended in CEQA Air Quality Guidelines.1 (BAAQMD, 2010a). The criteria air pollutants evaluated in this Initial Study are: carbon monoxide (CO), reactive organic compounds (ROG) and nitrogen dioxide (NO2) (both being precursors to ozone formation), inhalable particulates (PM10), and fine particulates (PM2.5). Health risks associated with Project-specific and cumulative exposures to DPM are also evaluated.
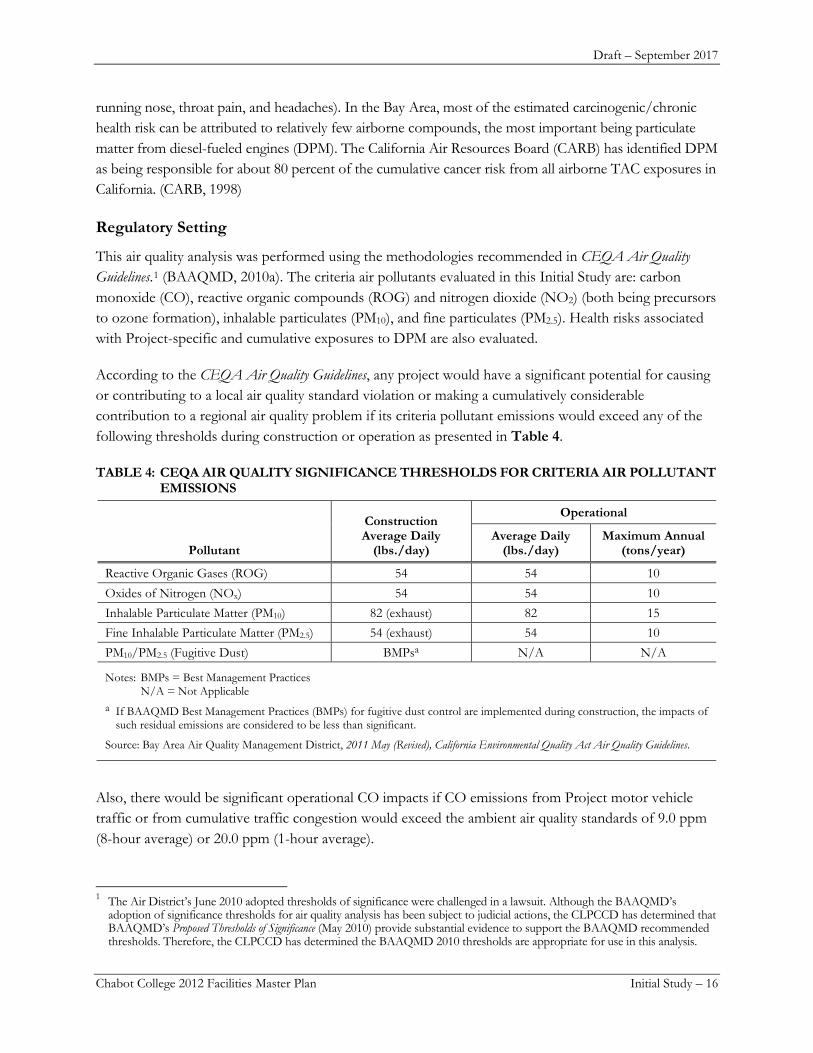
According to the CEQA Air Quality Guidelines, any project would have a significant potential for causing or contributing to a local air quality standard violation or making a cumulatively considerable contribution to a regional air quality problem if its criteria pollutant emissions would exceed any of the following thresholds during construction or operation as presented in Table 4.
TABLE 4: CEQA AIR QUALITY SIGNIFICANCE THRESHOLDS FOR CRITERIA AIR POLLUTANT EMISSIONS
Pollutant
Construction Average Daily
(lbs./day)
Operational
Average Daily (lbs./day)
Maximum Annual (tons/year)
Reactive Organic Gases (ROG) 54 54 10 Oxides of Nitrogen (NOx) 54 54 10 Inhalable Particulate Matter (PM10) 82 (exhaust) 82 15 Fine Inhalable Particulate Matter (PM2.5) 54 (exhaust) 54 10 PM10/PM2.5 (Fugitive Dust) BMPsa N/A N/A
Notes: BMPs = Best Management Practices N/A = Not Applicable a If BAAQMD Best Management Practices (BMPs) for fugitive dust control are implemented during construction, the impacts of
such residual emissions are considered to be less than significant.
Source: Bay Area Air Quality Management District, 2011 May (Revised), California Environmental Quality Act Air Quality Guidelines.
Also, there would be significant operational CO impacts if CO emissions from Project motor vehicle traffic or from cumulative traffic congestion would exceed the ambient air quality standards of 9.0 ppm (8-hour average) or 20.0 ppm (1-hour average).
1 The Air District’s June 2010 adopted thresholds of significance were challenged in a lawsuit. Although the BAAQMD’s
adoption of significance thresholds for air quality analysis has been subject to judicial actions, the CLPCCD has determined that BAAQMD’s Proposed Thresholds of Significance (May 2010) provide substantial evidence to support the BAAQMD recommended thresholds. Therefore, the CLPCCD has determined the BAAQMD 2010 thresholds are appropriate for use in this analysis.
Draft – September 2017
Chabot College 2012 Facilities Master Plan Initial Study – 17
Finally, the CEQA Air Quality Guidelines establish a relevant zone of influence for an assessment of project-level and cumulative health risk from TAC exposure to an area within 1,000 feet of a project site. Project construction-related or project operational TAC impacts to sensitive receptors within the zone that exceed any of the following thresholds are considered significant:
• An excess cancer risk level of more than 10 in one million • A non-cancer hazard index greater than 1.0. • An incremental increase of greater than 0.3 micrograms per cubic meter (μg/m3) for annual average
PM2.5 concentrations.
Cumulative impacts from TACs emitted from freeways, state highways or high volume roadways (i.e., the latter defined as having traffic volumes of 10,000 vehicles or more per day or 1,000 trucks per day), and from all BAAQMD-permitted stationary sources sources within the zone to sensitive receptors within the zone that exceed any of the following thresholds are considered cumulatively significant:
• A combined excess cancer risk levels of more than 100 in one million. • A combined non-cancer hazard index greater than 10.0. • A combined incremental increase in annual average PM2.5 concentrations greater than 0.8 μg/m3.
Impact Discussion
During construction activities for each 2012 FMP development phase, there could be significant air quality impacts, but with implementation of Mitigation Measure AIR-1 potential air quality impacts would be less than significant. No significant operational or cumulative air quality impacts are expected during buildout of the 2012 FMP. A discussion of each environmental issue included under Section 3 is presented below.
a) Would the project conflict with or obstruct implementation of the applicable air quality plan?
The BAAQMD adopted its 2010 Bay Area Clean Air Plan (CAP) in accordance with the requirements of the California Clean Air Act (CCAA) to implement all feasible measures to reduce ozone; provide a control strategy to reduce ozone, particulate matter and air toxics (TACs) in a single, integrated plan; and establish emission control measures to be adopted or implemented. The primary goals of the 2010 Bay Area CAP are to:
• Attain/maintain air quality standards; • Reduce population exposure to air pollutants and protect public health in the Bay Area.
Compliance with BAAQMD-approved CEQA thresholds of significance are necessary conditions for determining that a project would be consistent with all adopted control measures and would not interfere with the attainment of CAP goals. Also, as a community college, development under the 2012 FMP does not have the potential to substantially affect housing, employment, transportation and/or population projections within the Bay Area Air Basin. Rather, implementation of the 2012 FMP is an attempt to better serve the larger future Bay Area population anticipated in regional development, transportation and air quality improvement plans. As the analysis below demonstrates, the Project would
Draft – September 2017
Chabot College 2012 Facilities Master Plan Initial Study – 18
not have significant and unavoidable air quality impacts because it meets all BAAQMD CEQA thresholds with implementation of Mitigation Measure AIR-1.
b) Would the project violate any air quality standard or contribute substantially to an existing or projected air quality violation?
Project Construction-Related Impacts
Construction of new facilities and improvements as outlined in the 2012 FMP is planned to take place over the next 17 years. Each such facility would generate temporary emissions of criteria pollutants in construction equipment exhaust and fugitive dust from equipment and material movement. The CEQA Air Quality Guidelines recommend quantification of construction-related exhaust emissions and comparison of those emissions to the CEQA significance thresholds. Thus, the CalEEMod (California Emissions Estimator Model, Version 2016.3.1) was used to quantify construction-related emissions of criteria pollutants.
Table 5 provides the estimated pollutant emissions from construction equipment, material delivery trucks and worker commute vehicles associated with each facility proposed under the 2012 FMP. The maximum daily construction period emissions were compared to the CEQA significance thresholds, as shown. Except for ROG emissions associated with application of architectural coating during the final stages of some facilities’ construction, daily emissions of criteria air pollutants from construction activities would be below the CEQA significance thresholds.
TABLE 5: PROJECT CONSTRUCTION CRITERIA POLLUTANT EMISSIONS (maximum pounds per day)
Master Plan Development Phase/ New Campus Land Use ROG NOx
PM10 PM2.5
(Exhaust) (Exhaust)
Phase 1 (2017-2022)/ Library (B100) 77.2 24.4 6.8 3.8
Phase 1 (2017-2022)/ Biology (B2100) 68.1 13.5 1.6 1.1
Phase 2 (2021-2026)/ Student Union (B2300) 52.0 19.7 6.6 3.7
Phase 2 (2021-2026)/ Performing Arts Center (B1300) 21.1 6.6 1.1 0.7
Phase 2 (2021-2026)/ Science Facility (B2000) 36.5 5.7 1.0 0.6
Phase 3 (2025-2030)/ SOTA Faculty Offices (B1100) 35.8 5.7 1.0 0.6
Phase 3 (2025-2030)/ Administration (B200) 53.8 5.8 1.0 0.6
Phase 4 (2029-2034)/ Theater (B3600) 48.4 5.8 1.0 0.6
Significance Thresholds 54 54 82 54 Significant Impact? Yes No No No
Draft – September 2017
Chabot College 2012 Facilities Master Plan Initial Study – 19
The CalEEMod model default settings specify that all architectural coatings would be applied during a short period in the final stages of construction; in this case, for buildings of the size and type proposed for construction under the FMP, the model specifies that coatings for each of the buildings would be applied in the last one to two work weeks (i.e., over five to ten work days) of construction. The maximum daily ROG emissions from construction of the Library, Biology and Administration buildings would each exceed the 54 lbs./day BAAQMD threshold. These potentially significant impacts would be reduced to less-than-significant levels with implementation of Mitigation Measure AIR-1.
The CEQA Air Quality Guidelines require a number of construction Best Management Practices (BMPs) to control fugitive dust, and the use of paints and coatings compliant with BAAQMD volatile organic compounds (VOC) control regulations. Thus, the following measures must be implemented by the Project construction contractor:
BAAQMD Required Dust Control Measures: The construction contractor shall reduce construction-related air pollutant emissions by implementing BAAQMD’s basic fugitive dust control measures, including:
• All exposed surfaces (e.g., parking areas, staging areas, soil piles, graded areas, and unpaved access roads) shall be watered two times per day.
• All haul trucks transporting soil, sand, or other loose material off site shall be covered.
• All visible mud or dirt track-out onto adjacent public roads shall be removed using wet power vacuum street sweepers at least once per day. The use of dry power sweeping is prohibited.
• All vehicle speeds on unpaved surfaces shall be limited to 15 miles per hour.
• All roadways, driveways, and sidewalks to be paved shall be completed as soon as possible. Building pads shall be laid as soon as possible after grading unless seeding or soil binders are used.
• A publicly visible sign shall be posted with the telephone number and person to contact at the CLPCCD regarding dust complaints. This person shall respond and take corrective action with 48 hours. The Air District’s phone number shall also be visible to ensure compliance with applicable regulations.
BAAQMD Regulation 8, Rule 3 for Architectural Coatings: Emissions of volatile organic compounds (VOC) due to the use of architectural coatings are regulated by the limits contained in Regulation 8: Organic Compounds, Rule 3: Architectural Coatings (Rule 8-3). Rule 8-3 was revised to include more stringent VOC limit requirements. The revised VOC architectural coating limits, which went into effect on November 21, 2001.
• The construction contractor shall use paints and solvents with a VOC content of 100 grams per liter or less for interior and 150 grams per liter or less for exterior surfaces.
Draft – September 2017
Chabot College 2012 Facilities Master Plan Initial Study – 20
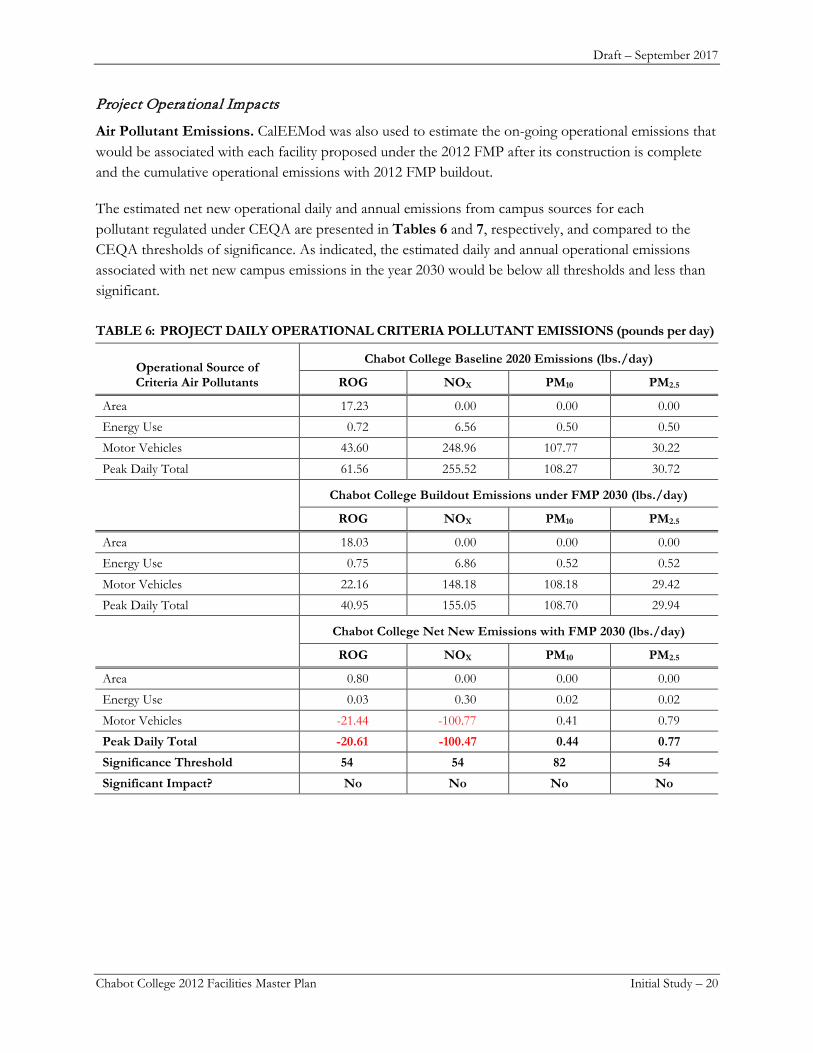
Project Operational Impacts
Air Pollutant Emissions. CalEEMod was also used to estimate the on-going operational emissions that would be associated with each facility proposed under the 2012 FMP after its construction is complete and the cumulative operational emissions with 2012 FMP buildout.
The estimated net new operational daily and annual emissions from campus sources for each pollutant regulated under CEQA are presented in Tables 6 and 7, respectively, and compared to the CEQA thresholds of significance. As indicated, the estimated daily and annual operational emissions associated with net new campus emissions in the year 2030 would be below all thresholds and less than significant.
TABLE 6: PROJECT DAILY OPERATIONAL CRITERIA POLLUTANT EMISSIONS (pounds per day)
Operational Source of Criteria Air Pollutants
Chabot College Baseline 2020 Emissions (lbs./day)
ROG NOX PM10 PM2.5
Area 17.23 0.00 0.00 0.00
Energy Use 0.72 6.56 0.50 0.50
Motor Vehicles 43.60 248.96 107.77 30.22
Peak Daily Total 61.56 255.52 108.27 30.72
Chabot College Buildout Emissions under FMP 2030 (lbs./day)
ROG NOX PM10 PM2.5
Area 18.03 0.00 0.00 0.00
Energy Use 0.75 6.86 0.52 0.52
Motor Vehicles 22.16 148.18 108.18 29.42
Peak Daily Total 40.95 155.05 108.70 29.94
Chabot College Net New Emissions with FMP 2030 (lbs./day)
ROG NOX PM10 PM2.5
Area 0.80 0.00 0.00 0.00
Energy Use 0.03 0.30 0.02 0.02
Motor Vehicles -21.44 -100.77 0.41 0.79
Peak Daily Total -20.61 -100.47 0.44 0.77 Significance Threshold 54 54 82 54 Significant Impact? No No No No
Draft – September 2017
Chabot College 2012 Facilities Master Plan Initial Study – 21
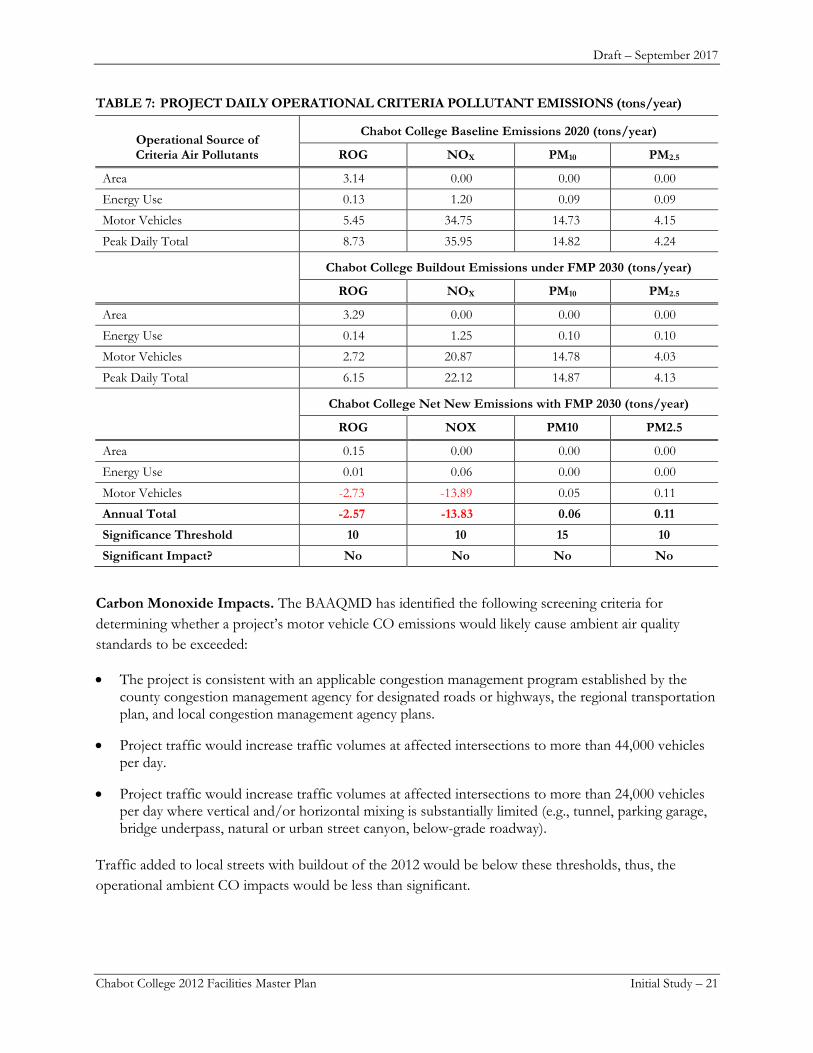
TABLE 7: PROJECT DAILY OPERATIONAL CRITERIA POLLUTANT EMISSIONS (tons/year)
Operational Source of Criteria Air Pollutants
Chabot College Baseline Emissions 2020 (tons/year)
ROG NOX PM10 PM2.5
Area 3.14 0.00 0.00 0.00
Energy Use 0.13 1.20 0.09 0.09
Motor Vehicles 5.45 34.75 14.73 4.15
Peak Daily Total 8.73 35.95 14.82 4.24
Chabot College Buildout Emissions under FMP 2030 (tons/year)
ROG NOX PM10 PM2.5
Area 3.29 0.00 0.00 0.00
Energy Use 0.14 1.25 0.10 0.10
Motor Vehicles 2.72 20.87 14.78 4.03
Peak Daily Total 6.15 22.12 14.87 4.13
Chabot College Net New Emissions with FMP 2030 (tons/year)
ROG NOX PM10 PM2.5
Area 0.15 0.00 0.00 0.00
Energy Use 0.01 0.06 0.00 0.00
Motor Vehicles -2.73 -13.89 0.05 0.11
Annual Total -2.57 -13.83 0.06 0.11 Significance Threshold 10 10 15 10 Significant Impact? No No No No
Carbon Monoxide Impacts. The BAAQMD has identified the following screening criteria for determining whether a project’s motor vehicle CO emissions would likely cause ambient air quality standards to be exceeded:
• The project is consistent with an applicable congestion management program established by the county congestion management agency for designated roads or highways, the regional transportation plan, and local congestion management agency plans.
• Project traffic would increase traffic volumes at affected intersections to more than 44,000 vehicles per day.
• Project traffic would increase traffic volumes at affected intersections to more than 24,000 vehicles per day where vertical and/or horizontal mixing is substantially limited (e.g., tunnel, parking garage, bridge underpass, natural or urban street canyon, below-grade roadway).
Traffic added to local streets with buildout of the 2012 would be below these thresholds, thus, the operational ambient CO impacts would be less than significant.
Draft – September 2017
Chabot College 2012 Facilities Master Plan Initial Study – 22
c) Would the project result in a cumulatively considerable net increase of any criteria pollutant for which the project region is nonattainment under an applicable federal or state ambient air quality standard (including releasing emissions, which exceed quantitative thresholds for ozone precursors)?
As discussed in Subsection 3b above, Project-related criteria pollutant emissions would be below the BAAQMD significance thresholds. And as discussed below in Subsection 3d, Project-related and cumulative TAC impacts would also be below BAAQMD health risk significance thresholds Therefore, the Project would not make cumulatively considerable contributions to the Bay Area’s regional problems with ozone, particulate matter or TACs. Thus, cumulative emission impacts would be less than significant.
d) Would the project expose sensitive receptors to substantial pollutant concentrations?
Ambient TAC concentrations produced by project and other significant local TAC sources within 1,000 feet of a project site are considered “substantial” if they exceed the project-level and cumulative CEQA health risk thresholds at senstive receptors within this zone. The Chabot College campus is mostly surrounded by residential land uses and the Anthony W. Ochoa Middle School is located at the southwest boundary of the campus, all of which are considered air-pollutant sensitive receptors.
Following health risk assessment (HRA) guidelines in Recommended Methods for Screening and Modeling Local Risks and Hazards (BAAQMD, 2012b), incremental cancer and other health risks were estimated by modeling concentrations of TACs emitted from local sources using the SCREEN3 dispersion model and then applying established toxicity factors for the TACs of concern to those concentrations.
Project Construction-Related TAC Impacts
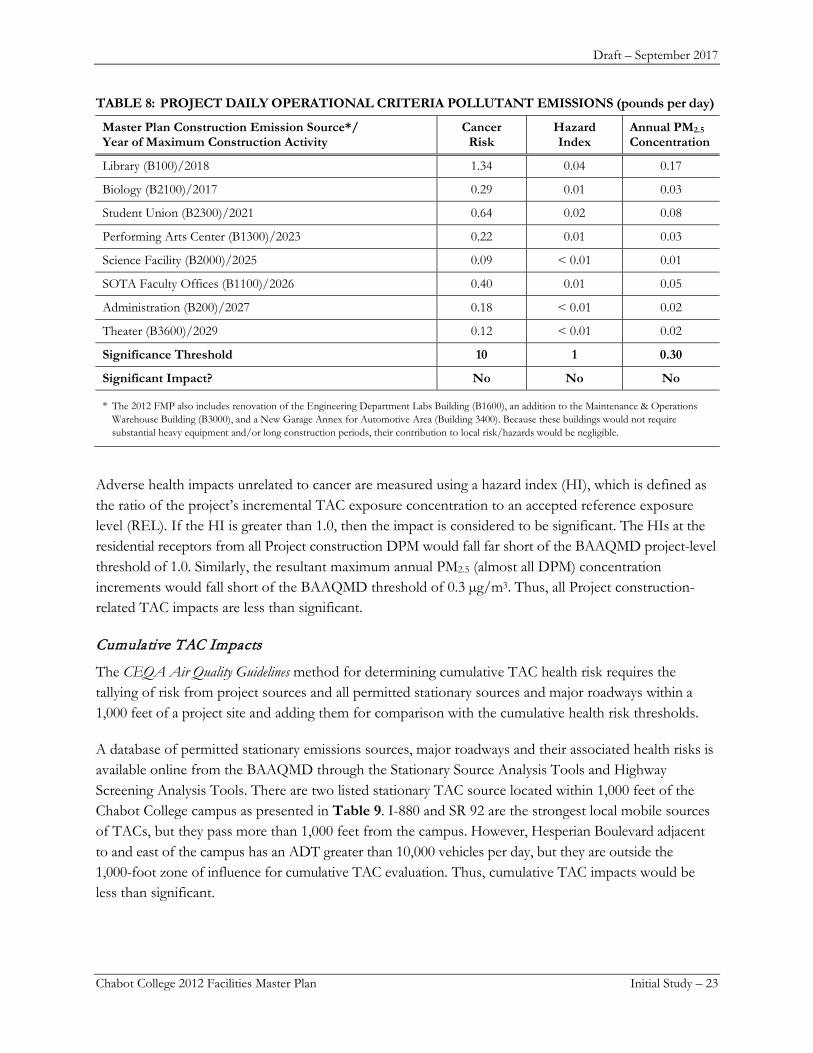
Eight buildings are proposed for construction on the Chabot College campus under the 2012 FMP. Using the building type and total floor area specifications presented in Table 2 (Project Description), the total DPM emitted by construction equipment was estimated by using CalEEMod. These emissions for each building were then assigned to its on-campus construction site of known building footprint area. The SCREEN3 model was used to estimate the resultant DPM concentrations at the closest residential receptors just east across Hesperian Boulevard. Their individual health risk impacts are shown in Table 8.
Cancer risk is the lifetime probability of developing cancer from exposure to carcinogenic substances. Incremental cancer risks from the construction of each Project building were estimated by applying established DPM toxicity factors to modeled TAC concentrations associated with that building. The maximum cancer risk from Project construction, 1.3 per million, would result from DPM emitted during the construction of the new Library because of its size (30,500 sq. ft.) and proximity (about 900 feet) to the closest residential receptors east of Hesperian Boulevard, and because it would be one of the first buildings to be constructed under the 2012 FMP (i.e., construction equipment will emit less DPM in the future under California mandates for cleaner diesel engines). But its cancer risk and that of all other Project construction would fall short of the BAAQMD project-level threshold of ten per million.
Draft – September 2017
Chabot College 2012 Facilities Master Plan Initial Study – 23
TABLE 8: PROJECT DAILY OPERATIONAL CRITERIA POLLUTANT EMISSIONS (pounds per day)
Master Plan Construction Emission Source*/ Year of Maximum Construction Activity
Cancer Risk
Hazard Index
Annual PM2.5 Concentration
Library (B100)/2018 1.34 0.04 0.17
Biology (B2100)/2017 0.29 0.01 0.03
Student Union (B2300)/2021 0.64 0.02 0.08
Performing Arts Center (B1300)/2023 0.22 0.01 0.03
Science Facility (B2000)/2025 0.09 < 0.01 0.01
SOTA Faculty Offices (B1100)/2026 0.40 0.01 0.05
Administration (B200)/2027 0.18 < 0.01 0.02
Theater (B3600)/2029 0.12 < 0.01 0.02
Significance Threshold 10 1 0.30
Significant Impact? No No No
* The 2012 FMP also includes renovation of the Engineering Department Labs Building (B1600), an addition to the Maintenance & Operations Warehouse Building (B3000), and a New Garage Annex for Automotive Area (Building 3400). Because these buildings would not require substantial heavy equipment and/or long construction periods, their contribution to local risk/hazards would be negligible.
Adverse health impacts unrelated to cancer are measured using a hazard index (HI), which is defined as the ratio of the project’s incremental TAC exposure concentration to an accepted reference exposure level (REL). If the HI is greater than 1.0, then the impact is considered to be significant. The HIs at the residential receptors from all Project construction DPM would fall far short of the BAAQMD project-level threshold of 1.0. Similarly, the resultant maximum annual PM2.5 (almost all DPM) concentration increments would fall short of the BAAQMD threshold of 0.3 µg/m3. Thus, all Project construction-related TAC impacts are less than significant.
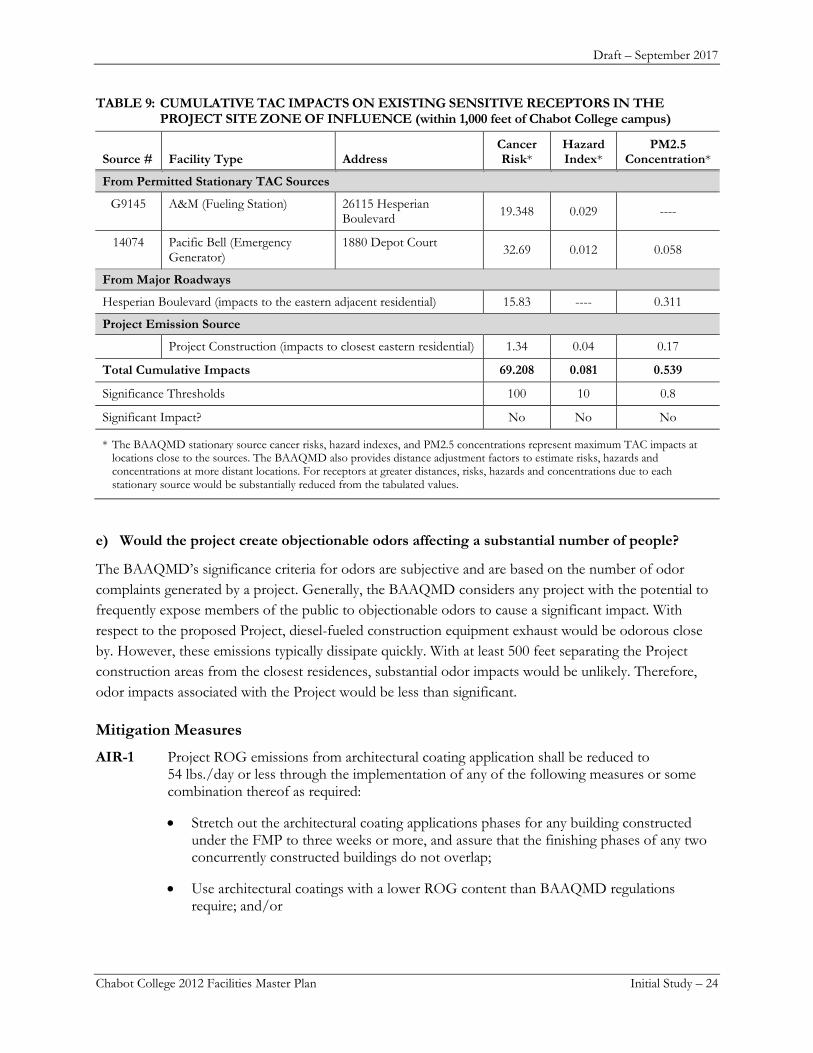
Cumulative TAC Impacts
The CEQA Air Quality Guidelines method for determining cumulative TAC health risk requires the tallying of risk from project sources and all permitted stationary sources and major roadways within a 1,000 feet of a project site and adding them for comparison with the cumulative health risk thresholds.
A database of permitted stationary emissions sources, major roadways and their associated health risks is available online from the BAAQMD through the Stationary Source Analysis Tools and Highway Screening Analysis Tools. There are two listed stationary TAC source located within 1,000 feet of the Chabot College campus as presented in Table 9. I-880 and SR 92 are the strongest local mobile sources of TACs, but they pass more than 1,000 feet from the campus. However, Hesperian Boulevard adjacent to and east of the campus has an ADT greater than 10,000 vehicles per day, but they are outside the 1,000-foot zone of influence for cumulative TAC evaluation. Thus, cumulative TAC impacts would be less than significant.
Draft – September 2017
Chabot College 2012 Facilities Master Plan Initial Study – 24
TABLE 9: CUMULATIVE TAC IMPACTS ON EXISTING SENSITIVE RECEPTORS IN THE PROJECT SITE ZONE OF INFLUENCE (within 1,000 feet of Chabot College campus)
Source # Facility Type Address Cancer Risk*
Hazard Index*
PM2.5 Concentration*
From Permitted Stationary TAC Sources
G9145 A&M (Fueling Station) 26115 Hesperian Boulevard 19.348 0.029 ----
14074 Pacific Bell (Emergency Generator)
1880 Depot Court 32.69 0.012 0.058
From Major Roadways
Hesperian Boulevard (impacts to the eastern adjacent residential) 15.83 ---- 0.311
Project Emission Source
Project Construction (impacts to closest eastern residential) 1.34 0.04 0.17
Total Cumulative Impacts 69.208 0.081 0.539
Significance Thresholds 100 10 0.8
Significant Impact? No No No
* The BAAQMD stationary source cancer risks, hazard indexes, and PM2.5 concentrations represent maximum TAC impacts at locations close to the sources. The BAAQMD also provides distance adjustment factors to estimate risks, hazards and concentrations at more distant locations. For receptors at greater distances, risks, hazards and concentrations due to each stationary source would be substantially reduced from the tabulated values.
e) Would the project create objectionable odors affecting a substantial number of people?
The BAAQMD’s significance criteria for odors are subjective and are based on the number of odor complaints generated by a project. Generally, the BAAQMD considers any project with the potential to frequently expose members of the public to objectionable odors to cause a significant impact. With respect to the proposed Project, diesel-fueled construction equipment exhaust would be odorous close by. However, these emissions typically dissipate quickly. With at least 500 feet separating the Project construction areas from the closest residences, substantial odor impacts would be unlikely. Therefore, odor impacts associated with the Project would be less than significant.
Mitigation Measures
AIR-1 Project ROG emissions from architectural coating application shall be reduced to 54 lbs./day or less through the implementation of any of the following measures or some combination thereof as required:
• Stretch out the architectural coating applications phases for any building constructed under the FMP to three weeks or more, and assure that the finishing phases of any two concurrently constructed buildings do not overlap;
• Use architectural coatings with a lower ROG content than BAAQMD regulations require; and/or
Draft – September 2017
Chabot College 2012 Facilities Master Plan Initial Study – 25
• Use building components that have had their surfaces factory-finished and so reduce the need for on-site painting or finishing with ROG-containing paints.
Prior to the beginning of any construction, final plans shall be submitted for Chabot Las Positas Community College District approvals that demonstrate attainment of the BAAQMD 54 lbs. /day limit on ROG emissions during construction.
References BAAQMD (Bay Area Air Quality Management District). 2010a California Environmental Quality Act
Guidelines Update, Proposed Thresholds of Significance. http://www.baaqmd.gov/~/media/files/planning-and-research/ceqa/proposed_thresholds_report_-may_3_2010_final.pdf?la=en
BAAQMD. 2012a. California Environmental Quality Act (CEQA) Air Quality Guidelines. http://www.baaqmd.gov/~/media/Files/Planning%20and%20Research/CEQA/BAAQMD%20CEQA%20Guidelines_Final_May%202012.ashx?la=en
BAAQMD. 2012b. Recommended Methods for Screening and Modeling Local Risks and Hazards. http://www.baaqmd.gov/~/media/Files/Planning%20and%20Research/CEQA/Risk%20Modeling%20Approach%20May%202012.ashx?la=en
BAAQMD. Ambient Air Quality Standards and Attainment Status. http://www.baaqmd.gov/research-and-data/air-quality-standards-and-attainment-status
BAAQMD. Air Quality Summary Reports. http://www.baaqmd.gov/about-air-quality/air-quality-summaries
BAAQMD. Stationary Source Screening Analysis Tool. http://www.baaqmd.gov/plans-and-climate/california-environmental-quality-act-ceqa/updated-ceqa-guidelines
BAAQMD. Highway Screening Analysis Tool. http://www.baaqmd.gov/plans-and-climate/california-environmental-quality-act-ceqa/updated-ceqa-guidelines
BAAQMD. Clean Air Plan. http://www.baaqmd.gov/plans-and-climate/air-quality-plans/current-plans
BAAQMD. Current Rules. http://www.baaqmd.gov/rules-and-compliance/current-rules
CAPCOA (California Air Pollution Control Officers Association). 2016. California Emissions Estimator Model [CalEEMod], Version 2016.3.1. User’s Guide and Appendix D - Default Data Tables. http://www.caleemod.com/
CARB (California Air Resources Board). 1998. Fact Sheet - The Toxic Air Contaminant Identification Process: Toxic Air Contaminant Emissions from Diesel-fueled Engines. http://www.arb.ca.gov/toxics/dieseltac/ factsht1.pdf
Draft – September 2017
Chabot College 2012 Facilities Master Plan Initial Study – 26
Potentially Significant Potentially Unless Less Than Significant Mitigation Significant No Impact Incorporated Impact Impact 4. BIOLOGICAL RESOURCES. Would the project:
a) Have a substantial adverse effect, either directly or through habitat modifications, on any species identified as a candidate, sensitive, or special status species in local or regional plans, policies, or regulations or by the California Department of Fish and Game or U.S. Fish and Wildlife Service?
b) Have a substantial adverse effect on any riparian habitat or other sensitive natural community identified in local or regional plans, policies, regulations or by the California Department of Fish and Game or US Fish and Wildlife Service?
c) Have a substantial adverse effect on federally protected wetlands as defined by Section 404 of the Clean Water Act (including, but not limited to marsh, vernal pool, coastal, etc.) through direct removal, filling, hydrological interruption, or other means?
d) Interfere substantially with the movement of any native resident or migratory fish or wildlife species or with established native resident or migratory wildlife corridors, or impede the use of native wildlife nursery sites?
e) Conflict with any local policies or ordinances protecting biological resources, such as a tree preservation policy or ordinance?
f) Conflict with the provisions of an adopted Habitat Conservation Plan, Natural Community Conservation Plan, or other approved local, regional, or state habitat conservation plan?
Environmental Setting
The 2005 FMP Mitigated Negative Declaration/Initial Study documented the presence of swallows (protected under the Migratory Bird Act) nesting on some of the buildings on the Chabot College campus and recommended mitigation measures to protect nesting swallows. Swallows continue to return to the Chabot College every year. With the exception of the presence of the swallows, there are no other protected biological resources present on the College campus.
Impact Discussion
Buildout of the 2012 FMP could result in significant adverse impacts to swallows nesting on the Chabot College. This is a significant impact, but with implementation of Mitigation Measures BIO-1 and BIO-2, significant impacts would be less than significant. A discussion of each environmental issue included under Section 4 is presented below.
Draft – September 2017
Chabot College 2012 Facilities Master Plan Initial Study – 27
a) Would the project have a substantial adverse effect, either directly or through habitat modifications, on any species identified as a candidate, sensitive, or special status species in local or regional plans, policies, or regulations or by the California Department of Fish and Game or U.S. Fish and Wildlife Service?
The Chabot College campus is fully developed with buildings, ball fields and athletic facilities, parking lots and a vehicular and pedestrian circulation network. Swallows are present on the campus and have historically nested in some of the College buildings (Chabot Las Positas Community College District 2005). Swallows are protected under the federal Migratory Bird Treaty Act (MBTA) which prohibits the killing, possessing, or trading of migratory birds except in accordance with regulations prescribed by the Secretary of the Interior. The trustee agency that addresses issues related to the MBTA is the United States Fish and Wildlife Service USFWS. Migratory birds protected under this law include all native birds and certain game birds (e.g., turkeys and pheasants). This act encompasses whole birds, parts of birds, and bird nests and eggs. The MBTA protects active nests from destruction and all nests of species protected by the MBTA, whether active or not, cannot be possessed. An active nest under the MBTA, as described by the Department of the Interior in its 16 April 2003 Migratory Bird Permit Memorandum, is one having eggs or young. Nest starts, prior to egg laying, are not protected from destruction.
The Project would result in the demolition of six buildings and the renovation of two buildings. Disturbance of swallow’s nests in active use during construction represents a significant impact. The nesting season for swallows generally is from March 15 through August 15. The College has an ongoing maintenance program to prevent swallows from nesting in campus buildings. The Mitigated Negative Declaration prepared for the 2005 FMP (Chabot Las Positas Community College District 2005) identified measures to mitigate potential impacts to nesting swallows. With continued implementation of these mitigations identified in this Initial Study as Mitigation Measure BIO-1 and Mitigation Measure BIO-2, significant impacts to swallows would be less than significant.
b) Would the project have a substantial adverse effect on any riparian habitat or other sensitive natural community identified in local or regional plans, policies, regulations or by the California Department of Fish and Game or U.S. Fish and Wildlife Service?
The Chabot College campus is developed and does not contain riparian habitat or sensitive natural communities (Chabot Las Positas Community College District 2005).
c) Would the project have a substantial adverse effect on federally protected wetlands as defined by Section 404 of the Clean Water Act (including but not limited to marsh, vernal pool, coastal, etc.) through direct removal, filling, hydrological interruption, or other means?
There are no wetlands on the Chabot College campus (Chabot Las Positas Community College District 2005).
Draft – September 2017
Chabot College 2012 Facilities Master Plan Initial Study – 28
d) Would the project interfere substantially with the movement of any native resident or migratory fish or wildlife species or with established native resident or migratory wildlife corridors, or impede the use of native wildlife nursery sites?
Buildout of the 2012 FMP may interfere with the migratory movement of swallows that nest in campus buildings (see Subsection 4a above) Mitigation Measure BIO-1 and BIO-2 will reduce potentially significant impacts to swallows to less than significant.
e) Would the project conflict with any local policies or ordinances protecting biological resources, such as a tree preservation policy or ordinance?
Buildout of the 2012 FMP would result in the removal of some existing trees on campus. The District is not governed by local regulations concerning the protection of biological resources such as trees. The Chabot College Design Guidelines includes a landscape plan and planting guidelines for all proposed landscaping including the planting of new trees (Chabot Las Positas Community College District. 2007).
f) Would the project conflict with the provisions of an adopted Habitat Conservation Plan, Natural Community Conservation Plan, or other approved local, regional, or state habitat conservation plan?
Implementation of the 2012 FMP would not conflict with any Habitat Conservation Plans or Natural Community Conservation Plans or other approved local, regional or state habitat conservation plans.
Mitigation Measures
BIO-1 Chabot College shall continue its building maintenance program to prevent swallows from nesting in College buildings. Methods to discourage nesting swallows shall include but are not limited to:
• Netting to prevent access to building eaves. • Enclosing and/or covering openings in building accessible to swallows for nest building. • Inspecting buildings on an annual basis to replace and/or repair netting and cover
openings.
BIO-2 Between March 15 and August 15 (nesting/breeding period), prior to the demolition or exterior modernization of College buildings, the buildings shall be surveyed by a qualified biologist 30 days in advance of the construction activity to determine if nests are present and in use during this period. If nests are in use, construction activity at the building shall be delayed and a qualified biologist shall continue the surveys until it has been determined that any young have fledged and are no longer using the nest. If construction activities occur outside of the nesting/breeding period, surveys will not be required.
References Chabot Las Positas Community College District. 2005. Chabot College Facility Master Plan Mitigated Negative
Declaration. Prepared by PLACEMAKERS. September 2005.
Chabot Las Positas Community College District. 2007. Chabot College Design Guidelines. Prepared by Royston Hanamoto Alley & Abey and Carducci & Associates, Inc. August 3, 2007.
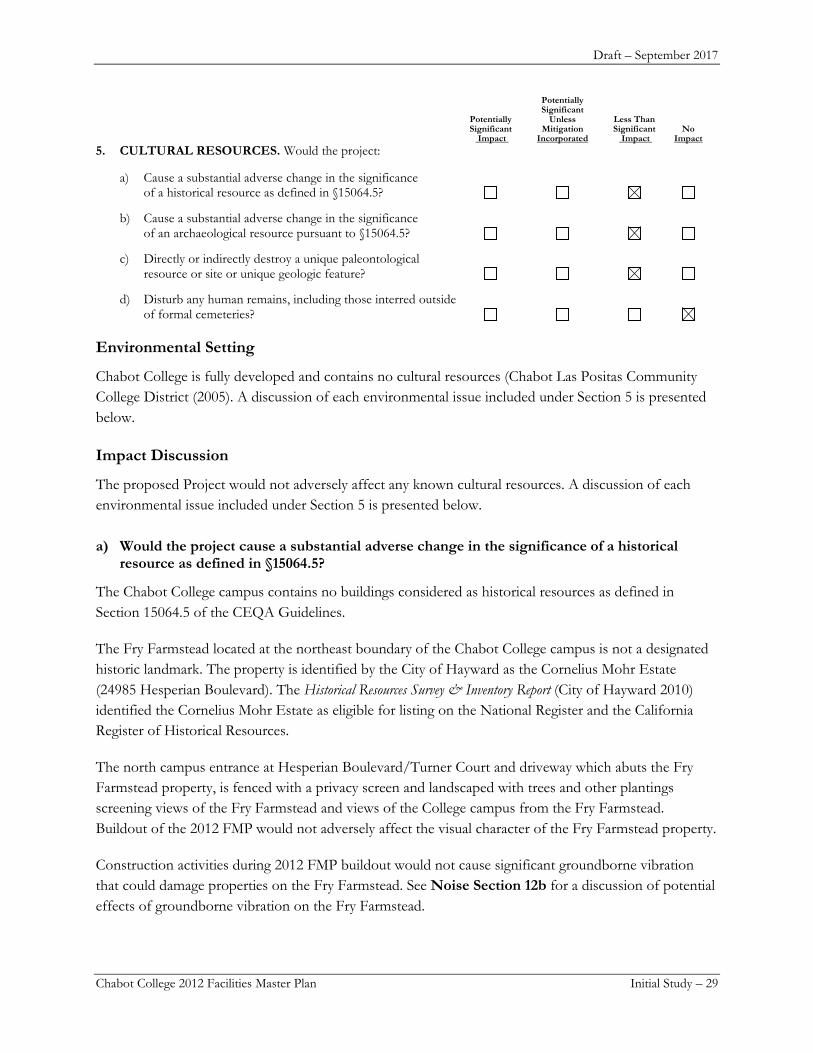
Draft – September 2017
Chabot College 2012 Facilities Master Plan Initial Study – 29
Potentially Significant Potentially Unless Less Than Significant Mitigation Significant No Impact Incorporated Impact Impact 5. CULTURAL RESOURCES. Would the project:
a) Cause a substantial adverse change in the significance of a historical resource as defined in §15064.5?
b) Cause a substantial adverse change in the significance of an archaeological resource pursuant to §15064.5?
c) Directly or indirectly destroy a unique paleontological resource or site or unique geologic feature?
d) Disturb any human remains, including those interred outside of formal cemeteries?
Environmental Setting
Chabot College is fully developed and contains no cultural resources (Chabot Las Positas Community College District (2005). A discussion of each environmental issue included under Section 5 is presented below.
Impact Discussion
The proposed Project would not adversely affect any known cultural resources. A discussion of each environmental issue included under Section 5 is presented below.
a) Would the project cause a substantial adverse change in the significance of a historical resource as defined in §15064.5?
The Chabot College campus contains no buildings considered as historical resources as defined in Section 15064.5 of the CEQA Guidelines.
The Fry Farmstead located at the northeast boundary of the Chabot College campus is not a designated historic landmark. The property is identified by the City of Hayward as the Cornelius Mohr Estate (24985 Hesperian Boulevard). The Historical Resources Survey & Inventory Report (City of Hayward 2010) identified the Cornelius Mohr Estate as eligible for listing on the National Register and the California Register of Historical Resources.
The north campus entrance at Hesperian Boulevard/Turner Court and driveway which abuts the Fry Farmstead property, is fenced with a privacy screen and landscaped with trees and other plantings screening views of the Fry Farmstead and views of the College campus from the Fry Farmstead. Buildout of the 2012 FMP would not adversely affect the visual character of the Fry Farmstead property.
Construction activities during 2012 FMP buildout would not cause significant groundborne vibration that could damage properties on the Fry Farmstead. See Noise Section 12b for a discussion of potential effects of groundborne vibration on the Fry Farmstead.
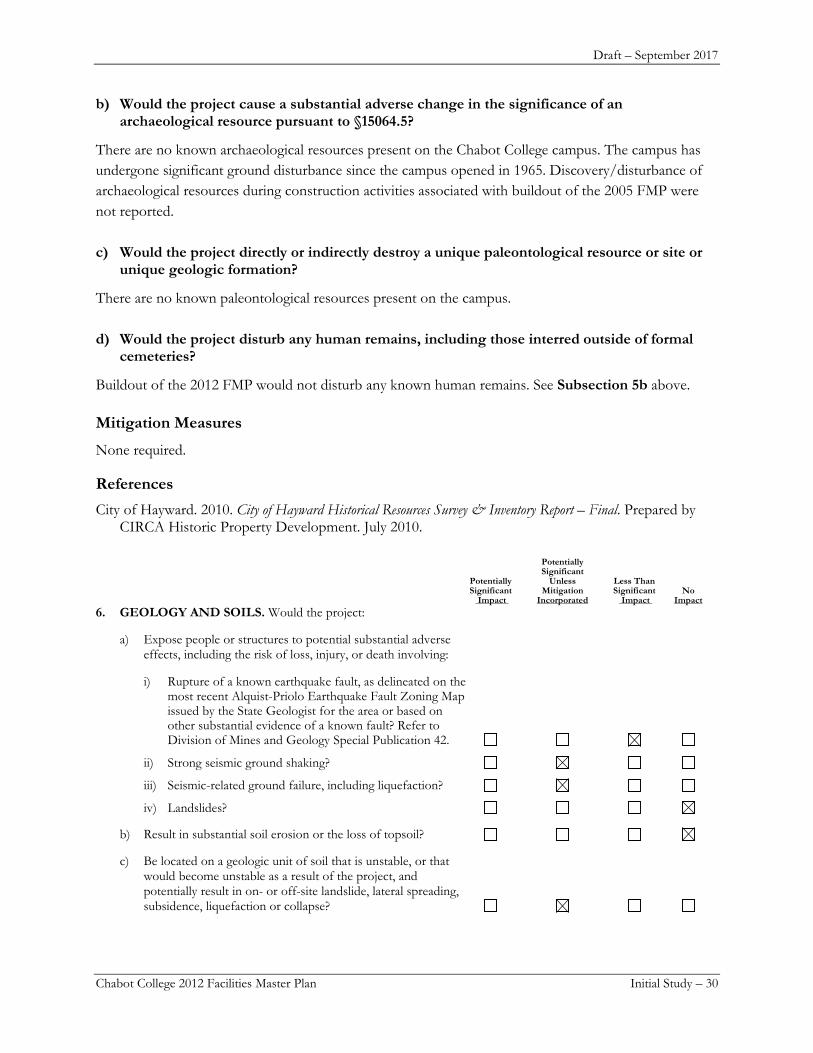
Draft – September 2017
Chabot College 2012 Facilities Master Plan Initial Study – 30
b) Would the project cause a substantial adverse change in the significance of an archaeological resource pursuant to §15064.5?
There are no known archaeological resources present on the Chabot College campus. The campus has undergone significant ground disturbance since the campus opened in 1965. Discovery/disturbance of archaeological resources during construction activities associated with buildout of the 2005 FMP were not reported.
c) Would the project directly or indirectly destroy a unique paleontological resource or site or unique geologic formation?
There are no known paleontological resources present on the campus.
d) Would the project disturb any human remains, including those interred outside of formal cemeteries?
Buildout of the 2012 FMP would not disturb any known human remains. See Subsection 5b above.
Mitigation Measures
None required.
References City of Hayward. 2010. City of Hayward Historical Resources Survey & Inventory Report – Final. Prepared by
CIRCA Historic Property Development. July 2010. Potentially Significant Potentially Unless Less Than Significant Mitigation Significant No Impact Incorporated Impact Impact 6. GEOLOGY AND SOILS. Would the project:
a) Expose people or structures to potential substantial adverse effects, including the risk of loss, injury, or death involving:
i) Rupture of a known earthquake fault, as delineated on the most recent Alquist-Priolo Earthquake Fault Zoning Map issued by the State Geologist for the area or based on other substantial evidence of a known fault? Refer to Division of Mines and Geology Special Publication 42.
ii) Strong seismic ground shaking?
iii) Seismic-related ground failure, including liquefaction?
iv) Landslides?
b) Result in substantial soil erosion or the loss of topsoil?
c) Be located on a geologic unit of soil that is unstable, or that would become unstable as a result of the project, and potentially result in on- or off-site landslide, lateral spreading, subsidence, liquefaction or collapse?
Draft – September 2017
Chabot College 2012 Facilities Master Plan Initial Study – 31
Potentially Significant Potentially Unless Less Than Significant Mitigation Significant No Impact Incorporated Impact Impact 6. GEOLOGY AND SOILS (cont.)
d) Be located on expansive soil, as defined in Table 18-1-B of the Uniform Building Code (1994), creating substantial risks to life or property?
e) Have soils incapable of adequately supporting the use of septic tanks or alternative wastewater disposal systems where sewers are not available for the disposal of wastewater?
Environmental Setting
The Chabot College campus is located within the seismically active San Francisco Bay Area, thus strong ground shaking may be expected at the campus.
Regulatory Setting
As a result of California’s Field Act, the California Building Code (Title 24 of the California code of Regulations) contains special provisions for the design and construction of schools in California. The design and construction of the eight buildings identified in the 2012 FMP will be overseen by the California Division of the State Architect (DSA) and the California Geological Survey (CGS).
Construction sites disturbing one acre or more are required to obtain coverage under the National Pollution Discharge Elimination System (NPDES) Construction General Permit (CGP) for Discharges of Storm Water Associated with Construction Activity. As buildout of the 2012 FMP will disturb more than one acre of land, the Project is subject to the CGP and requires the preparation of a Storm Water Pollution Prevention Plan (SWPPP). See Section 9, Hydrology and Water Quality, for a discussion of the Project’s responsibilities under the CGP.
Impact Discussion
The Chabot College campus could be subject to strong ground shaking during a seismic event and liquefaction. Subsurface soils are low to moderately expansive. With implementation of Mitigation Measure GEO-1 potential adverse impacts would be less than significant. A discussion of each environmental issue included under Section 6 is presented below.
a) Would the project expose people or structures to potential substantial adverse affects, including the risk of loss, injury, or death?
(i) The Chabot College campus is not located within an Alquist-Priolo Fault Rupture Hazard Zone. The closest known active fault is the Hayward Fault, located about 2.4 miles northeast of the campus. Other nearby known active faults include the Calaveras and Mount Diablo faults located east of the campus and the San Andreas fault located west of the campus. The potential for ground surface rupture due to faulting at the campus is considered low (Terraphase Engineering Inc., 2015).
Draft – September 2017
Chabot College 2012 Facilities Master Plan Initial Study – 32
(ii) There is the potential that strong seismic ground shaking could occur at the campus. With implementation of Mitigation Measure GEO-1, potentially significant ground shaking impacts would be less than significant.
(iii) Liquefaction is the process by which loose to medium dense granular, saturated soils, becomes fluid due to ground shaking. Liquefaction can result in ground failure. The geotechnical investigation prepared for the proposed new Biology Building (B2100) reported the building site is located within a Liquefaction Hazard Zone and groundwater was conservatively reported at depths of 12 feet below ground surface (bgs) (Terraphase Engineering, Inc., 2015). Based on geotechnical data in the campus vicinity, the depth to groundwater is approximately 15 to 20 bgs (Chabot Las Positas Community College District 2005) Liquefaction hazards may exist throughout the campus. This is a potentially significant impact but with implementation of Mitigation Measure GEO-1, potentially significant impacts would be less than significant.
(iv) The Chabot College campus is essentially flat. No significant landslide risk exists (Terraphase Engineering Inc., 2015).
b) Would the project result in substantial soil erosion or the loss of topsoil?
The Project would result in soil disturbance associated with buildout of the 2012 FMP resulting in the potential for soil erosion during construction activities. Soil erosion may occur and small quantities of pollutants may enter the storm drainage system, potentially degrading water quality. The District or its contractors will prepare a SWPPP to address accidental releases of chemicals and other pollutants, therefore Project construction activities for each development phase would be less than significant. See Section 9, Hydrology and Water Quality.
c) Would the project be located on a geologic unit of soil that is unstable, or that would become unstable as a result of the project, and potentially result in on-or-offsite landslide, lateral spreading, subsidence, liquefaction or collapse?
There is a potential for liquefaction, but the potential for landslide, lateral spreading, subsidence or collapse represents no significant threat (see Subsection 9a above)
d) Would the project be located on expansive soil, as defined in Table 18-1B of the Uniform Building Code (1994), creating substantial risks to life or property?
The geotechnical investigation prepared for the proposed new Biology Building (B2100) reported a potential of low to medium expansive soils across the campus (Terraphase Engineering, Inc., 2015). With implementation of Mitigation Measure GEO-1, potentially significant impacts associated with expansive soils would be less than significant.
e) Would the project have soils incapable of adequately supporting the use of septic tanks or alternative waste water disposal systems where sewers are not available for the disposal of waste water?
The Chabot College campus is connected to the City of Hayward sanitary sewer system.
Draft – September 2017
Chabot College 2012 Facilities Master Plan Initial Study – 33
Mitigation Measures
GEO-1 Detailed geotechnical investigations shall be performed prior to the design of each of the eight proposed new buildings. The geotechnical investigations shall include borings and laboratory testing to provide supporting data for geotechnical design recommendations.
References
Chabot Las Positas Community College District. 2005. Chabot College Facility Master Plan Mitigated Negative Declaration. Prepared by PLACEMAKERS. September 2005.
Terraphase Engineering, Inc. 2015. Geotechnical Engineering and Design Report Biology Building, Chabot College, Hayward, California. September 17, 2015.
Potentially Significant Potentially Unless Less Than Significant Mitigation Significant No Impact Incorporated Impact Impact 7. GREENHOUSE GAS EMISSIONS. Would the project:
a) Generate greenhouse gas emissions, either directly or indirectly, that may have a significant impact on the environment?
b) Conflict with an applicable plan, policy or regulation adopted for the purpose of reducing the emissions of greenhouse gases?
Environmental Setting
Greenhouse gases (GHGs) are atmospheric gases that capture and retain a portion of the heat radiated from the earth after it has been heated by the sun. The primary GHGs are carbon dioxide (CO2), methane (CH4), and nitrous oxide (N2O), ozone, and water vapor. While GHGs are natural components of the atmosphere, CO2, CH4 and N2O are also emitted from human activities and their accumulation in the atmosphere over the past 200 years has substantially increased their concentrations. This accumulation of GHGs has been implicated as the driving force behind global climate change.
Human emissions of CO2 are largely by-products of fossil fuel combustion, whereas CH4 results from off-gassing associated with organic decay processes in agriculture, landfills, etc. Other GHGs, including hydrofluorocarbons, perfluorocarbons, and sulfur hexafluoride, are generated by certain industrial processes. The global warming potential of GHGs are typically reported in comparison to that of CO2, the most common and influential GHG, in units of “carbon dioxide-equivalents” (CO2e).2
There is international scientific consensus that human-caused increases in GHGs have and will continue to contribute to global warming. Potential global warming impacts in California may include, but are not limited to, loss in snow pack, sea level rise, more extreme heat days per year, more high ozone days, increased forest fires, and more drought years. Secondary effects are likely to include a global rise in sea level, impacts to agriculture, changes in disease vectors, and changes in habitat and biodiversity. 2 Because of the differential heat absorption potential of various GHGs, GHG emissions are frequently measured in “carbon
dioxide-equivalents,” which present a weighted average based on each gas’s heat absorption (or “global warming”) potential.
Draft – September 2017
Chabot College 2012 Facilities Master Plan Initial Study – 34
The California Air Resources Board (CARB) estimated that in 2011 California produced 448 million gross metric tons of CO2e, or about 535 million U.S. tons. CARB found that transportation is the source of 37.6 percent of the state’s GHG emissions, followed by industrial sources at 20.8 percent and electricity generation (both in-state and out-of-state) at 19.3 percent. Commercial and residential fuel use (primarily for heating) accounted for 10.1 percent of GHG emissions.
In the San Francisco Bay Area, fossil fuel consumption in the transportation sector (on-road motor vehicles, off-highway mobile sources, and aircraft) and the industrial and commercial sectors are the two largest sources of GHG emissions, each accounting for approximately 36 percent of the San Francisco Bay Area’s 95.8 million metric tons of CO2e emitted in 2007. Electricity generation accounts for approximately 16 percent of the San Francisco Bay Area’s GHG emissions followed by residential fuel usage at seven percent, off-road equipment at three percent and agriculture at one percent.
The Bay Area Air Quality Management District (BAAQMD) is the primary agency responsible for air quality regulation in the nine-county San Francisco Bay Area Air Basin. As part of that role, the BAAQMD has prepared CEQA Air Quality Guidelines that provide CEQA thresholds of significance for operational GHG emissions from land use projects: 1) 1,100 metric tons of CO2e per year; or 2) 4.6 metric tons of CO2e per year per project “service population” (i.e., project residents + project employees), which are also considered the definition of a cumulatively considerable contribution to the global GHG burden and, therefore, of a significant cumulative impact. The BAAQMD has not defined thresholds for project construction GHG emissions. The CEQA Air Quality Guidelines methodology and thresholds of significance have been used in this Initial Study’s analysis of potential GHG impacts associated with the Project.
Regulatory Setting
Assembly Bill 32 (AB 32 - Núñez, Chapter 488, Statutes of 2006), the California Global Warming Solutions Act, requires the CARB to lower State GHG emissions to 1990 levels by 2020 - a 25 percent reduction statewide with mandatory caps for significant GHG emission sources. AB 32 directed CARB to develop discrete early actions to reduce GHG while preparing the Climate Change Scoping Plan to identify how best to reach the 2020 goal.
Statewide strategies to reduce GHG emissions to attain the 2020 goal include the Low Carbon Fuel Standard (LCFS), the California Appliance Energy Efficiency regulations, the California Renewable Energy Portfolio standard, changes in the motor vehicle corporate average fuel economy (CAFE) standards, and other early action measures that would ensure the state is on target to achieve the GHG emissions reduction goals of AB 32.
In an effort to make further progress in attaining the longer-range GHG emissions reductions required by AB 32, Governor Brown identified in his January 2015 inaugural address an additional goal (i.e., reducing GHG emissions to 40 percent below 1990 levels by 2030) to be attained by implementing several key climate change strategy “pillars:” (1) reducing present petroleum use in cars and trucks by up to 50 percent; (2) increasing from one-third to 50 percent the share of California’s electricity derived
Draft – September 2017
Chabot College 2012 Facilities Master Plan Initial Study – 35
from renewable sources; (3) doubling the energy efficiency savings achieved at existing buildings and making heating fuels cleaner; (4) reducing the release of methane, black carbon, and other short-lived GHGs; (5) managing farm and rangelands, forests and wetlands to more efficiently store carbon; and (6) periodically updating the State's climate adaptation strategy.
In January 2010, the State Building Standards Commission adopted updates to the California Green Building Standards Code (CALGreen), which went into effect in January 2011. CALGreen contains requirements for construction site selection, storm water control during construction, construction waste reduction, indoor water use reduction, material selection, natural resource conservation, and site irrigation conservation. CALGreen provides for design options allowing the designer to determine how best to achieve compliance for a given site or building condition. CALGreen also requires building commissioning, which is a process for verifying that all building systems, like heating and cooling equipment and lighting systems, are functioning at their maximum efficiency. CALGreen provides the minimum standard that buildings need to meet to be certified for occupancy, but does not prevent a local jurisdiction from adopting more stringent requirements. CALGreen is intended to (1) reduce GHG emissions from buildings; (2) promote environmentally responsible, cost-effective, healthier places to live and work; and (3) reduce energy and water consumption.
Chabot College Climate Action Plan (CAP)
In 2007 the Chabot Las Positas Community College District (CLPCCD) became a signatory to the American College and University Presidents Climate Commitment (ACUJPCC). In 2010, Chabot College adopted the Chabot College Climate Action Plan 2010 (Chabot Las Positas Community College District 2010).
Presented below is a summary of key elements of the CAP.
Buildings and Energy
• All new buildings will be a minimum of Leadership in Energy and Environmental Design (LEED) Silver Certified and all new renovations LEED Silver equivalent.
• Sustainability guidelines for campus buildings were adopted in the 2005 FMP (Chabot Las Positas Community College District 2005).
• Products must be Energy Star certified.
• Conversion from T-12 to T-8 fluorescent lighting.
• Installation of solar panels. In 2009, more than 6,000 solar panels were installed with capacity of producing 1.1 megawatts of electricity, meeting more than 20 percent of the campus’s current electricity needs.
Transportation • Fourteen plug-in electric chargers located near the solar panels are provided for electric vehicles.
Draft – September 2017
Chabot College 2012 Facilities Master Plan Initial Study – 36
• Information on transportation alternatives such as carpooling, bicycling, or taking public transit to the campus is disseminated through the Office of Student Life and on the campus website at: http://www.chabotcollege.edu/safety/parking/PublicTransit.asp.
Water and Waste • A comprehensive storm water management plan has been adopted and designed with retention and
filtration basins such that campus outflows will be at no greater rate and no less quality than outflows prior to the District bond program in 2005.
• A comprehensive recycling and composting program was initiated in 2003 including on-site composting of organic material, construction waste diversion, and single-stream recycling. To improve waste management through better separation of construction debris, trash and dirt fill generated during current and future construction activity, Chabot College requires construction bid documents to include a “Debris Recycling Statement.”
• Chabot College has reduced its consumption of paper through: online admission applications; registration, grades, and course materials through Blackboard and instructional websites; reduced number of hardcopy agendas and minutes for institutional meetings; electronic curriculum development; online book orders, and reduction of printed periodicals in the library ten years.
Education and Community Outreach • Established a Facilities and Sustainability Committee in 2005/2006.
• Chabot College offers online and hybrid courses, in combination with distance learning classrooms help to reduce the number of vehicle trips to campus and their associated emissions.
Impact Discussion
The Chabot College CAP addresses a comprehensive approach to reduce GHG emissions. The proposed 2012 FMP will comply with the CAP. Potential GHG emissions would be less than significant. A brief discussion of each environmental issue included under Section 7 is presented below.
a) Would the project generate greenhouse gas emissions, either directly or indirectly, that may have a significant impact on the environment?
The CalEEMod (California Emissions Estimator Model, Version 2016.3.1) model was used to quantify long-term net new GHG operational emissions produced by additional motor vehicles, energy and water use, and solid waste generation attributable to FMP implementation. CalEEMod incorporates GHG emission factors for motor vehicles, electricity generation, water use and solid waste generation, and mitigation strategies based on the California Air Pollution Control Officer’s Association (CAPCOA) Quantifying Greenhouse Gas Mitigation Measures and the California Climate Action Registry General Reporting Protocol.
The Project’s estimated operational GHG emissions are presented in Table 10. There would be no net new GHG operational emissions in the year 2030 resulting from campus expansion under the FMP; future GHG emissions would decrease by about 3,100 metric tons per year. About 80 percent of the GHG emitted by campus sources are associated with motor vehicle use. These emissions from all College motor vehicle sources are expected to decline by about 18 percent over the 2012 FMP buildout period. Thus, even though
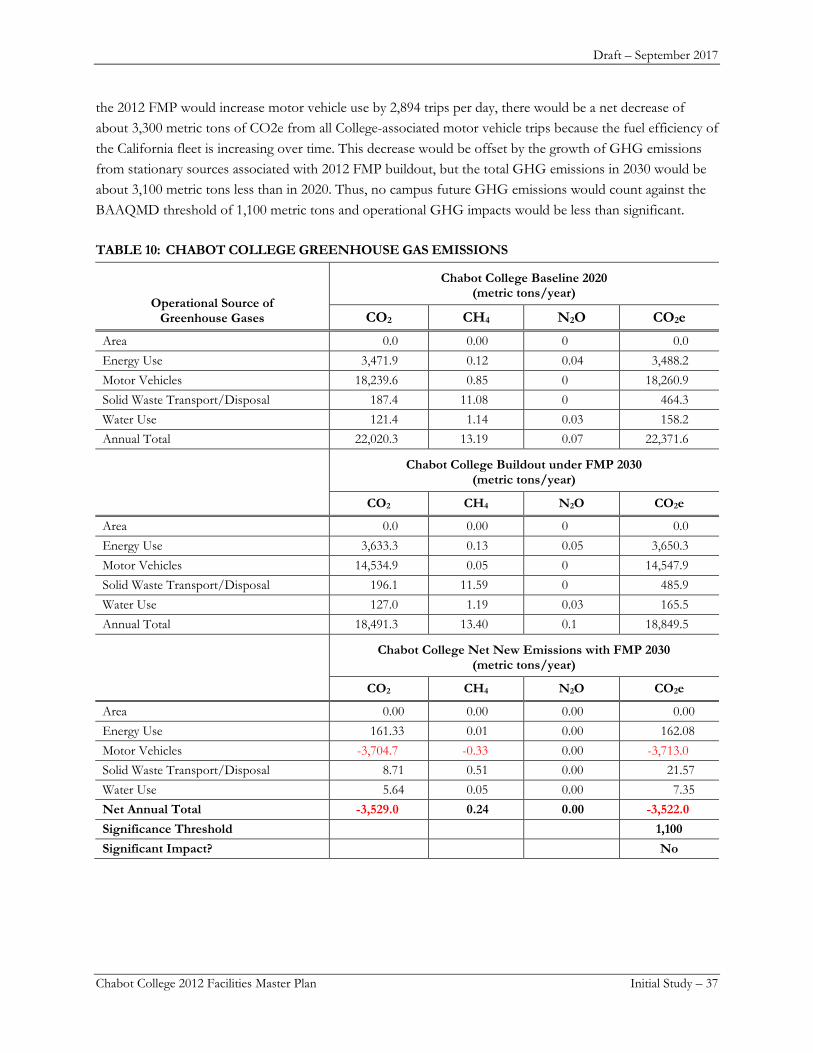
Draft – September 2017
Chabot College 2012 Facilities Master Plan Initial Study – 37
the 2012 FMP would increase motor vehicle use by 2,894 trips per day, there would be a net decrease of about 3,300 metric tons of CO2e from all College-associated motor vehicle trips because the fuel efficiency of the California fleet is increasing over time. This decrease would be offset by the growth of GHG emissions from stationary sources associated with 2012 FMP buildout, but the total GHG emissions in 2030 would be about 3,100 metric tons less than in 2020. Thus, no campus future GHG emissions would count against the BAAQMD threshold of 1,100 metric tons and operational GHG impacts would be less than significant.
TABLE 10: CHABOT COLLEGE GREENHOUSE GAS EMISSIONS
Operational Source of Greenhouse Gases
Chabot College Baseline 2020 (metric tons/year)
CO2 CH4 N2O CO2e Area 0.0 0.00 0 0.0 Energy Use 3,471.9 0.12 0.04 3,488.2 Motor Vehicles 18,239.6 0.85 0 18,260.9 Solid Waste Transport/Disposal 187.4 11.08 0 464.3 Water Use 121.4 1.14 0.03 158.2 Annual Total 22,020.3 13.19 0.07 22,371.6
Chabot College Buildout under FMP 2030 (metric tons/year)
CO2 CH4 N2O CO2e
Area 0.0 0.00 0 0.0 Energy Use 3,633.3 0.13 0.05 3,650.3 Motor Vehicles 14,534.9 0.05 0 14,547.9 Solid Waste Transport/Disposal 196.1 11.59 0 485.9 Water Use 127.0 1.19 0.03 165.5 Annual Total 18,491.3 13.40 0.1 18,849.5
Chabot College Net New Emissions with FMP 2030 (metric tons/year)
CO2 CH4 N2O CO2e
Area 0.00 0.00 0.00 0.00 Energy Use 161.33 0.01 0.00 162.08 Motor Vehicles -3,704.7 -0.33 0.00 -3,713.0 Solid Waste Transport/Disposal 8.71 0.51 0.00 21.57 Water Use 5.64 0.05 0.00 7.35 Net Annual Total -3,529.0 0.24 0.00 -3,522.0 Significance Threshold 1,100 Significant Impact? No
Draft – September 2017
Chabot College 2012 Facilities Master Plan Initial Study – 38
The 191-metric-ton net new increment from campus stationary GHG sources (i.e., the sum of net new emissions from energy, solid waste and water use GHG sources, as shown for each individual source in Table 10) as calculated by CalEEMod is a worst-case estimate. Implementation of the Chabot College CAP will reduce GHG emissions from campus-related stationary sources further from this amount and the future GHG emissions from all campus sources will be even less than the 3,100 metric ton CalEEMod estimate given above.
b) Would the project conflict with an applicable plan, policy or regulation adopted for the purpose of reducing the emissions of greenhouse gases?
The proposed 2012 FMP will be constructed consistent with the Chabot College CAP, which is compatible with CALGreen, and the CAP would promote and comply with the GHG reduction strategies of AB 32.
Mitigation Measures
None required.
References BAAQMD (Bay Area Air Quality Management District). 2010a. California Environmental Quality Act
Guidelines Update, Proposed Thresholds of Significance. http://www.baaqmd.gov/~/media/files/planning-and-research/ceqa/proposed_thresholds_report_-may_3_2010_final.pdf?la=en
BAAQMD. 2012. California Environmental Quality Act (CEQA) Air Quality Guidelines. http://www.baaqmd.gov/~/media/Files/Planning%20and%20Research/CEQA/BAAQMD%20CEQA%20Guidelines_Final_May%202012.ashx?la=en
BAAQMD. 2010b. Source Inventory of Bay Area Greenhouse Gas Emissions. http://www.baaqmd.gov/~/media/Files/Planning%20and%20Research/Emission%20Inventory/regionalinventory2007_2_10.ashx
California Climate Change Center. 2012. Our Changing Climate 2012 Vulnerability & Adaptation to the Increasing Risks from Climate Change in California, A Summary Report on the Third Assessment from the California Climate Change Center. http://uc-ciee.org/downloads/Our%20Changing%20Climate%202012.pdf
CAPCOA (California Air Pollution Control Officers Association). 2013. California Emissions Estimator Model [CalEEMod], Version 2016.3.1 User’s Guide and Appendix D - Default Data Tables. http://www.caleemod.com/
CAPCOA. 2010. Quantifying Greenhouse Gas Mitigation Measures. http://www.capcoa.org/wp-content/uploads/2010/11/CAPCOA-Quantification-Report-9-14-Final.pdf
CARB. 2015a. California Greenhouse Gas Emissions for 2000 to 2013 – Trends of Emissions and Other Indicators. http://www.arb.ca.gov/cc/inventory/pubs/reports/ghg_inventory_trends_00-13%20_10sep2015.pdf
Chabot Las Positas Community College District. 2010. Chabot College Climate Action Plan. June 2010.
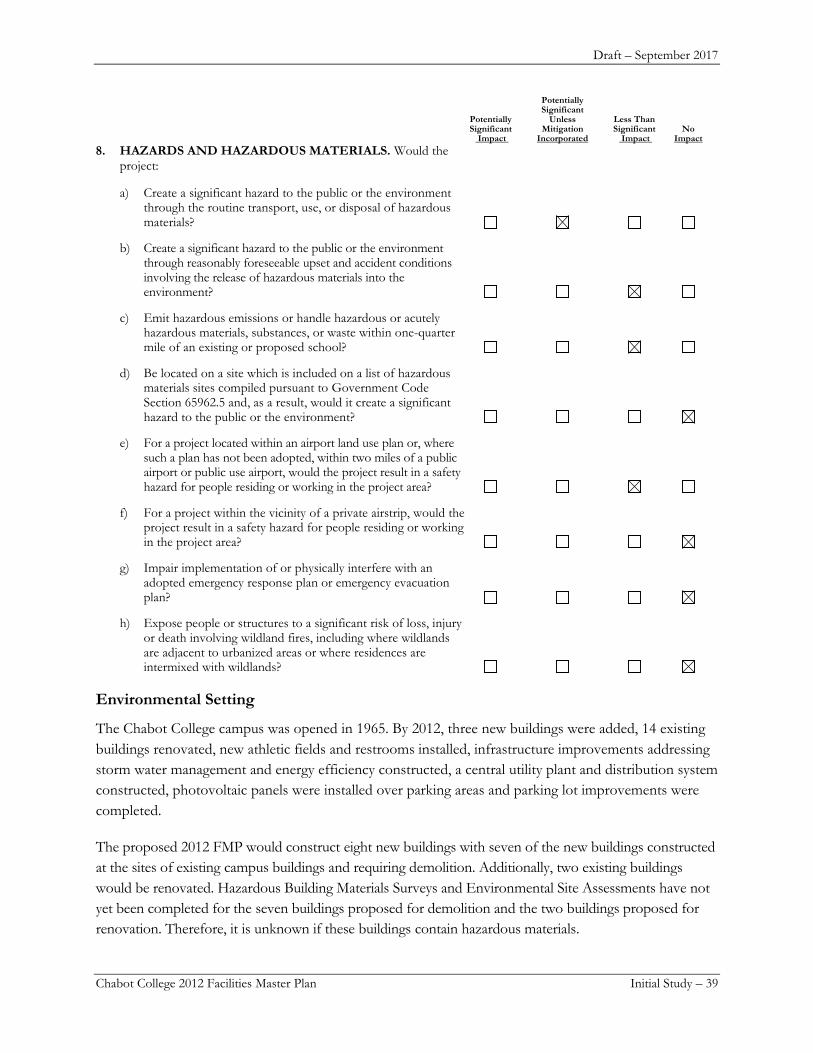
Draft – September 2017
Chabot College 2012 Facilities Master Plan Initial Study – 39
Potentially Significant Potentially Unless Less Than Significant Mitigation Significant No Impact Incorporated Impact Impact 8. HAZARDS AND HAZARDOUS MATERIALS. Would the
project:
a) Create a significant hazard to the public or the environment through the routine transport, use, or disposal of hazardous materials?
b) Create a significant hazard to the public or the environment through reasonably foreseeable upset and accident conditions involving the release of hazardous materials into the environment?
c) Emit hazardous emissions or handle hazardous or acutely hazardous materials, substances, or waste within one-quarter mile of an existing or proposed school?
d) Be located on a site which is included on a list of hazardous materials sites compiled pursuant to Government Code Section 65962.5 and, as a result, would it create a significant hazard to the public or the environment?
e) For a project located within an airport land use plan or, where such a plan has not been adopted, within two miles of a public airport or public use airport, would the project result in a safety hazard for people residing or working in the project area?
f) For a project within the vicinity of a private airstrip, would the project result in a safety hazard for people residing or working in the project area?
g) Impair implementation of or physically interfere with an adopted emergency response plan or emergency evacuation plan?
h) Expose people or structures to a significant risk of loss, injury or death involving wildland fires, including where wildlands are adjacent to urbanized areas or where residences are intermixed with wildlands?
Environmental Setting
The Chabot College campus was opened in 1965. By 2012, three new buildings were added, 14 existing buildings renovated, new athletic fields and restrooms installed, infrastructure improvements addressing storm water management and energy efficiency constructed, a central utility plant and distribution system constructed, photovoltaic panels were installed over parking areas and parking lot improvements were completed.
The proposed 2012 FMP would construct eight new buildings with seven of the new buildings constructed at the sites of existing campus buildings and requiring demolition. Additionally, two existing buildings would be renovated. Hazardous Building Materials Surveys and Environmental Site Assessments have not yet been completed for the seven buildings proposed for demolition and the two buildings proposed for renovation. Therefore, it is unknown if these buildings contain hazardous materials.
Draft – September 2017
Chabot College 2012 Facilities Master Plan Initial Study – 40
Chabot College is located about 0.6 mile southeast of the Hayward Executive Airport.
Impact Discussion
Operation of the Project would not emit hazardous emissions. Limited quantities of potentially hazardous materials may be used and stored in the new Biology Building (B2100), new Science Facility (B2000), the addition to the Maintenance & Operations Warehouse Building (B3000) and new Garage Annex for Automotive Area (Building 3400), but such materials would be limited to quantities allowed by the California Fire Code and is considered a less than significant impact. Chabot College is within two miles of the Hayward Executive Airport, however it does not represent a hazard based on the Hayward Executive Airport Land Use Compatibility Plan (County of Alameda 2012). There is the potential that buildings proposed for demolition may contain hazardous building materials and soils may be impacted with hazardous substances, but with implementation of Mitigation Measure HAZ-1 and Mitigation Measure HAZ-2 potential impacts would be less than significant. A brief discussion of each environmental issue included under Section 8 is presented below.
a) Would the project create a significant hazard to the public or the environment through the routine transport, use, or disposal of hazardous materials?
During Construction Building demolitions would occur during each development phase identified in the 2012 FMP: Phase 1 one building would be demolished; Phase 2 two buildings would be demolished; Phase 3 three buildings would be demolished; and Phase 4 one building would be demolished. Additionally two existing buildings would be renovated Some or all of the buildings proposed for demolition and renovation may contain asbestos-containing building materials (ACM), lead-containing building materials, loose & peeling lead containing paint, and/or polychlorinated biphenyl (PCB)-containing building materials. This represents a potentially significant impact. If found in any of the seven buildings proposed for demolition, these materials would require removal in accordance with Federal, State, and local regulatory requirements prior to demolition. Transportation and disposal of the materials would be conducted in accordance with Federal and State waste disposal and transportation regulations. Dust from removal of ACM and lead based paint would also be controlled by performing the work under full containment and the effectiveness of the containment and other dust mitigation measures would be monitored in accordance with BAAQMD Dust Control measures. This is considered a potentially significant impact; however, with implementation of Mitigation Measure HAZ-1, potential impacts associated with hazardous building materials would be less than significant.
Buildout of the 2012 FMP will include grading and excavation, and potentially off-haul of soil during each development phase. A Phase I Environmental Site Assessment (ESA) in accordance with ASTM International and California Department of Toxic Substances Control (DTSC) regulations and standards will be necessary to identify the presence or likely presence of hazardous substances or materials based on historical or current site use. With implementation of Mitigation Measure HAZ-2, the potential impacts associated with potentially hazardous waste soil would be less than significant.
Draft – September 2017
Chabot College 2012 Facilities Master Plan Initial Study – 41
During Facilities Operations Limited quantities of hazardous materials may be used and stored in the new Biology Building (B2100), new Science Facility (B2000), the addition to the Maintenance & Operations Warehouse Building (B3000) and new Garage Annex for Automotive Area (Building 3400). Potential hazardous materials storage would be limited to quantities allowed by the California Fire Code (State of California). The potential for Project-related emissions of hazardous materials is considered less than significant.
b) Would the project create a significant hazard to the public or the environment through reasonably foreseeable upset and accident conditions involving the release of hazardous materials into the environment?
Project operations would not create significant hazards to the public or environment.
c) Would the project emit hazardous emissions or handle hazardous or acutely hazardous materials, substances, or waste within one-quarter mile of an existing or proposed school?
There are two schools located within one-quarter mile of the Chabot College campus: Anthony W. Ochoa Middle School is located adjacent to the southwestern campus boundary; and Eden Garden Elementary School is located about 0.07 mile south of the campus. The proposed Project would not emit hazardous emissions. Limited quantities of hazardous materials may be used and stored on the campus, but this does not represent a significant hazardous condition for nearby schools. See Subsection 8a above.
d) Would the project be located on a site which is included on a list of hazardous materials sites compiled pursuant to Government Code Section 65962.5 and, as a result, would it create a significant hazard to the public or the environment?
The Project site is not included on the DTSC’s site cleanup list (as per Government Code Section 65962.5 (Department of Toxic Substance Control 2017)).
e) Would the project be located within an airport land use plan or, where such a plan has not been adopted, within two miles of a public airport or public use airport, would the project result in a safety hazard for people residing or working in the project area?
The nearest airport is the Hayward Executive Airport located about 0.60 mile northwest of the College. The Hayward Executive Airport Land Use Compatibility Plan does not identify the Chabot College campus as within a safety hazard area (Alameda County 2012). Potential safety hazard impacts are less than significant.
f) Would the project be within the vicinity of a private airstrip, would the project result in a safety hazard for people residing or working in the project area?
There are no private airstrips located within two miles of the Chabot College campus.
Draft – September 2017
Chabot College 2012 Facilities Master Plan Initial Study – 42
g) Would the project impair implementation of or physically interfere with an adopted emergency response plan or emergency evacuation plan?
The Chabot College Emergency Preparedness Plan (Chabot Las Positas Community College District) will be updated to incorporate the 2012 FMP.
h) Would the project expose people or structures to a significant risk of loss, injury or death involving wildland fires, including where wildlands are adjacent to urbanized areas or where residences are intermixed with wildlands?
According to the Association of Bay Area Governments Wildland-Urban Interface Threat Map, the campus is not located within a Wildland Urban Interface Fire Threat Zone (Association of Bay Area Governments).
Mitigation Measures
HAZ-1 Prior to the demolition of the seven buildings and renovation of the two buildings identified in the 2012 FMP, a Hazardous Materials Building Survey shall be prepared for each building. The Hazardous Materials Building Survey shall include identification of suspect asbestos-containing building materials, lead-containing building materials, loose & peeling lead containing paint, mercury light tubes, mercury thermostat switches, and polychlorinated biphenyl (PCB)-light ballasts, and PCB-containing building materials that may be impacted during the demolition of the five buildings. If the inspection confirms the presence of asbestos-contain materials (ACMs) or other hazardous building materials in any of the building, the hazardous materials shall be removed from these buildings prior to demolition and be transported in compliance with State and federal requirements.
HAZ-2 Prior to the initiation of grading and excavation activities, a Phase I Environmental SA. The Phase I ESA Report for the subject property shall be prepared in accordance with the American Society for Testing and Materials Standard Practice for Environmental Site Assessments: Phase I Site Assessment Process E 1527-13 and the United States Environmental Protection Agency (US EPA) 40 CFR Part 312 Standards and Practices for All Appropriate Inquiries (AAI) – Final Rule adopted November 1, 2006 and amended December 30, 2013.
References Alameda County. 2012. Livermore Municipal Airport Land Use Compatibility Plan. Available on the Alameda
County website at: www.acgov.org/cda/planning/generalplans/airportlandplans/htm.
Association of Bay Area Governments. www.gis.abag.ca.gov/website/Hazards/?hlyr=wuo.
State of California. California Building Code, Part 9 California Fire Code, Chapter 50, Hazardous Materials, General Provisions. Available on the State of California website at: www.codes.iccsafe.org/app/book/toc2016/California/Fire/index.html
California Department of Toxic Substance Control. 2017. DTSC’s Hazardous Waste and Substances Site List (Cortese List). www.dtsc.ca.gov/SiteCleanup/Cortese_List.cfm.
Chabot Las Positas Community College District. Emergency Preparedness Plan. Available on the District website at: www.clpccd.cc.ca.us/emerinfo/default.php.
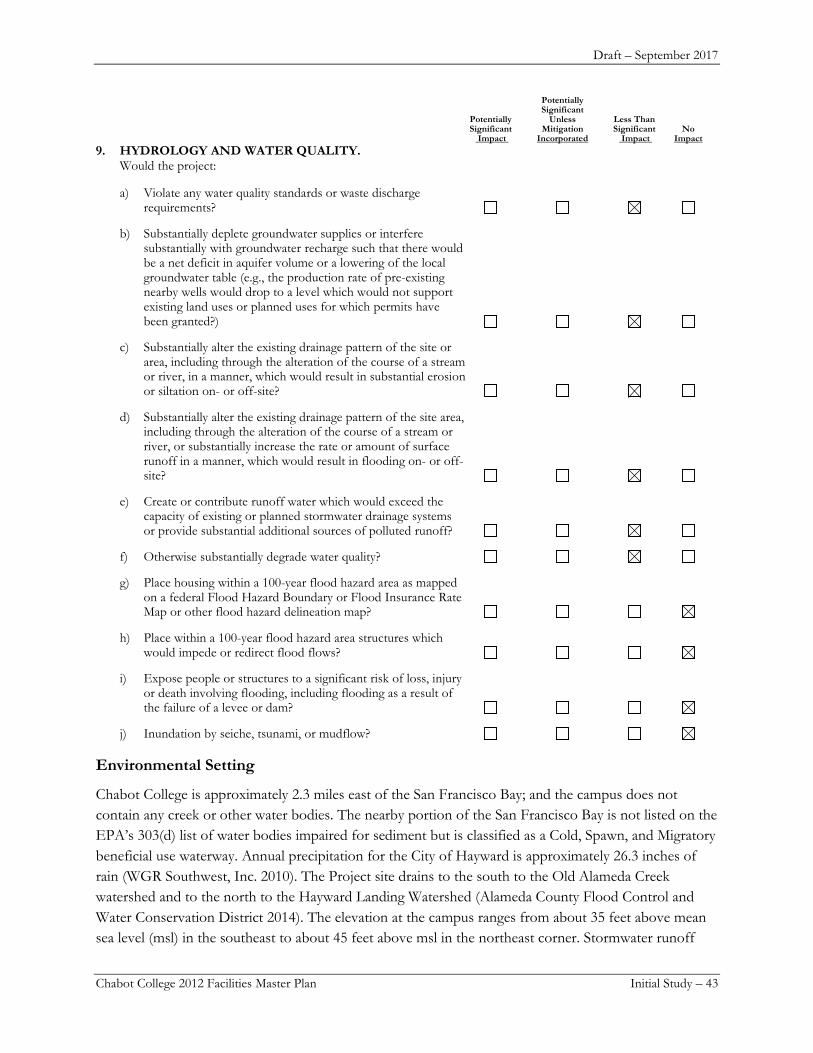
Draft – September 2017
Chabot College 2012 Facilities Master Plan Initial Study – 43
Potentially Significant Potentially Unless Less Than Significant Mitigation Significant No Impact Incorporated Impact Impact 9. HYDROLOGY AND WATER QUALITY.
Would the project:
a) Violate any water quality standards or waste discharge requirements?
b) Substantially deplete groundwater supplies or interfere substantially with groundwater recharge such that there would be a net deficit in aquifer volume or a lowering of the local groundwater table (e.g., the production rate of pre-existing nearby wells would drop to a level which would not support existing land uses or planned uses for which permits have been granted?)
c) Substantially alter the existing drainage pattern of the site or area, including through the alteration of the course of a stream or river, in a manner, which would result in substantial erosion or siltation on- or off-site?
d) Substantially alter the existing drainage pattern of the site area, including through the alteration of the course of a stream or river, or substantially increase the rate or amount of surface runoff in a manner, which would result in flooding on- or off-site?
e) Create or contribute runoff water which would exceed the capacity of existing or planned stormwater drainage systems or provide substantial additional sources of polluted runoff?
f) Otherwise substantially degrade water quality?
g) Place housing within a 100-year flood hazard area as mapped on a federal Flood Hazard Boundary or Flood Insurance Rate Map or other flood hazard delineation map?
h) Place within a 100-year flood hazard area structures which would impede or redirect flood flows?
i) Expose people or structures to a significant risk of loss, injury or death involving flooding, including flooding as a result of the failure of a levee or dam?
j) Inundation by seiche, tsunami, or mudflow?
Environmental Setting
Chabot College is approximately 2.3 miles east of the San Francisco Bay; and the campus does not contain any creek or other water bodies. The nearby portion of the San Francisco Bay is not listed on the EPA’s 303(d) list of water bodies impaired for sediment but is classified as a Cold, Spawn, and Migratory beneficial use waterway. Annual precipitation for the City of Hayward is approximately 26.3 inches of rain (WGR Southwest, Inc. 2010). The Project site drains to the south to the Old Alameda Creek watershed and to the north to the Hayward Landing Watershed (Alameda County Flood Control and Water Conservation District 2014). The elevation at the campus ranges from about 35 feet above mean sea level (msl) in the southeast to about 45 feet above msl in the northeast corner. Stormwater runoff
Draft – September 2017
Chabot College 2012 Facilities Master Plan Initial Study – 44
from the relatively flat site is collected in four storm drainages areas that discharge to either Depot Road or West Street and are transported in storm drains or concrete channels to the Bay. Approximately 65 percent of the campus is covered in impervious surfaces, such as buildings, roads, parking lots, tennis courts, courtyards, and a swimming pool. Remaining pervious areas are recreational fields and landscaped areas (Sandis 2016).
The Chabot College campus is located within the East Bay Plain Groundwater Basin, and more specifically the Niles Cone Groundwater Basin, as recognized by the California Department of Water Resources (CDWR 2016a). Groundwater use is limited in the East Bay Plain by several factors, including readily available high quality imported surface water, existing high salts in shallow bay margin groundwater, the potential for saltwater intrusion from the San Francisco Bay, and contamination in shallow aquifers. According to a 2015 report on groundwater conditions, the aquifer is not overdrawn and no saltwater entered the basin in the previous year (Alameda County Water District 2016).
Regulatory Setting
As part of Section 402 of the Clean Water Act (CWA), the U.S. EPA established regulations under the National Pollution Discharge Elimination System (NPDES) storm water program to control storm water discharges, including those associated with construction activities as well as on-going operation of facilities. The State Water Resource Control Board (SWRCB) implements the NPDES program in California.
The State NPDES storm water permitting program regulates storm water quality from construction sites. Dischargers whose projects disturb one or more acres of soil or whose projects disturb less than one acre but are part of a larger common plan of development that in total disturbs one or more acres, are required to obtain coverage under the State Construction General Permit (CGP) for Discharges of Storm Water Associated with Construction Activity (CGP Order 2009-0009-DWQ amended by 2010-0014-DWQ and 2012-0006-DWQ The CGP requires the development and implementation of a Storm Water Pollution Prevention Plan (SWPPP), which requires the use of appropriate best management practices (BMPs) for erosion control (e.g., gravel bags, silt fence, straw wattle, sediment basin, and soil stabilizers), spill prevention during construction (e.g., concrete waste management, material waste management, and good housekeeping practices), and permanent post-construction storm water management measures following construction. Site inspections with visual and chemical monitoring of pollutants and BMP maintenance are required, with penalties for non-compliance.
The CWA Section 402 also requires permits for municipal storm water discharges, which are regulated under the NPDES General Permit for Municipal Separate Storm Sewer Systems (MS4s). Regulated MS4s are required to reduce the discharge of pollutants from its MS4 to the maximum extent practicable (MEP) and to meet the water quality requirements of the Clean Water Act. EPA refers to these requirements collectively as “the MS4 permit standard.” MS4 permits generally implement this standard through requirements to develop and implement storm water management programs (SWMPs) which include the following types of controls: public education and outreach, public participation and involvement, illicit
Draft – September 2017
Chabot College 2012 Facilities Master Plan Initial Study – 45
discharge detection and elimination, construction site runoff control, post-construction runoff control, pollution prevention and good housekeeping. The permit may also include water quality-related requirements to address issues such as Total Maximum Daily Loads (TMDLs) and protecting designated uses such as swimming.
Under Phase I3 of the NPDES program the Regional Water Quality Control Board (RWQCB) for the San Francisco Bay Region governs municipal storm drain systems (Order No. R2-2105-0049), including the storm drains in the City of Hayward. This permit defines requirements for new development and redevelopment in Section C.3 of the Municipal Regional Permit (MRP). The MRP requires post-construction controls to protect water quality for projects creating or replacing 10,000 square feet of impervious surface, or 5,000 square feet for projects, such as auto service facilities, with higher pollutant loads. Controls include treatment controls, source controls, site design, and hydromodification management. Treatment controls remove pollutants from storm water before it reaches the public storm water drains or creeks. The measures may include bio-retention areas, vegetated swales, harvesting and reuse, infiltration trenches, and evapotranspiration. Additional requirements for low impact development (LID) went into effect December 1, 2011. Source controls, such as enclosed trash areas and covered car wash areas that are connected to the sanitary sewer system keep pollution away from storm water drains. Site design features may include reducing impervious areas, increasing landscaped areas between impervious areas to treat storm water. Hydromodification management ensures that after development is completed operational runoff flow durations (volume and rate) match those of pre-project runoff (Alameda Countywide Clean Water Program 2011).
Community college districts were listed as small non-traditional MS4s under the 2003 Phase II4 General Permit (WQO No. 2003 – 0005 – DWQ, Attachment 3). However, the permit was revised, effective July 1, 2013 (WQO No. 2013-0001 DWQ), and the list of non-traditional small MS4s no longer includes community college districts (Section XVII). The General Permit states that Regional Water Boards may continue to make case by case determinations of designation during the permit term by notification to the discharger and public review and comment. Although the District is not required to use the treatment controls, such as LID, which are included in the Phase II permit and C.3 of the MRP, these are successful methods to reduce stormwater runoff and improve water quality, and the District may use these techniques as described in the 2012 FMP and Chabot College Design Guidelines (Chabot Las Positas Community College District 2007). It is noted that bio-retention basins and flow-through planters that meet storm water quality requirements have already been installed on the Chabot College campus.
The District has not adopted a comprehensive SWMP for the entire Chabot College campus, but has applied the MRP requirements with the buildout of the 2006 FMP on a project-by-project basis or for several projects at a time. The District evaluates how BMPs will address storm water quality and runoff volume in an efficient manner and projects may share a BMP, such as expanding a bio-retention basin
3 Phase I regulations were promulgated in 1990 to permit discharges from industrial sites (including construction sites that
disturb five or more acres) and MS4s serving a population of 100,000 people or more. 4 Phase II regulations were promulgated in 1999 to require permits for storm water discharges from Small MS4s and from
construction sites disturbing between one and five acres of land.
Draft – September 2017
Chabot College 2012 Facilities Master Plan Initial Study – 46
(Michael Kuykendall 2016 and 2017. The Chabot College campus already has installed bio-retention facilities and flow-through planters that meet storm water quality requirements. The 2012 FMP proposes storm water mitigation measures to meet C.3 requirements for master plan buildout. These measures include bio-retention facilities, green roof, flow-through planters, and pervious pavement (Sandis 2012).
While the Phase II General Permit does not apply to community colleges, the CGP does apply and includes post-construction standards for dischargers, such as community colleges, which are not covered under a MS4 permit (Fred Hetzel 2016; Christine Boschen 2017). These standards require the use of non-structural controls (e.g., porous pavement, vegetated swales, green roof, tree planting, rain barrels and cisterns) rather than structural controls (e.g., storm drain pipes, weirs, channel control structures) to the extent feasible to “replicate the pre-project water balance” (volume of runoff from rainfall). Dischargers should also implement BMPs to reduce pollutants in storm water after the completion of construction.
The Chabot College Design Guidelines (Chabot Las Positas Community College District 2007) were created to provide a framework for current and future development that recognizes the needs of a growing campus.
The guidelines recommend that all future development be designed sustainably in accordance with green building practices. In accordance with sustainability principles, the design guidelines include measures to address stormwater management, paving, and grading and drainage, as summarized below:
• Where possible, include bioswale at parking lot perimeter as part of overall perimeter planting scheme.
• Where possible, existing parking lots on the Chabot campus shall be redesigned to incorporate bioswales to capture and treat run-off on-site wherever possible. These swales should run in between rows of parked cars and be planted with species specifically chosen for their water filtration abilities.
• If feasible, existing lots should be repaved with permeable surfaces to reduce stormwater run-off.
• Impervious surface shall be kept to a minimum, with planting areas breaking up large spans of impervious paving wherever possible.
• Grading plan to allow for drainage into infiltration and retention areas, as indicated in Technical Section 7.0.
• For parking lot projects, LEED standards state, “Use an open-grid pavement system (less than 50 percent impervious) for a minimum of 50 percent of the lot area,” in order to earn Credit 7.1.5
• Evaluate use of permeable paving with geotechnical engineer to develop solutions for stormwater management and pavement use.
5 Credit 7.1 references U.S Green Building Council’s Leadership in Energy and Design (LEED) standards to reduce heat islands
to minimize impacts on microclimates and human and wildlife habitats. One option is to have an open grid pavement system. Projects pursuing LEED certification earn points, or credits, across several areas that address sustainability issues. Based on the number of points achieved, a project receives one of four LEED rating levels: Certified, Silver, Gold and Platinum (U.S. Green Building Council 2017).
Draft – September 2017
Chabot College 2012 Facilities Master Plan Initial Study – 47
• Drain surface runoff from vehicular paving into bioswales and biobasins. Incorporate stormwater detention in drainage systems.
• Slope bioswales and detention basins at one to two percent and include subsurface drainage.
• There should be no residual standing water for more than 48 hours in bioswales, in order to prevent the formation of mosquito larvae.
• Contractor shall provide Storm Water Pollution Prevention Program (including erosion control plans) for all projects.
• Avoid rainwater leaders and roof drains from daylighting directly onto walks, paving, or drainage inlets. Water should go into storm drains, planting areas or bioswaless/biobasins, while implementing necessary erosion control.
• Planting areas should self drain and and/or have sub-surface drainage.
• Use deeply rooted plant materials on slopes for erosion control and drought tolerance.
• Drain surface runoff from vehicular paving into bioswales and biobasins. Incorporate storm water detention in drainage systems.
• Consider water features that utilize rain or runoff to display, direct, and celebrate water. Water features should be non-treated and non-mechanically dependent.
• Provide engineered base of rock or gravel for synthetic turf fields.
• The civil engineer shall provide sub-surface drainage and hydraulic calculations.
2012 FMP projects at the Chabot College campus will be developed consistent with the applicable design guidelines.
Impact Discussion
Buildout of the 2012 FMP would not result in potential violations of water quality standards or waste discharge requirements. Project construction activities could result in temporary water quality impacts associated with soil erosion and chemicals (gasoline, diesel fuel, solvents, etc.), but with required compliance with the CGP for each construction project that disturbs over one acre and development and implementation of a SWPPP impacts from construction would be less than significant. The CGP also addresses post-construction storm water impacts and the 2012 FMP includes stormwater BMPs, including bioretention facilities, green roof, flow-through planters, and pervious pavements. Buildout of the 2012 FMP would result in a net decrease in impervious surfaces, which would result in a potential decrease in runoff. The proposed Project would not adversely affect existing drainage patterns on or off campus. 2012 FMP buildout would not generate a significant increase in water demand that could not be served by existing water facilities, or require the use of groundwater, and bioretention/infiltration areas identified in the 2012 FMP, as well as measures described in the Chabot College Design Guidelines, would capture storm water runoff associated with master plan buildout and would replenish local groundwater supplies. A brief discussion of each environmental issue included under Section 9 is presented below.
Draft – September 2017
Chabot College 2012 Facilities Master Plan Initial Study – 48
a) Would the project violate any water quality standards or waste discharge requirements?
Buildout of the 2012 FMP is not anticipated to violate any water quality standards or waste discharge requirements. Development of the Project would require disturbance of approximately 3.5 acres (four percent) of the land area in Phase 1 and another 14 acres (16 percent) with completion of Phases 2, 3, and 4, and, therefore, would be subject to the requirements of the CGP. The Project includes demolition and renovation of existing campus buildings as well as construction of new buildings. Demolition and construction activities would include the use of gasoline and diesel-powered heavy equipment, such as bulldozers, excavators, dump trucks, backhoes, pick-up trucks and air compressors. Chemicals such as gasoline, diesel fuel, lubricating oil, hydraulic oil, lubricating grease, automatic transmission fluid, paints, solvents, glues, and other substances could be utilized during construction. An accidental release of any of these substances could degrade the water quality of surface water runoff from the site and add pollution into local waterways. On-site portable toilets could leak or tip over and spill, releasing sanitary waste, bacteria, solids, nutrients, and pathogens. During construction there would be a potential for surface water to carry sediment from on-site erosion and small quantities of pollutants into the City of Hayward storm water system and, ultimately, San Francisco Bay, which is approximately 2.3 miles west of the Chabot College campus. Soil erosion may occur along project boundaries during construction in areas where temporary soil storage may be required. Small quantities of pollutants may enter the storm drainage system, potentially degrading water quality. The District or its contractors will prepare a SWPPP to address accidental releases of chemicals and other pollutants, therefore Project construction activities for each development phase would be less than significant.
Each 2012 FMP development phase (Phases 1-4) would result in an area of disturbance greater than one acre, therefore, the District or its contractors would be required to file a Notice of Intent with the RWQCB indicating compliance with the CGP or develop a SWPPP. Because the Project would be required to comply with the CGP and would develop SWPPPs prior to ground disturbance, the Project impact from construction-related activities on water quality would be less than significant.
Buildout of the 2012 FMP would result in a two-acre decrease in the impervious surface area at the campus from approximately 60 acres to 58 acres, or a decrease of about three percent (Sandis 2016). Therefore, peak runoff flows, volumes, and durations would be similar to or slightly less than existing conditions. The 2012 FMP proposes storm water mitigation measures to meet C.3 requirements for 2012 FMP buildout. These measures include bio-retention facilities, green roof, flow-through planters, and pervious pavement (Sandis 2012). In addition, the campus design would adhere to the Chabot College Design Guidelines which include a variety of measures to reduce stormwater, such as including keeping impervious surfaces to a minimum and draining to bioswales and biobasins, as listed above in the Regulatory Setting. Therefore, there would be no significant impact related to waste discharge requirements.
Phase 4 would include improvements to the three-acre existing baseball field located in the northwestern corner of the campus. The existing turf would be removed and replaced with new turf, which would most likely be artificial turf. Standard design for artificial turf is permeable and runoff is collected for transfer to drain outlets and ultimately the storm drain system. The artificial turf is totally porous and
Draft – September 2017
Chabot College 2012 Facilities Master Plan Initial Study – 49
would not increase runoff from the baseball field (SCVWD 2010). With artificial turf fertilizers, herbicides, and pesticides would not be used. However, there are other water quality concerns associated with leachates from artificial turf. Water quality impacts of synthetic turf fields have been evaluated in a number of studies, including a detailed study in the Bay Area by the Santa Clara Valley Water District in June 2010 (SCVWD 2010). The study identified zinc as the only pollutant of concern from the artificial turfs to be detected at significant concentrations. Lowering the pH levels was shown to reduce zinc leachate by about 40 percent. Rock materials underlying artificial turf fields also lowered the zinc in runoff on receiving water ecosystems.
Another study concluded there is a potential risk to surface water and aquatic organisms associated with zinc toxicity of storm water runoff from artificial turf fields (Connecticut Department of Environmental Protection (DEP) 2010). Zinc concentrations in the storm water may cause exceedances of the acute aquatic toxicity criteria for receiving surface water. However, zinc concentrations in runoff from turf fields were similar to that which is found in urban runoff (e.g., higher than residential and open space, but lower than commercial and industrial) and no metal concentrations exceeded Environmental Protection Agency’s or DEP’s drinking water standards. There was no significant risk to groundwater protection criteria in the storm water runoff from artificial turf fields.
Based on the conclusions of the studies discussed above, the installation of artificial turf on the baseball field would not result in significant water quality impacts.
b) Would the project substantially deplete groundwater supplies or interfere substantially with groundwater recharge such that there would be a net deficit in aquifer volume or a lowering of the local groundwater table (e.g., the production rate of pre-existing nearby wells would drop to a level which would not support existing land uses or planned uses for which permits have been granted?)
2012 FMP buildout would not substantially deplete groundwater supplies or interfere substantially with groundwater recharge that would result in a net deficit in aquifer volume or a lowering of the local groundwater table. Groundwater has been observed at 12 to 16 feet below ground surface at the campus (Chabot-Las Positas Community College District 2015a). Construction activities may temporarily affect groundwater levels if dewatering is necessary. Any groundwater impact would be temporary and minor, and is considered less than significant.
With buildout of the 2012 FMP, there would be a three percent decrease in impervious surfaces at the campus. The resulting increase in pervious surfaces could result in a slight increase in recharge to groundwater. Additionally, recommended bioretention/infiltration areas identified in the 2012 FMP would capture storm water runoff associated with master plan buildout and would replenish local groundwater supplies. Compliance with the CGP and implementation and monitoring of BMPs (such as measures to manage chemicals and waste during construction, routine maintenance of equipment to prevent leaks, and cleanup of spills on dirt areas by digging up and properly disposing of affected soil) would protect groundwater. Therefore, Project-related impacts on groundwater supplies would be less than significant.
Draft – September 2017
Chabot College 2012 Facilities Master Plan Initial Study – 50
Potable water at the Chabot College campus is served with water by the City of Hayward. The water comes from the Hetch Hetchy Regional Water System, which is managed by the San Francisco Public Utilities Commission (City of Hayward 2016). Irrigation water comes from an on-site well (Chabot-Las Positas Community College District 2015b). Project buildout would not generate a significant increase in water demand that could not be served by existing water facilities, or effect the use of groundwater for irrigation.
c) Would the project substantially alter the existing drainage pattern of the site or area, including through the alteration of the course of a stream or river, in a manner, which would result in substantial erosion or siltation on- or off-site?
The proposed Project would not substantially alter existing drainage patterns on or off-site but could result in erosion or siltation off-site due to construction activities. The Project site drains to the south to the Old Alameda Creek watershed and to the north to the Hayward Landing Watershed (Alameda County Flood Control and Water Conservation District 2014). Chabot College is approximately 2.3 miles east of the San Francisco Bay; and the campus does not contain any creek or other water bodies. Stormwater runoff from the relatively flat campus is collected in four storm drainages areas that discharge to either Depot Road or West Street and are transported in storm drains or concrete channels to the Bay. No drainage problems with regard to flooding or backages within the storm drain system have been reported. During annual maintenance, debris is removed from inlets and structures (Sandis 2012).
Project construction would entail demolition of buildings and pavement, re-grading and associated earthwork, including minor excavation, and construction of new buildings and pavement. This could temporarily affect the quality of runoff and result in potential pollution of the San Francisco Bay. Standard erosion control measures would be included in site grading and construction activities as specified in the SWPPP that will be prepared for the Project. Temporary impacts to the San Francisco Bay (soil erosion, siltation/sedimentation) associated with construction activities would be less-than-significant.
Buildout of the 2012 FMP would result in modifications to the existing site surface and result in minor changes to on-site drainage patterns. There are no water courses on the campus and the Project would not result in the alteration of the course of a stream or river. Therefore, significant adverse alterations to existing drainage patterns in the surrounding area are not expected.
d) Would the project substantially alter the existing drainage pattern of the site area, including through the alteration of the course of a stream or river, or substantially increase the rate or amount of surface runoff in a manner, which would result in flooding on- or off-site?
Project development would result in minor alterations to existing on-site drainage patterns through proposed grading and drainage improvements (see Subsections 9a and 9c above) and would not result in an increase in surface runoff. The campus is relatively flat and most of the area proposed to be developed would be within areas already occupied by buildings or paved areas. All of the storm water
Draft – September 2017
Chabot College 2012 Facilities Master Plan Initial Study – 51
runoff would be retained in bioretention/infiltration areas on-site (Sandis 2012). Because the Project would not increase runoff and because the bioretention/infiltration areas would be included in Project design, runoff that may have previously entered storm drains would be retained on-site, and no flooding is expected on- or off-site. No streams or rivers would be altered. Impacts would be less than significant and no mitigation is required.
e) Would the project create or contribute runoff water which would exceed the capacity of existing or planned stormwater drainage systems or provide substantial additional sources of polluted runoff?
The proposed Project would not result in an increase in off-site storm water runoff. Project construction would result in minor alterations to existing drainage patterns due to grading. The quality of campus runoff may be temporarily affected by site construction activities. The long-term rate and volume of surface water runoff at the campus would remain the same and may be decreased by the Project due to the decrease in impervious surfaces and proposed bioretention/infiltration areas (see above discussion under Subsection 9a and 9d). No additional storm drains are needed on-site or off-site.
Construction-Period Impacts. Project grading and excavation would temporarily disturb surface soils. Vegetation may be removed. During the construction period, grading and excavation activities would result in exposure of soil to runoff, potentially causing erosion and entrainment of sediment in the runoff. Soil stockpiles and excavated areas on the campus would be exposed to runoff and, if not managed properly, the runoff could cause erosion and increased sedimentation in water courses away from the campus. The accumulation of sediment could result in blockage of flows, potentially resulting in increased localized ponding or flooding. There is the potential for chemical releases during construction activity. Once released, substances such as fuels, oils, paints, and solvents could be transported to nearby surface waterways and/or groundwater in storm water runoff, wash water, and dust control water, potentially reducing the quality of the receiving waters, which is considered a potentially significant impact. Compliance with the CGP and development and implementation of a SWPPP would address construction-period impacts, and therefore, water quality impacts would be less than significant.
Post-Construction Operation-Period Impacts. Buildout of the 2012 FMP would result in a decrease in impervious surfaces of approximately two acres. The existing bioretention/infiltration areas would slow and filter runoff flows. Peak runoff flows, volumes, and durations would be similar to or slightly less than existing conditions. Any need for additional means to slow and filter runoff would be assessed on a project-by-project or multi-project basis, such as those described in the 2012 FMP. The Project would not adversely affect capacity in the municipal storm drain system. Therefore, there would be no impact from operation of the proposed Project on the capacity of storm drains and there would be no additional polluted runoff.
Draft – September 2017
Chabot College 2012 Facilities Master Plan Initial Study – 52
f) Would the project otherwise substantially degrade water quality?
As discussed in Subsections 9a, 9c and 9e, the overall water quality of the local receiving waters could be adversely affected during Project construction activities. Impacts would be less than significant.
g) Would the project place housing within a 100-year flood hazard area as mapped on a federal Flood Hazard Boundary or Flood Insurance Rate Map or other flood hazard delineation map?
There is no housing proposed on the Chabot College campus.
h) Would the project place within a 100-year flood hazard area structures which would impede or redirect flood flows?
The Federal Emergency Management Agency (FEMA) administers the National Flood Insurance Program (NFIP) to provide flood insurance to communities complying with FEMA regulations that limit development in floodplains. FEMA issues flood insurance rate maps for communities participating in the NFIP. These maps delineate flood hazard zones for each project site. Executive Order 11988 (Floodplain Management) addresses floodplain issues related to public safety, conservation, and economics. It requires:
• Avoidance of incompatible floodplain development;
• Consistency with the standards and criteria of the NFIP; and
• Restoration and preservation of natural and beneficial floodplain values.
The Chabot College campus is located outside any designated flood zone, and approximately 500 feet east of a small area of Zone X on the FEMA Flood Insurance Rate Map (FIRM), which is outside the 0.2 percent annual chance of flood (FEMA 2009). The closest 100-year flood zone is Zone AE bordering Line A, Zone 4, which connects to the aforementioned Zone X and is approximately 1,250 feet to the east of the campus (FEMA 2009). Buildout of the 2012 FMP would not place buildings in the 100-year flood area or adversely affect nearby flood areas.
i) Would the project expose people or structures to a significant risk of loss, injury or death involving flooding, including flooding as a result of the failure of a levee or dam?
The Project would not expose people or structures to a significant risk due to flooding. Chabot College is located in the City of Hayward, which is along the shoreline of the San Francisco Bay, and is susceptible to flooding. Causes of flooding include overflowing of streams, rain, tides, sea level rise, settlement, and sedimentation. There are no streams on the campus or nearby. The Chabot College campus is approximately 1.2 miles east of the San Francisco Bay shoreline that is projected to be inundated in a sea level rise of six feet above average high tides, which is the maximum level shown on National Oceanic and Atmospheric Administration maps (National Oceanic and Atmospheric Administration 2016). Therefore, the site is not expected to be flooded due to sea level rise.
Draft – September 2017
Chabot College 2012 Facilities Master Plan Initial Study – 53
The floodplains for the Calaveras and Del Valle dams are located approximately 2.6 miles south- southeast of the campus (Chabot-Las Positas Community College District 2015a), and therefore, the campus would not be flooded due to failure of a levee or dam.
j) Would the project expose the site to inundation by seiche, tsunami, or mudflow?
The Chabot College campus would not be exposed to inundation by seiche, tsunami or mudflow. A seiche is a standing-wave oscillation of the surface of water in an enclosed or semi-enclosed basin (such as a lake, bay, or harbor) that is initiated by landslides, earthquakes, or other geologic phenomena, and continues after cessation of the originating force. Seiches do not pose an appreciable risk because the Project site is not close to any major surface water bodies, except for the San Francisco Bay, and inundation risk is described below for tsunami.
A tsunami is a sea wave produced by any large scale, short duration disruption of the ocean floor, principally by a shallow submarine earthquake, but also by submarine earth movement, subsidence, or volcanic eruption. The campus is 1.3 miles east of the area defined by the Association of Bay Area Governments (ABAG) as a tsunami inundation area for emergency planning (ABAG 2016). This area is associated with the southern portion of the San Francisco Bay, and is approximately 24 miles from the Golden Gate Bridge and connection with the Pacific Ocean. At a surface elevation of approximately 35 to 45 feet above mean sea level, attenuation would significantly reduce the height of a tsunami at the Golden Gate Bridge. Therefore, it is unlikely that the campus would be inundated by a tsunami.
The terrain immediately around the campus is generally flat. Thus, there is low risk of landslide or mudflow impacting the campus. The risk of inundation by seiche, tsunami or mudflow is insignificant because the campus is not within an inundation area and is not susceptible to hazards associated with hillside sites. The risk of seiche, tsunami or mudflow at the Chabot College campus is considered nil.
Mitigation Measures
None required.
References Alameda County Flood Control and Water Conservation District. 2014. Old Alameda Creek Watershed and
Bockman Canal, Sulphur Creek, and Hayward Landing Watersheds, http://www.acfloodcontrol.org/resources/explore-watersheds. Website accessed on December 16, 2016.
Alameda County Water District. 2016. Survey Report on Groundwater Conditions. February 2016.
Association of Bay Area Governments (ABAG) 2016. Bay Area Dam Failure Inundation Maps from ABAG. http://resilience.abag.ca.gov/floods/. Website accessed December 12, 2016.
Christine Boschen. 2017. Senior Environmental Scientist, Program Manager, Stormwater (Industrial and Construction), Recycled Water, and Waste Discharge to Land, San Francisco Bay Regional Water Quality Control Board. 2017. Personal Communication, January 20, 2016.
Draft – September 2017
Chabot College 2012 Facilities Master Plan Initial Study – 54
California Department of Water Resources. 2016a. https://gis.water.ca.gov/app/bbat/ Website accessed on December 10, 2016.
California Department of Water Resources. 2006. California’s Groundwater, Bulletin 118, San Francisco Bay Hydrologic Region, Santa Clara Valley Groundwater Basin, East Bay Plain Subbasin. http://www.water.ca.gov/groundwater. Website accessed on December 10, 2016.
Chabot Las Positas Community College District. 2007. Chabot College Design Guidelines. Prepared by Royston Hanamoto Alley & Abey Carduccci & Associates, Inc. August 3, 2007.
Chabot-Las Positas Community College District. 2015a. Geotechnical Engineering and Design Report, Biology Building, Chabot College, Hayward, California. Prepared by Terraphase Engineering, Inc., September 17, 2015.
Chabot-Las Positas Community College District. 2015b. District Water Usage Survey. Prepared by Cord Ozmont, Grounds Supervisor. April 13, 2015.
City of Hayward. 2016. http://www.hayward-ca.gov/your-environment/green-your-community/water-supply. Website accessed December 16, 2016.
Connecticut Department of Environmental Protection. July 2010 (CDEP 2010). Artificial Turf Study, Leachate and Stormwater Characteristics.
Federal Emergency Management Agency (FEMA). 2009. National Flood Insurance Program. Flood Insurance Rate Map, Alameda County, California and incorporated areas. Community-Panel Number 06001C0288G. August 3.
Fred Hetzel, Environmental Scientist, San Francisco Bay Regional Water Quality Control Board. 2017. Personal Communication, January 10, 2016.
Michael Kuykendall, PE, LEED AP, QSD/P, Project Manager/Associate Principal, Sandis. 2016 and 2017. Emails regarding storm water. December 21, 2016 and January 17, 2017.
NOAA 2016. https://coast.noaa.gov/slr/ Website accessed on December 20, 2016.
Sandis. 2012. Utility and Site Study. May 15, 2012.
Sandis. 2016. Michael Kuykendall, PE, LEED AP, QSD/P, Project Manager/Associate Principal. Chabot College, Table of Pervious and Impervious Areas for 2012 Conditions and 2012 FMP Buildout.
Santa Clara Valley Water District. 2010. Pilot and Laboratory Studies for the Assessment of Water Quality Impacts of Artificial Turf. Prepared By Hefa Cheng and Martin Reinhard, Department of Civil and Environmental Engineering, Stanford University. June 2010.
San Francisco Bay Regional Water Quality Control Board, Groundwater Committee. 2016 East Bay Plain Groundwater Basin Beneficial Use Evaluation Report. December 10, 2016.
WGR Southwest, Inc. 2010. Construction Storm Water Pollution Prevention Plan for Industrial Technology Center, Buildings 1400/1600 Renovation, Chabot College, Hayward, CA. November 5, 2010.
Draft – September 2017
Chabot College 2012 Facilities Master Plan Initial Study – 55
Potentially Significant Potentially Unless Less Than Significant Mitigation Significant No Impact Incorporated Impact Impact 10. LAND USE PLANNING. Would the project:
a) Physically divide an established community?
b) Conflict with any applicable land use plan, policy, or regulation of an agency with jurisdiction over the project (including, but not limited to the general plan, specific plan, local coastal program, or zoning ordinance) adopted for the purpose of avoiding or mitigating an environmental effect?
c) Conflict with any applicable habitat conservation plan or natural community conservation plan?
Environmental Setting
The Chabot College campus was established in 1965 and comprises approximately 94 acres. The campus is surrounded by residential lands to the north and south; residential, school and park lands to the west; and residential and commercial lands to the east.
In 2006, the District approved the 2005 Chabot College Facilities Master Plan (2005 FMP). The District completed the improvements identified in the 2005 FMP MP in 2012.
In response to future student enrollment projections and the need to upgrade facilities, the District prepared the 2012 Chabot College Facilities Master Plan (2012 FMP). With the passing of Measure A in June 2016, the District intends to move forward with implementation of the 2012 FMP.
Regulatory Setting
The District is not subject to local land use regulations, therefore the Hayward 2040 General Plan and Hayward Municipal Codes (City of Hayward) do not apply to the 2012 FMP.
The District planning documents for Chabot College listed below identify the District’s commitment to develop the Chabot College campus in a responsible and sustainable manner.
2012 Facilities Master Plan Chabot Las Positas Community College District The 2012 FMP for Chabot College presents a plan for new facilities and renovation of existing facilities within the campus boundaries. The 2012 FMP reflects the need to upgrade existing campus facilities and construct new facilities in response to student enrollment projections to 2034 (Chabot Las Positas Community College District 2012).
Chabot College Climate Action Plan 2010 The Las Positas College Climate Action Plan (CAP) outlines actions designed to move the campus towards carbon neutrality. Mitigation strategies outlined in the CAP cover five major areas: building and energy; transportation; waste and recycling; water; and research, education and community outreach.
Draft – September 2017
Chabot College 2012 Facilities Master Plan Initial Study – 56
Chabot College Design Guidelines 2007 The Chabot College Design Guidelines (Chabot Las Positas Community College District 2007) provide a framework for future development on the campus. The design guidelines were developed based on the following principles: enhance campus identity; improve public image; make the campus an attractive environment; establish landscape theme: campus as park/botanical garden; enhance learning environment; and establish a low maintenance, sustainable campus.
Impact Discussion
The 2012 FMP would not physically divide an established community or conflict with local or regional plans. A brief discussion of each environmental issue included under Section 10 is presented below.
a) Would the project physically divide an established community?
The 2012 FMP addresses improvements to the existing Chabot College campus all of which will occur within the current campus boundaries. Buildout of the 2012 FMP will not divide an established community.
b) Would the project conflict with any applicable land use plan, policy, or regulation of an agency with jurisdiction over the project (including, but not limited to the general plan, specific plan, local coastal program, or zoning ordinance) adopted for the purpose of avoiding or mitigating an environmental effect?
The campus is located in the City of Hayward and is designated in the Hayward 2040 General Plan as a Public/Quasi Public use and is zoned Single Family Residential (City of Hayward).
c) Would the project conflict with any applicable habitat conservation plan or natural community conservation plan?
Buildout of the 2012 FMP would not conflict with any applicable habitat conservation plan or natural community conservation plans.
Mitigation Measures
None required.
References Chabot Las Positas Community College District. 2012. 2012 Facilities Master Plan. Prepared by Steinberg
Architects. July 17, 2012.
Chabot Las Positas Community College District. 2010. Chabot College Climate Action Plan 2010.
Chabot Las Positas Community College District. 2007. Chabot College Design Guidelines. Prepared by Royston Hanamoto Alley & Abey and Carducci & Associates, Inc. August 3, 2007.
City of Hayward. Hayward 2040 General Plan available on the City’s website at: www.hayward2040generalplan.com. Hayward Municipal Code available on the City’s website at: https://www.municode.com/library/ca/hayward/codes/municipal_code.
Draft – September 2017
Chabot College 2012 Facilities Master Plan Initial Study – 57
Potentially Significant Potentially Unless Less Than Significant Mitigation Significant No Impact Incorporated Impact Impact 11. MINERAL RESOURCES. Would the project:
a) Result in the loss of availability of a known mineral resource that would be of value to the region and the residents of the state?
b) Result in the loss of availability of a locally-important mineral resource recovery site delineated on a local general plan, specific plan or other land use plan?
Environmental Setting
The Chabot College campus is not identified in the Hayward 2040 General Plan as containing known mineral resources of value to the region or State (City of Hayward).
Impact Discussion
The Project would not affect mineral resources. A brief discussion of each environmental issue included under Section 11 is presented below.
a) Would the project result in the loss of availability of a known mineral resource that would be of value to the region and the residents of the state?
There are no known mineral resources on the Chabot College campus (City of Hayward).
b) Would the project result in the loss of availability of a locally-important mineral resource recovery site delineated on a local general plan, specific plan or other land use plan?
See Subsection 11a above.
Mitigation Measures
None required.
References City of Hayward. Hayward 2040 General Plan available on the City’s website at: www.hayward2040
generalplan.com.
Draft – September 2017
Chabot College 2012 Facilities Master Plan Initial Study – 58
Potentially Significant Potentially Impact Unless Less Than Significant Mitigation Significant No Impact Incorporated Impact Impact
12. NOISE. Would the project result in:
a) Exposure of persons to or generation of noise levels in excess of standards established in the local general plan, specific plan, noise ordinance or applicable standards of other agencies?
b) Exposure of persons to or generation of excessive groundborne vibration or groundborne noise levels?
c) A substantial permanent increase in ambient noise levels in the project vicinity above levels existing without the project?
d) A substantial temporary or periodic increase in ambient noise levels in the project vicinity above levels existing without the project?
e) For a project located within an airport land use plan or, where such a plan has not been adopted, within two miles of a public airport or public use airport, would the project expose people residing or working in the project area to excessive noise levels?
f) For a project within the vicinity of a private airstrip, would the project expose people residing or working in the project area to excessive noise levels?
Environmental Setting
Sound is created when vibrating objects produce pressure variations that move rapidly outward into the surrounding air. The more powerful the pressure variations, the louder the sound perceived by a listener. The decibel (dB) is the standard measure of loudness relative to the human threshold of perception. Noise is a sound or series of sounds that are intrusive, objectionable or disruptive to daily life. Many factors influence how a sound is perceived and whether it is considered disturbing to a listener; these include the physical characteristics of sound (e.g., loudness, pitch, duration, etc.) and other factors relating to the situation of the listener (e.g., the time of day when it occurs, the acuity of a listener’s hearing, the activity of the listener during exposure, etc.). Environmental noise has many documented undesirable effects on human health and welfare, either psychological (e.g., annoyance and speech interference) or physiological (e.g., hearing impairment and sleep disturbance).
The Chabot College campus was surveyed on a mid-week day (January 17, 2017) to observe influential on-/near-campus noise sources and to measure typical noise levels on campus and off, for the latter at nearby noise-sensitive areas potentially affected by College operation. The survey found that the sources contributing most characteristically to the College’s on-campus ambient noise environment are those associated with the activities of its students, faculty, staff and visitors: conversation of people sitting/walking in campus outdoor spaces, sounds of sports activity in areas close to in-use outdoor athletic facilities, sounds from vehicles/machinery used for grounds-keeping and other maintenance work, etc. Hesperian Boulevard is the College’s main access route, which connects with Depot Road providing vehicle access to the parking lots on the southern and eastern areas of campus. In areas of the
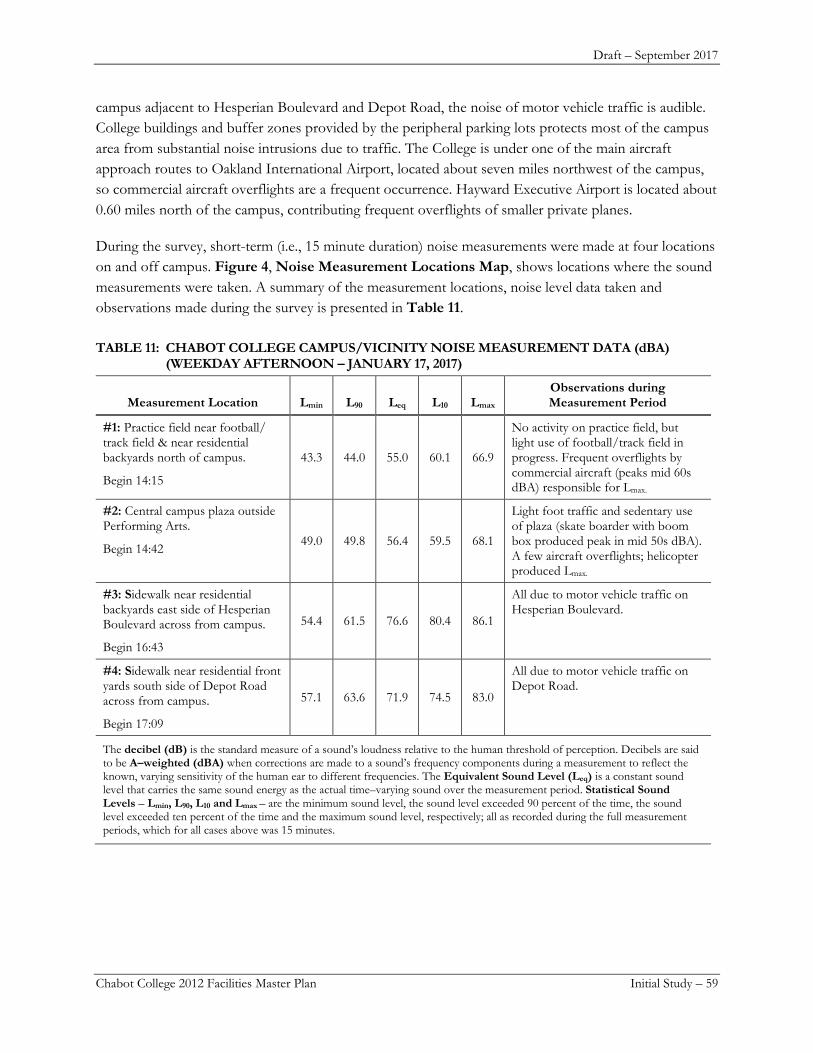
Draft – September 2017
Chabot College 2012 Facilities Master Plan Initial Study – 59
campus adjacent to Hesperian Boulevard and Depot Road, the noise of motor vehicle traffic is audible. College buildings and buffer zones provided by the peripheral parking lots protects most of the campus area from substantial noise intrusions due to traffic. The College is under one of the main aircraft approach routes to Oakland International Airport, located about seven miles northwest of the campus, so commercial aircraft overflights are a frequent occurrence. Hayward Executive Airport is located about 0.60 miles north of the campus, contributing frequent overflights of smaller private planes.
During the survey, short-term (i.e., 15 minute duration) noise measurements were made at four locations on and off campus. Figure 4, Noise Measurement Locations Map, shows locations where the sound measurements were taken. A summary of the measurement locations, noise level data taken and observations made during the survey is presented in Table 11.
TABLE 11: CHABOT COLLEGE CAMPUS/VICINITY NOISE MEASUREMENT DATA (dBA) (WEEKDAY AFTERNOON – JANUARY 17, 2017)
Measurement Location Lmin L90 Leq L10 Lmax Observations during Measurement Period
#1: Practice field near football/track field & near residential backyards north of campus.
Begin 14:15
43.3 44.0 55.0 60.1 66.9
No activity on practice field, but light use of football/track field in progress. Frequent overflights by commercial aircraft (peaks mid 60s dBA) responsible for Lmax.
#2: Central campus plaza outside Performing Arts.
Begin 14:42 49.0 49.8 56.4 59.5 68.1
Light foot traffic and sedentary use of plaza (skate boarder with boom box produced peak in mid 50s dBA). A few aircraft overflights; helicopter produced Lmax.
#3: Sidewalk near residential backyards east side of Hesperian Boulevard across from campus.
Begin 16:43
54.4 61.5 76.6 80.4 86.1
All due to motor vehicle traffic on Hesperian Boulevard.
#4: Sidewalk near residential front yards south side of Depot Road across from campus.
Begin 17:09
57.1 63.6 71.9 74.5 83.0
All due to motor vehicle traffic on Depot Road.
The decibel (dB) is the standard measure of a sound’s loudness relative to the human threshold of perception. Decibels are said to be A–weighted (dBA) when corrections are made to a sound’s frequency components during a measurement to reflect the known, varying sensitivity of the human ear to different frequencies. The Equivalent Sound Level (Leq) is a constant sound level that carries the same sound energy as the actual time–varying sound over the measurement period. Statistical Sound Levels – Lmin, L90, L10 and Lmax – are the minimum sound level, the sound level exceeded 90 percent of the time, the sound level exceeded ten percent of the time and the maximum sound level, respectively; all as recorded during the full measurement periods, which for all cases above was 15 minutes.
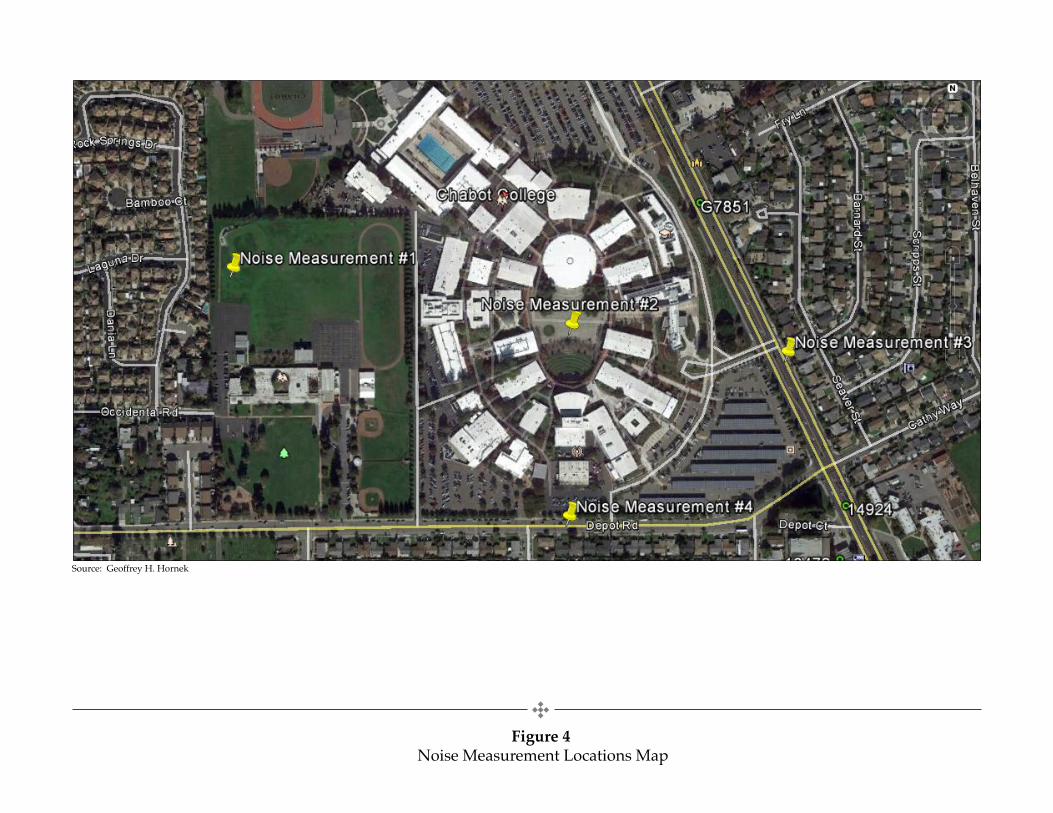
!
Figure 4 Noise Measurement Locations Map
Source: Geoffrey H. Hornek
Draft – September 2017
Chabot College 2012 Facilities Master Plan Initial Study – 61
Regulatory Setting
Although the District is exempt from local land use regulations, the noise analysis applied the noise policies and standards identified in the Hazards Element of the Hayward 2040 General Plan (adopted 2014) and the Hayward Municipal Code (Chapter 4 – Public Nuisances) because the noise-sensitive existing residential uses to the south and east of the campus could be affected by Project noise impacts.
The Hayward 2040 General Plan – Hazards Element – Goal 8: Noise Hazards recognizes aircraft, trains, vehicle traffic on freeways and roadways, and industrial and commercial operations as sources of noise within the City that can have potentially adverse impacts on and around new development without adequate oversight of development plans and mitigation of identified adverse impacts. The General Plan provides supporting noise control policies and exposure standards to minimize noise hazards (City of Hayward 2014).
The following noise control policies and standards of the Hayward 2040 General Plan - Hazards Element are relevant in assessing the potential for noise impacts from the Project.
• HAZ-8.1 (Locating Noise Sensitive Uses). The City shall strive to locate noise sensitive uses, (e.g., residences, schools, hospitals, libraries, religious institutions, and convalescent homes) away from major sources of noise.
• HAZ-8.2 (Noise Study and Mitigation). The City shall require development projects in areas where they may be exposed to major noise sources (e.g. roadways, rail lines, and aircraft or other non-transportation noise sources) to conduct a project level environmental noise analysis. The noise analysis shall determine noise exposure and noise standard compatibility with respect to the noise standards identified in Table HAZ-1 [of the General Plan] and shall incorporate noise mitigation when located in noise environments that are not compatible with the proposed uses of the project.
The following are excerpts of standards (i.e., highest level of exterior noise exposure that is regarded as “Normally Acceptable” as defined in the State of California General Plan Guidelines) from the Exterior Noise Compatibility Standards for Various Land Uses for the noise-sensitive land use types occurring on/near the Chabot College campus:
− Residential Single-Family: 60 dBA Ldn/CNEL6 Multi-Family: 65 dBA Ldn/CNEL Urban-Infill/Mixed-Use: 70 dBA Ldn/CNEL
− Schools 70 dBA Ldn/CNEL
• HAZ-8.7 (Noise Standards for Office and Similar Uses). The City shall require the design of new office developments and similar uses to achieve a maximum interior noise standard of 45dBA Leq (peak hour).
6 The Day–Night Average Sound Level (Ldn) is a 24–hour average, A–weighted Leq with a 10–decibel penalty added to sound
levels occurring at night between 10:00 p.m. and 7:00 a.m. The Community Noise Equivalent Sound Level (CNEL) is an Ldn with an additional 5–decibel penalty added to sound levels occurring in the evening between 7:00 p.m. and 11:00 p.m.
Draft – September 2017
Chabot College 2012 Facilities Master Plan Initial Study – 62
According to the Hayward Municipal Code (Section 4-1.03.4 Construction and Alteration of Structures: Landscaping Activities):
“Unless otherwise provided pursuant to a duly-issued permit or a condition of approval of a land use entitlement, the construction, alteration, or repair of structures and any landscaping activities, occurring between the hours of 10:00 a.m. and 6:00 p.m. on Sundays and holidays, and 7:00 a.m. and 7:00 p.m. on other days, shall be subject to the following:
a) “No individual device or piece of equipment shall produce a noise level exceeding eighty-three (83) dBA at a distance of twenty-five (25) feet from the source. If the device or equipment is housed within a structure on the property, the measurement shall be made outside the structure at a distance as close as possible to twenty-five (25) feet from the equipment.
b) “The noise level at any point outside of the property plane shall not exceed eighty-six (86) dBA.”
Impact Discussion
During demolition, construction and renovation, noise levels on most of the Chabot College campus will remain within the normally acceptable range for schools defined by the City of Hayward Hazards Element. However, noise levels at campus areas adjacent to construction sites would temporarily increase with potential adverse noise and vibration impacts on instruction/research/work activities. With implementation of Mitigation Measure NOISE-1, residual construction noise impacts would be reduced to the maximum feasible extent and would be a less than significant noise impact. With implementation of Mitigation Measure NOISE-2, potential adverse vibration impacts would be less than significant. With buildout of the 2012 FMP, operational stationary source and traffic noise impacts are not expected to adversely affect existing residential areas south and east of campus. A brief discussion of each environmental issue included under Section 12 is presented below.
a) Would the project expose persons to or generate noise levels in excess of standards established in the local general plan, specific plan, noise ordinance or applicable standards of other agencies?
Existing noise levels at the closest existing residential uses east and south of the campus are already above the City’s normally acceptable standards for residential because of the existing high traffic volumes on Hesperian Boulevard, Depot Road and the more distant influence of I-880 and SR-92. Existing noise levels on the inner campus areas are substantially below the City’s normally acceptable standards for schools.
According to the Hazards Element noise exposure map (Figure HAZ-1 of that document), future noise levels at the adjacent residential areas facing the campus to the south and east will be substantially above the Normally Acceptable standard for single-family residential (i.e., greater than 60 dBA Ldn). Short-term noise measurements taken during the site survey found that this has likely already occurred; peak commute daytime noise levels in areas close to Hesperian Boulevard/Depot Road are in the mid 70’s/ low 70s dBA, which would correspond to Ldn levels in the low 70s/upper 60s dBA, respectively.7 The setbacks created by campus parking lots along Hesperian Boulevard and Depot Road protect campus
7 According to Federal Transit Administration (FTA) guidelines for estimating Ldn from short-term noise measurements
(FTA 2006, Appendix D), Ldn is usually two dBA less than the daytime peak hourly Leq.
Draft – September 2017
Chabot College 2012 Facilities Master Plan Initial Study – 63
buildings and outdoor public use areas from traffic noise intrusion along the southern and eastern campus boundaries.
Noise increments from Project sources (i.e., construction, incremental motor vehicle traffic, HVAC equipment on the new campus buildings, and outdoor campus activities) would not be great enough to noticeably worsen noise exposure levels in the southern and eastern residential areas (as discussed in Subsections 12c – 12d below) and noise levels at on-campus sensitive receptors would remain within established noise standards. Impacts to both residential and campus receptors would be less than significant.
b) Would the project expose persons to or generate excessive ground-borne vibration or ground-borne noise levels?
There are no recommended vibration assessment methodologies, impact standards or reduction strategies in the City of Hayward Hazards Element. Standards developed by the Federal Transit Administration (FTA) (2006) are most commonly applied and were used in assessing vibration impacts. According to the FTA, limiting vibration levels to 94 vibration decibels (VdB - the common measure of vibration magnitude, similar to the dB for noise) or less would avoid structural damage to wood and masonry buildings (which are typical of most residential structures), while limiting vibration levels to 80 VdB or less at residential locations would avoid significant annoyance to the occupants.
The most vibration-intensive piece of construction equipment is a pile driver; other types of construction equipment are far less vibration-intensive. Yet all construction equipment has the potential for causing structural damage and/or annoyance if the construction activity is too close to vibration-sensitive receptors. The closest residential areas south and east of campus are 200 to 800 feet respectively, from any of the sites proposed for new buildings identified in the 2012 FMP and according to FTA vibration screening methodology would be outside the range where there would be a potential for on-going annoyance or structural damage from Project construction vibration. The Fry Farmstead, recognized by the City as eligible for listing on the National Register and the California Register of Historical Resources, is located about 750 feet north of the nearest building construction site and more than 200 feet from the athletic field site improvements and would also be outside the range where there would be a potential for on-going annoyance or structural damage from construction vibration. Thus, the Project’s construction vibration impact severity on off-campus receptors would be less than significant.
This would not be the case for on-campus vibration sensitive receptors. Construction of the new buildings would take place near vibration sensitive receptors (classrooms, offices, library). This could cause significant disruption to sensitive receptors and is considered a potentially significant impact; however, with implementation of Mitigation Measure NOISE-2, impacts would be less than significant.
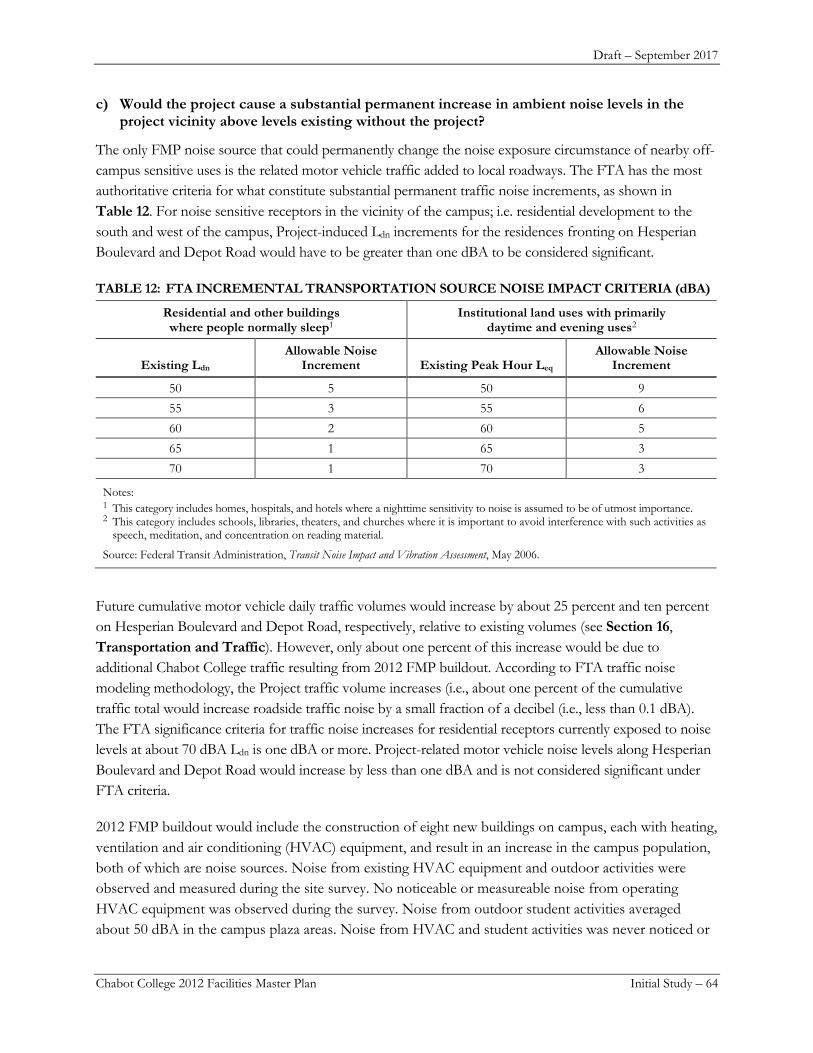
Draft – September 2017
Chabot College 2012 Facilities Master Plan Initial Study – 64
c) Would the project cause a substantial permanent increase in ambient noise levels in the project vicinity above levels existing without the project?
The only FMP noise source that could permanently change the noise exposure circumstance of nearby off-campus sensitive uses is the related motor vehicle traffic added to local roadways. The FTA has the most authoritative criteria for what constitute substantial permanent traffic noise increments, as shown in Table 12. For noise sensitive receptors in the vicinity of the campus; i.e. residential development to the south and west of the campus, Project-induced Ldn increments for the residences fronting on Hesperian Boulevard and Depot Road would have to be greater than one dBA to be considered significant.
TABLE 12: FTA INCREMENTAL TRANSPORTATION SOURCE NOISE IMPACT CRITERIA (dBA)
Residential and other buildings where people normally sleep1
Institutional land uses with primarily daytime and evening uses2
Existing Ldn Allowable Noise
Increment Existing Peak Hour Leq Allowable Noise
Increment
50 5 50 9 55 3 55 6 60 2 60 5 65 1 65 3 70 1 70 3
Notes: 1 This category includes homes, hospitals, and hotels where a nighttime sensitivity to noise is assumed to be of utmost importance. 2 This category includes schools, libraries, theaters, and churches where it is important to avoid interference with such activities as
speech, meditation, and concentration on reading material.
Source: Federal Transit Administration, Transit Noise Impact and Vibration Assessment, May 2006.
Future cumulative motor vehicle daily traffic volumes would increase by about 25 percent and ten percent on Hesperian Boulevard and Depot Road, respectively, relative to existing volumes (see Section 16, Transportation and Traffic). However, only about one percent of this increase would be due to additional Chabot College traffic resulting from 2012 FMP buildout. According to FTA traffic noise modeling methodology, the Project traffic volume increases (i.e., about one percent of the cumulative traffic total would increase roadside traffic noise by a small fraction of a decibel (i.e., less than 0.1 dBA). The FTA significance criteria for traffic noise increases for residential receptors currently exposed to noise levels at about 70 dBA Ldn is one dBA or more. Project-related motor vehicle noise levels along Hesperian Boulevard and Depot Road would increase by less than one dBA and is not considered significant under FTA criteria.
2012 FMP buildout would include the construction of eight new buildings on campus, each with heating, ventilation and air conditioning (HVAC) equipment, and result in an increase in the campus population, both of which are noise sources. Noise from existing HVAC equipment and outdoor activities were observed and measured during the site survey. No noticeable or measureable noise from operating HVAC equipment was observed during the survey. Noise from outdoor student activities averaged about 50 dBA in the campus plaza areas. Noise from HVAC and student activities was never noticed or
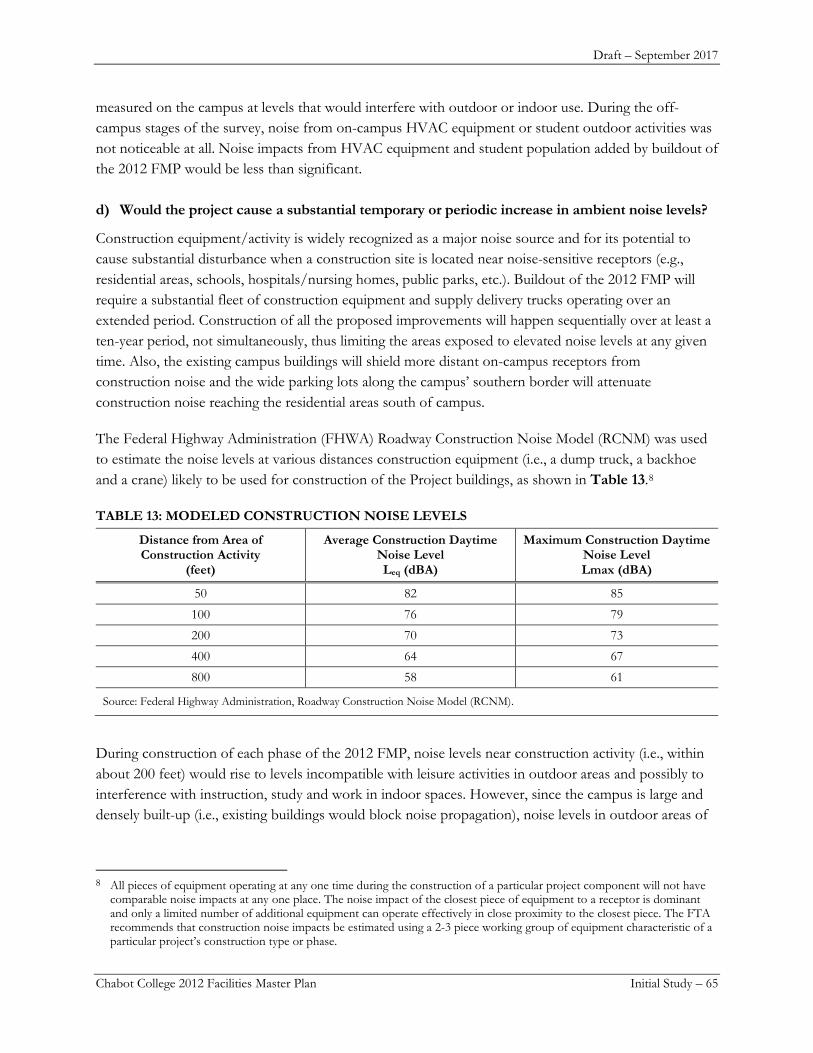
Draft – September 2017
Chabot College 2012 Facilities Master Plan Initial Study – 65
measured on the campus at levels that would interfere with outdoor or indoor use. During the off-campus stages of the survey, noise from on-campus HVAC equipment or student outdoor activities was not noticeable at all. Noise impacts from HVAC equipment and student population added by buildout of the 2012 FMP would be less than significant.
d) Would the project cause a substantial temporary or periodic increase in ambient noise levels?
Construction equipment/activity is widely recognized as a major noise source and for its potential to cause substantial disturbance when a construction site is located near noise-sensitive receptors (e.g., residential areas, schools, hospitals/nursing homes, public parks, etc.). Buildout of the 2012 FMP will require a substantial fleet of construction equipment and supply delivery trucks operating over an extended period. Construction of all the proposed improvements will happen sequentially over at least a ten-year period, not simultaneously, thus limiting the areas exposed to elevated noise levels at any given time. Also, the existing campus buildings will shield more distant on-campus receptors from construction noise and the wide parking lots along the campus’ southern border will attenuate construction noise reaching the residential areas south of campus.
The Federal Highway Administration (FHWA) Roadway Construction Noise Model (RCNM) was used to estimate the noise levels at various distances construction equipment (i.e., a dump truck, a backhoe and a crane) likely to be used for construction of the Project buildings, as shown in Table 13.8
TABLE 13: MODELED CONSTRUCTION NOISE LEVELS
Distance from Area of Construction Activity
(feet)
Average Construction Daytime Noise Level Leq (dBA)
Maximum Construction Daytime Noise Level Lmax (dBA)
50 82 85
100 76 79
200 70 73
400 64 67
800 58 61
Source: Federal Highway Administration, Roadway Construction Noise Model (RCNM).
During construction of each phase of the 2012 FMP, noise levels near construction activity (i.e., within about 200 feet) would rise to levels incompatible with leisure activities in outdoor areas and possibly to interference with instruction, study and work in indoor spaces. However, since the campus is large and densely built-up (i.e., existing buildings would block noise propagation), noise levels in outdoor areas of
8 All pieces of equipment operating at any one time during the construction of a particular project component will not have
comparable noise impacts at any one place. The noise impact of the closest piece of equipment to a receptor is dominant and only a limited number of additional equipment can operate effectively in close proximity to the closest piece. The FTA recommends that construction noise impacts be estimated using a 2-3 piece working group of equipment characteristic of a particular project’s construction type or phase.
Draft – September 2017
Chabot College 2012 Facilities Master Plan Initial Study – 66
the campus not adjacent to an active building site would remain acceptable for many leisure and recreational activities during construction.
The nearest off-campus sensitive receptors are existing residential development about 200 feet south of the campus along of Depot Road, and about 800 feet east of the campus along Hesperian Boulevard. At these distances, worst case Project construction noise levels would reach the mid-60s dBA (when work is in progress on the TV and Radio Broadcast Building (B3600) and the upper 50s dBA (when work is in progress on the Library (B100), respectively. At these levels, construction noise could disrupt the ability for relaxed conversation and the tranquility of receptors in the outdoor areas of the residences along Depot Road, but the residents inside their homes would be protected from such adverse impacts by closing windows and doors facing the campus at times when noise from construction activity is judged disruptive. Since the traffic noise levels along Hesperian Boulevard are already high, construction noise impacts there would be only occasionally noticeable at outdoor locations.
With implementation of Mitigation Measure NOISE-1, project construction noise impacts along Depot Road would be less than significant.
e) For a project located within an airport land use plan or, where such a plan has not been adopted, within two miles of a public airport or public use airport, would the project expose people residing or working in the project area to excessive noise levels?
The Chabot College campus is about seven miles southeast of Oakland International Airport and the airport’s most recent noise contour map shows that aircraft flyover noise at the campus is less than 65 dBA CNEL. (Port of Oakland) The Chabot College campus is about 0.60 mile south of Hayward Executive Airport and the airport’s most recent noise contour map shows that aircraft flyover noise at the campus is less than 60 dBA. (Alameda County ALUC) Observations of aircraft flyover noise during the site survey indicate that aircraft peak noise during flyovers can disrupt casual conversation for short periods but did not reach the levels and the frequency such that outdoor leisure and indoor/outdoor learning activities were substantially disrupted. Thus, aircraft noise impacts on campus are less than significant and will remain so after 2012 FMP buildout.
f) For a project within the vicinity of a private airstrip, would the project expose people residing or working in the project area to excessive noise levels?
The proposed Project site is not located in the vicinity of a private airstrip.
Mitigation Measures
NOISE-1 The following Best Management Practices shall be incorporated into the Project construction documents:
• Provide enclosures and noise mufflers for stationary equipment, shrouding or shielding for impact tools, and barriers around particularly noisy activity areas on the site.
• Use quietest type of construction equipment whenever possible, particularly air compressors.
Draft – September 2017
Chabot College 2012 Facilities Master Plan Initial Study – 67
• Provide sound-control devices on equipment no less effective than those provided by the manufacturer.
• Locate stationary equipment, material stockpiles, and vehicle staging areas as far as practicable from sensitive receptors.
• Prohibit unnecessary idling of internal combustion engines.
• Require applicable construction-related vehicles and equipment to use designated truck routes when entering/leaving the site.
• Designate a noise (and vibration) disturbance coordinator at the CLPCCD who shall be responsible for responding to complaints about noise (and vibration) during construction. The telephone number of the noise disturbance coordinator shall be conspicuously posted at the construction site. Copies of the project purpose, description and construction schedule shall also be distributed to the surrounding residences.
• Limit project construction activity to the hours of 10:00 a.m. and 6:00 p.m. on Sundays and holidays, and 7:00 a.m. and 7:00 p.m. on other days.
NOISE-2 To the extent feasible, in instances where vibration-intensive construction equipment is located next to on-campus vibration-sensitive receptors that would result in major disruption, the District shall temporarily relocate the vibration-sensitive receptors to minimize disruption.
References Alameda County Airport Land Use Commission (ALUC). 2010. Hayward Executive Airport Land Use
Compatibility Plan. http://www.acgov.org/cda/planning/landuseprojects/documents/Draft_HWD_ALUCP_091510.pdf
City of Hayward. Hayward 2040 General Plan - Hazards Element. http://www.hayward-ca.gov/sites/default/files/documents/General_Plan_FINAL.pdf
FTA (Federal Transit Administration). 2006. Transit Noise and Vibration Impact Assessment. http://www.fta.dot.gov/documents/FTA_Noise_and_Vibration_Manual.pdf
FHWA (Federal Highway Administration). 2006. Roadway Construction Noise Model User’s Guide. https://www.fhwa.dot.gov/environment/noise/construction_noise/rcnm/rcnm.pdf
Port of Oakland. Noise Management Program. http://flyquietoak.com/pages/reports/annual_noise_contours.html
Draft – September 2017
Chabot College 2012 Facilities Master Plan Initial Study – 68
Potentially Significant Potentially Unless Less Than Significant Mitigation Significant No Impact Incorporated Impact Impact 13. POPULATION AND HOUSING. Would the project:
a) Induce substantial population growth in an area, either directly (for example, by proposing new homes and business) or indirectly (for example, through extension of roads or other infrastructure)?
b) Displace substantial numbers of existing housing, necessitating the construction of replacement housing elsewhere?
c) Displace substantial numbers of people, necessitating the construction of replacement housing elsewhere?
Environmental Setting
Chabot College serves Hayward residents and the greater south Alameda County. The District projects that by 2025, College enrollment will be about 15,267 students, an increase of 950 students over the next ten years.
Impact Discussion
The 2012 FMP is proposed in response to projected population increases in Hayward and the greater South Bay. The proposed Project would not affect existing housing or the need for new housing. A brief discussion of each environmental issue included under Section 13 is presented below.
a. Would the project induce substantial population growth in an area, either directly (for example, by proposing new homes and business) or indirectly (for example, through extension of roads or other infrastructure)?
The 2012 FMP will not induce population growth as it is a response to the projected population growth in Hayward and the greater South Bay.
b) Would the project displace substantial numbers of existing housing, necessitating the construction of replacement housing elsewhere?
The 2012 FMP will not affect any existing housing. There are no housing units on the Chabot College campus.
c) Would the project displace substantial numbers of people, necessitating the construction of replacement housing elsewhere?
The 2012 FMP will not displace any persons.
Mitigation Measures
None required.
Draft – September 2017
Chabot College 2012 Facilities Master Plan Initial Study – 69
Potentially Significant Potentially Unless Less Than Significant Mitigation Significant No Impact Incorporated Impact Impact 14. PUBLIC SERVICES. Would the project result in substantial
adverse physical impacts associated with the provision of new or physically altered government facilities, need for new or physically altered governmental facilities, the construction of which could cause significant environmental impacts, in order to maintain acceptable service ratios, response times or other performance objectives for any of the public services:
a) Fire protection?
b) Police protection?
c) Schools?
d) Parks?
e) Other public facilities?
Environmental Setting
Police protection services are provided by the Hayward Police Department (HPD). The campus is located in the Department’s Patrol Beat D (Hayward Police Department). The College and HPD have partnered to provide police protection services on the campus. A HPD Sergeant is contracted by the College as the Director of Campus Safety and Security. The College’s Campus Safety and Security staff provide safety and security services on campus. While not sworn officers, the campus safety officers have authority to make arrests on campus for any misdemeanor or felony within their presence; and can issue citations for violations of District parking regulations.
Fire protection services are provided by the Hayward Fire Department. Chabot College is served by the fire station located in District 6. Chabot College’s Emergency Preparedness Handbook (Chabot College) includes procedures to address evacuation in the event there is a fire on campus.
The City of Hayward provides water, wastewater and storm drain systems services to the Chabot College campus (City of Hayward).
Impact Discussion
The 2012 FMP addresses the projected increase in student enrollment of 950 students by 2025. The increase in student population on the Chabot College would not adversely affect public services. A brief discussion of each environmental issue included under Section 14 is presented below.
a) Fire protection?
As required by the Division of the State Architect, which has jurisdiction over school construction, the proposed buildings and renovated buildings will be in compliance with current State fire code requirements. The College will update the Emergency Preparedness Handbook to add the new buildings and other facilities. Buildout of the 2012 FMP would not adversely affect the ability of the Hayward Fire Department to protect the campus.
Draft – September 2017
Chabot College 2012 Facilities Master Plan Initial Study – 70
b) Police protection?
Campus Safety and Security will continue to provide first response for safety and security needs on the Chabot College campus. As needed, the College will add campus safety officers in response to increasing student population on the campus. Buildout of the 2012 FMP would not adversely affect the ability of the Hayward Police Department to protect the campus.
c) Schools?
The 2012 FMP would not adversely affect Hayward K-12 schools.
d) Parks?
Buildout of the 2012 FMP would not adversely affect nearby public parks. Recreational facilities on campus include gymnasium, swimming pool, baseball, softball and soccer fields, tennis courts, football and track. The 2012 FMP would rebuild the existing baseball field and practice field, renovate the upper deck of the pool deck would be renovated and accessible bleachers, new stadium lighting and a scoreboard would be installed at the football stadium. There are more than adequate recreation facilities on campus to serve students, faculty and staff.
e) Other public facilities?
Buildout of the 2012 FMP would not adversely affect other public facilities.
Mitigation Measures
None required.
References City of Hayward. Utilities and Environmental Services https://www.hayward-ca.gov/your-government/
departments/utilities-environmental-services.
Hayward Fire Department: https://www.hayward-ca.gov/fire-department.
Hayward Police Department: https://www.hayward-ca.gov/police-department.
Chabot College. Emergency Preparedness Handbook. Available on the Chabot College website at: www.laspositascollege.edu/safety/documents/EmergencyResponseHandbookLPC.pdf.
Draft – September 2017
Chabot College 2012 Facilities Master Plan Initial Study – 71
Potentially Significant Potentially Unless Less Than Significant Mitigation Significant No Impact Incorporated Impact Impact 15. RECREATION. Would the project:
a) Would the project increase the use of existing neighborhood and regional parks or other recreational facilities such that substantial physical deterioration of the facility would occur or be accelerated?
b) Does the project include recreational facilities or require the construction or expansion of recreational facilities, which might have an adverse physical effect on the environment?
Environmental Setting
The Chabot College campus offers a range of recreational facilities to serve students, faculty and staff.
Impact Discussion
Buildout of the 2012 FMP would not adversely affect neighborhood or regional parks. A brief discussion of each environmental issue included under Section 15 is presented below.
a) Would the project increase the use of existing neighborhood and regional parks or other recreational facilities such that substantial physical deterioration of the facility would occur or be accelerated?
Buildout of the 2012 FMP would not significantly increase the use of existing and regional parks nor cause substantial physical deterioration of these facilities. See Section Public Services 14d Parks above.
b) Would the project include recreational facilities or require the construction or expansion of recreational facilities, which might have an adverse physical effect on the environment?
Existing recreational facilities are currently provided on the Chabot College campus. See Section Public Services 14d Parks above.
Mitigation Measures
None required.
Draft – September 2017
Chabot College 2012 Facilities Master Plan Initial Study – 72
Potentially Significant Potentially Unless Less Than Significant Mitigation Significant No Impact Incorporated Impact Impact 16. TRANSPORTATION/CIRCULATION. Would the proposal
result in:
a) Conflict with an applicable plan, ordinance or policy establishing measures of effectiveness for the performance of the circulation system, taking into account all modes of transportation including mass transit and non-motorized travel and relevant components of the circulation system, including but not limited to intersections, streets, highways and freeways, pedestrian and bicycle paths, and mass transit?
b) Conflict with an applicable congestion management program, including, but not limited to level of service standards and travel demand measures, or other standards established by the county congestion management agency for designated roads or highways?
c) Result in a change in air traffic patterns, including either an increase in traffic levels or a change in location that results in substantial safety risks?
d) Substantially increase hazards due to a design feature (e.g., sharp curves or dangerous intersections) or incompatible uses (e.g., farm equipment)?
e) Result in inadequate emergency access?
f) Conflict with adopted policies, plans, or programs regarding public transit, bicycle, or pedestrian facilities, or otherwise decrease the performance or safety of such facilities?
Environmental Setting
Overview
This transportation and circulation analysis evaluates potential impacts associated with the Chabot College 2012 Facilities Master Plan. Potential impacts to the surrounding roadway network, to on-site circulation and access, to pedestrian conditions, and to parking conditions are evaluated.
As shown in Figure 5, the traffic analysis focuses on the following sixteen study intersections:
1. Hesperian Boulevard / Winton Avenue (signal control); 2. Hesperian Boulevard / Southland Drive (signal control); 3. Hesperian Boulevard / Turner Court (signal control); 4. Hesperian Boulevard / East Driveway (signal control); 5. Hesperian Boulevard / Depot Road (signal control); 6. Hesperian Boulevard / State Route 92 Westbound Ramp (signal control); 7. Hesperian Boulevard / State Route 92 Eastbound Ramp (signal control); 8. Hesperian Boulevard / Sleepy Hollow Avenue (signal control); 9. Hesperian Boulevard / Tennyson Road (signal control);
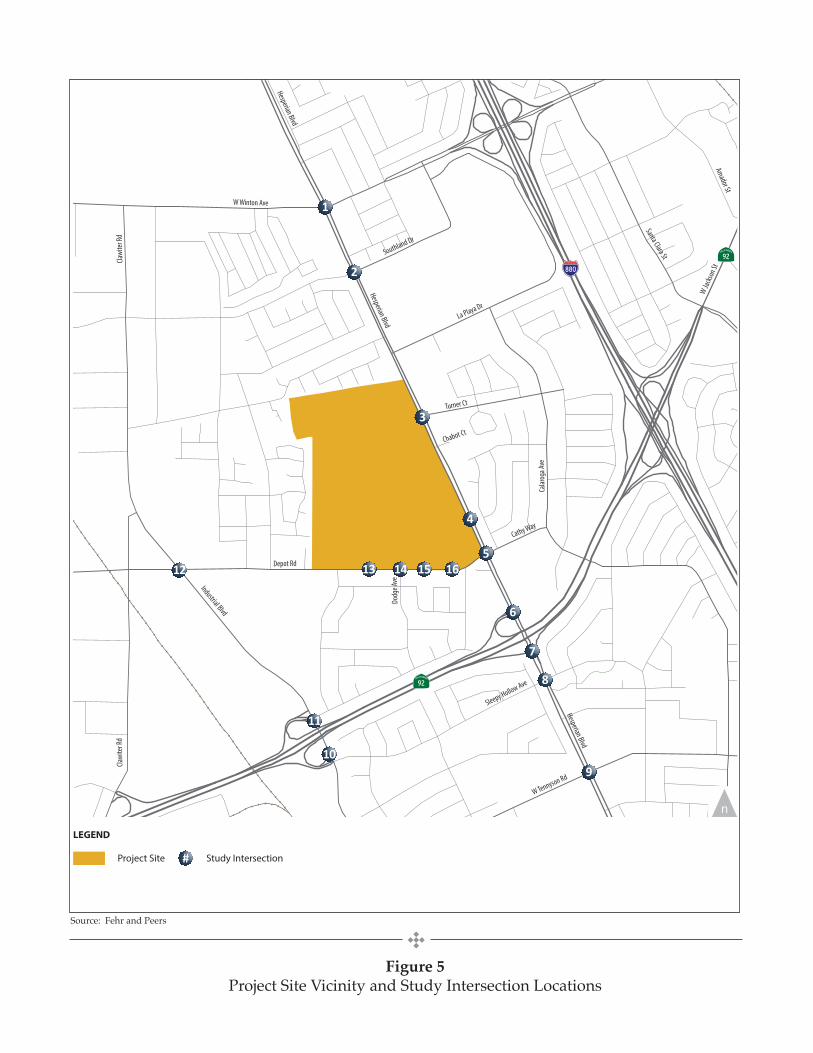
Hesperian Blvd
Clawi
ter R
dCla
wite
r Rd
Depot Rd
Calar
oga A
ve
Industrial Blvd
W Winton Ave
Santa Clara St
Sleepy Hollow Ave
W Tennyson Rd
Turner Ct
La Playa Dr
Southland Dr
Dodg
e Ave
W Ja
ckso
n St
Cathy Way
Chabot Ct
Hesperian Blvd
Hesperian Blvd
Amador St
1
2
3
5
4
6
7
8
910
11
12 13 14 15 16
92
92
880
WC16-3350_1_SiteVic
Project Site Vicinity and Study Intersection Locations
Figure 1
LEGEND
Project Site Study Intersection#
Figure 5Project Site Vicinity and Study Intersection Locations
Source: Fehr and Peers
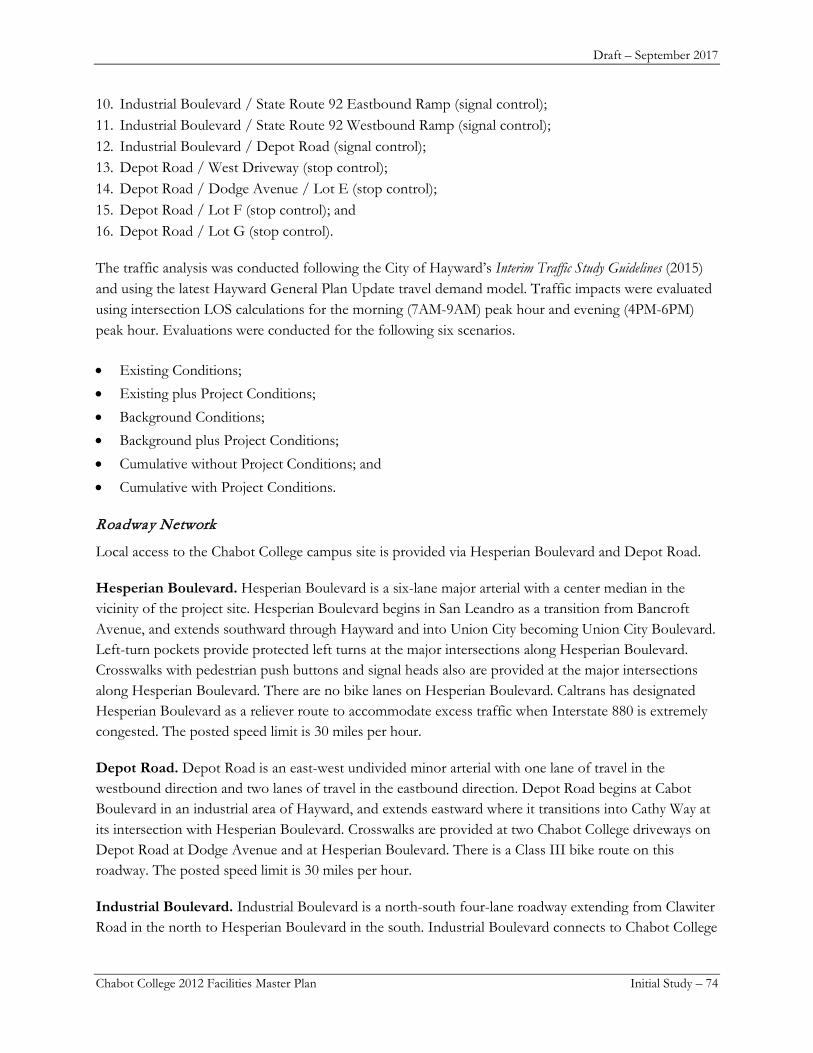
Draft – September 2017
Chabot College 2012 Facilities Master Plan Initial Study – 74
10. Industrial Boulevard / State Route 92 Eastbound Ramp (signal control); 11. Industrial Boulevard / State Route 92 Westbound Ramp (signal control); 12. Industrial Boulevard / Depot Road (signal control); 13. Depot Road / West Driveway (stop control); 14. Depot Road / Dodge Avenue / Lot E (stop control); 15. Depot Road / Lot F (stop control); and 16. Depot Road / Lot G (stop control).
The traffic analysis was conducted following the City of Hayward’s Interim Traffic Study Guidelines (2015) and using the latest Hayward General Plan Update travel demand model. Traffic impacts were evaluated using intersection LOS calculations for the morning (7AM-9AM) peak hour and evening (4PM-6PM) peak hour. Evaluations were conducted for the following six scenarios.
• Existing Conditions; • Existing plus Project Conditions; • Background Conditions; • Background plus Project Conditions; • Cumulative without Project Conditions; and • Cumulative with Project Conditions.
Roadway Network
Local access to the Chabot College campus site is provided via Hesperian Boulevard and Depot Road.
Hesperian Boulevard. Hesperian Boulevard is a six-lane major arterial with a center median in the vicinity of the project site. Hesperian Boulevard begins in San Leandro as a transition from Bancroft Avenue, and extends southward through Hayward and into Union City becoming Union City Boulevard. Left-turn pockets provide protected left turns at the major intersections along Hesperian Boulevard. Crosswalks with pedestrian push buttons and signal heads also are provided at the major intersections along Hesperian Boulevard. There are no bike lanes on Hesperian Boulevard. Caltrans has designated Hesperian Boulevard as a reliever route to accommodate excess traffic when Interstate 880 is extremely congested. The posted speed limit is 30 miles per hour.
Depot Road. Depot Road is an east-west undivided minor arterial with one lane of travel in the westbound direction and two lanes of travel in the eastbound direction. Depot Road begins at Cabot Boulevard in an industrial area of Hayward, and extends eastward where it transitions into Cathy Way at its intersection with Hesperian Boulevard. Crosswalks are provided at two Chabot College driveways on Depot Road at Dodge Avenue and at Hesperian Boulevard. There is a Class III bike route on this roadway. The posted speed limit is 30 miles per hour.
Industrial Boulevard. Industrial Boulevard is a north-south four-lane roadway extending from Clawiter Road in the north to Hesperian Boulevard in the south. Industrial Boulevard connects to Chabot College
Draft – September 2017
Chabot College 2012 Facilities Master Plan Initial Study – 75
via Depot Road. The section of Industrial Boulevard in the study area is designated as an arterial road. The posted speed limit is 30 miles per hour.
State Route 92. SR-92 begins at its junction with State Route 1 and State Route 35 in Half Moon Bay, and extends northeast across San Francisco Bay (San Mateo Bridge) and into Hayward. Within the City of Hayward, SR 92 changes designation to Jackson Street at its intersection with I-880 and then Foothill Boulevard at its intersection with Mission Boulevard. SR 92 provides access to Chabot College via a full interchange at Hesperian Boulevard.
Public Transit
AC Transit routes 22, 83, 85, 97, and 386, are proximate to the campus and both provide access from Hayward BART to South Hayward BART. The nearest transit stops are for route 22 and 97 and are located at signalized intersections with marked crosswalks. The closest bus stop to the College is on Hesperian Boulevard and Depot Road. There are bus shelters on both sides of the street at Hesperian Boulevard. Route 22 is a local line that runs a two-way loop that connects Chabot College to the Hayward BART station and South Hayward BART station. At Hesperian Boulevard/Depot Road, the daily boardings on Route 22 are approximately 2,115 passengers and the daily alightings are approximately 2,120 passengers. The average load at this bus stop is nine (passengers per bus). Route 97 is a local line that connects the Bay Fair BART station to the Union City BART Station via Hesperian Boulevard, Chabot College, Union Landing Shopping Center and Alvarado-Niles Boulevard. At Hesperian Boulevard/Depot Road, the daily boardings and alightings on Route 97 are approximately 4,400 and the average load at this bus stop is eleven passengers per bus.
Additionally, AC Transit Transbay Route M services Hesperian Boulevard and Depot Road en route to SR-92 West. The M Line connects Hayward BART Station to Hillsdale Shopping Center via the San Mateo Bridge.
Planned Transportation Improvements
According to the Hayward 2040 General Plan (City of Hayward), there are no future roadway improvements being implemented within the study area that will affect travel patterns of trips to and from the Chabot College campus.
Data Collection
Existing turning movement counts were collected at each of the study intersections during the morning (7AM-9PM) and evening (4PM-6PM) peak hour in October and November of 2016. These periods were selected to coincide with peak traffic generation at the campus and the adjacent roadway network.
Analysis Methodology
The traffic analysis was conducted following the guidelines established by the City of Hayward’s Interim Traffic Study Guidelines (2015). The analysis evaluates traffic impacts for study intersections, freeway segments, and freeway ramps using a grading system called Level of Service (LOS). The LOS grading
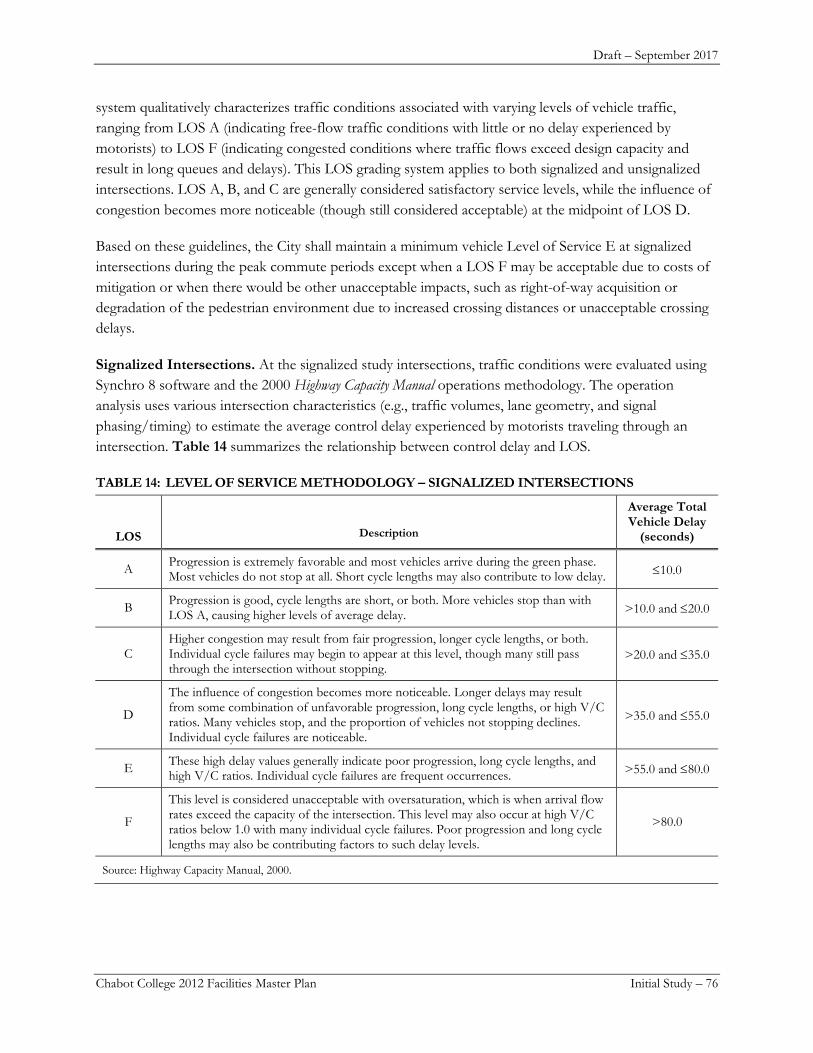
Draft – September 2017
Chabot College 2012 Facilities Master Plan Initial Study – 76
system qualitatively characterizes traffic conditions associated with varying levels of vehicle traffic, ranging from LOS A (indicating free-flow traffic conditions with little or no delay experienced by motorists) to LOS F (indicating congested conditions where traffic flows exceed design capacity and result in long queues and delays). This LOS grading system applies to both signalized and unsignalized intersections. LOS A, B, and C are generally considered satisfactory service levels, while the influence of congestion becomes more noticeable (though still considered acceptable) at the midpoint of LOS D.
Based on these guidelines, the City shall maintain a minimum vehicle Level of Service E at signalized intersections during the peak commute periods except when a LOS F may be acceptable due to costs of mitigation or when there would be other unacceptable impacts, such as right-of-way acquisition or degradation of the pedestrian environment due to increased crossing distances or unacceptable crossing delays.
Signalized Intersections. At the signalized study intersections, traffic conditions were evaluated using Synchro 8 software and the 2000 Highway Capacity Manual operations methodology. The operation analysis uses various intersection characteristics (e.g., traffic volumes, lane geometry, and signal phasing/timing) to estimate the average control delay experienced by motorists traveling through an intersection. Table 14 summarizes the relationship between control delay and LOS.
TABLE 14: LEVEL OF SERVICE METHODOLOGY – SIGNALIZED INTERSECTIONS
LOS
Description
Average Total Vehicle Delay
(seconds)
A Progression is extremely favorable and most vehicles arrive during the green phase. Most vehicles do not stop at all. Short cycle lengths may also contribute to low delay. ≤10.0
B Progression is good, cycle lengths are short, or both. More vehicles stop than with LOS A, causing higher levels of average delay. >10.0 and ≤20.0
C Higher congestion may result from fair progression, longer cycle lengths, or both. Individual cycle failures may begin to appear at this level, though many still pass through the intersection without stopping.
>20.0 and ≤35.0
D
The influence of congestion becomes more noticeable. Longer delays may result from some combination of unfavorable progression, long cycle lengths, or high V/C ratios. Many vehicles stop, and the proportion of vehicles not stopping declines. Individual cycle failures are noticeable.
>35.0 and ≤55.0
E These high delay values generally indicate poor progression, long cycle lengths, and high V/C ratios. Individual cycle failures are frequent occurrences. >55.0 and ≤80.0
F
This level is considered unacceptable with oversaturation, which is when arrival flow rates exceed the capacity of the intersection. This level may also occur at high V/C ratios below 1.0 with many individual cycle failures. Poor progression and long cycle lengths may also be contributing factors to such delay levels.
>80.0
Source: Highway Capacity Manual, 2000.
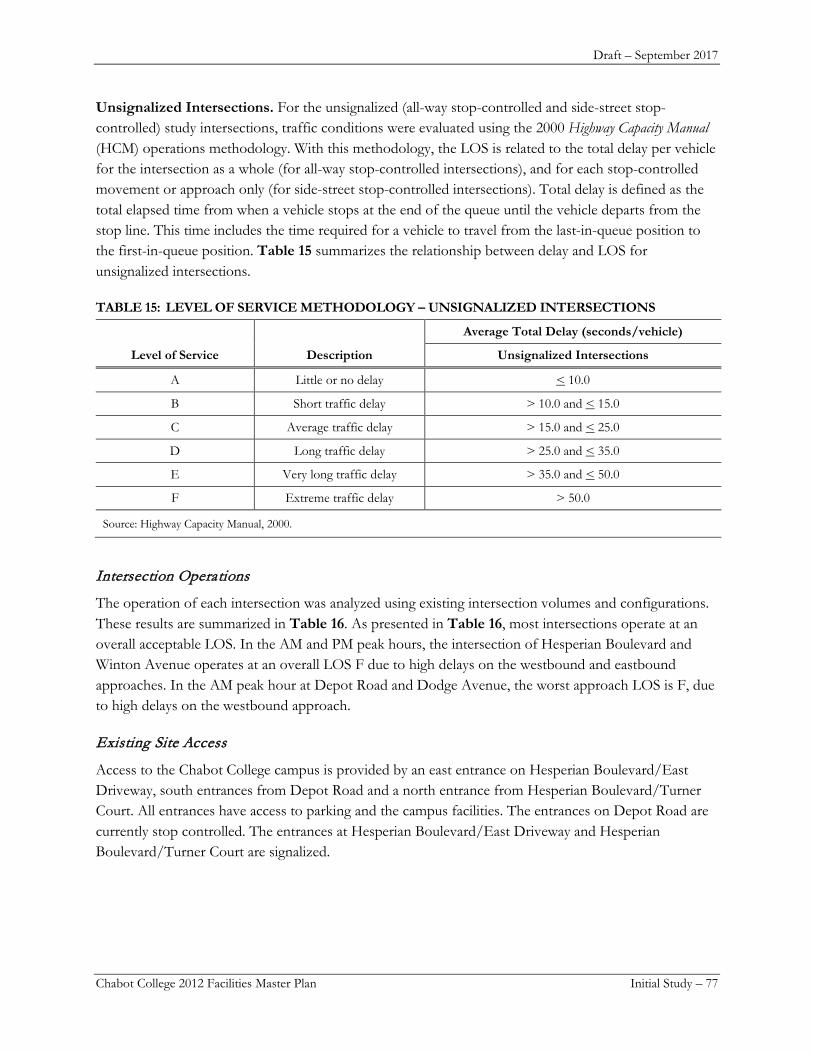
Draft – September 2017
Chabot College 2012 Facilities Master Plan Initial Study – 77
Unsignalized Intersections. For the unsignalized (all-way stop-controlled and side-street stop-controlled) study intersections, traffic conditions were evaluated using the 2000 Highway Capacity Manual (HCM) operations methodology. With this methodology, the LOS is related to the total delay per vehicle for the intersection as a whole (for all-way stop-controlled intersections), and for each stop-controlled movement or approach only (for side-street stop-controlled intersections). Total delay is defined as the total elapsed time from when a vehicle stops at the end of the queue until the vehicle departs from the stop line. This time includes the time required for a vehicle to travel from the last-in-queue position to the first-in-queue position. Table 15 summarizes the relationship between delay and LOS for unsignalized intersections.
TABLE 15: LEVEL OF SERVICE METHODOLOGY – UNSIGNALIZED INTERSECTIONS
Level of Service Description
Average Total Delay (seconds/vehicle)
Unsignalized Intersections
A Little or no delay < 10.0
B Short traffic delay > 10.0 and < 15.0
C Average traffic delay > 15.0 and < 25.0
D Long traffic delay > 25.0 and < 35.0
E Very long traffic delay > 35.0 and < 50.0
F Extreme traffic delay > 50.0
Source: Highway Capacity Manual, 2000.
Intersection Operations
The operation of each intersection was analyzed using existing intersection volumes and configurations. These results are summarized in Table 16. As presented in Table 16, most intersections operate at an overall acceptable LOS. In the AM and PM peak hours, the intersection of Hesperian Boulevard and Winton Avenue operates at an overall LOS F due to high delays on the westbound and eastbound approaches. In the AM peak hour at Depot Road and Dodge Avenue, the worst approach LOS is F, due to high delays on the westbound approach.
Existing Site Access
Access to the Chabot College campus is provided by an east entrance on Hesperian Boulevard/East Driveway, south entrances from Depot Road and a north entrance from Hesperian Boulevard/Turner Court. All entrances have access to parking and the campus facilities. The entrances on Depot Road are currently stop controlled. The entrances at Hesperian Boulevard/East Driveway and Hesperian Boulevard/Turner Court are signalized.
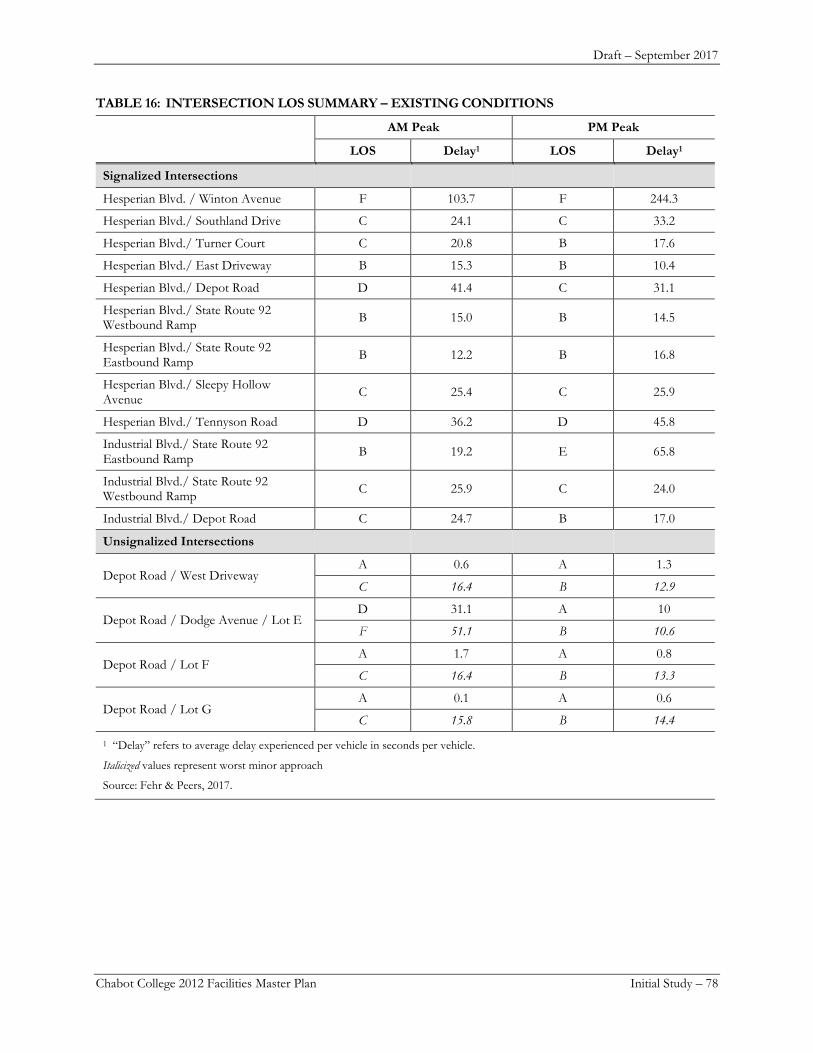
Draft – September 2017
Chabot College 2012 Facilities Master Plan Initial Study – 78
TABLE 16: INTERSECTION LOS SUMMARY – EXISTING CONDITIONS
AM Peak PM Peak
LOS Delay1 LOS Delay1
Signalized Intersections
Hesperian Blvd. / Winton Avenue F 103.7 F 244.3
Hesperian Blvd./ Southland Drive C 24.1 C 33.2
Hesperian Blvd./ Turner Court C 20.8 B 17.6
Hesperian Blvd./ East Driveway B 15.3 B 10.4
Hesperian Blvd./ Depot Road D 41.4 C 31.1
Hesperian Blvd./ State Route 92 Westbound Ramp B 15.0 B 14.5
Hesperian Blvd./ State Route 92 Eastbound Ramp B 12.2 B 16.8
Hesperian Blvd./ Sleepy Hollow Avenue C 25.4 C 25.9
Hesperian Blvd./ Tennyson Road D 36.2 D 45.8
Industrial Blvd./ State Route 92 Eastbound Ramp B 19.2 E 65.8
Industrial Blvd./ State Route 92 Westbound Ramp C 25.9 C 24.0
Industrial Blvd./ Depot Road C 24.7 B 17.0
Unsignalized Intersections
Depot Road / West Driveway A 0.6 A 1.3
C 16.4 B 12.9
Depot Road / Dodge Avenue / Lot E D 31.1 A 10
F 51.1 B 10.6
Depot Road / Lot F A 1.7 A 0.8
C 16.4 B 13.3
Depot Road / Lot G A 0.1 A 0.6
C 15.8 B 14.4
1 “Delay” refers to average delay experienced per vehicle in seconds per vehicle.
Italicized values represent worst minor approach
Source: Fehr & Peers, 2017.
Draft – September 2017
Chabot College 2012 Facilities Master Plan Initial Study – 79
Existing Parking
Currently the school provides 2,514 parking spaces for students, staff, and visitors. Eighteen parking spaces are dedicated for low emission vehicles, four are dedicated to electric charging vehicles, and 76 spaces are dedicated as handicap spaces.
Regulatory Setting
The effects of the 2012 FMP buildout on the transportation system were evaluated based on applicable policies, regulations, goals, and guidelines defined by the General Plan. The evaluation criteria considered in this assessment are presented below. For purposes of this Initial Study, traffic impacts are considered significant if buildout of the 2012 FMP would result in any of the following.
Signalized Intersections
An impact would be significant if an intersection previously mitigated to an acceptable level would now-exceed acceptable levels. The City of Hayward’s Interim Traffic Study Guidelines standard requires that the City strive for LOS E at signalized intersections during the peak commute periods except when a LOS F may be acceptable due to costs of mitigation or when there would be other unacceptable impacts, such as right-of-way acquisition or degradation of the pedestrian environment due to increased crossing distances or unacceptable crossing delays.
Unsignalized Intersections
The Project may cause an impact if specific criteria are met, including:
• Pedestrian Signal Warrant (California MUTCD Warrant 4) • The Peak Hour Signal Warrant (California MUTCD Warrant 3) • STOP-sign Warrant (MUTCD Guidance Criterion C.1 and C.2)
It is noted that meeting any of the above warrants does not necessarily result in a significant impact.
For both signalized and unsignalized intersections, the Project would result in a potentially significant impact if the intersection operates at LOS F without the Project under Existing, Background or Cumulative conditions and the addition of the Project under Existing plus Project, Project or Cumulative plus Project conditions results in an increase in the average control delay of 5.0 seconds or greater when compared to the associated No Project condition.
Roadway Segment
The Alameda CTC does not have adopted thresholds of significance for Congestion Management Plan (CMP) land use analysis purposes. Past analyses within Alameda County have used the following criteria to assess roadway segment impacts:
For a roadway segment of the Alameda CTC Congestion Management Program (CMP) Network, the project would cause (a) the LOS to degrade from LOS E or better to LOS F or (b) the V/C ratio to increase 0.02 or more for a roadway segment that would operate at LOS F without the project.
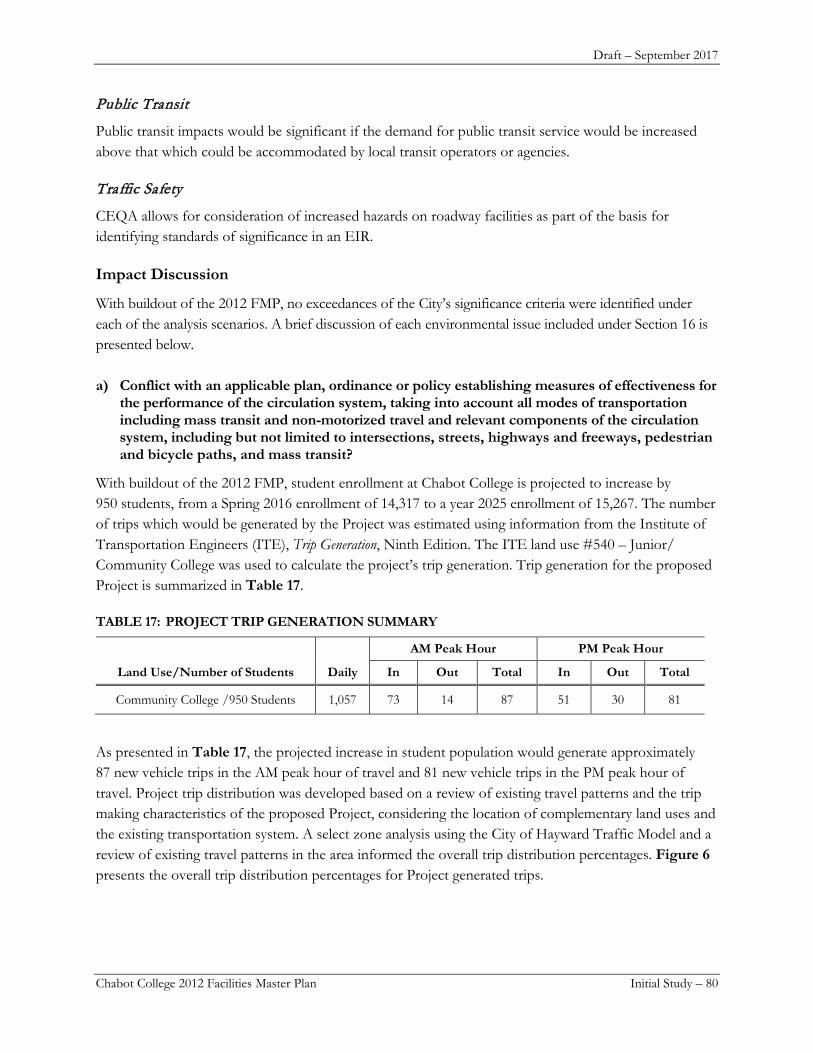
Draft – September 2017
Chabot College 2012 Facilities Master Plan Initial Study – 80
Public Transit
Public transit impacts would be significant if the demand for public transit service would be increased above that which could be accommodated by local transit operators or agencies.
Traffic Safety
CEQA allows for consideration of increased hazards on roadway facilities as part of the basis for identifying standards of significance in an EIR.
Impact Discussion
With buildout of the 2012 FMP, no exceedances of the City’s significance criteria were identified under each of the analysis scenarios. A brief discussion of each environmental issue included under Section 16 is presented below.
a) Conflict with an applicable plan, ordinance or policy establishing measures of effectiveness for the performance of the circulation system, taking into account all modes of transportation including mass transit and non-motorized travel and relevant components of the circulation system, including but not limited to intersections, streets, highways and freeways, pedestrian and bicycle paths, and mass transit?
With buildout of the 2012 FMP, student enrollment at Chabot College is projected to increase by 950 students, from a Spring 2016 enrollment of 14,317 to a year 2025 enrollment of 15,267. The number of trips which would be generated by the Project was estimated using information from the Institute of Transportation Engineers (ITE), Trip Generation, Ninth Edition. The ITE land use #540 – Junior/Community College was used to calculate the project’s trip generation. Trip generation for the proposed Project is summarized in Table 17.
TABLE 17: PROJECT TRIP GENERATION SUMMARY
Land Use/Number of Students Daily
AM Peak Hour PM Peak Hour
In Out Total In Out Total
Community College /950 Students 1,057 73 14 87 51 30 81
As presented in Table 17, the projected increase in student population would generate approximately 87 new vehicle trips in the AM peak hour of travel and 81 new vehicle trips in the PM peak hour of travel. Project trip distribution was developed based on a review of existing travel patterns and the trip making characteristics of the proposed Project, considering the location of complementary land uses and the existing transportation system. A select zone analysis using the City of Hayward Traffic Model and a review of existing travel patterns in the area informed the overall trip distribution percentages. Figure 6 presents the overall trip distribution percentages for Project generated trips.
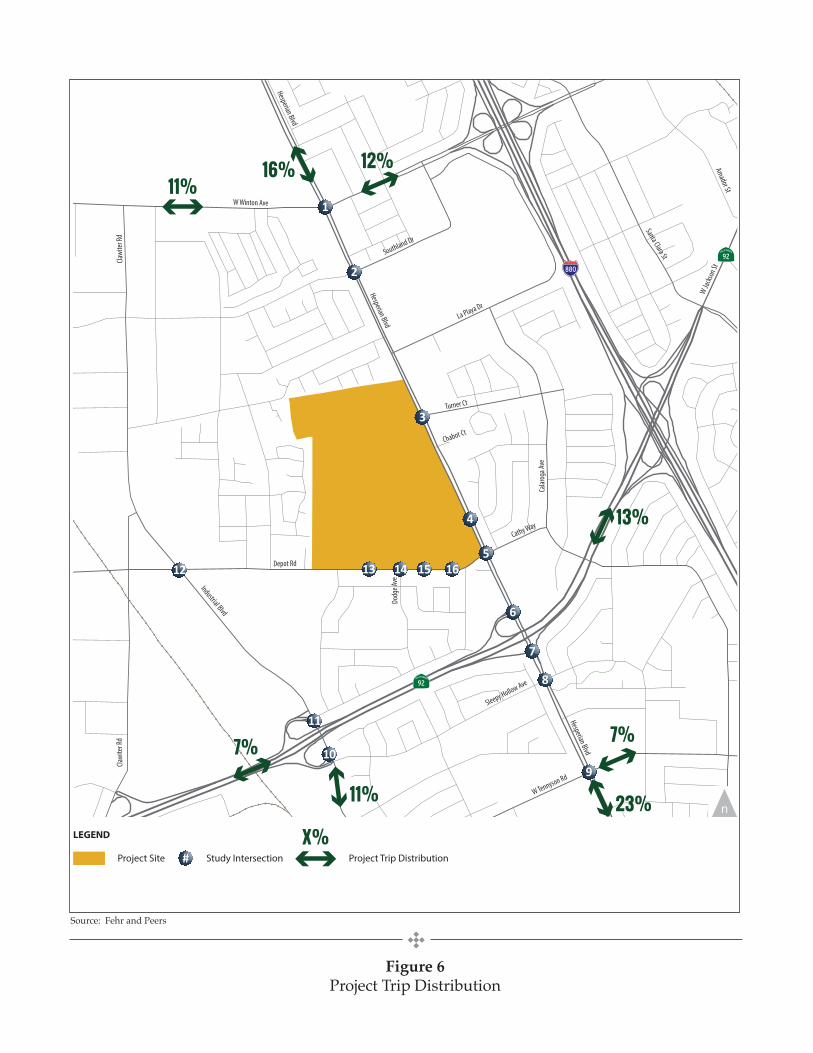
Hesperian Blvd
Clawi
ter R
dCla
wite
r Rd
Depot Rd
Calar
oga A
ve
Industrial Blvd
W Winton Ave
Santa Clara St
Sleepy Hollow Ave
W Tennyson Rd
Turner Ct
La Playa Dr
Southland Dr
Dodg
e Ave
W Ja
ckso
n St
Cathy Way
Chabot Ct
Hesperian Blvd
Hesperian Blvd
Amador St
1
2
3
5
4
6
7
8
910
11
12 13 14 15 16
23%23%
7%7%
11%11%
7%7%
11%11%12%12%16%16%
13%13%
92
92
880
WC16-3350_2_TripDistro
Project Trip Distribution
Figure 2
LEGEND
Project Site Study Intersection Project Trip Distribution#X%X%
Figure 6Project Trip Distribution
Source: Fehr and Peers
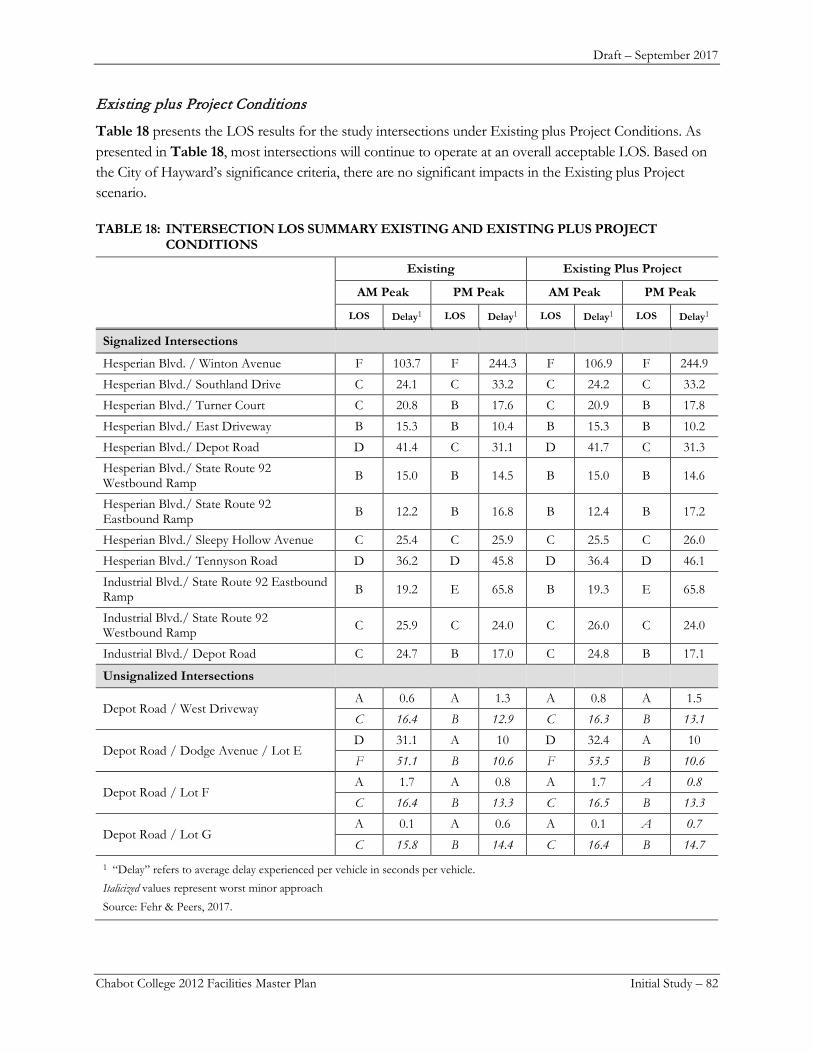
Draft – September 2017
Chabot College 2012 Facilities Master Plan Initial Study – 82
Existing plus Project Conditions
Table 18 presents the LOS results for the study intersections under Existing plus Project Conditions. As presented in Table 18, most intersections will continue to operate at an overall acceptable LOS. Based on the City of Hayward’s significance criteria, there are no significant impacts in the Existing plus Project scenario.
TABLE 18: INTERSECTION LOS SUMMARY EXISTING AND EXISTING PLUS PROJECT CONDITIONS
Existing Existing Plus Project
AM Peak PM Peak AM Peak PM Peak
LOS Delay1 LOS Delay1 LOS Delay1 LOS Delay1
Signalized Intersections
Hesperian Blvd. / Winton Avenue F 103.7 F 244.3 F 106.9 F 244.9
Hesperian Blvd./ Southland Drive C 24.1 C 33.2 C 24.2 C 33.2
Hesperian Blvd./ Turner Court C 20.8 B 17.6 C 20.9 B 17.8
Hesperian Blvd./ East Driveway B 15.3 B 10.4 B 15.3 B 10.2
Hesperian Blvd./ Depot Road D 41.4 C 31.1 D 41.7 C 31.3
Hesperian Blvd./ State Route 92 Westbound Ramp B 15.0 B 14.5 B 15.0 B 14.6
Hesperian Blvd./ State Route 92 Eastbound Ramp B 12.2 B 16.8 B 12.4 B 17.2
Hesperian Blvd./ Sleepy Hollow Avenue C 25.4 C 25.9 C 25.5 C 26.0
Hesperian Blvd./ Tennyson Road D 36.2 D 45.8 D 36.4 D 46.1
Industrial Blvd./ State Route 92 Eastbound Ramp B 19.2 E 65.8 B 19.3 E 65.8
Industrial Blvd./ State Route 92 Westbound Ramp C 25.9 C 24.0 C 26.0 C 24.0
Industrial Blvd./ Depot Road C 24.7 B 17.0 C 24.8 B 17.1
Unsignalized Intersections
Depot Road / West Driveway A 0.6 A 1.3 A 0.8 A 1.5
C 16.4 B 12.9 C 16.3 B 13.1
Depot Road / Dodge Avenue / Lot E D 31.1 A 10 D 32.4 A 10
F 51.1 B 10.6 F 53.5 B 10.6
Depot Road / Lot F A 1.7 A 0.8 A 1.7 A 0.8 C 16.4 B 13.3 C 16.5 B 13.3
Depot Road / Lot G A 0.1 A 0.6 A 0.1 A 0.7 C 15.8 B 14.4 C 16.4 B 14.7
1 “Delay” refers to average delay experienced per vehicle in seconds per vehicle. Italicized values represent worst minor approach Source: Fehr & Peers, 2017.
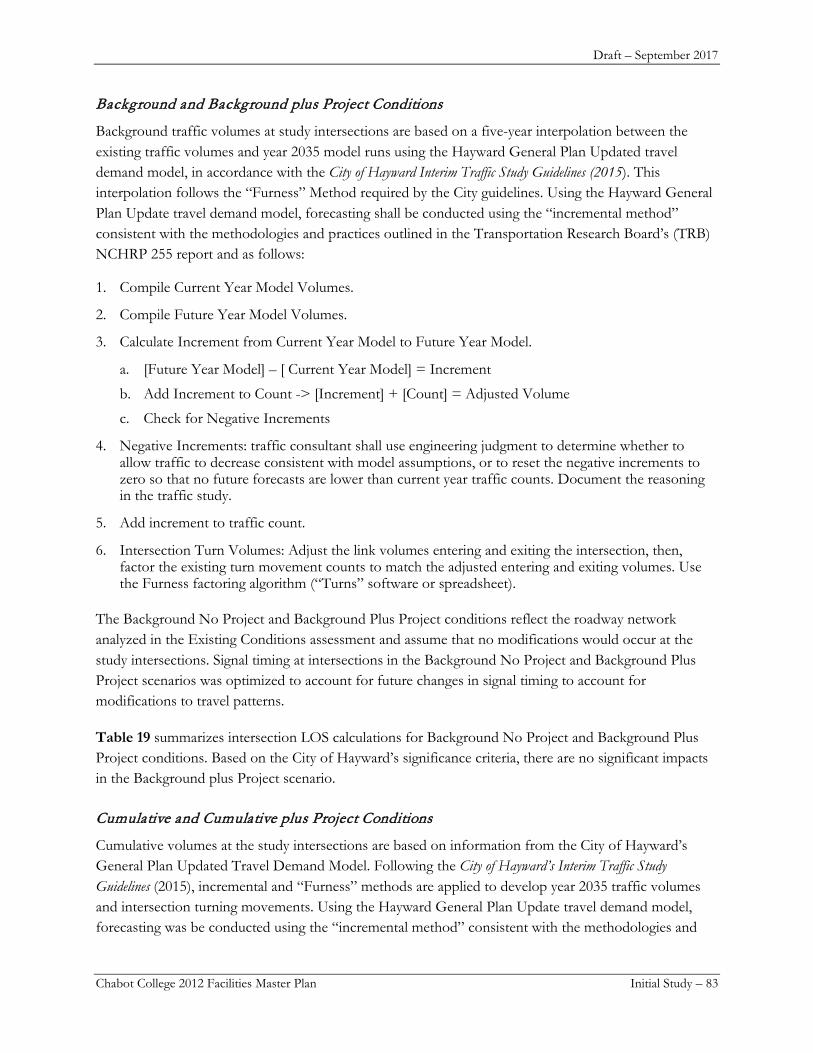
Draft – September 2017
Chabot College 2012 Facilities Master Plan Initial Study – 83
Background and Background plus Project Conditions
Background traffic volumes at study intersections are based on a five-year interpolation between the existing traffic volumes and year 2035 model runs using the Hayward General Plan Updated travel demand model, in accordance with the City of Hayward Interim Traffic Study Guidelines (2015). This interpolation follows the “Furness” Method required by the City guidelines. Using the Hayward General Plan Update travel demand model, forecasting shall be conducted using the “incremental method” consistent with the methodologies and practices outlined in the Transportation Research Board’s (TRB) NCHRP 255 report and as follows:
1. Compile Current Year Model Volumes.
2. Compile Future Year Model Volumes.
3. Calculate Increment from Current Year Model to Future Year Model.
a. [Future Year Model] – [ Current Year Model] = Increment
b. Add Increment to Count -> [Increment] + [Count] = Adjusted Volume
c. Check for Negative Increments
4. Negative Increments: traffic consultant shall use engineering judgment to determine whether to allow traffic to decrease consistent with model assumptions, or to reset the negative increments to zero so that no future forecasts are lower than current year traffic counts. Document the reasoning in the traffic study.
5. Add increment to traffic count.
6. Intersection Turn Volumes: Adjust the link volumes entering and exiting the intersection, then, factor the existing turn movement counts to match the adjusted entering and exiting volumes. Use the Furness factoring algorithm (“Turns” software or spreadsheet).
The Background No Project and Background Plus Project conditions reflect the roadway network analyzed in the Existing Conditions assessment and assume that no modifications would occur at the study intersections. Signal timing at intersections in the Background No Project and Background Plus Project scenarios was optimized to account for future changes in signal timing to account for modifications to travel patterns.
Table 19 summarizes intersection LOS calculations for Background No Project and Background Plus Project conditions. Based on the City of Hayward’s significance criteria, there are no significant impacts in the Background plus Project scenario.
Cumulative and Cumulative plus Project Conditions
Cumulative volumes at the study intersections are based on information from the City of Hayward’s General Plan Updated Travel Demand Model. Following the City of Hayward’s Interim Traffic Study Guidelines (2015), incremental and “Furness” methods are applied to develop year 2035 traffic volumes and intersection turning movements. Using the Hayward General Plan Update travel demand model, forecasting was be conducted using the “incremental method” consistent with the methodologies and
Draft – September 2017
Chabot College 2012 Facilities Master Plan Initial Study – 84
TABLE 19: INTERSECTION LOS SUMMARY BACKGROUND AND BACKGROUND PLUS PROJECT CONDITIONS
Background Background Plus Project
AM Peak PM Peak AM Peak PM Peak
LOS Delay1 LOS Delay1 LOS Delay1 LOS Delay1
Signalized Intersections
Hesperian Blvd. / Winton Avenue F 101.4 F 23.8 F 104.3 F 239.4
Hesperian Blvd./ Southland Drive C 29.5 D 36.3 C 29.8 D 36.4
Hesperian Blvd./ Turner Court C 36.9 B 19.7 C 27.2 B 20.0
Hesperian Blvd./ East Driveway B 16.3 B 11.8 B 16.0 B 11.1
Hesperian Blvd./ Depot Road E 61.4 D 35.4 E 66.3 D 35.6
Hesperian Blvd./ State Route 92 Westbound Ramp D 37.5 B 16.3 D 37.4 B 16.3
Hesperian Blvd./ State Route 92 Eastbound Ramp B 16.9 D 46.8 B 17.3 D 49.8
Hesperian Blvd./ Sleepy Hollow Avenue C 29.0 C 29.9 C 29.2 C 30.0
Hesperian Blvd./ Tennyson Road D 42.5 F 67.6 D 42.7 F 69.0
Industrial Blvd./ State Route 92 Eastbound Ramp C 23.7 F 112.9 C 23.8 F 112.9
Industrial Blvd./ State Route 92 Westbound Ramp D 52.5 D 40.93 D 53.04 D 41.3
Industrial Blvd./ Depot Road C 28.5 B 18.3 C 28.6 B 18.4
Unsignalized Intersections
Depot Road / West Driveway A 0.7 A 1.5 A 0.9 A 1.7
C 17.7 B 13.9 C 17.9 B 14.0
Depot Road / Dodge Avenue / Lot E C 48.8 B 10.8 C 50.6 B 10.8
F 86.8 B 11.7 F 90.8 B 11.7
Depot Road / Lot F A 1.9 A 1.1 A 1.9 A 1.1
C 18.1 B 14.7 C 18.2 B 14.7
Depot Road / Lot G A 0.3 A 0.9 A 0.3 A 0.9
C 17.6 C 15.4 C 17.8 C 15.8
1 “Delay” refers to average delay experienced per vehicle in seconds per vehicle. Italicized values represent worst minor approach Bold values represent impacts
Source: Fehr & Peers, 2017.
Draft – September 2017
Chabot College 2012 Facilities Master Plan Initial Study – 85
practices outlined in the Transportation Research Board’s (TRB) NCHRP 255 report ( NCHRP Report 255, “Highway Traffic Data for Urbanized Area Project Planning and Design”, 2014) as follows:
1. Compile Current Year Model Volumes.
2. Compile Future Year Model Volumes.
3. Calculate Increment from Current Year Model to Future Year Model.
a. [Future Year Model] – [ Current Year Model] = Increment
b. Add Increment to Count -> [Increment] + [Count] = Adjusted Volume
c. Check for Negative Increments
4. Negative Increments: traffic consultant shall use engineering judgment to determine whether to allow traffic to decrease consistent with model assumptions, or to reset the negative increments to zero so that no future forecasts are lower than current year traffic counts. Document the reasoning in the traffic study.
5. Add increment to traffic count.
6. Intersection Turn Volumes: Adjust the link volumes entering and exiting the intersection, then, factor the existing turn movement counts to match the adjusted entering and exiting volumes. Use the Furness factoring algorithm (“Turns” software or spreadsheet).
The Cumulative No Project and Cumulative Plus Project conditions reflect the roadway network analyzed in the Existing Conditions assessment and assume that no modifications would occur at the study intersections. Traffic signal timings at the intersections in the Cumulative No Project and Cumulative Plus Project scenarios were optimized to reflect on-going changes to signal operations to reflect changes in travel patterns.
Based on the City of Hayward’s significance criteria, there are no significant impacts in the Cumulative plus Project scenario as presented in Table 20.
Parking
As illustrated in Table 21, the addition of 950 students to the campus would generate the demand for an additional 200 parking spaces.
The campus currently provides 2,514 spaces for roughly 14,226 students (0.18 spaces per student) without resulting in substantial off-site spillover. With 2012 FMP buildout, the site would provide 0.17 spaces per student (2,514 spaces/14,967 students), which would satisfy future demands.
Neither the City of Hayward Planning and Zoning Code nor the General Plan provide specific information regarding parking space requirements for community colleges. For the purposes of this study the ITE parking demand will be considered adequate for student, staff, and visitor parking requirements.

Draft – September 2017
Chabot College 2012 Facilities Master Plan Initial Study – 86
TABLE 20: INTERSECTION LOS SUMMARY CUMULATIVE AND CUMULATIVE PLUS PROJECT CONDITIONS
Cumulative Cumulative Plus Project
AM Peak PM Peak AM Peak PM Peak
LOS Delay1 LOS Delay1 LOS Delay1 LOS Delay1
Signalized Intersections
Hesperian Blvd. / Winton Avenue F 104.9 F 234.8 F 107.5 F 236.2
Hesperian Blvd./ Southland Drive D 53.8 D 42.0 E 56.0 D 42.2
Hesperian Blvd./ Turner Court D 41.8 C 21.8 D 43.4 C 22.2
Hesperian Blvd./ East Driveway B 18.4 B 13.9 B 18.0 B 12.1
Hesperian Blvd./ Depot Road F 120.4 D 42.7 F 127.9 D 43.0
Hesperian Blvd./ State Route 92 Westbound Ramp F 142.4 B 17.6 F 141.9 B 17.6
Hesperian Blvd./ State Route 92 Eastbound Ramp C 24.6 F 99.0 C 25.93 F 102.1
Hesperian Blvd./ Sleepy Hollow Avenue C 33.8 C 33.5 C 34.1 C 33.6
Hesperian Blvd./ Tennyson Road F 72.2 F 107.9 E 73.4 F 109.5
Industrial Blvd./ State Route 92 Eastbound Ramp C 31.1 F 155.9 C 31.7 F 156.0
Industrial Blvd./ State Route 92 Westbound Ramp F 105.9
7 E 68.9 F 106.4 E 69.4
Industrial Blvd./ Depot Road D 35.4 B 19.4 D 35.4 B 19.5
Unsignalized Intersections
Depot Road / West Driveway A 0.9 A 1.5 B 1.2 A 1.6
C 19.1 B 14.3 C 19.5 B 14.4
Depot Road / Dodge Avenue / Lot E F 66.3 B 11.7 F 68.4 B 11.7
F 121.9 B 12.8 F 125.9 B 12.9
Depot Road / Lot F A 2.2 A 1.5 A 2.2 A 1.5
C 20.7 C 16.7 C 20.8 C 16.7
Depot Road / Lot G A 0.3 A 1.0 A 0.3 A 1.1
C 19.0 C 17.14 C 19.3 C 17.6
1 “Delay” refers to average delay experienced per vehicle in seconds per vehicle. Italicized values represent worst minor approach Bold values represent impacts
Source: Fehr & Peers, 2017.
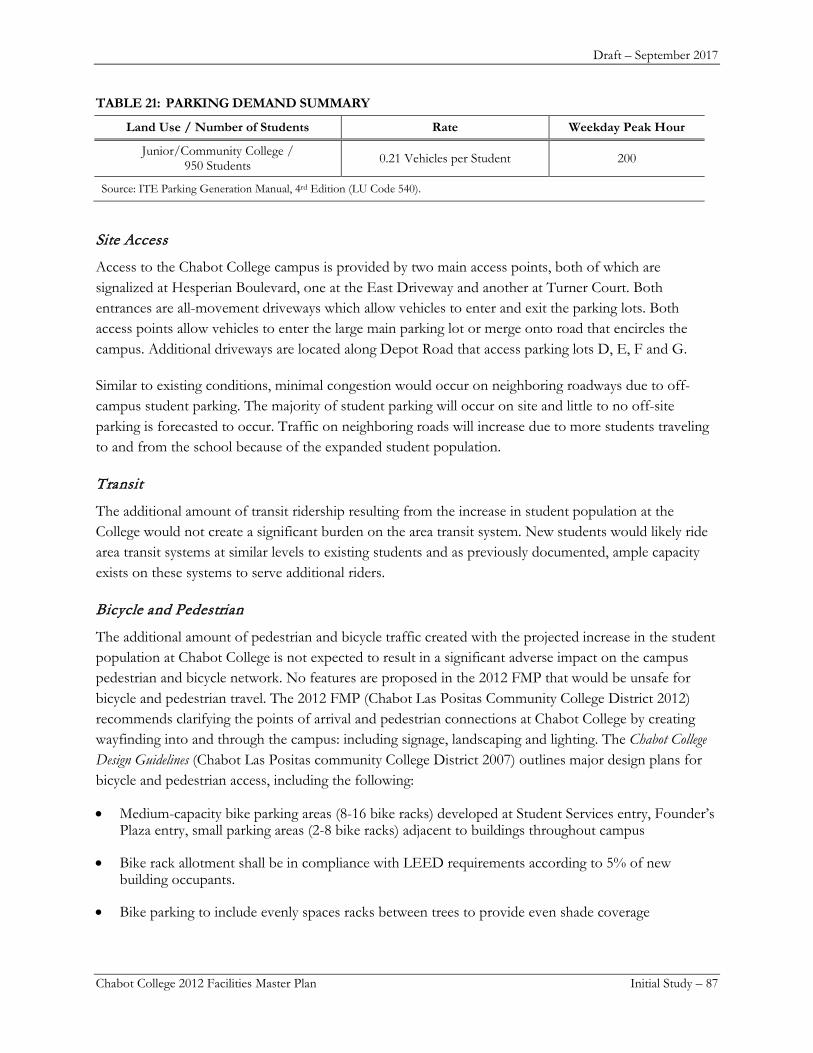
Draft – September 2017
Chabot College 2012 Facilities Master Plan Initial Study – 87
TABLE 21: PARKING DEMAND SUMMARY
Land Use / Number of Students Rate Weekday Peak Hour
Junior/Community College / 950 Students 0.21 Vehicles per Student 200
Source: ITE Parking Generation Manual, 4rd Edition (LU Code 540).
Site Access
Access to the Chabot College campus is provided by two main access points, both of which are signalized at Hesperian Boulevard, one at the East Driveway and another at Turner Court. Both entrances are all-movement driveways which allow vehicles to enter and exit the parking lots. Both access points allow vehicles to enter the large main parking lot or merge onto road that encircles the campus. Additional driveways are located along Depot Road that access parking lots D, E, F and G.
Similar to existing conditions, minimal congestion would occur on neighboring roadways due to off-campus student parking. The majority of student parking will occur on site and little to no off-site parking is forecasted to occur. Traffic on neighboring roads will increase due to more students traveling to and from the school because of the expanded student population.
Transit
The additional amount of transit ridership resulting from the increase in student population at the College would not create a significant burden on the area transit system. New students would likely ride area transit systems at similar levels to existing students and as previously documented, ample capacity exists on these systems to serve additional riders.
Bicycle and Pedestrian
The additional amount of pedestrian and bicycle traffic created with the projected increase in the student population at Chabot College is not expected to result in a significant adverse impact on the campus pedestrian and bicycle network. No features are proposed in the 2012 FMP that would be unsafe for bicycle and pedestrian travel. The 2012 FMP (Chabot Las Positas Community College District 2012) recommends clarifying the points of arrival and pedestrian connections at Chabot College by creating wayfinding into and through the campus: including signage, landscaping and lighting. The Chabot College Design Guidelines (Chabot Las Positas community College District 2007) outlines major design plans for bicycle and pedestrian access, including the following:
• Medium-capacity bike parking areas (8-16 bike racks) developed at Student Services entry, Founder’s Plaza entry, small parking areas (2-8 bike racks) adjacent to buildings throughout campus
• Bike rack allotment shall be in compliance with LEED requirements according to 5% of new building occupants.
• Bike parking to include evenly spaces racks between trees to provide even shade coverage
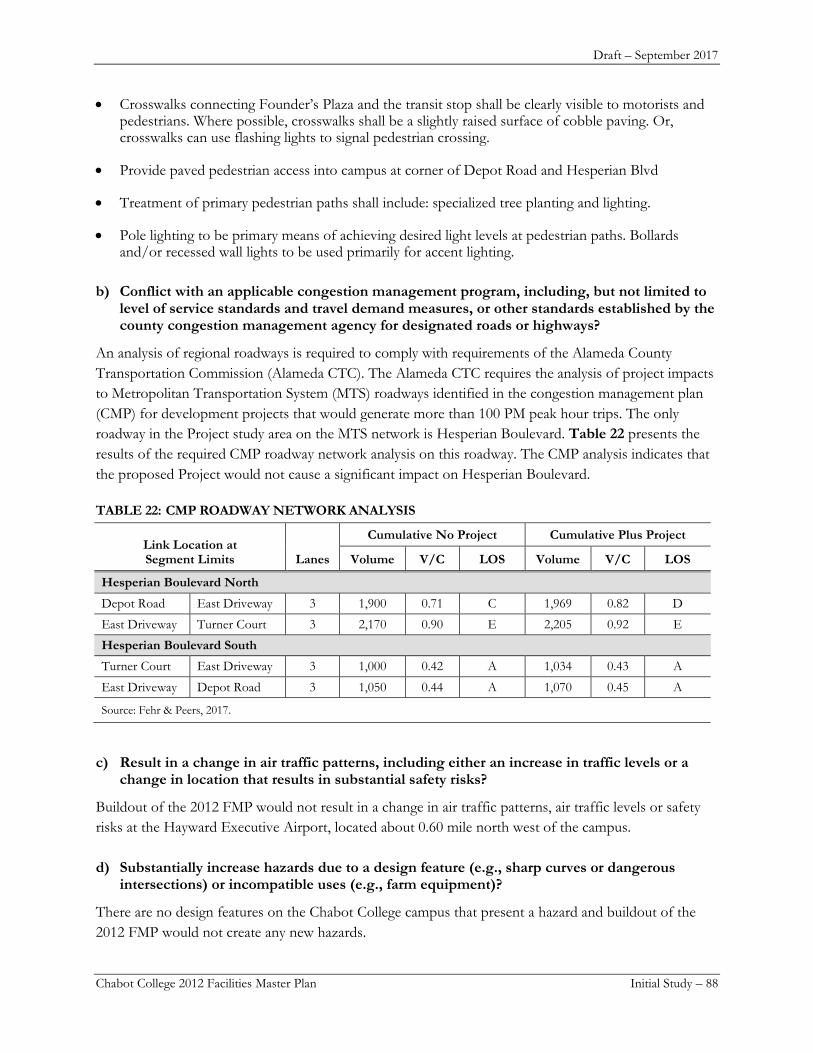
Draft – September 2017
Chabot College 2012 Facilities Master Plan Initial Study – 88
• Crosswalks connecting Founder’s Plaza and the transit stop shall be clearly visible to motorists and pedestrians. Where possible, crosswalks shall be a slightly raised surface of cobble paving. Or, crosswalks can use flashing lights to signal pedestrian crossing.
• Provide paved pedestrian access into campus at corner of Depot Road and Hesperian Blvd
• Treatment of primary pedestrian paths shall include: specialized tree planting and lighting.
• Pole lighting to be primary means of achieving desired light levels at pedestrian paths. Bollards and/or recessed wall lights to be used primarily for accent lighting.
b) Conflict with an applicable congestion management program, including, but not limited to level of service standards and travel demand measures, or other standards established by the county congestion management agency for designated roads or highways?
An analysis of regional roadways is required to comply with requirements of the Alameda County Transportation Commission (Alameda CTC). The Alameda CTC requires the analysis of project impacts to Metropolitan Transportation System (MTS) roadways identified in the congestion management plan (CMP) for development projects that would generate more than 100 PM peak hour trips. The only roadway in the Project study area on the MTS network is Hesperian Boulevard. Table 22 presents the results of the required CMP roadway network analysis on this roadway. The CMP analysis indicates that the proposed Project would not cause a significant impact on Hesperian Boulevard.
TABLE 22: CMP ROADWAY NETWORK ANALYSIS
Link Location at Segment Limits Lanes
Cumulative No Project Cumulative Plus Project
Volume V/C LOS Volume V/C LOS
Hesperian Boulevard North Depot Road East Driveway 3 1,900 0.71 C 1,969 0.82 D
East Driveway Turner Court 3 2,170 0.90 E 2,205 0.92 E
Hesperian Boulevard South Turner Court East Driveway 3 1,000 0.42 A 1,034 0.43 A
East Driveway Depot Road 3 1,050 0.44 A 1,070 0.45 A
Source: Fehr & Peers, 2017.
c) Result in a change in air traffic patterns, including either an increase in traffic levels or a change in location that results in substantial safety risks?
Buildout of the 2012 FMP would not result in a change in air traffic patterns, air traffic levels or safety risks at the Hayward Executive Airport, located about 0.60 mile north west of the campus.
d) Substantially increase hazards due to a design feature (e.g., sharp curves or dangerous intersections) or incompatible uses (e.g., farm equipment)?
There are no design features on the Chabot College campus that present a hazard and buildout of the 2012 FMP would not create any new hazards.
Draft – September 2017
Chabot College 2012 Facilities Master Plan Initial Study – 89
e) Result in inadequate emergency access?
The Chabot College campus would continue to provide adequate emergency service access. Buildout of the 2012 FMP would not affect emergency access to the site.
f) Conflict with adopted policies, plans, or programs regarding public transit, bicycle, or pedestrian facilities, or otherwise decrease the performance or safety of such facilities?
Transit The additional amount of transit ridership produced by the projected increase in student population on the Chabot College would not result in a significant adverse impact on the area transit system. Potential increases in ridership resulting from the increase in student population are not expected to result in the exceedances of available capacities on area transit facilities.
Bicycle and Pedestrian The additional amount of pedestrian and bicycle traffic produced by increased student population on the Chabot College would not result in significant adverse impacts on the site’s pedestrian and bicycle network. No features are proposed by the project which would be unsafe for bicycle and pedestrian travel. The 2012 FMP will improve the pedestrian circulation and bicycle system on the campus with the proposed comprehensive wayfinding program.
Mitigation Measures
None required.
References Chabot Las Positas Community College District. 2012. Prepared by Steinberg Architects. July 17, 2012.
Chabot Las Positas Community College District. 2007. Chabot College Design Guidelines. Prepared by Royston Hanamoto Alley & Abey and Carducci & Associates Inc., August 3, 2007.
City of Hayward. Hayward 2040 General Plan. Available on the City’s website at: www.hayward2040generalplan.com.
City of Hayward Interim Traffic Study Guidelines, 2015.
Highway Capacity Manual, 2000.
ITE Trip Generation Manual, 9th Edition, 2012.
ITE Parking Generation Manual, 4th Edition, 2010.
NCHRP Report 255, “Highway Traffic Data for Urbanized Area Project Planning and Design”, 2014.
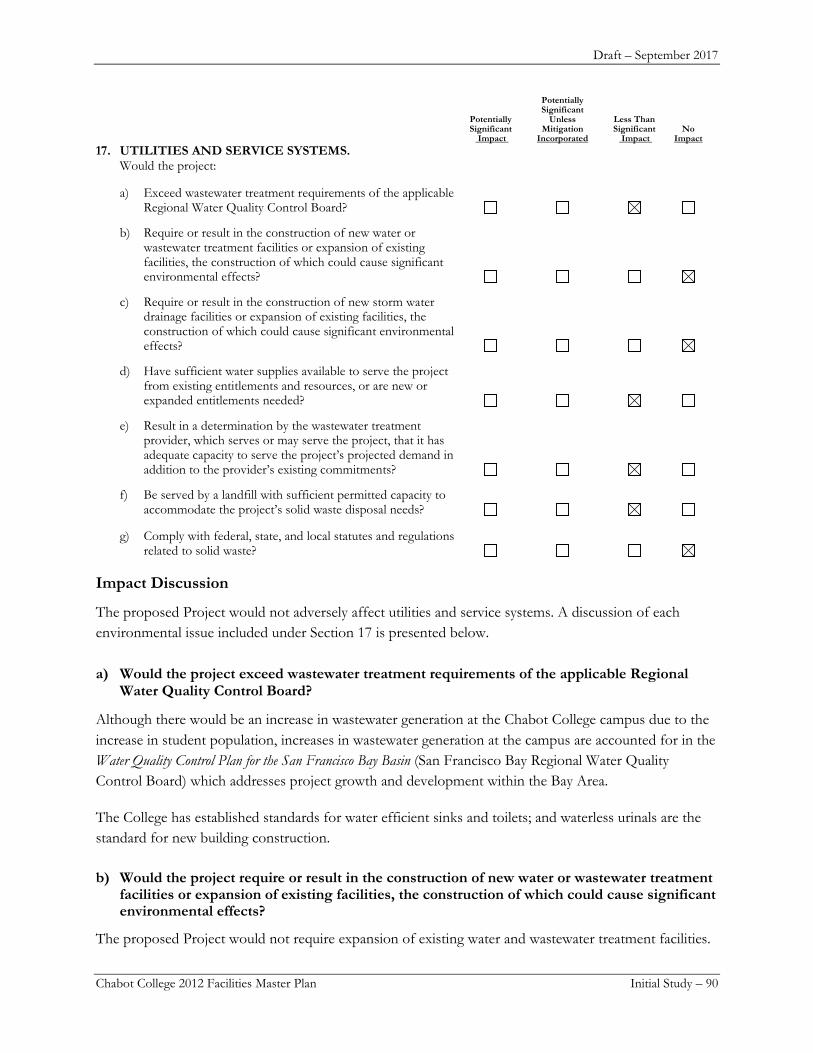
Draft – September 2017
Chabot College 2012 Facilities Master Plan Initial Study – 90
Potentially Significant Potentially Unless Less Than Significant Mitigation Significant No Impact Incorporated Impact Impact 17. UTILITIES AND SERVICE SYSTEMS.
Would the project:
a) Exceed wastewater treatment requirements of the applicable Regional Water Quality Control Board?
b) Require or result in the construction of new water or wastewater treatment facilities or expansion of existing facilities, the construction of which could cause significant environmental effects?
c) Require or result in the construction of new storm water drainage facilities or expansion of existing facilities, the construction of which could cause significant environmental effects?
d) Have sufficient water supplies available to serve the project from existing entitlements and resources, or are new or expanded entitlements needed?
e) Result in a determination by the wastewater treatment provider, which serves or may serve the project, that it has adequate capacity to serve the project’s projected demand in addition to the provider’s existing commitments?
f) Be served by a landfill with sufficient permitted capacity to accommodate the project’s solid waste disposal needs?
g) Comply with federal, state, and local statutes and regulations related to solid waste?
Impact Discussion
The proposed Project would not adversely affect utilities and service systems. A discussion of each environmental issue included under Section 17 is presented below.
a) Would the project exceed wastewater treatment requirements of the applicable Regional Water Quality Control Board?
Although there would be an increase in wastewater generation at the Chabot College campus due to the increase in student population, increases in wastewater generation at the campus are accounted for in the Water Quality Control Plan for the San Francisco Bay Basin (San Francisco Bay Regional Water Quality Control Board) which addresses project growth and development within the Bay Area.
The College has established standards for water efficient sinks and toilets; and waterless urinals are the standard for new building construction.
b) Would the project require or result in the construction of new water or wastewater treatment facilities or expansion of existing facilities, the construction of which could cause significant environmental effects?
The proposed Project would not require expansion of existing water and wastewater treatment facilities.
Draft – September 2017
Chabot College 2012 Facilities Master Plan Initial Study – 91
c) Would the project require or result in the construction of new storm water drainage facilities or expansion of existing facilities, the construction of which could cause significant environmental effects?
As discussed in Section 9 Hydrology and Water Quality, the Project would not require the expansion of existing storm water drainage facilities or the construction of new facilities.
d) Would the project have sufficient water supplies available to serve the project from existing entitlements and resources, or are new or expanded entitlements needed?
With the projected increase in student population on the campus over the next ten years, there would be an increase in water consumption at the campus. However, there would be sufficient water supplies to serve Chabot College.
Chabot College has initiated a comprehensive system to conserve water on the campus: reclaimed water is used for lawns and landscaping and weather sensor systems have been installed to maximize water efficiency throughout the year; and reclaimed water replaces domestic potable water in toilets.
e) Would the project result in a determination by the wastewater treatment provider, which serves or may serve the project’s projected demand in addition to the provider’s existing commitments?
With the projected increase in student population on the campus over the next ten years, there would be an increase in wastewater generation at the campus. However, there would be sufficient capacity in the Hayward Water Pollution Control Facility to serve Chabot College.
f) Would the project be served by a landfill with sufficient permitted capacity to accommodate the project’s solid waste disposal needs?
Construction waste would be transported to a landfill with adequate capacity, most likely either Altamont Landfill or Vasco Landfill. Garbage service is provided by Alameda County Waste Management.
Chabot College has an integrated waste management system that includes on-site composting of organic material, construction waste diversion and single-stream recycling. To improve waste management through better separation of construction debris, trash and dirt fill generated during current and future construction activity, the College requires construction bid documents include a “Debris Recycling Statement” Through this program, overall waste diversion of construction debris has been as high as 83.9 percent (Chabot Las Positas Community College District. 2010).
g) Comply with federal, state, and local statutes and regulations related to solid waste?
The Project will comply with Federal, State and local statutes and regulations related to solid waste.
Mitigation Measures
None required.
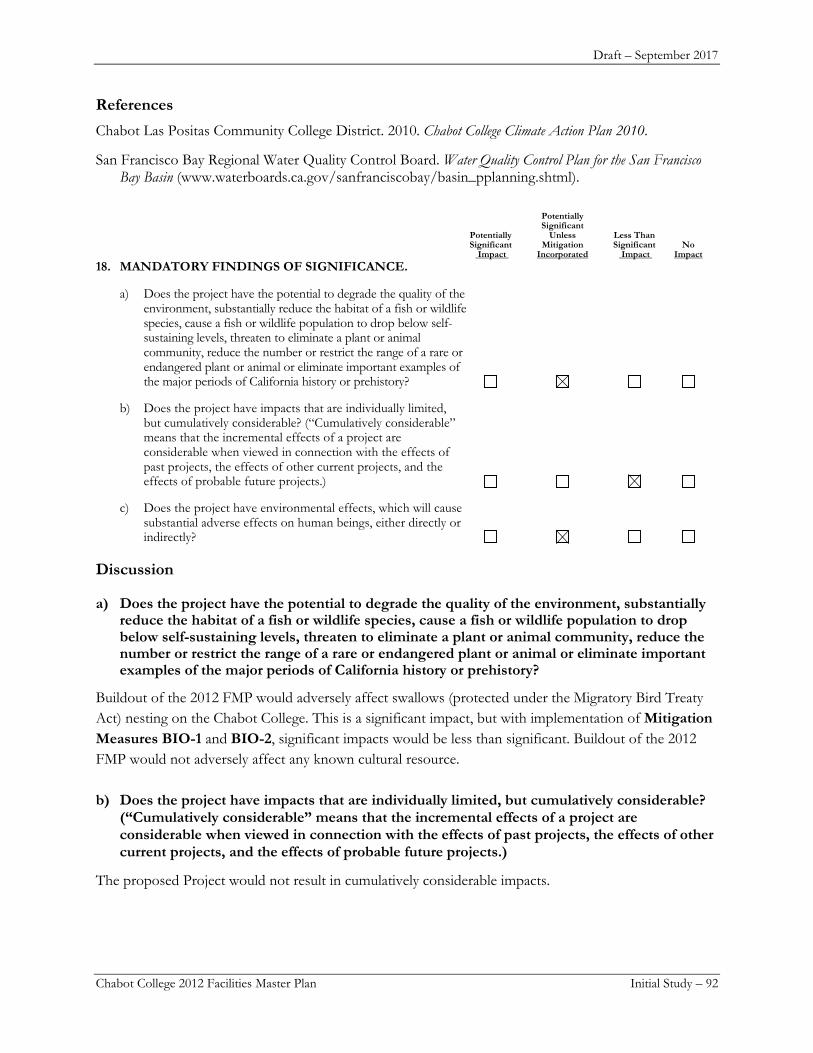
Draft – September 2017
Chabot College 2012 Facilities Master Plan Initial Study – 92
References Chabot Las Positas Community College District. 2010. Chabot College Climate Action Plan 2010.
San Francisco Bay Regional Water Quality Control Board. Water Quality Control Plan for the San Francisco Bay Basin (www.waterboards.ca.gov/sanfranciscobay/basin_pplanning.shtml).
Potentially Significant Potentially Unless Less Than Significant Mitigation Significant No Impact Incorporated Impact Impact 18. MANDATORY FINDINGS OF SIGNIFICANCE.
a) Does the project have the potential to degrade the quality of the environment, substantially reduce the habitat of a fish or wildlife species, cause a fish or wildlife population to drop below self-sustaining levels, threaten to eliminate a plant or animal community, reduce the number or restrict the range of a rare or endangered plant or animal or eliminate important examples of the major periods of California history or prehistory?
b) Does the project have impacts that are individually limited, but cumulatively considerable? (“Cumulatively considerable” means that the incremental effects of a project are considerable when viewed in connection with the effects of past projects, the effects of other current projects, and the effects of probable future projects.)
c) Does the project have environmental effects, which will cause substantial adverse effects on human beings, either directly or indirectly?
Discussion
a) Does the project have the potential to degrade the quality of the environment, substantially reduce the habitat of a fish or wildlife species, cause a fish or wildlife population to drop below self-sustaining levels, threaten to eliminate a plant or animal community, reduce the number or restrict the range of a rare or endangered plant or animal or eliminate important examples of the major periods of California history or prehistory?
Buildout of the 2012 FMP would adversely affect swallows (protected under the Migratory Bird Treaty Act) nesting on the Chabot College. This is a significant impact, but with implementation of Mitigation Measures BIO-1 and BIO-2, significant impacts would be less than significant. Buildout of the 2012 FMP would not adversely affect any known cultural resource.
b) Does the project have impacts that are individually limited, but cumulatively considerable? (“Cumulatively considerable” means that the incremental effects of a project are considerable when viewed in connection with the effects of past projects, the effects of other current projects, and the effects of probable future projects.)
The proposed Project would not result in cumulatively considerable impacts.
Draft – September 2017
Chabot College 2012 Facilities Master Plan Initial Study – 93
c) Does the project have environmental effects, which will cause substantial adverse effects on human beings, either directly or indirectly?
Lighting would be installed around the existing baseball field, this represents a potentially significant light and glare impact, but with implementation of Mitigation Measure AES-1, impacts would be less than significant. The proposed Project could result in potentially significant air quality and noise/vibration construction impacts, but with implementation of Mitigation Measure AIR-1 and Mitigation Measure NOISE-1 and Mitigation Measure NOISE-2 air and noise construction impacts would be less than significant. The campus could experience strong seismic ground shaking and near surface soils expansive in nature are known to be present on the campus and represents potentially significant impacts, but with implementation of Mitigation Measure GEO-1, impacts would be less than significant. There is the potential for the presence of asbestos and lead-based paint in buildings proposed for demolition and impacted soils which are potentially significant impacts, however, Mitigation Measure HAZ-1 and Mitigation Measure HAZ-2, will adequately address potentially significant impacts associated with hazardous materials present in the buildings or soil.
Draft – September 2017
Chabot College 2012 Facilities Master Plan Initial Study – 94
AGENCY DISTRIBUTION LIST
Bay Area Air Quality Mgt. District 375 Beale Street, Suite 600 San Francisco, CA, 94105
Sara Buizer Planning Division City of Hayward 777 B Street Hayward, CA 94541
Fred Kelley Transportation Division City of Hayward 777 B Street Hayward, CA 94541
Christine Boschen, Program Mgr. Stormwater - S.F. Bay Regional Water Quality Control Board 1515 Clay Street, Suite 1400 Oakland, CA 94612
Fred Hertzel, Municipal Phase II S.F. Bay Regional Water Quality Control Board 1515 Clay Street, Suite 1400 Oakland, CA 94612
Marcia Grefsrud Bay Delta Region Calif. Dept. of Fish & Wildlife 7329 Silverado Trail Napa, CA 94558
Alameda County Clerk 1106 Madison Street Oakland, CA 94607
California State Clearinghouse 1400 10th Street, #12 Sacramento, CA 95814
Draft – September 2017
Chabot College 2012 Facilities Master Plan Initial Study – A-1
APPENDIX A TRANSPORTATION MODELING DATA

Appendix A:
Synchro Reports

HCM Signalized Intersection Capacity Analysis1: Hesperian Blvd & Winton Ave 7/14/2017
Existing AM Synchro 8 ReportPage 1
Movement EBL EBT EBR WBL WBT WBR NBL NBT NBR SBL SBT SBRLane ConfigurationsVolume (vph) 238 346 63 385 898 123 48 617 144 129 1336 1156Ideal Flow (vphpl) 1900 1900 1900 1900 1900 1900 1900 1900 1900 1900 1900 1900Total Lost time (s) 4.0 4.0 4.0 4.0 4.0 4.0 4.0 4.0 4.0 4.0 2.5Lane Util. Factor 0.97 0.91 1.00 0.95 1.00 1.00 0.91 1.00 0.97 0.91 1.00Frpb, ped/bikes 1.00 1.00 1.00 1.00 0.98 1.00 1.00 0.98 1.00 1.00 0.99Flpb, ped/bikes 1.00 1.00 1.00 1.00 1.00 1.00 1.00 1.00 1.00 1.00 1.00Frt 1.00 0.98 1.00 1.00 0.85 1.00 1.00 0.85 1.00 1.00 0.85Flt Protected 0.95 1.00 0.95 1.00 1.00 0.95 1.00 1.00 0.95 1.00 1.00Satd. Flow (prot) 3433 4950 1770 3539 1551 1770 5085 1551 3433 5085 1562Flt Permitted 0.95 1.00 0.95 1.00 1.00 0.95 1.00 1.00 0.95 1.00 1.00Satd. Flow (perm) 3433 4950 1770 3539 1551 1770 5085 1551 3433 5085 1562Peak-hour factor, PHF 0.98 0.98 0.98 0.98 0.98 0.98 0.98 0.98 0.98 0.98 0.98 0.98Adj. Flow (vph) 243 353 64 393 916 126 49 630 147 132 1363 1180RTOR Reduction (vph) 0 18 0 0 0 83 0 0 74 0 0 0Lane Group Flow (vph) 243 399 0 393 916 43 49 630 73 132 1363 1180Confl. Peds. (#/hr) 6 10 10 6 4 7 7 4Turn Type Prot NA Prot NA Perm Prot NA Perm Prot NA FreeProtected Phases 3 8 7 4 5 2 1 6Permitted Phases 4 2 FreeActuated Green, G (s) 8.5 34.5 10.5 36.5 36.5 5.2 70.8 70.8 9.2 74.8 145.0Effective Green, g (s) 9.0 36.0 11.0 38.0 38.0 5.7 72.3 72.3 9.7 76.3 145.0Actuated g/C Ratio 0.06 0.25 0.08 0.26 0.26 0.04 0.50 0.50 0.07 0.53 1.00Clearance Time (s) 4.5 5.5 4.5 5.5 5.5 4.5 5.5 5.5 4.5 5.5Vehicle Extension (s) 3.0 3.0 3.0 3.0 3.0 3.0 3.0 3.0 3.0 3.0Lane Grp Cap (vph) 213 1228 134 927 406 69 2535 773 229 2675 1562v/s Ratio Prot 0.07 0.08 c0.22 c0.26 0.03 0.12 0.04 0.27v/s Ratio Perm 0.03 0.05 c0.76v/c Ratio 1.14 0.32 2.93 0.99 0.10 0.71 0.25 0.09 0.58 0.51 0.76Uniform Delay, d1 68.0 44.6 67.0 53.3 40.6 68.8 20.8 19.1 65.7 22.2 0.0Progression Factor 1.00 1.00 1.00 1.00 1.00 1.00 1.00 1.00 1.00 1.00 1.00Incremental Delay, d2 104.8 0.2 889.7 26.4 0.1 29.0 0.2 0.2 3.5 0.7 3.5Delay (s) 172.8 44.7 956.7 79.6 40.7 97.8 21.0 19.4 69.1 22.9 3.5Level of Service F D F E D F C B E C AApproach Delay (s) 91.9 316.4 25.3 16.6Approach LOS F F C B
Intersection SummaryHCM 2000 Control Delay 103.7 HCM 2000 Level of Service FHCM 2000 Volume to Capacity ratio 1.07Actuated Cycle Length (s) 145.0 Sum of lost time (s) 16.0Intersection Capacity Utilization 84.3% ICU Level of Service EAnalysis Period (min) 15c Critical Lane Group
HCM Signalized Intersection Capacity Analysis2: Hesperian Blvd & Southland Drive 7/14/2017
Existing AM Synchro 8 ReportPage 2
Movement EBL EBT EBR WBL WBT WBR NBL NBT NBR SBL SBT SBRLane ConfigurationsVolume (vph) 80 126 46 231 364 22 54 718 90 52 1463 263Ideal Flow (vphpl) 1900 1900 1900 1900 1900 1900 1900 1900 1900 1900 1900 1900Total Lost time (s) 4.0 4.0 4.0 4.0 4.0 4.0 4.0 4.0Lane Util. Factor 1.00 0.95 1.00 0.91 1.00 0.91 1.00 0.91Frpb, ped/bikes 1.00 0.99 1.00 1.00 1.00 1.00 1.00 1.00Flpb, ped/bikes 1.00 1.00 0.99 1.00 1.00 1.00 1.00 1.00Frt 1.00 0.96 1.00 0.99 1.00 0.98 1.00 0.98Flt Protected 0.95 1.00 0.95 1.00 0.95 1.00 0.95 1.00Satd. Flow (prot) 1768 3371 1746 5038 1770 4993 1770 4956Flt Permitted 0.44 1.00 0.62 1.00 0.95 1.00 0.95 1.00Satd. Flow (perm) 827 3371 1147 5038 1770 4993 1770 4956Peak-hour factor, PHF 0.94 0.94 0.94 0.94 0.94 0.94 0.94 0.94 0.94 0.94 0.94 0.94Adj. Flow (vph) 85 134 49 246 387 23 57 764 96 55 1556 280RTOR Reduction (vph) 0 36 0 0 7 0 0 12 0 0 19 0Lane Group Flow (vph) 85 147 0 246 403 0 57 848 0 55 1817 0Confl. Peds. (#/hr) 2 16 16 2 4 1 1 4Confl. Bikes (#/hr) 1 1Turn Type Perm NA Perm NA Prot NA Prot NAProtected Phases 8 4 1 6 5 2Permitted Phases 8 4Actuated Green, G (s) 29.1 29.1 29.1 29.1 7.3 61.2 7.1 61.0Effective Green, g (s) 29.1 29.1 29.1 29.1 7.3 61.8 7.1 61.6Actuated g/C Ratio 0.26 0.26 0.26 0.26 0.07 0.56 0.06 0.56Clearance Time (s) 4.0 4.0 4.0 4.0 4.0 4.6 4.0 4.6Vehicle Extension (s) 3.0 3.0 3.0 3.0 3.0 3.0 3.0 3.0Lane Grp Cap (vph) 218 891 303 1332 117 2805 114 2775v/s Ratio Prot 0.04 0.08 c0.03 0.17 0.03 c0.37v/s Ratio Perm 0.10 c0.21v/c Ratio 0.39 0.16 0.81 0.30 0.49 0.30 0.48 0.65Uniform Delay, d1 33.2 31.1 37.9 32.3 49.5 12.7 49.7 16.8Progression Factor 1.00 1.00 1.00 1.00 0.86 1.48 1.00 1.00Incremental Delay, d2 1.2 0.1 15.1 0.1 3.1 0.3 3.2 1.2Delay (s) 34.3 31.2 53.0 32.5 45.5 19.2 52.9 18.0Level of Service C C D C D B D BApproach Delay (s) 32.2 40.2 20.8 19.0Approach LOS C D C B
Intersection SummaryHCM 2000 Control Delay 24.1 HCM 2000 Level of Service CHCM 2000 Volume to Capacity ratio 0.69Actuated Cycle Length (s) 110.0 Sum of lost time (s) 12.0Intersection Capacity Utilization 80.1% ICU Level of Service DAnalysis Period (min) 15c Critical Lane Group

HCM Signalized Intersection Capacity Analysis3: Hesperian Blvd & Turner Court 7/14/2017
Existing AM Synchro 8 ReportPage 3
Movement EBL EBT EBR WBL WBT WBR NBL NBT NBR SBL SBT SBRLane ConfigurationsVolume (vph) 60 7 23 67 60 58 112 696 38 92 1347 418Ideal Flow (vphpl) 1900 1900 1900 1900 1900 1900 1900 1900 1900 1900 1900 1900Total Lost time (s) 4.0 4.0 4.0 4.6 4.0 4.0 4.0 4.0Lane Util. Factor 1.00 1.00 1.00 1.00 1.00 0.91 1.00 0.91Frpb, ped/bikes 1.00 0.96 1.00 0.99 1.00 1.00 1.00 0.99Flpb, ped/bikes 1.00 1.00 0.98 1.00 1.00 1.00 1.00 1.00Frt 1.00 0.88 1.00 0.85 1.00 0.99 1.00 0.96Flt Protected 0.95 1.00 0.97 1.00 0.95 1.00 0.95 1.00Satd. Flow (prot) 1768 1580 1777 1561 1770 5032 1770 4854Flt Permitted 0.54 1.00 0.82 1.00 0.95 1.00 0.95 1.00Satd. Flow (perm) 1005 1580 1497 1561 1770 5032 1770 4854Peak-hour factor, PHF 0.94 0.94 0.94 0.94 0.94 0.94 0.94 0.94 0.94 0.94 0.94 0.94Adj. Flow (vph) 64 7 24 71 64 62 119 740 40 98 1433 445RTOR Reduction (vph) 0 20 0 0 0 52 0 4 0 0 32 0Lane Group Flow (vph) 64 11 0 0 135 10 119 776 0 98 1846 0Confl. Peds. (#/hr) 1 40 40 1 10 19 19 10Turn Type Perm NA Perm NA Perm Prot NA Prot NAProtected Phases 4 8 1 6 5 2Permitted Phases 4 8 8Actuated Green, G (s) 17.2 17.2 17.2 17.2 12.7 69.1 10.5 66.9Effective Green, g (s) 17.8 17.8 17.8 17.2 12.7 69.7 10.5 67.5Actuated g/C Ratio 0.16 0.16 0.16 0.16 0.12 0.63 0.10 0.61Clearance Time (s) 4.6 4.6 4.6 4.6 4.0 4.6 4.0 4.6Vehicle Extension (s) 3.0 3.0 3.0 3.0 3.0 3.0 3.0 3.0Lane Grp Cap (vph) 162 255 242 244 204 3188 168 2978v/s Ratio Prot 0.01 c0.07 0.15 0.06 c0.38v/s Ratio Perm 0.06 c0.09 0.01v/c Ratio 0.40 0.04 0.56 0.04 0.58 0.24 0.58 0.62Uniform Delay, d1 41.3 38.9 42.5 39.4 46.1 8.7 47.7 13.3Progression Factor 1.00 1.00 1.00 1.00 1.00 1.00 0.79 1.40Incremental Delay, d2 1.6 0.1 2.8 0.1 4.2 0.2 4.1 0.8Delay (s) 42.9 39.0 45.3 39.5 50.3 8.9 41.9 19.3Level of Service D D D D D A D BApproach Delay (s) 41.6 43.4 14.4 20.4Approach LOS D D B C
Intersection SummaryHCM 2000 Control Delay 20.8 HCM 2000 Level of Service CHCM 2000 Volume to Capacity ratio 0.60Actuated Cycle Length (s) 110.0 Sum of lost time (s) 12.0Intersection Capacity Utilization 74.1% ICU Level of Service DAnalysis Period (min) 15c Critical Lane Group

HCM Signalized Intersection Capacity Analysis4: Hesperian Blvd & East Driveway 7/14/2017
Existing AM Synchro 8 ReportPage 4
Movement EBL EBR NBL NBT SBU SBT SBRLane ConfigurationsVolume (vph) 63 90 174 800 11 1211 266Ideal Flow (vphpl) 1900 1900 1900 1900 1900 1900 1900Total Lost time (s) 4.0 4.0 4.0 4.0 4.0 4.0Lane Util. Factor 1.00 1.00 1.00 0.91 1.00 0.91Frpb, ped/bikes 1.00 0.98 1.00 1.00 1.00 1.00Flpb, ped/bikes 1.00 1.00 1.00 1.00 1.00 1.00Frt 1.00 0.85 1.00 1.00 1.00 0.97Flt Protected 0.95 1.00 0.95 1.00 0.95 1.00Satd. Flow (prot) 1770 1555 1770 5085 1770 4927Flt Permitted 0.95 1.00 0.95 1.00 0.95 1.00Satd. Flow (perm) 1770 1555 1770 5085 1770 4927Peak-hour factor, PHF 0.95 0.95 0.95 0.95 0.95 0.95 0.95Adj. Flow (vph) 66 95 183 842 12 1275 280RTOR Reduction (vph) 0 86 0 0 0 26 0Lane Group Flow (vph) 66 9 183 842 12 1529 0Confl. Peds. (#/hr) 4 1 5 1Turn Type Prot Perm Prot NA Prot NAProtected Phases 4 1 6 5 2Permitted Phases 4Actuated Green, G (s) 12.9 12.9 22.2 101.1 3.0 81.9Effective Green, g (s) 12.9 12.9 22.2 102.1 3.0 82.9Actuated g/C Ratio 0.10 0.10 0.17 0.79 0.02 0.64Clearance Time (s) 4.0 4.0 4.0 5.0 4.0 5.0Vehicle Extension (s) 3.0 3.0 3.0 3.0 3.0 3.0Lane Grp Cap (vph) 175 154 302 3993 40 3141v/s Ratio Prot c0.04 c0.10 0.17 0.01 c0.31v/s Ratio Perm 0.01v/c Ratio 0.38 0.06 0.61 0.21 0.30 0.49Uniform Delay, d1 54.8 53.1 49.9 3.6 62.5 12.4Progression Factor 1.00 1.00 1.06 0.70 1.00 1.00Incremental Delay, d2 1.4 0.2 3.3 0.1 4.2 0.5Delay (s) 56.2 53.2 56.4 2.6 66.7 12.9Level of Service E D E A E BApproach Delay (s) 54.4 12.2 13.3Approach LOS D B B
Intersection SummaryHCM 2000 Control Delay 15.3 HCM 2000 Level of Service BHCM 2000 Volume to Capacity ratio 0.50Actuated Cycle Length (s) 130.0 Sum of lost time (s) 12.0Intersection Capacity Utilization 57.5% ICU Level of Service BAnalysis Period (min) 15c Critical Lane Group

HCM Signalized Intersection Capacity Analysis5: Hesperian Blvd & Depot Road 7/14/2017
Existing AM Synchro 8 ReportPage 5
Movement EBL EBT EBR WBL WBT WBR NBL NBT NBR SBL SBT SBRLane ConfigurationsVolume (vph) 173 62 403 186 151 35 364 747 56 30 1141 163Ideal Flow (vphpl) 1900 1900 1900 1900 1900 1900 1900 1900 1900 1900 1900 1900Total Lost time (s) 4.0 4.0 4.0 4.0 4.0 4.0 4.0 4.0 4.0Lane Util. Factor 0.95 0.95 1.00 1.00 1.00 1.00 0.91 1.00 0.91Frpb, ped/bikes 1.00 1.00 0.96 1.00 1.00 1.00 1.00 1.00 0.99Flpb, ped/bikes 1.00 1.00 1.00 1.00 1.00 1.00 1.00 1.00 1.00Frt 1.00 1.00 0.85 1.00 0.97 1.00 0.99 1.00 0.98Flt Protected 0.95 0.98 1.00 0.95 1.00 0.95 1.00 0.95 1.00Satd. Flow (prot) 1681 1732 1521 1770 1804 1770 5020 1770 4964Flt Permitted 0.95 0.98 1.00 0.95 1.00 0.95 1.00 0.95 1.00Satd. Flow (perm) 1681 1732 1521 1770 1804 1770 5020 1770 4964Peak-hour factor, PHF 0.95 0.95 0.95 0.95 0.95 0.95 0.95 0.95 0.95 0.95 0.95 0.95Adj. Flow (vph) 182 65 424 196 159 37 383 786 59 32 1201 172RTOR Reduction (vph) 0 0 366 0 6 0 0 5 0 0 12 0Lane Group Flow (vph) 131 116 58 196 190 0 383 840 0 32 1361 0Confl. Peds. (#/hr) 2 19 19 2 17 5 5 17Confl. Bikes (#/hr) 1 1Turn Type Split NA Perm Split NA Prot NA Prot NAProtected Phases 4 4 3 3 5 2 1 6Permitted Phases 4Actuated Green, G (s) 17.9 17.9 17.9 17.0 17.0 32.2 73.6 4.9 46.3Effective Green, g (s) 17.9 17.9 17.9 17.0 17.0 32.2 74.2 4.9 46.9Actuated g/C Ratio 0.14 0.14 0.14 0.13 0.13 0.25 0.57 0.04 0.36Clearance Time (s) 4.0 4.0 4.0 4.0 4.0 4.0 4.6 4.0 4.6Vehicle Extension (s) 3.0 3.0 3.0 3.0 3.0 3.0 3.0 3.0 3.0Lane Grp Cap (vph) 231 238 209 231 235 438 2865 66 1790v/s Ratio Prot c0.08 0.07 c0.11 0.11 c0.22 0.17 0.02 c0.27v/s Ratio Perm 0.04v/c Ratio 0.57 0.49 0.28 0.85 0.81 0.87 0.29 0.48 0.76Uniform Delay, d1 52.4 51.8 50.3 55.2 54.9 47.0 14.4 61.3 36.6Progression Factor 1.00 1.00 1.00 1.00 1.00 1.00 1.00 0.87 0.90Incremental Delay, d2 3.2 1.6 0.7 24.0 18.1 17.3 0.3 5.0 2.8Delay (s) 55.6 53.4 51.0 79.3 73.0 64.3 14.6 58.4 35.8Level of Service E D D E E E B E DApproach Delay (s) 52.3 76.1 30.1 36.3Approach LOS D E C D
Intersection SummaryHCM 2000 Control Delay 41.4 HCM 2000 Level of Service DHCM 2000 Volume to Capacity ratio 0.77Actuated Cycle Length (s) 130.0 Sum of lost time (s) 16.0Intersection Capacity Utilization 84.6% ICU Level of Service EAnalysis Period (min) 15c Critical Lane Group
HCM Signalized Intersection Capacity Analysis6: Hesperian Blvd & WB Ramp SR-92 7/14/2017
Existing AM Synchro 8 ReportPage 6
Movement EBL EBR NBL NBT SBT SBRLane ConfigurationsVolume (vph) 197 264 167 939 1463 362Ideal Flow (vphpl) 1900 1900 1900 1900 1900 1900Total Lost time (s) 3.7 3.7 3.7 4.1 4.1Lane Util. Factor 0.97 1.00 1.00 0.91 0.91Frpb, ped/bikes 1.00 1.00 1.00 1.00 0.99Flpb, ped/bikes 1.00 1.00 1.00 1.00 1.00Frt 1.00 0.85 1.00 1.00 0.97Flt Protected 0.95 1.00 0.95 1.00 1.00Satd. Flow (prot) 3433 1583 1770 5085 4898Flt Permitted 0.95 1.00 0.95 1.00 1.00Satd. Flow (perm) 3433 1583 1770 5085 4898Peak-hour factor, PHF 0.97 0.97 0.97 0.97 0.97 0.97Adj. Flow (vph) 203 272 172 968 1508 373RTOR Reduction (vph) 0 237 0 0 39 0Lane Group Flow (vph) 203 35 172 968 1842 0Confl. Peds. (#/hr) 13 13Turn Type Perm Perm Prot NA NAProtected Phases 5 2 6Permitted Phases 4 4Actuated Green, G (s) 11.0 11.0 13.6 70.2 52.4Effective Green, g (s) 11.5 11.5 14.1 70.7 52.9Actuated g/C Ratio 0.13 0.13 0.16 0.79 0.59Clearance Time (s) 4.2 4.2 4.2 4.6 4.6Vehicle Extension (s) 3.0 3.0 3.0 3.0 3.0Lane Grp Cap (vph) 438 202 277 3994 2878v/s Ratio Prot c0.10 0.19 c0.38v/s Ratio Perm c0.06 0.02v/c Ratio 0.46 0.17 0.62 0.24 0.64Uniform Delay, d1 36.4 35.0 35.5 2.6 12.3Progression Factor 1.00 1.00 1.10 1.02 1.00Incremental Delay, d2 0.8 0.4 3.7 0.1 1.1Delay (s) 37.2 35.4 42.7 2.7 13.4Level of Service D D D A BApproach Delay (s) 36.2 8.8 13.4Approach LOS D A B
Intersection SummaryHCM 2000 Control Delay 15.0 HCM 2000 Level of Service BHCM 2000 Volume to Capacity ratio 0.61Actuated Cycle Length (s) 90.0 Sum of lost time (s) 12.0Intersection Capacity Utilization 61.8% ICU Level of Service BAnalysis Period (min) 15c Critical Lane Group

HCM Signalized Intersection Capacity Analysis7: Hesperian Blvd & EB Ramp SR-92 7/14/2017
Existing AM Synchro 8 ReportPage 7
Movement EBL EBT EBR WBL WBT WBR NBL NBT NBR SBL SBT SBRLane ConfigurationsVolume (vph) 61 0 52 0 0 0 0 1023 733 243 1510 0Ideal Flow (vphpl) 1900 1900 1900 1900 1900 1900 1900 1900 1900 1900 1900 1900Total Lost time (s) 3.7 3.7 4.1 4.1 3.7 4.1Lane Util. Factor 1.00 0.88 0.95 1.00 1.00 0.91Frpb, ped/bikes 1.00 1.00 1.00 0.98 1.00 1.00Flpb, ped/bikes 1.00 1.00 1.00 1.00 1.00 1.00Frt 1.00 0.85 1.00 0.85 1.00 1.00Flt Protected 0.95 1.00 1.00 1.00 0.95 1.00Satd. Flow (prot) 1770 2787 3539 1551 1770 5085Flt Permitted 0.95 1.00 1.00 1.00 0.95 1.00Satd. Flow (perm) 1770 2787 3539 1551 1770 5085Peak-hour factor, PHF 0.92 0.92 0.92 0.92 0.92 0.92 0.92 0.92 0.92 0.92 0.92 0.92Adj. Flow (vph) 66 0 57 0 0 0 0 1112 797 264 1641 0RTOR Reduction (vph) 0 0 52 0 0 0 0 0 248 0 0 0Lane Group Flow (vph) 0 66 5 0 0 0 0 1112 549 264 1641 0Confl. Peds. (#/hr) 16 6 6Turn Type Perm NA Perm NA Perm Prot NAProtected Phases 4 2 1 6Permitted Phases 4 4 2Actuated Green, G (s) 7.6 7.6 50.5 50.5 18.9 73.6Effective Green, g (s) 8.1 8.1 51.0 51.0 19.4 74.1Actuated g/C Ratio 0.09 0.09 0.57 0.57 0.22 0.82Clearance Time (s) 4.2 4.2 4.6 4.6 4.2 4.6Vehicle Extension (s) 3.0 3.0 3.0 3.0 3.0 3.0Lane Grp Cap (vph) 159 250 2005 878 381 4186v/s Ratio Prot 0.31 c0.15 0.32v/s Ratio Perm 0.04 0.00 c0.35v/c Ratio 0.42 0.02 0.55 0.63 0.69 0.39Uniform Delay, d1 38.7 37.3 12.3 13.1 32.6 2.1Progression Factor 1.00 1.00 1.00 1.00 1.18 1.00Incremental Delay, d2 1.8 0.0 1.1 3.4 4.4 0.2Delay (s) 40.5 37.4 13.4 16.4 42.8 2.3Level of Service D D B B D AApproach Delay (s) 39.0 0.0 14.7 7.9Approach LOS D A B A
Intersection SummaryHCM 2000 Control Delay 12.2 HCM 2000 Level of Service BHCM 2000 Volume to Capacity ratio 0.62Actuated Cycle Length (s) 90.0 Sum of lost time (s) 11.5Intersection Capacity Utilization 73.7% ICU Level of Service DAnalysis Period (min) 15c Critical Lane Group
HCM Signalized Intersection Capacity Analysis8: Hesperian Blvd & Sleepy Hollow Ave 7/14/2017
Existing AM Synchro 8 ReportPage 8
Movement EBL EBT EBR WBL WBT WBR NBL NBT NBR SBL SBT SBRLane ConfigurationsVolume (vph) 174 85 39 42 103 256 38 1393 38 83 1295 178Ideal Flow (vphpl) 1900 1900 1900 1900 1900 1900 1900 1900 1900 1900 1900 1900Total Lost time (s) 4.0 4.0 4.0 4.0 4.0 4.0 4.0 4.0 4.0 4.0Lane Util. Factor 1.00 1.00 1.00 1.00 1.00 1.00 1.00 0.91 1.00 0.91Frpb, ped/bikes 1.00 1.00 0.97 1.00 1.00 0.98 1.00 1.00 1.00 1.00Flpb, ped/bikes 0.99 1.00 1.00 0.98 1.00 1.00 1.00 1.00 1.00 1.00Frt 1.00 1.00 0.85 1.00 1.00 0.85 1.00 1.00 1.00 0.98Flt Protected 0.95 1.00 1.00 0.95 1.00 1.00 0.95 1.00 0.95 1.00Satd. Flow (prot) 1755 1863 1534 1742 1863 1549 1770 5061 1770 4974Flt Permitted 0.61 1.00 1.00 0.66 1.00 1.00 0.95 1.00 0.95 1.00Satd. Flow (perm) 1132 1863 1534 1205 1863 1549 1770 5061 1770 4974Peak-hour factor, PHF 0.92 0.92 0.92 0.92 0.92 0.92 0.92 0.92 0.92 0.92 0.92 0.92Adj. Flow (vph) 189 92 42 46 112 278 41 1514 41 90 1408 193RTOR Reduction (vph) 0 0 33 0 0 190 0 2 0 0 10 0Lane Group Flow (vph) 189 92 9 46 112 88 41 1553 0 90 1591 0Confl. Peds. (#/hr) 8 15 15 8 5 4 4 5Confl. Bikes (#/hr) 1 2Turn Type Perm NA Perm Perm NA Perm Prot NA Prot NAProtected Phases 8 4 5 2 1 6Permitted Phases 8 8 4 4Actuated Green, G (s) 25.9 25.9 25.9 25.9 25.9 25.9 7.3 78.2 11.9 82.8Effective Green, g (s) 26.9 26.9 26.9 26.9 26.9 26.9 7.3 79.2 11.9 83.8Actuated g/C Ratio 0.21 0.21 0.21 0.21 0.21 0.21 0.06 0.61 0.09 0.64Clearance Time (s) 5.0 5.0 5.0 5.0 5.0 5.0 4.0 5.0 4.0 5.0Vehicle Extension (s) 3.0 3.0 3.0 3.0 3.0 3.0 3.0 3.0 3.0 3.0Lane Grp Cap (vph) 234 385 317 249 385 320 99 3083 162 3206v/s Ratio Prot 0.05 0.06 0.02 0.31 c0.05 c0.32v/s Ratio Perm c0.17 0.01 0.04 0.06v/c Ratio 0.81 0.24 0.03 0.18 0.29 0.27 0.41 0.50 0.56 0.50Uniform Delay, d1 49.1 43.0 41.1 42.5 43.5 43.3 59.3 14.3 56.5 12.1Progression Factor 1.00 1.00 1.00 1.00 1.00 1.00 0.74 1.65 1.00 1.00Incremental Delay, d2 18.2 0.3 0.0 0.4 0.4 0.5 2.6 0.5 4.1 0.6Delay (s) 67.2 43.3 41.2 42.9 43.9 43.8 46.7 24.2 60.6 12.6Level of Service E D D D D D D C E BApproach Delay (s) 57.0 43.7 24.7 15.2Approach LOS E D C B
Intersection SummaryHCM 2000 Control Delay 25.4 HCM 2000 Level of Service CHCM 2000 Volume to Capacity ratio 0.58Actuated Cycle Length (s) 130.0 Sum of lost time (s) 12.0Intersection Capacity Utilization 66.2% ICU Level of Service CAnalysis Period (min) 15c Critical Lane Group

HCM Signalized Intersection Capacity Analysis9: Hesperian Blvd & Tennyson Road 7/14/2017
Existing AM Synchro 8 ReportPage 9
Movement EBL EBT EBR WBL WBT WBR NBL NBT NBR SBL SBT SBRLane ConfigurationsVolume (vph) 143 166 38 173 523 148 87 953 55 147 880 308Ideal Flow (vphpl) 1900 1900 1900 1900 1900 1900 1900 1900 1900 1900 1900 1900Total Lost time (s) 4.0 4.0 4.0 4.0 4.0 4.0 4.0 4.0 4.0 4.0Lane Util. Factor 1.00 0.95 1.00 1.00 0.95 1.00 1.00 0.91 1.00 0.91Frpb, ped/bikes 1.00 1.00 0.96 1.00 1.00 0.97 1.00 1.00 1.00 0.99Flpb, ped/bikes 1.00 1.00 1.00 1.00 1.00 1.00 1.00 1.00 1.00 1.00Frt 1.00 1.00 0.85 1.00 1.00 0.85 1.00 0.99 1.00 0.96Flt Protected 0.95 1.00 1.00 0.95 1.00 1.00 0.95 1.00 0.95 1.00Satd. Flow (prot) 1770 3539 1524 1770 3539 1542 1770 5032 1770 4851Flt Permitted 0.95 1.00 1.00 0.95 1.00 1.00 0.95 1.00 0.95 1.00Satd. Flow (perm) 1770 3539 1524 1770 3539 1542 1770 5032 1770 4851Peak-hour factor, PHF 0.92 0.92 0.92 0.92 0.92 0.92 0.92 0.92 0.92 0.92 0.92 0.92Adj. Flow (vph) 155 180 41 188 568 161 95 1036 60 160 957 335RTOR Reduction (vph) 0 0 33 0 0 125 0 4 0 0 41 0Lane Group Flow (vph) 155 180 8 188 568 36 95 1092 0 160 1251 0Confl. Peds. (#/hr) 12 21 21 12 15 25 25 15Confl. Bikes (#/hr) 2 1Turn Type Prot NA Perm Prot NA Perm Prot NA Prot NAProtected Phases 3 8 7 4 1 6 5 2Permitted Phases 8 4Actuated Green, G (s) 15.5 25.3 25.3 18.3 28.1 28.1 11.7 52.2 16.1 56.6Effective Green, g (s) 15.5 26.3 26.3 18.3 29.1 29.1 11.7 53.3 16.1 57.7Actuated g/C Ratio 0.12 0.20 0.20 0.14 0.22 0.22 0.09 0.41 0.12 0.44Clearance Time (s) 4.0 5.0 5.0 4.0 5.0 5.0 4.0 5.1 4.0 5.1Vehicle Extension (s) 3.0 3.0 3.0 3.0 3.0 3.0 3.0 3.0 3.0 3.0Lane Grp Cap (vph) 211 715 308 249 792 345 159 2063 219 2153v/s Ratio Prot 0.09 0.05 c0.11 c0.16 0.05 0.22 c0.09 c0.26v/s Ratio Perm 0.01 0.02v/c Ratio 0.73 0.25 0.03 0.76 0.72 0.10 0.60 0.53 0.73 0.58Uniform Delay, d1 55.3 43.6 41.6 53.7 46.6 40.1 56.9 28.9 54.9 27.1Progression Factor 1.00 1.00 1.00 1.00 1.00 1.00 1.00 1.00 1.55 0.57Incremental Delay, d2 12.4 0.2 0.0 12.2 3.1 0.1 5.9 1.0 10.7 1.0Delay (s) 67.7 43.8 41.6 65.9 49.8 40.2 62.8 29.9 95.5 16.4Level of Service E D D E D D E C F BApproach Delay (s) 53.4 51.4 32.5 25.1Approach LOS D D C C
Intersection SummaryHCM 2000 Control Delay 36.2 HCM 2000 Level of Service DHCM 2000 Volume to Capacity ratio 0.68Actuated Cycle Length (s) 130.0 Sum of lost time (s) 16.0Intersection Capacity Utilization 77.4% ICU Level of Service DAnalysis Period (min) 15c Critical Lane Group

HCM Signalized Intersection Capacity Analysis10: Industrial Blvd & EB Ramp SR-92 7/14/2017
Existing AM Synchro 8 ReportPage 10
Movement EBL EBT EBR WBL WBT WBR NBL NBT NBR SBL SBT SBRLane ConfigurationsVolume (vph) 131 8 271 20 42 148 82 1291 10 18 472 197Ideal Flow (vphpl) 1900 1900 1900 1900 1900 1900 1900 1900 1900 1900 1900 1900Total Lost time (s) 4.2 4.2 4.2 4.2 3.2 3.6 3.6 3.2 3.6 3.6Lane Util. Factor 1.00 1.00 1.00 1.00 1.00 0.95 1.00 1.00 0.95 1.00Frpb, ped/bikes 1.00 1.00 1.00 1.00 1.00 1.00 0.97 1.00 1.00 0.97Flpb, ped/bikes 1.00 1.00 1.00 1.00 1.00 1.00 1.00 1.00 1.00 1.00Frt 1.00 0.85 1.00 0.85 1.00 1.00 0.85 1.00 1.00 0.85Flt Protected 0.96 1.00 0.98 1.00 0.95 1.00 1.00 0.95 1.00 1.00Satd. Flow (prot) 1779 1583 1833 1583 1770 3539 1534 1770 3539 1532Flt Permitted 0.69 1.00 0.88 1.00 0.95 1.00 1.00 0.95 1.00 1.00Satd. Flow (perm) 1284 1583 1643 1583 1770 3539 1534 1770 3539 1532Peak-hour factor, PHF 0.91 0.91 0.91 0.91 0.91 0.91 0.91 0.91 0.91 0.91 0.91 0.91Adj. Flow (vph) 144 9 298 22 46 163 90 1419 11 20 519 216RTOR Reduction (vph) 0 0 237 0 0 129 0 0 4 0 0 102Lane Group Flow (vph) 0 153 61 0 68 34 90 1419 7 20 519 114Confl. Peds. (#/hr) 6 6 6 6Confl. Bikes (#/hr) 1Turn Type Perm NA Perm Perm NA Perm Prot NA Perm Prot NA PermProtected Phases 8 4 1 6 5 2Permitted Phases 8 8 4 4 6 2Actuated Green, G (s) 13.9 13.9 13.9 13.9 7.0 41.8 41.8 1.8 36.6 36.6Effective Green, g (s) 14.4 14.4 14.4 14.4 7.5 42.3 42.3 2.3 37.1 37.1Actuated g/C Ratio 0.21 0.21 0.21 0.21 0.11 0.60 0.60 0.03 0.53 0.53Clearance Time (s) 4.7 4.7 4.7 4.7 3.7 4.1 4.1 3.7 4.1 4.1Vehicle Extension (s) 3.0 3.0 3.0 3.0 3.0 3.0 3.0 3.0 3.0 3.0Lane Grp Cap (vph) 264 325 337 325 189 2138 926 58 1875 811v/s Ratio Prot c0.05 c0.40 0.01 0.15v/s Ratio Perm c0.12 0.04 0.04 0.02 0.00 0.07v/c Ratio 0.58 0.19 0.20 0.10 0.48 0.66 0.01 0.34 0.28 0.14Uniform Delay, d1 25.1 23.0 23.0 22.6 29.4 9.2 5.5 33.1 9.1 8.4Progression Factor 1.00 1.00 1.00 1.00 1.00 1.00 1.00 0.69 2.18 6.13Incremental Delay, d2 3.1 0.3 0.3 0.1 1.9 1.6 0.0 1.8 0.2 0.2Delay (s) 28.1 23.3 23.3 22.7 31.3 10.8 5.5 24.6 19.9 51.4Level of Service C C C C C B A C B DApproach Delay (s) 24.9 22.9 12.0 29.0Approach LOS C C B C
Intersection SummaryHCM 2000 Control Delay 19.2 HCM 2000 Level of Service BHCM 2000 Volume to Capacity ratio 0.65Actuated Cycle Length (s) 70.0 Sum of lost time (s) 11.0Intersection Capacity Utilization 67.7% ICU Level of Service CAnalysis Period (min) 15c Critical Lane Group
HCM Signalized Intersection Capacity Analysis11: Industrial Blvd & WB Ramp SR-92 7/14/2017
Existing AM Synchro 8 ReportPage 11
Movement EBL EBT EBR WBL WBT WBR NBL NBT NBR SBL SBT SBRLane ConfigurationsVolume (vph) 42 12 20 113 149 10 469 909 158 4 566 354Ideal Flow (vphpl) 1900 1900 1900 1900 1900 1900 1900 1900 1900 1900 1900 1900Total Lost time (s) 4.2 4.2 4.2 4.2 3.2 3.6 3.2 3.6Lane Util. Factor 1.00 1.00 1.00 1.00 1.00 0.95 1.00 0.95Frpb, ped/bikes 1.00 1.00 1.00 1.00 1.00 1.00 1.00 0.99Flpb, ped/bikes 1.00 1.00 1.00 1.00 1.00 1.00 1.00 1.00Frt 1.00 0.85 1.00 0.85 1.00 0.98 1.00 0.94Flt Protected 0.96 1.00 0.98 1.00 0.95 1.00 0.95 1.00Satd. Flow (prot) 1793 1583 1823 1583 1770 3445 1770 3297Flt Permitted 0.47 1.00 0.83 1.00 0.95 1.00 0.95 1.00Satd. Flow (perm) 885 1583 1551 1583 1770 3445 1770 3297Peak-hour factor, PHF 0.90 0.90 0.90 0.90 0.90 0.90 0.90 0.90 0.90 0.90 0.90 0.90Adj. Flow (vph) 47 13 22 126 166 11 521 1010 176 4 629 393RTOR Reduction (vph) 0 0 17 0 0 9 0 17 0 0 138 0Lane Group Flow (vph) 0 60 5 0 292 2 521 1169 0 4 884 0Confl. Peds. (#/hr) 6 7 7 6Turn Type Perm NA Perm Perm NA Perm Prot NA Prot NAProtected Phases 8 4 1 6 5 2Permitted Phases 8 8 4 4Actuated Green, G (s) 14.2 14.2 14.2 14.2 21.8 41.9 1.4 21.5Effective Green, g (s) 14.7 14.7 14.7 14.7 22.3 42.4 1.9 22.0Actuated g/C Ratio 0.21 0.21 0.21 0.21 0.32 0.61 0.03 0.31Clearance Time (s) 4.7 4.7 4.7 4.7 3.7 4.1 3.7 4.1Vehicle Extension (s) 3.0 3.0 3.0 3.0 3.0 3.0 3.0 3.0Lane Grp Cap (vph) 185 332 325 332 563 2086 48 1036v/s Ratio Prot c0.29 0.34 0.00 c0.27v/s Ratio Perm 0.07 0.00 c0.19 0.00v/c Ratio 0.32 0.01 0.90 0.01 0.93 0.56 0.08 0.85Uniform Delay, d1 23.4 21.9 26.9 21.9 23.0 8.2 33.2 22.5Progression Factor 1.00 1.00 1.00 1.00 1.07 0.77 1.00 1.00Incremental Delay, d2 1.0 0.0 25.8 0.0 18.4 0.9 0.7 8.9Delay (s) 24.5 21.9 52.7 21.9 43.1 7.2 33.9 31.4Level of Service C C D C D A C CApproach Delay (s) 23.8 51.6 18.2 31.4Approach LOS C D B C
Intersection SummaryHCM 2000 Control Delay 25.9 HCM 2000 Level of Service CHCM 2000 Volume to Capacity ratio 0.89Actuated Cycle Length (s) 70.0 Sum of lost time (s) 11.0Intersection Capacity Utilization 89.3% ICU Level of Service EAnalysis Period (min) 15c Critical Lane Group
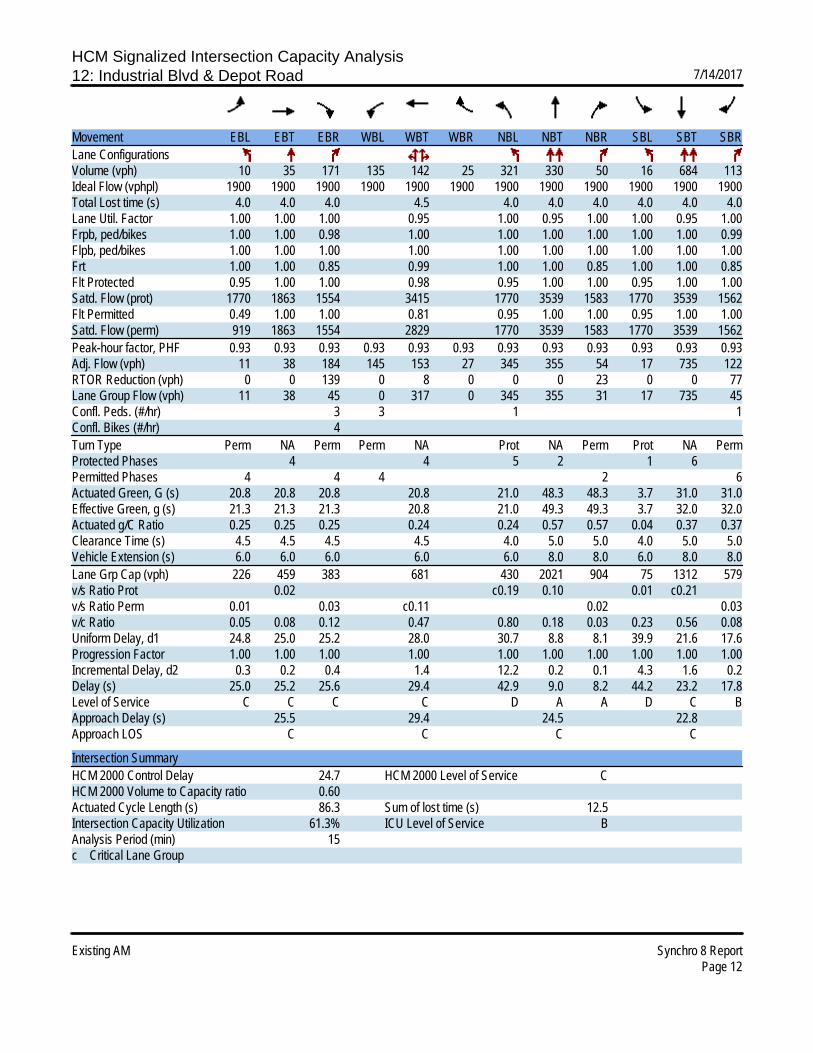
HCM Signalized Intersection Capacity Analysis12: Industrial Blvd & Depot Road 7/14/2017
Existing AM Synchro 8 ReportPage 12
Movement EBL EBT EBR WBL WBT WBR NBL NBT NBR SBL SBT SBRLane ConfigurationsVolume (vph) 10 35 171 135 142 25 321 330 50 16 684 113Ideal Flow (vphpl) 1900 1900 1900 1900 1900 1900 1900 1900 1900 1900 1900 1900Total Lost time (s) 4.0 4.0 4.0 4.5 4.0 4.0 4.0 4.0 4.0 4.0Lane Util. Factor 1.00 1.00 1.00 0.95 1.00 0.95 1.00 1.00 0.95 1.00Frpb, ped/bikes 1.00 1.00 0.98 1.00 1.00 1.00 1.00 1.00 1.00 0.99Flpb, ped/bikes 1.00 1.00 1.00 1.00 1.00 1.00 1.00 1.00 1.00 1.00Frt 1.00 1.00 0.85 0.99 1.00 1.00 0.85 1.00 1.00 0.85Flt Protected 0.95 1.00 1.00 0.98 0.95 1.00 1.00 0.95 1.00 1.00Satd. Flow (prot) 1770 1863 1554 3415 1770 3539 1583 1770 3539 1562Flt Permitted 0.49 1.00 1.00 0.81 0.95 1.00 1.00 0.95 1.00 1.00Satd. Flow (perm) 919 1863 1554 2829 1770 3539 1583 1770 3539 1562Peak-hour factor, PHF 0.93 0.93 0.93 0.93 0.93 0.93 0.93 0.93 0.93 0.93 0.93 0.93Adj. Flow (vph) 11 38 184 145 153 27 345 355 54 17 735 122RTOR Reduction (vph) 0 0 139 0 8 0 0 0 23 0 0 77Lane Group Flow (vph) 11 38 45 0 317 0 345 355 31 17 735 45Confl. Peds. (#/hr) 3 3 1 1Confl. Bikes (#/hr) 4Turn Type Perm NA Perm Perm NA Prot NA Perm Prot NA PermProtected Phases 4 4 5 2 1 6Permitted Phases 4 4 4 2 6Actuated Green, G (s) 20.8 20.8 20.8 20.8 21.0 48.3 48.3 3.7 31.0 31.0Effective Green, g (s) 21.3 21.3 21.3 20.8 21.0 49.3 49.3 3.7 32.0 32.0Actuated g/C Ratio 0.25 0.25 0.25 0.24 0.24 0.57 0.57 0.04 0.37 0.37Clearance Time (s) 4.5 4.5 4.5 4.5 4.0 5.0 5.0 4.0 5.0 5.0Vehicle Extension (s) 6.0 6.0 6.0 6.0 6.0 8.0 8.0 6.0 8.0 8.0Lane Grp Cap (vph) 226 459 383 681 430 2021 904 75 1312 579v/s Ratio Prot 0.02 c0.19 0.10 0.01 c0.21v/s Ratio Perm 0.01 0.03 c0.11 0.02 0.03v/c Ratio 0.05 0.08 0.12 0.47 0.80 0.18 0.03 0.23 0.56 0.08Uniform Delay, d1 24.8 25.0 25.2 28.0 30.7 8.8 8.1 39.9 21.6 17.6Progression Factor 1.00 1.00 1.00 1.00 1.00 1.00 1.00 1.00 1.00 1.00Incremental Delay, d2 0.3 0.2 0.4 1.4 12.2 0.2 0.1 4.3 1.6 0.2Delay (s) 25.0 25.2 25.6 29.4 42.9 9.0 8.2 44.2 23.2 17.8Level of Service C C C C D A A D C BApproach Delay (s) 25.5 29.4 24.5 22.8Approach LOS C C C C
Intersection SummaryHCM 2000 Control Delay 24.7 HCM 2000 Level of Service CHCM 2000 Volume to Capacity ratio 0.60Actuated Cycle Length (s) 86.3 Sum of lost time (s) 12.5Intersection Capacity Utilization 61.3% ICU Level of Service BAnalysis Period (min) 15c Critical Lane Group

HCM Unsignalized Intersection Capacity Analysis13: Depot Road & West Driveway 7/14/2017
Existing AM Synchro 8 ReportPage 13
Movement EBL EBT WBT WBR SBL SBRLane ConfigurationsVolume (veh/h) 19 423 402 72 16 4Sign Control Free Free StopGrade 0% 0% 0%Peak Hour Factor 0.91 0.91 0.91 0.91 0.91 0.91Hourly flow rate (vph) 21 465 442 79 18 4Pedestrians 2 29Lane Width (ft) 12.0 12.0Walking Speed (ft/s) 3.5 3.5Percent Blockage 0 3Right turn flare (veh)Median type None NoneMedian storage veh)Upstream signal (ft)pX, platoon unblockedvC, conflicting volume 550 786 510vC1, stage 1 conf volvC2, stage 2 conf volvCu, unblocked vol 550 786 510tC, single (s) 4.1 6.8 6.9tC, 2 stage (s)tF (s) 2.2 3.5 3.3p0 queue free % 98 94 99cM capacity (veh/h) 988 312 494
Direction, Lane # EB 1 EB 2 WB 1 SB 1Volume Total 176 310 521 22Volume Left 21 0 0 18Volume Right 0 0 79 4cSH 988 1700 1700 337Volume to Capacity 0.02 0.18 0.31 0.07Queue Length 95th (ft) 2 0 0 5Control Delay (s) 1.2 0.0 0.0 16.4Lane LOS A CApproach Delay (s) 0.4 0.0 16.4Approach LOS C
Intersection SummaryAverage Delay 0.6Intersection Capacity Utilization 35.9% ICU Level of Service AAnalysis Period (min) 15

HCM Unsignalized Intersection Capacity Analysis14: Dodge Ave/Lot E & Depot Road 7/14/2017
Existing AM Synchro 8 ReportPage 14
Movement EBL EBT EBR WBL WBT WBR NBL NBT NBR SBL SBT SBRLane ConfigurationsSign Control Stop Stop Stop StopVolume (vph) 3 417 14 96 429 77 57 2 139 4 0 0Peak Hour Factor 0.92 0.92 0.92 0.92 0.92 0.92 0.92 0.92 0.92 0.92 0.92 0.92Hourly flow rate (vph) 3 453 15 104 466 84 62 2 151 4 0 0
Direction, Lane # EB 1 EB 2 WB 1 NB 1 SB 1Volume Total (vph) 230 242 654 215 4Volume Left (vph) 3 0 104 62 4Volume Right (vph) 0 15 84 151 0Hadj (s) 0.04 -0.01 -0.01 -0.33 0.23Departure Headway (s) 6.1 6.0 5.4 6.2 7.6Degree Utilization, x 0.39 0.40 0.97 0.37 0.01Capacity (veh/h) 579 592 664 563 437Control Delay (s) 11.7 11.9 51.1 12.9 10.7Approach Delay (s) 11.8 51.1 12.9 10.7Approach LOS B F B B
Intersection SummaryDelay 31.1Level of Service DIntersection Capacity Utilization 68.1% ICU Level of Service CAnalysis Period (min) 15

HCM Unsignalized Intersection Capacity Analysis15: Depot Road & Lot F 7/14/2017
Existing AM Synchro 8 ReportPage 15
Movement EBL EBT WBT WBR SBL SBRLane ConfigurationsVolume (veh/h) 16 546 504 22 10 102Sign Control Free Free StopGrade 0% 0% 0%Peak Hour Factor 0.92 0.92 0.92 0.92 0.92 0.92Hourly flow rate (vph) 17 593 548 24 11 111Pedestrians 9Lane Width (ft) 12.0Walking Speed (ft/s) 3.5Percent Blockage 1Right turn flare (veh)Median type None NoneMedian storage veh)Upstream signal (ft) 957pX, platoon unblocked 0.98 0.98 0.98vC, conflicting volume 581 900 569vC1, stage 1 conf volvC2, stage 2 conf volvCu, unblocked vol 565 890 552tC, single (s) 4.1 6.8 6.9tC, 2 stage (s)tF (s) 2.2 3.5 3.3p0 queue free % 98 96 76cM capacity (veh/h) 977 270 465
Direction, Lane # EB 1 EB 2 WB 1 SB 1Volume Total 215 396 572 122Volume Left 17 0 0 11Volume Right 0 0 24 111cSH 977 1700 1700 437Volume to Capacity 0.02 0.23 0.34 0.28Queue Length 95th (ft) 1 0 0 28Control Delay (s) 0.9 0.0 0.0 16.4Lane LOS A CApproach Delay (s) 0.3 0.0 16.4Approach LOS C
Intersection SummaryAverage Delay 1.7Intersection Capacity Utilization 41.4% ICU Level of Service AAnalysis Period (min) 15

HCM Unsignalized Intersection Capacity Analysis16: Depot Road & Lot G 7/14/2017
Existing AM Synchro 8 ReportPage 16
Movement EBL EBT WBT WBR SBL SBRLane ConfigurationsVolume (veh/h) 0 560 533 72 2 2Sign Control Free Free StopGrade 0% 0% 0%Peak Hour Factor 0.93 0.93 0.93 0.93 0.93 0.93Hourly flow rate (vph) 0 602 573 77 2 2Pedestrians 19 19 5Lane Width (ft) 12.0 12.0 12.0Walking Speed (ft/s) 3.5 3.5 3.5Percent Blockage 2 2 0Right turn flare (veh)Median type None NoneMedian storage veh)Upstream signal (ft) 529pX, platoon unblocked 0.94 0.94 0.94vC, conflicting volume 656 898 597vC1, stage 1 conf volvC2, stage 2 conf volvCu, unblocked vol 604 861 542tC, single (s) 4.1 6.8 6.9tC, 2 stage (s)tF (s) 2.2 3.5 3.3p0 queue free % 100 99 100cM capacity (veh/h) 910 271 446
Direction, Lane # EB 1 EB 2 WB 1 WB 2 SB 1Volume Total 201 401 573 77 4Volume Left 0 0 0 0 2Volume Right 0 0 0 77 2cSH 910 1700 1700 1700 337Volume to Capacity 0.00 0.24 0.34 0.05 0.01Queue Length 95th (ft) 0 0 0 0 1Control Delay (s) 0.0 0.0 0.0 0.0 15.8Lane LOS CApproach Delay (s) 0.0 0.0 15.8Approach LOS C
Intersection SummaryAverage Delay 0.1Intersection Capacity Utilization 42.7% ICU Level of Service AAnalysis Period (min) 15

HCM Signalized Intersection Capacity Analysis1: Hesperian Blvd & Winton Ave 7/14/2017
Existing PM Synchro 8 ReportPage 1
Movement EBL EBT EBR WBL WBT WBR NBL NBT NBR SBL SBT SBRLane ConfigurationsVolume (vph) 753 1097 66 306 326 181 59 1292 253 171 737 193Ideal Flow (vphpl) 1900 1900 1900 1900 1900 1900 1900 1900 1900 1900 1900 1900Total Lost time (s) 4.0 4.0 4.0 4.0 4.0 4.0 4.0 4.0 4.0 4.0 2.5Lane Util. Factor 0.97 0.91 1.00 0.95 1.00 1.00 0.91 1.00 0.97 0.91 1.00Frpb, ped/bikes 1.00 1.00 1.00 1.00 0.98 1.00 1.00 0.98 1.00 1.00 0.99Flpb, ped/bikes 1.00 1.00 1.00 1.00 1.00 1.00 1.00 1.00 1.00 1.00 1.00Frt 1.00 0.99 1.00 1.00 0.85 1.00 1.00 0.85 1.00 1.00 0.85Flt Protected 0.95 1.00 0.95 1.00 1.00 0.95 1.00 1.00 0.95 1.00 1.00Satd. Flow (prot) 3433 5035 1770 3539 1551 1770 5085 1551 3433 5085 1562Flt Permitted 0.95 1.00 0.95 1.00 1.00 0.95 1.00 1.00 0.95 1.00 1.00Satd. Flow (perm) 3433 5035 1770 3539 1551 1770 5085 1551 3433 5085 1562Peak-hour factor, PHF 0.98 0.98 0.98 0.98 0.98 0.98 0.98 0.98 0.98 0.98 0.98 0.98Adj. Flow (vph) 768 1119 67 312 333 185 60 1318 258 174 752 197RTOR Reduction (vph) 0 5 0 0 0 79 0 0 80 0 0 0Lane Group Flow (vph) 768 1181 0 312 333 106 60 1318 178 174 752 197Confl. Peds. (#/hr) 6 10 10 6 4 7 7 4Turn Type Prot NA Prot NA Perm Prot NA Perm Prot NA FreeProtected Phases 3 8 7 4 5 2 1 6Permitted Phases 4 2 FreeActuated Green, G (s) 8.5 34.5 10.5 36.5 36.5 5.2 70.5 70.5 9.5 74.8 145.0Effective Green, g (s) 9.0 36.0 11.0 38.0 38.0 5.7 72.0 72.0 10.0 76.3 145.0Actuated g/C Ratio 0.06 0.25 0.08 0.26 0.26 0.04 0.50 0.50 0.07 0.53 1.00Clearance Time (s) 4.5 5.5 4.5 5.5 5.5 4.5 5.5 5.5 4.5 5.5Vehicle Extension (s) 3.0 3.0 3.0 3.0 3.0 3.0 3.0 3.0 3.0 3.0Lane Grp Cap (vph) 213 1250 134 927 406 69 2524 770 236 2675 1562v/s Ratio Prot c0.22 c0.23 0.18 0.09 0.03 c0.26 c0.05 0.15v/s Ratio Perm 0.07 0.12 c0.13v/c Ratio 3.61 0.95 2.33 0.36 0.26 0.87 0.52 0.23 0.74 0.28 0.13Uniform Delay, d1 68.0 53.5 67.0 43.6 42.4 69.3 24.8 20.8 66.2 19.1 0.0Progression Factor 1.00 1.00 1.00 1.00 1.00 1.00 1.00 1.00 1.00 1.00 1.00Incremental Delay, d2 1184.1 14.2 620.4 0.2 0.3 64.4 0.8 0.7 11.4 0.3 0.2Delay (s) 1252.1 67.8 687.4 43.8 42.7 133.6 25.6 21.5 77.6 19.4 0.2Level of Service F E F D D F C C E B AApproach Delay (s) 533.3 285.5 28.9 25.0Approach LOS F F C C
Intersection SummaryHCM 2000 Control Delay 244.3 HCM 2000 Level of Service FHCM 2000 Volume to Capacity ratio 0.87Actuated Cycle Length (s) 145.0 Sum of lost time (s) 16.0Intersection Capacity Utilization 89.6% ICU Level of Service EAnalysis Period (min) 15c Critical Lane Group

HCM Signalized Intersection Capacity Analysis2: Hesperian Blvd & Southland Drive 7/14/2017
Existing PM Synchro 8 ReportPage 2
Movement EBL EBT EBR WBL WBT WBR NBL NBT NBR SBL SBT SBRLane ConfigurationsVolume (vph) 194 467 56 90 101 129 61 1329 130 177 782 120Ideal Flow (vphpl) 1900 1900 1900 1900 1900 1900 1900 1900 1900 1900 1900 1900Total Lost time (s) 4.0 4.0 4.0 4.0 4.0 4.0 4.0 4.0Lane Util. Factor 1.00 0.95 1.00 0.91 1.00 0.91 1.00 0.91Frpb, ped/bikes 1.00 1.00 1.00 0.99 1.00 1.00 1.00 1.00Flpb, ped/bikes 1.00 1.00 0.99 1.00 1.00 1.00 1.00 1.00Frt 1.00 0.98 1.00 0.92 1.00 0.99 1.00 0.98Flt Protected 0.95 1.00 0.95 1.00 0.95 1.00 0.95 1.00Satd. Flow (prot) 1767 3471 1758 4618 1770 5012 1770 4972Flt Permitted 0.59 1.00 0.25 1.00 0.95 1.00 0.95 1.00Satd. Flow (perm) 1094 3471 468 4618 1770 5012 1770 4972Peak-hour factor, PHF 0.94 0.94 0.94 0.94 0.94 0.94 0.94 0.94 0.94 0.94 0.94 0.94Adj. Flow (vph) 206 497 60 96 107 137 65 1414 138 188 832 128RTOR Reduction (vph) 0 10 0 0 102 0 0 11 0 0 15 0Lane Group Flow (vph) 206 547 0 96 142 0 65 1541 0 188 945 0Confl. Peds. (#/hr) 2 16 16 2 4 1 1 4Confl. Bikes (#/hr) 1 1Turn Type Perm NA Perm NA Prot NA Prot NAProtected Phases 8 4 1 6 5 2Permitted Phases 8 4Actuated Green, G (s) 27.9 27.9 27.9 27.9 7.6 50.8 18.7 61.9Effective Green, g (s) 27.9 27.9 27.9 27.9 7.6 51.4 18.7 62.5Actuated g/C Ratio 0.25 0.25 0.25 0.25 0.07 0.47 0.17 0.57Clearance Time (s) 4.0 4.0 4.0 4.0 4.0 4.6 4.0 4.6Vehicle Extension (s) 3.0 3.0 3.0 3.0 3.0 3.0 3.0 3.0Lane Grp Cap (vph) 277 880 118 1171 122 2341 300 2825v/s Ratio Prot 0.16 0.03 0.04 c0.31 c0.11 0.19v/s Ratio Perm 0.19 c0.20v/c Ratio 0.74 0.62 0.81 0.12 0.53 0.66 0.63 0.33Uniform Delay, d1 37.8 36.4 38.6 31.6 49.5 22.5 42.4 12.7Progression Factor 1.00 1.00 1.00 1.00 0.75 1.62 1.00 1.00Incremental Delay, d2 10.3 1.4 33.2 0.0 3.9 1.3 4.1 0.3Delay (s) 48.1 37.8 71.8 31.7 41.0 37.9 46.5 13.0Level of Service D D E C D D D BApproach Delay (s) 40.5 43.0 38.0 18.5Approach LOS D D D B
Intersection SummaryHCM 2000 Control Delay 33.2 HCM 2000 Level of Service CHCM 2000 Volume to Capacity ratio 0.69Actuated Cycle Length (s) 110.0 Sum of lost time (s) 12.0Intersection Capacity Utilization 78.6% ICU Level of Service DAnalysis Period (min) 15c Critical Lane Group

HCM Signalized Intersection Capacity Analysis3: Hesperian Blvd & Turner Court 7/14/2017
Existing PM Synchro 8 ReportPage 3
Movement EBL EBT EBR WBL WBT WBR NBL NBT NBR SBL SBT SBRLane ConfigurationsVolume (vph) 143 25 45 56 16 60 60 1478 53 104 865 111Ideal Flow (vphpl) 1900 1900 1900 1900 1900 1900 1900 1900 1900 1900 1900 1900Total Lost time (s) 4.0 4.0 4.0 4.6 4.0 4.0 4.0 4.0Lane Util. Factor 1.00 1.00 1.00 1.00 1.00 0.91 1.00 0.91Frpb, ped/bikes 1.00 0.97 1.00 0.99 1.00 1.00 1.00 1.00Flpb, ped/bikes 1.00 1.00 0.97 1.00 1.00 1.00 1.00 1.00Frt 1.00 0.90 1.00 0.85 1.00 0.99 1.00 0.98Flt Protected 0.95 1.00 0.96 1.00 0.95 1.00 0.95 1.00Satd. Flow (prot) 1768 1627 1741 1562 1770 5049 1770 4974Flt Permitted 0.71 1.00 0.74 1.00 0.95 1.00 0.95 1.00Satd. Flow (perm) 1314 1627 1346 1562 1770 5049 1770 4974Peak-hour factor, PHF 0.94 0.94 0.94 0.94 0.94 0.94 0.94 0.94 0.94 0.94 0.94 0.94Adj. Flow (vph) 152 27 48 60 17 64 64 1572 56 111 920 118RTOR Reduction (vph) 0 39 0 0 0 53 0 3 0 0 9 0Lane Group Flow (vph) 152 36 0 0 77 11 64 1625 0 111 1029 0Confl. Peds. (#/hr) 1 40 40 1 10 19 19 10Turn Type Perm NA Perm NA Perm Prot NA Prot NAProtected Phases 4 8 1 6 5 2Permitted Phases 4 8 8Actuated Green, G (s) 19.3 19.3 19.3 19.3 8.2 66.3 11.2 69.3Effective Green, g (s) 19.9 19.9 19.9 19.3 8.2 66.9 11.2 69.9Actuated g/C Ratio 0.18 0.18 0.18 0.18 0.07 0.61 0.10 0.64Clearance Time (s) 4.6 4.6 4.6 4.6 4.0 4.6 4.0 4.6Vehicle Extension (s) 3.0 3.0 3.0 3.0 3.0 3.0 3.0 3.0Lane Grp Cap (vph) 237 294 243 274 131 3070 180 3160v/s Ratio Prot 0.02 0.04 c0.32 c0.06 c0.21v/s Ratio Perm c0.12 0.06 0.01v/c Ratio 0.64 0.12 0.32 0.04 0.49 0.53 0.62 0.33Uniform Delay, d1 41.7 37.7 39.1 37.7 48.9 12.5 47.3 9.2Progression Factor 1.00 1.00 1.00 1.00 1.00 1.00 0.93 1.08Incremental Delay, d2 5.8 0.2 0.8 0.1 2.9 0.7 5.9 0.3Delay (s) 47.6 37.9 39.9 37.7 51.7 13.1 49.9 10.2Level of Service D D D D D B D BApproach Delay (s) 44.4 38.9 14.6 14.1Approach LOS D D B B
Intersection SummaryHCM 2000 Control Delay 17.6 HCM 2000 Level of Service BHCM 2000 Volume to Capacity ratio 0.55Actuated Cycle Length (s) 110.0 Sum of lost time (s) 12.0Intersection Capacity Utilization 69.0% ICU Level of Service CAnalysis Period (min) 15c Critical Lane Group

HCM Signalized Intersection Capacity Analysis4: Hesperian Blvd & East Driveway 7/14/2017
Existing PM Synchro 8 ReportPage 4
Movement EBL EBR NBL NBT SBU SBT SBRLane ConfigurationsVolume (vph) 77 119 80 1543 5 927 46Ideal Flow (vphpl) 1900 1900 1900 1900 1900 1900 1900Total Lost time (s) 4.0 4.0 4.0 4.0 4.0 4.0Lane Util. Factor 1.00 1.00 1.00 0.91 1.00 0.91Frpb, ped/bikes 1.00 0.98 1.00 1.00 1.00 1.00Flpb, ped/bikes 1.00 1.00 1.00 1.00 1.00 1.00Frt 1.00 0.85 1.00 1.00 1.00 0.99Flt Protected 0.95 1.00 0.95 1.00 0.95 1.00Satd. Flow (prot) 1770 1555 1770 5085 1770 5044Flt Permitted 0.95 1.00 0.95 1.00 0.95 1.00Satd. Flow (perm) 1770 1555 1770 5085 1770 5044Peak-hour factor, PHF 0.95 0.95 0.95 0.95 0.95 0.95 0.95Adj. Flow (vph) 81 125 84 1624 5 976 48RTOR Reduction (vph) 0 112 0 0 0 3 0Lane Group Flow (vph) 81 13 84 1624 5 1021 0Confl. Peds. (#/hr) 4 1 5 1Turn Type Prot Perm Prot NA Prot NAProtected Phases 4 1 6 5 2Permitted Phases 4Actuated Green, G (s) 13.6 13.6 10.4 102.0 1.4 93.0Effective Green, g (s) 13.6 13.6 10.4 103.0 1.4 94.0Actuated g/C Ratio 0.10 0.10 0.08 0.79 0.01 0.72Clearance Time (s) 4.0 4.0 4.0 5.0 4.0 5.0Vehicle Extension (s) 3.0 3.0 3.0 3.0 3.0 3.0Lane Grp Cap (vph) 185 162 141 4028 19 3647v/s Ratio Prot c0.05 c0.05 c0.32 0.00 0.20v/s Ratio Perm 0.01v/c Ratio 0.44 0.08 0.60 0.40 0.26 0.28Uniform Delay, d1 54.6 52.6 57.8 4.1 63.8 6.2Progression Factor 1.00 1.00 0.87 1.10 1.00 1.00Incremental Delay, d2 1.7 0.2 5.8 0.3 7.3 0.2Delay (s) 56.3 52.8 55.8 4.8 71.1 6.4Level of Service E D E A E AApproach Delay (s) 54.1 7.3 6.8Approach LOS D A A
Intersection SummaryHCM 2000 Control Delay 10.4 HCM 2000 Level of Service BHCM 2000 Volume to Capacity ratio 0.43Actuated Cycle Length (s) 130.0 Sum of lost time (s) 12.0Intersection Capacity Utilization 51.7% ICU Level of Service AAnalysis Period (min) 15c Critical Lane Group
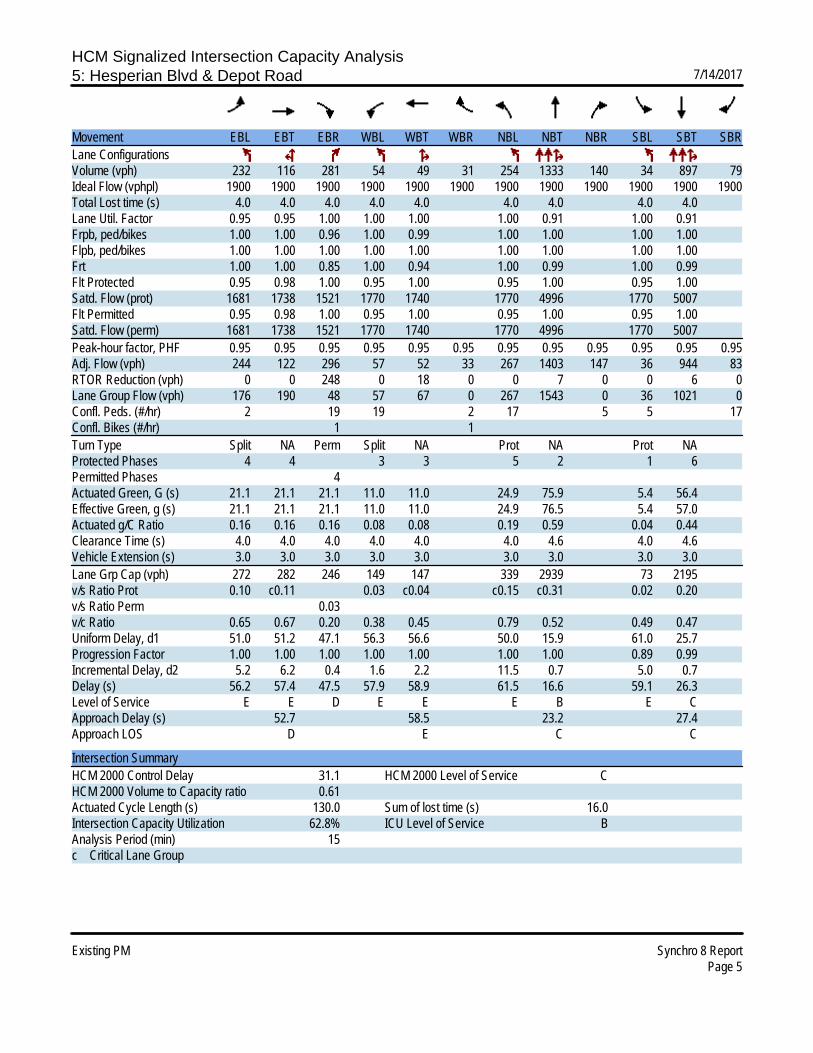
HCM Signalized Intersection Capacity Analysis5: Hesperian Blvd & Depot Road 7/14/2017
Existing PM Synchro 8 ReportPage 5
Movement EBL EBT EBR WBL WBT WBR NBL NBT NBR SBL SBT SBRLane ConfigurationsVolume (vph) 232 116 281 54 49 31 254 1333 140 34 897 79Ideal Flow (vphpl) 1900 1900 1900 1900 1900 1900 1900 1900 1900 1900 1900 1900Total Lost time (s) 4.0 4.0 4.0 4.0 4.0 4.0 4.0 4.0 4.0Lane Util. Factor 0.95 0.95 1.00 1.00 1.00 1.00 0.91 1.00 0.91Frpb, ped/bikes 1.00 1.00 0.96 1.00 0.99 1.00 1.00 1.00 1.00Flpb, ped/bikes 1.00 1.00 1.00 1.00 1.00 1.00 1.00 1.00 1.00Frt 1.00 1.00 0.85 1.00 0.94 1.00 0.99 1.00 0.99Flt Protected 0.95 0.98 1.00 0.95 1.00 0.95 1.00 0.95 1.00Satd. Flow (prot) 1681 1738 1521 1770 1740 1770 4996 1770 5007Flt Permitted 0.95 0.98 1.00 0.95 1.00 0.95 1.00 0.95 1.00Satd. Flow (perm) 1681 1738 1521 1770 1740 1770 4996 1770 5007Peak-hour factor, PHF 0.95 0.95 0.95 0.95 0.95 0.95 0.95 0.95 0.95 0.95 0.95 0.95Adj. Flow (vph) 244 122 296 57 52 33 267 1403 147 36 944 83RTOR Reduction (vph) 0 0 248 0 18 0 0 7 0 0 6 0Lane Group Flow (vph) 176 190 48 57 67 0 267 1543 0 36 1021 0Confl. Peds. (#/hr) 2 19 19 2 17 5 5 17Confl. Bikes (#/hr) 1 1Turn Type Split NA Perm Split NA Prot NA Prot NAProtected Phases 4 4 3 3 5 2 1 6Permitted Phases 4Actuated Green, G (s) 21.1 21.1 21.1 11.0 11.0 24.9 75.9 5.4 56.4Effective Green, g (s) 21.1 21.1 21.1 11.0 11.0 24.9 76.5 5.4 57.0Actuated g/C Ratio 0.16 0.16 0.16 0.08 0.08 0.19 0.59 0.04 0.44Clearance Time (s) 4.0 4.0 4.0 4.0 4.0 4.0 4.6 4.0 4.6Vehicle Extension (s) 3.0 3.0 3.0 3.0 3.0 3.0 3.0 3.0 3.0Lane Grp Cap (vph) 272 282 246 149 147 339 2939 73 2195v/s Ratio Prot 0.10 c0.11 0.03 c0.04 c0.15 c0.31 0.02 0.20v/s Ratio Perm 0.03v/c Ratio 0.65 0.67 0.20 0.38 0.45 0.79 0.52 0.49 0.47Uniform Delay, d1 51.0 51.2 47.1 56.3 56.6 50.0 15.9 61.0 25.7Progression Factor 1.00 1.00 1.00 1.00 1.00 1.00 1.00 0.89 0.99Incremental Delay, d2 5.2 6.2 0.4 1.6 2.2 11.5 0.7 5.0 0.7Delay (s) 56.2 57.4 47.5 57.9 58.9 61.5 16.6 59.1 26.3Level of Service E E D E E E B E CApproach Delay (s) 52.7 58.5 23.2 27.4Approach LOS D E C C
Intersection SummaryHCM 2000 Control Delay 31.1 HCM 2000 Level of Service CHCM 2000 Volume to Capacity ratio 0.61Actuated Cycle Length (s) 130.0 Sum of lost time (s) 16.0Intersection Capacity Utilization 62.8% ICU Level of Service BAnalysis Period (min) 15c Critical Lane Group
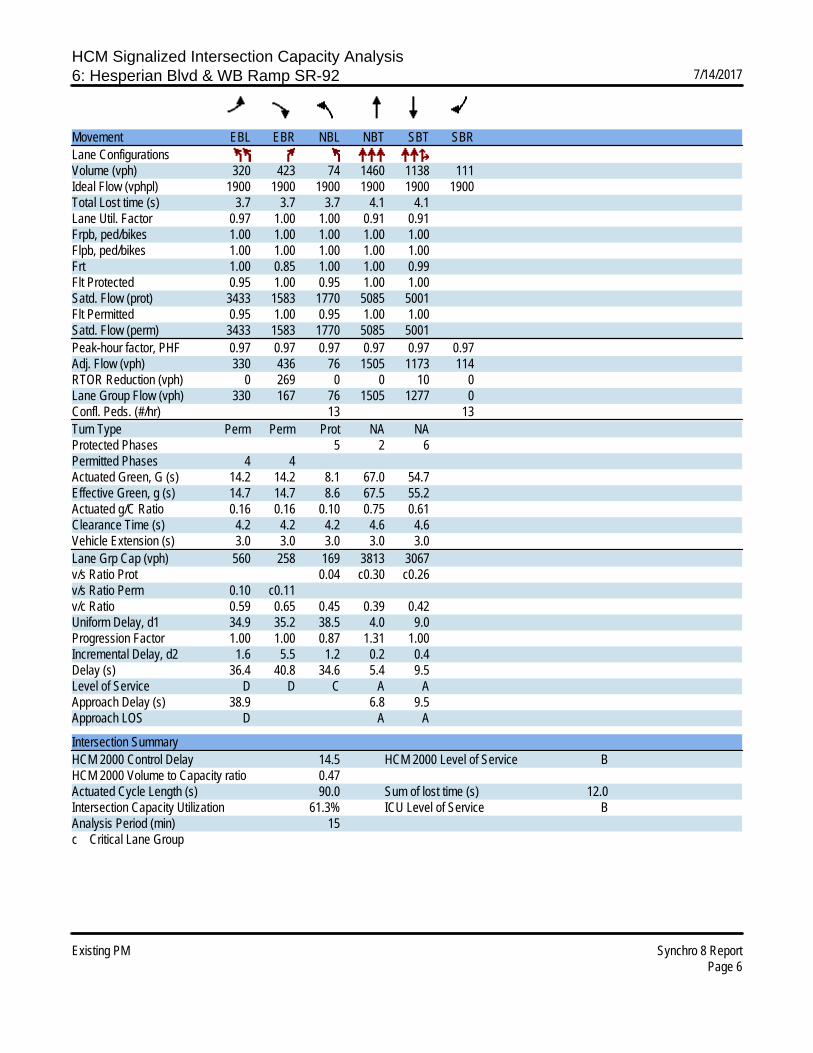
HCM Signalized Intersection Capacity Analysis6: Hesperian Blvd & WB Ramp SR-92 7/14/2017
Existing PM Synchro 8 ReportPage 6
Movement EBL EBR NBL NBT SBT SBRLane ConfigurationsVolume (vph) 320 423 74 1460 1138 111Ideal Flow (vphpl) 1900 1900 1900 1900 1900 1900Total Lost time (s) 3.7 3.7 3.7 4.1 4.1Lane Util. Factor 0.97 1.00 1.00 0.91 0.91Frpb, ped/bikes 1.00 1.00 1.00 1.00 1.00Flpb, ped/bikes 1.00 1.00 1.00 1.00 1.00Frt 1.00 0.85 1.00 1.00 0.99Flt Protected 0.95 1.00 0.95 1.00 1.00Satd. Flow (prot) 3433 1583 1770 5085 5001Flt Permitted 0.95 1.00 0.95 1.00 1.00Satd. Flow (perm) 3433 1583 1770 5085 5001Peak-hour factor, PHF 0.97 0.97 0.97 0.97 0.97 0.97Adj. Flow (vph) 330 436 76 1505 1173 114RTOR Reduction (vph) 0 269 0 0 10 0Lane Group Flow (vph) 330 167 76 1505 1277 0Confl. Peds. (#/hr) 13 13Turn Type Perm Perm Prot NA NAProtected Phases 5 2 6Permitted Phases 4 4Actuated Green, G (s) 14.2 14.2 8.1 67.0 54.7Effective Green, g (s) 14.7 14.7 8.6 67.5 55.2Actuated g/C Ratio 0.16 0.16 0.10 0.75 0.61Clearance Time (s) 4.2 4.2 4.2 4.6 4.6Vehicle Extension (s) 3.0 3.0 3.0 3.0 3.0Lane Grp Cap (vph) 560 258 169 3813 3067v/s Ratio Prot 0.04 c0.30 c0.26v/s Ratio Perm 0.10 c0.11v/c Ratio 0.59 0.65 0.45 0.39 0.42Uniform Delay, d1 34.9 35.2 38.5 4.0 9.0Progression Factor 1.00 1.00 0.87 1.31 1.00Incremental Delay, d2 1.6 5.5 1.2 0.2 0.4Delay (s) 36.4 40.8 34.6 5.4 9.5Level of Service D D C A AApproach Delay (s) 38.9 6.8 9.5Approach LOS D A A
Intersection SummaryHCM 2000 Control Delay 14.5 HCM 2000 Level of Service BHCM 2000 Volume to Capacity ratio 0.47Actuated Cycle Length (s) 90.0 Sum of lost time (s) 12.0Intersection Capacity Utilization 61.3% ICU Level of Service BAnalysis Period (min) 15c Critical Lane Group

HCM Signalized Intersection Capacity Analysis7: Hesperian Blvd & EB Ramp SR-92 7/14/2017
Existing PM Synchro 8 ReportPage 7
Movement EBL EBT EBR WBL WBT WBR NBL NBT NBR SBL SBT SBRLane ConfigurationsVolume (vph) 138 1 61 0 0 0 0 1359 416 248 1339 0Ideal Flow (vphpl) 1900 1900 1900 1900 1900 1900 1900 1900 1900 1900 1900 1900Total Lost time (s) 3.7 3.7 4.1 4.1 3.7 4.1Lane Util. Factor 1.00 0.88 0.95 1.00 1.00 0.91Frpb, ped/bikes 1.00 1.00 1.00 0.98 1.00 1.00Flpb, ped/bikes 1.00 1.00 1.00 1.00 1.00 1.00Frt 1.00 0.85 1.00 0.85 1.00 1.00Flt Protected 0.95 1.00 1.00 1.00 0.95 1.00Satd. Flow (prot) 1775 2787 3539 1551 1770 5085Flt Permitted 0.95 1.00 1.00 1.00 0.95 1.00Satd. Flow (perm) 1775 2787 3539 1551 1770 5085Peak-hour factor, PHF 0.92 0.92 0.92 0.92 0.92 0.92 0.92 0.92 0.92 0.92 0.92 0.92Adj. Flow (vph) 150 1 66 0 0 0 0 1477 452 270 1455 0RTOR Reduction (vph) 0 0 56 0 0 0 0 0 118 0 0 0Lane Group Flow (vph) 0 151 10 0 0 0 0 1477 334 270 1455 0Confl. Peds. (#/hr) 16 6 6Turn Type Perm NA Perm NA Perm Prot NAProtected Phases 4 2 1 6Permitted Phases 4 4 2Actuated Green, G (s) 12.9 12.9 45.9 45.9 18.2 68.3Effective Green, g (s) 13.4 13.4 46.4 46.4 18.7 68.8Actuated g/C Ratio 0.15 0.15 0.52 0.52 0.21 0.76Clearance Time (s) 4.2 4.2 4.6 4.6 4.2 4.6Vehicle Extension (s) 3.0 3.0 3.0 3.0 3.0 3.0Lane Grp Cap (vph) 264 414 1824 799 367 3887v/s Ratio Prot c0.42 c0.15 0.29v/s Ratio Perm 0.09 0.00 0.22v/c Ratio 0.57 0.02 0.81 0.42 0.74 0.37Uniform Delay, d1 35.6 32.7 18.1 13.5 33.3 3.5Progression Factor 1.00 1.00 1.00 1.00 1.27 0.78Incremental Delay, d2 3.0 0.0 4.0 1.6 6.7 0.2Delay (s) 38.6 32.7 22.1 15.1 49.2 3.0Level of Service D C C B D AApproach Delay (s) 36.8 0.0 20.5 10.2Approach LOS D A C B
Intersection SummaryHCM 2000 Control Delay 16.8 HCM 2000 Level of Service BHCM 2000 Volume to Capacity ratio 0.75Actuated Cycle Length (s) 90.0 Sum of lost time (s) 11.5Intersection Capacity Utilization 69.1% ICU Level of Service CAnalysis Period (min) 15c Critical Lane Group

HCM Signalized Intersection Capacity Analysis8: Hesperian Blvd & Sleepy Hollow Ave 7/14/2017
Existing PM Synchro 8 ReportPage 8
Movement EBL EBT EBR WBL WBT WBR NBL NBT NBR SBL SBT SBRLane ConfigurationsVolume (vph) 122 48 55 16 30 122 39 1510 41 109 1144 125Ideal Flow (vphpl) 1900 1900 1900 1900 1900 1900 1900 1900 1900 1900 1900 1900Total Lost time (s) 4.0 4.0 4.0 4.0 4.0 4.0 4.0 4.0 4.0 4.0Lane Util. Factor 1.00 1.00 1.00 1.00 1.00 1.00 1.00 0.91 1.00 0.91Frpb, ped/bikes 1.00 1.00 0.97 1.00 1.00 0.98 1.00 1.00 1.00 1.00Flpb, ped/bikes 0.99 1.00 1.00 0.98 1.00 1.00 1.00 1.00 1.00 1.00Frt 1.00 1.00 0.85 1.00 1.00 0.85 1.00 1.00 1.00 0.99Flt Protected 0.95 1.00 1.00 0.95 1.00 1.00 0.95 1.00 0.95 1.00Satd. Flow (prot) 1753 1863 1534 1740 1863 1549 1770 5061 1770 4994Flt Permitted 0.74 1.00 1.00 0.72 1.00 1.00 0.95 1.00 0.95 1.00Satd. Flow (perm) 1357 1863 1534 1324 1863 1549 1770 5061 1770 4994Peak-hour factor, PHF 0.92 0.92 0.92 0.92 0.92 0.92 0.92 0.92 0.92 0.92 0.92 0.92Adj. Flow (vph) 133 52 60 17 33 133 42 1641 45 118 1243 136RTOR Reduction (vph) 0 0 51 0 0 112 0 1 0 0 7 0Lane Group Flow (vph) 133 52 9 17 33 21 42 1685 0 118 1372 0Confl. Peds. (#/hr) 8 15 15 8 5 4 4 5Confl. Bikes (#/hr) 1 2Turn Type Perm NA Perm Perm NA Perm Prot NA Prot NAProtected Phases 8 4 5 2 1 6Permitted Phases 8 8 4 4Actuated Green, G (s) 19.4 19.4 19.4 19.4 19.4 19.4 7.4 82.6 14.0 89.2Effective Green, g (s) 20.4 20.4 20.4 20.4 20.4 20.4 7.4 83.6 14.0 90.2Actuated g/C Ratio 0.16 0.16 0.16 0.16 0.16 0.16 0.06 0.64 0.11 0.69Clearance Time (s) 5.0 5.0 5.0 5.0 5.0 5.0 4.0 5.0 4.0 5.0Vehicle Extension (s) 3.0 3.0 3.0 3.0 3.0 3.0 3.0 3.0 3.0 3.0Lane Grp Cap (vph) 212 292 240 207 292 243 100 3254 190 3465v/s Ratio Prot 0.03 0.02 0.02 c0.33 c0.07 0.27v/s Ratio Perm c0.10 0.01 0.01 0.01v/c Ratio 0.63 0.18 0.04 0.08 0.11 0.09 0.42 0.52 0.62 0.40Uniform Delay, d1 51.2 47.5 46.5 46.8 47.0 46.8 59.2 12.4 55.5 8.4Progression Factor 1.00 1.00 1.00 1.00 1.00 1.00 0.63 2.45 1.00 1.00Incremental Delay, d2 5.7 0.3 0.1 0.2 0.2 0.2 2.0 0.4 6.2 0.3Delay (s) 56.9 47.8 46.6 47.0 47.2 47.0 39.2 30.8 61.6 8.7Level of Service E D D D D D D C E AApproach Delay (s) 52.5 47.0 31.1 12.9Approach LOS D D C B
Intersection SummaryHCM 2000 Control Delay 25.9 HCM 2000 Level of Service CHCM 2000 Volume to Capacity ratio 0.55Actuated Cycle Length (s) 130.0 Sum of lost time (s) 12.0Intersection Capacity Utilization 64.8% ICU Level of Service CAnalysis Period (min) 15c Critical Lane Group

HCM Signalized Intersection Capacity Analysis9: Hesperian Blvd & Tennyson Road 7/14/2017
Existing PM Synchro 8 ReportPage 9
Movement EBL EBT EBR WBL WBT WBR NBL NBT NBR SBL SBT SBRLane ConfigurationsVolume (vph) 183 553 75 259 245 151 77 1116 109 201 794 95Ideal Flow (vphpl) 1900 1900 1900 1900 1900 1900 1900 1900 1900 1900 1900 1900Total Lost time (s) 4.0 4.0 4.0 4.0 4.0 4.0 4.0 4.0 4.0 4.0Lane Util. Factor 1.00 0.95 1.00 1.00 0.95 1.00 1.00 0.91 1.00 0.91Frpb, ped/bikes 1.00 1.00 0.96 1.00 1.00 0.97 1.00 1.00 1.00 1.00Flpb, ped/bikes 1.00 1.00 1.00 1.00 1.00 1.00 1.00 1.00 1.00 1.00Frt 1.00 1.00 0.85 1.00 1.00 0.85 1.00 0.99 1.00 0.98Flt Protected 0.95 1.00 1.00 0.95 1.00 1.00 0.95 1.00 0.95 1.00Satd. Flow (prot) 1770 3539 1524 1770 3539 1542 1770 5000 1770 4989Flt Permitted 0.95 1.00 1.00 0.95 1.00 1.00 0.95 1.00 0.95 1.00Satd. Flow (perm) 1770 3539 1524 1770 3539 1542 1770 5000 1770 4989Peak-hour factor, PHF 0.92 0.92 0.92 0.92 0.92 0.92 0.92 0.92 0.92 0.92 0.92 0.92Adj. Flow (vph) 199 601 82 282 266 164 84 1213 118 218 863 103RTOR Reduction (vph) 0 0 64 0 0 121 0 9 0 0 10 0Lane Group Flow (vph) 199 601 18 282 266 43 84 1322 0 218 956 0Confl. Peds. (#/hr) 12 21 21 12 15 25 25 15Confl. Bikes (#/hr) 2 1Turn Type Prot NA Perm Prot NA Perm Prot NA Prot NAProtected Phases 3 8 7 4 1 6 5 2Permitted Phases 8 4Actuated Green, G (s) 17.2 28.1 28.1 21.9 32.8 32.8 11.0 41.4 20.5 50.9Effective Green, g (s) 17.2 29.1 29.1 21.9 33.8 33.8 11.0 42.5 20.5 52.0Actuated g/C Ratio 0.13 0.22 0.22 0.17 0.26 0.26 0.08 0.33 0.16 0.40Clearance Time (s) 4.0 5.0 5.0 4.0 5.0 5.0 4.0 5.1 4.0 5.1Vehicle Extension (s) 3.0 3.0 3.0 3.0 3.0 3.0 3.0 3.0 3.0 3.0Lane Grp Cap (vph) 234 792 341 298 920 400 149 1634 279 1995v/s Ratio Prot 0.11 c0.17 c0.16 0.08 0.05 c0.26 c0.12 0.19v/s Ratio Perm 0.01 0.03v/c Ratio 0.85 0.76 0.05 0.95 0.29 0.11 0.56 0.81 0.78 0.48Uniform Delay, d1 55.1 47.2 39.6 53.5 38.5 36.6 57.2 40.0 52.6 28.9Progression Factor 1.00 1.00 1.00 1.00 1.00 1.00 1.00 1.00 1.07 0.71Incremental Delay, d2 24.4 4.2 0.1 37.6 0.2 0.1 4.8 4.4 12.6 0.8Delay (s) 79.5 51.4 39.7 91.1 38.7 36.7 62.0 44.5 69.1 21.3Level of Service E D D F D D E D E CApproach Delay (s) 56.6 59.0 45.5 30.1Approach LOS E E D C
Intersection SummaryHCM 2000 Control Delay 45.8 HCM 2000 Level of Service DHCM 2000 Volume to Capacity ratio 0.82Actuated Cycle Length (s) 130.0 Sum of lost time (s) 16.0Intersection Capacity Utilization 89.0% ICU Level of Service EAnalysis Period (min) 15c Critical Lane Group
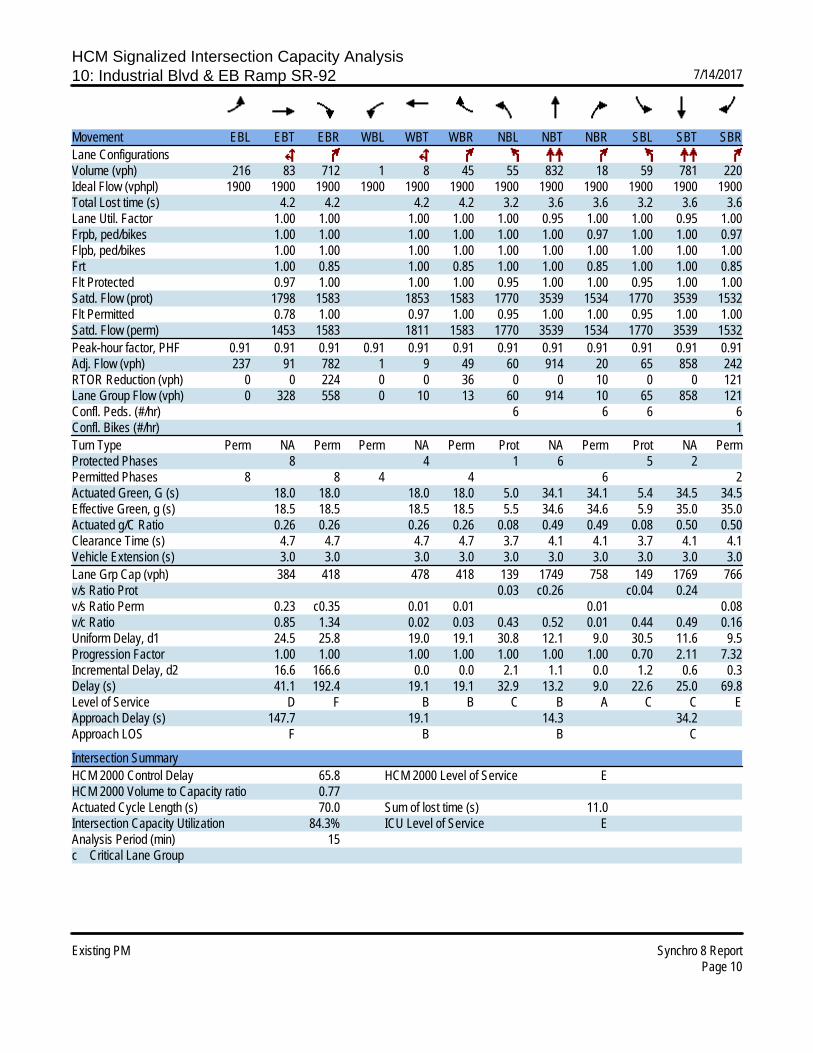
HCM Signalized Intersection Capacity Analysis10: Industrial Blvd & EB Ramp SR-92 7/14/2017
Existing PM Synchro 8 ReportPage 10
Movement EBL EBT EBR WBL WBT WBR NBL NBT NBR SBL SBT SBRLane ConfigurationsVolume (vph) 216 83 712 1 8 45 55 832 18 59 781 220Ideal Flow (vphpl) 1900 1900 1900 1900 1900 1900 1900 1900 1900 1900 1900 1900Total Lost time (s) 4.2 4.2 4.2 4.2 3.2 3.6 3.6 3.2 3.6 3.6Lane Util. Factor 1.00 1.00 1.00 1.00 1.00 0.95 1.00 1.00 0.95 1.00Frpb, ped/bikes 1.00 1.00 1.00 1.00 1.00 1.00 0.97 1.00 1.00 0.97Flpb, ped/bikes 1.00 1.00 1.00 1.00 1.00 1.00 1.00 1.00 1.00 1.00Frt 1.00 0.85 1.00 0.85 1.00 1.00 0.85 1.00 1.00 0.85Flt Protected 0.97 1.00 1.00 1.00 0.95 1.00 1.00 0.95 1.00 1.00Satd. Flow (prot) 1798 1583 1853 1583 1770 3539 1534 1770 3539 1532Flt Permitted 0.78 1.00 0.97 1.00 0.95 1.00 1.00 0.95 1.00 1.00Satd. Flow (perm) 1453 1583 1811 1583 1770 3539 1534 1770 3539 1532Peak-hour factor, PHF 0.91 0.91 0.91 0.91 0.91 0.91 0.91 0.91 0.91 0.91 0.91 0.91Adj. Flow (vph) 237 91 782 1 9 49 60 914 20 65 858 242RTOR Reduction (vph) 0 0 224 0 0 36 0 0 10 0 0 121Lane Group Flow (vph) 0 328 558 0 10 13 60 914 10 65 858 121Confl. Peds. (#/hr) 6 6 6 6Confl. Bikes (#/hr) 1Turn Type Perm NA Perm Perm NA Perm Prot NA Perm Prot NA PermProtected Phases 8 4 1 6 5 2Permitted Phases 8 8 4 4 6 2Actuated Green, G (s) 18.0 18.0 18.0 18.0 5.0 34.1 34.1 5.4 34.5 34.5Effective Green, g (s) 18.5 18.5 18.5 18.5 5.5 34.6 34.6 5.9 35.0 35.0Actuated g/C Ratio 0.26 0.26 0.26 0.26 0.08 0.49 0.49 0.08 0.50 0.50Clearance Time (s) 4.7 4.7 4.7 4.7 3.7 4.1 4.1 3.7 4.1 4.1Vehicle Extension (s) 3.0 3.0 3.0 3.0 3.0 3.0 3.0 3.0 3.0 3.0Lane Grp Cap (vph) 384 418 478 418 139 1749 758 149 1769 766v/s Ratio Prot 0.03 c0.26 c0.04 0.24v/s Ratio Perm 0.23 c0.35 0.01 0.01 0.01 0.08v/c Ratio 0.85 1.34 0.02 0.03 0.43 0.52 0.01 0.44 0.49 0.16Uniform Delay, d1 24.5 25.8 19.0 19.1 30.8 12.1 9.0 30.5 11.6 9.5Progression Factor 1.00 1.00 1.00 1.00 1.00 1.00 1.00 0.70 2.11 7.32Incremental Delay, d2 16.6 166.6 0.0 0.0 2.1 1.1 0.0 1.2 0.6 0.3Delay (s) 41.1 192.4 19.1 19.1 32.9 13.2 9.0 22.6 25.0 69.8Level of Service D F B B C B A C C EApproach Delay (s) 147.7 19.1 14.3 34.2Approach LOS F B B C
Intersection SummaryHCM 2000 Control Delay 65.8 HCM 2000 Level of Service EHCM 2000 Volume to Capacity ratio 0.77Actuated Cycle Length (s) 70.0 Sum of lost time (s) 11.0Intersection Capacity Utilization 84.3% ICU Level of Service EAnalysis Period (min) 15c Critical Lane Group
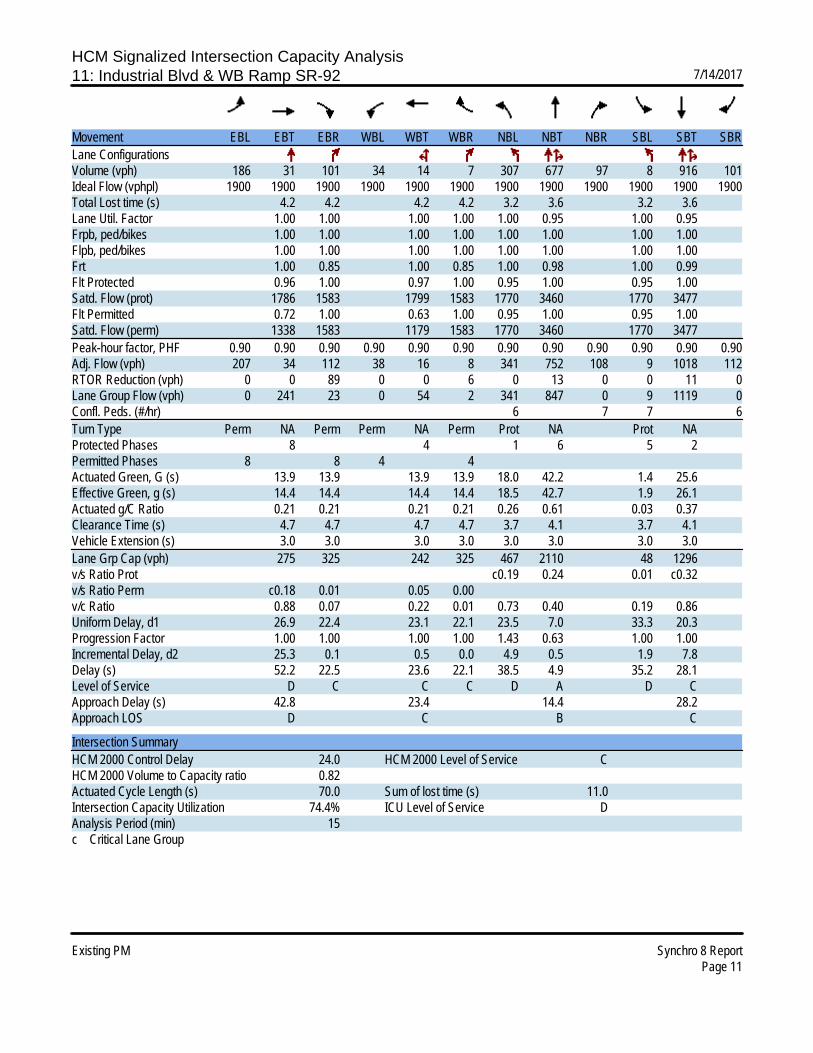
HCM Signalized Intersection Capacity Analysis11: Industrial Blvd & WB Ramp SR-92 7/14/2017
Existing PM Synchro 8 ReportPage 11
Movement EBL EBT EBR WBL WBT WBR NBL NBT NBR SBL SBT SBRLane ConfigurationsVolume (vph) 186 31 101 34 14 7 307 677 97 8 916 101Ideal Flow (vphpl) 1900 1900 1900 1900 1900 1900 1900 1900 1900 1900 1900 1900Total Lost time (s) 4.2 4.2 4.2 4.2 3.2 3.6 3.2 3.6Lane Util. Factor 1.00 1.00 1.00 1.00 1.00 0.95 1.00 0.95Frpb, ped/bikes 1.00 1.00 1.00 1.00 1.00 1.00 1.00 1.00Flpb, ped/bikes 1.00 1.00 1.00 1.00 1.00 1.00 1.00 1.00Frt 1.00 0.85 1.00 0.85 1.00 0.98 1.00 0.99Flt Protected 0.96 1.00 0.97 1.00 0.95 1.00 0.95 1.00Satd. Flow (prot) 1786 1583 1799 1583 1770 3460 1770 3477Flt Permitted 0.72 1.00 0.63 1.00 0.95 1.00 0.95 1.00Satd. Flow (perm) 1338 1583 1179 1583 1770 3460 1770 3477Peak-hour factor, PHF 0.90 0.90 0.90 0.90 0.90 0.90 0.90 0.90 0.90 0.90 0.90 0.90Adj. Flow (vph) 207 34 112 38 16 8 341 752 108 9 1018 112RTOR Reduction (vph) 0 0 89 0 0 6 0 13 0 0 11 0Lane Group Flow (vph) 0 241 23 0 54 2 341 847 0 9 1119 0Confl. Peds. (#/hr) 6 7 7 6Turn Type Perm NA Perm Perm NA Perm Prot NA Prot NAProtected Phases 8 4 1 6 5 2Permitted Phases 8 8 4 4Actuated Green, G (s) 13.9 13.9 13.9 13.9 18.0 42.2 1.4 25.6Effective Green, g (s) 14.4 14.4 14.4 14.4 18.5 42.7 1.9 26.1Actuated g/C Ratio 0.21 0.21 0.21 0.21 0.26 0.61 0.03 0.37Clearance Time (s) 4.7 4.7 4.7 4.7 3.7 4.1 3.7 4.1Vehicle Extension (s) 3.0 3.0 3.0 3.0 3.0 3.0 3.0 3.0Lane Grp Cap (vph) 275 325 242 325 467 2110 48 1296v/s Ratio Prot c0.19 0.24 0.01 c0.32v/s Ratio Perm c0.18 0.01 0.05 0.00v/c Ratio 0.88 0.07 0.22 0.01 0.73 0.40 0.19 0.86Uniform Delay, d1 26.9 22.4 23.1 22.1 23.5 7.0 33.3 20.3Progression Factor 1.00 1.00 1.00 1.00 1.43 0.63 1.00 1.00Incremental Delay, d2 25.3 0.1 0.5 0.0 4.9 0.5 1.9 7.8Delay (s) 52.2 22.5 23.6 22.1 38.5 4.9 35.2 28.1Level of Service D C C C D A D CApproach Delay (s) 42.8 23.4 14.4 28.2Approach LOS D C B C
Intersection SummaryHCM 2000 Control Delay 24.0 HCM 2000 Level of Service CHCM 2000 Volume to Capacity ratio 0.82Actuated Cycle Length (s) 70.0 Sum of lost time (s) 11.0Intersection Capacity Utilization 74.4% ICU Level of Service DAnalysis Period (min) 15c Critical Lane Group

HCM Signalized Intersection Capacity Analysis12: Industrial Blvd & Depot Road 7/14/2017
Existing PM Synchro 8 ReportPage 12
Movement EBL EBT EBR WBL WBT WBR NBL NBT NBR SBL SBT SBRLane ConfigurationsVolume (vph) 70 197 269 45 28 16 118 526 123 43 402 9Ideal Flow (vphpl) 1900 1900 1900 1900 1900 1900 1900 1900 1900 1900 1900 1900Total Lost time (s) 4.0 4.0 4.0 4.5 4.0 4.0 4.0 4.0 4.0 4.0Lane Util. Factor 1.00 1.00 1.00 0.95 1.00 0.95 1.00 1.00 0.95 1.00Frpb, ped/bikes 1.00 1.00 0.98 1.00 1.00 1.00 1.00 1.00 1.00 0.99Flpb, ped/bikes 1.00 1.00 1.00 1.00 1.00 1.00 1.00 1.00 1.00 1.00Frt 1.00 1.00 0.85 0.97 1.00 1.00 0.85 1.00 1.00 0.85Flt Protected 0.95 1.00 1.00 0.98 0.95 1.00 1.00 0.95 1.00 1.00Satd. Flow (prot) 1770 1863 1557 3357 1770 3539 1583 1770 3539 1563Flt Permitted 0.69 1.00 1.00 0.79 0.95 1.00 1.00 0.95 1.00 1.00Satd. Flow (perm) 1290 1863 1557 2706 1770 3539 1583 1770 3539 1563Peak-hour factor, PHF 0.93 0.93 0.93 0.93 0.93 0.93 0.93 0.93 0.93 0.93 0.93 0.93Adj. Flow (vph) 75 212 289 48 30 17 127 566 132 46 432 10RTOR Reduction (vph) 0 0 197 0 12 0 0 0 78 0 0 7Lane Group Flow (vph) 75 212 92 0 83 0 127 566 54 46 432 3Confl. Peds. (#/hr) 3 3 1 1Confl. Bikes (#/hr) 4Turn Type Perm NA Perm Perm NA Prot NA Perm Prot NA PermProtected Phases 4 4 5 2 1 6Permitted Phases 4 4 4 2 6Actuated Green, G (s) 20.4 20.4 20.4 20.4 10.5 26.1 26.1 5.8 21.4 21.4Effective Green, g (s) 20.9 20.9 20.9 20.4 10.5 27.1 27.1 5.8 22.4 22.4Actuated g/C Ratio 0.32 0.32 0.32 0.31 0.16 0.41 0.41 0.09 0.34 0.34Clearance Time (s) 4.5 4.5 4.5 4.5 4.0 5.0 5.0 4.0 5.0 5.0Vehicle Extension (s) 6.0 6.0 6.0 6.0 6.0 8.0 8.0 6.0 8.0 8.0Lane Grp Cap (vph) 409 591 494 838 282 1457 651 156 1204 532v/s Ratio Prot c0.11 c0.07 c0.16 0.03 0.12v/s Ratio Perm 0.06 0.06 0.03 0.03 0.00v/c Ratio 0.18 0.36 0.19 0.10 0.45 0.39 0.08 0.29 0.36 0.01Uniform Delay, d1 16.3 17.3 16.3 16.2 25.0 13.5 11.8 28.1 16.3 14.3Progression Factor 1.00 1.00 1.00 1.00 1.00 1.00 1.00 1.00 1.00 1.00Incremental Delay, d2 0.6 1.1 0.5 0.1 3.2 0.7 0.2 3.0 0.8 0.0Delay (s) 16.9 18.3 16.8 16.3 28.2 14.3 12.0 31.0 17.1 14.4Level of Service B B B B C B B C B BApproach Delay (s) 17.4 16.3 16.1 18.3Approach LOS B B B B
Intersection SummaryHCM 2000 Control Delay 17.0 HCM 2000 Level of Service BHCM 2000 Volume to Capacity ratio 0.41Actuated Cycle Length (s) 65.8 Sum of lost time (s) 12.5Intersection Capacity Utilization 46.5% ICU Level of Service AAnalysis Period (min) 15c Critical Lane Group

HCM Unsignalized Intersection Capacity Analysis13: Depot Road & West Driveway 7/14/2017
Existing PM Synchro 8 ReportPage 13
Movement EBL EBT WBT WBR SBL SBRLane ConfigurationsVolume (veh/h) 10 441 145 40 56 10Sign Control Free Free StopGrade 0% 0% 0%Peak Hour Factor 0.91 0.91 0.91 0.91 0.91 0.91Hourly flow rate (vph) 11 485 159 44 62 11Pedestrians 2 29Lane Width (ft) 12.0 12.0Walking Speed (ft/s) 3.5 3.5Percent Blockage 0 3Right turn flare (veh)Median type None NoneMedian storage veh)Upstream signal (ft)pX, platoon unblockedvC, conflicting volume 232 477 210vC1, stage 1 conf volvC2, stage 2 conf volvCu, unblocked vol 232 477 210tC, single (s) 4.1 6.8 6.9tC, 2 stage (s)tF (s) 2.2 3.5 3.3p0 queue free % 99 88 99cM capacity (veh/h) 1296 498 773
Direction, Lane # EB 1 EB 2 WB 1 SB 1Volume Total 173 323 203 73Volume Left 11 0 0 62Volume Right 0 0 44 11cSH 1296 1700 1700 526Volume to Capacity 0.01 0.19 0.12 0.14Queue Length 95th (ft) 1 0 0 12Control Delay (s) 0.6 0.0 0.0 12.9Lane LOS A BApproach Delay (s) 0.2 0.0 12.9Approach LOS B
Intersection SummaryAverage Delay 1.3Intersection Capacity Utilization 29.7% ICU Level of Service AAnalysis Period (min) 15

HCM Unsignalized Intersection Capacity Analysis14: Dodge Ave/Lot E & Depot Road 7/14/2017
Existing PM Synchro 8 ReportPage 14
Movement EBL EBT EBR WBL WBT WBR NBL NBT NBR SBL SBT SBRLane ConfigurationsSign Control Stop Stop Stop StopVolume (vph) 4 491 5 41 189 32 5 0 29 36 0 2Peak Hour Factor 0.92 0.92 0.92 0.92 0.92 0.92 0.92 0.92 0.92 0.92 0.92 0.92Hourly flow rate (vph) 4 534 5 45 205 35 5 0 32 39 0 2
Direction, Lane # EB 1 EB 2 WB 1 NB 1 SB 1Volume Total (vph) 271 272 285 37 41Volume Left (vph) 4 0 45 5 39Volume Right (vph) 0 5 35 32 2Hadj (s) 0.04 0.02 -0.01 -0.45 0.19Departure Headway (s) 5.0 5.0 4.7 5.3 5.9Degree Utilization, x 0.38 0.38 0.38 0.05 0.07Capacity (veh/h) 709 709 737 606 545Control Delay (s) 9.8 9.8 10.6 8.6 9.3Approach Delay (s) 9.8 10.6 8.6 9.3Approach LOS A B A A
Intersection SummaryDelay 10.0Level of Service AIntersection Capacity Utilization 47.8% ICU Level of Service AAnalysis Period (min) 15

HCM Unsignalized Intersection Capacity Analysis15: Depot Road & Lot F 7/14/2017
Existing PM Synchro 8 ReportPage 15
Movement EBL EBT WBU WBT WBR SBL SBRLane ConfigurationsVolume (veh/h) 13 540 1 251 11 28 13Sign Control Free Free StopGrade 0% 0% 0%Peak Hour Factor 0.92 0.92 0.92 0.92 0.92 0.92 0.92Hourly flow rate (vph) 14 587 0 273 12 30 14Pedestrians 9Lane Width (ft) 12.0Walking Speed (ft/s) 3.5Percent Blockage 1Right turn flare (veh)Median type None NoneMedian storage veh)Upstream signal (ft) 957pX, platoon unblocked 0.00vC, conflicting volume 294 0 610 288vC1, stage 1 conf volvC2, stage 2 conf volvCu, unblocked vol 294 0 610 288tC, single (s) 4.1 0.0 6.8 6.9tC, 2 stage (s)tF (s) 2.2 0.0 3.5 3.3p0 queue free % 99 0 93 98cM capacity (veh/h) 1254 0 418 703
Direction, Lane # EB 1 EB 2 WB 1 SB 1Volume Total 210 391 285 45Volume Left 14 0 0 30Volume Right 0 0 12 14cSH 1254 1700 1700 480Volume to Capacity 0.01 0.23 0.17 0.09Queue Length 95th (ft) 1 0 0 8Control Delay (s) 0.6 0.0 0.0 13.3Lane LOS A BApproach Delay (s) 0.2 0.0 13.3Approach LOS B
Intersection SummaryAverage Delay 0.8Intersection Capacity Utilization 33.2% ICU Level of Service AAnalysis Period (min) 15
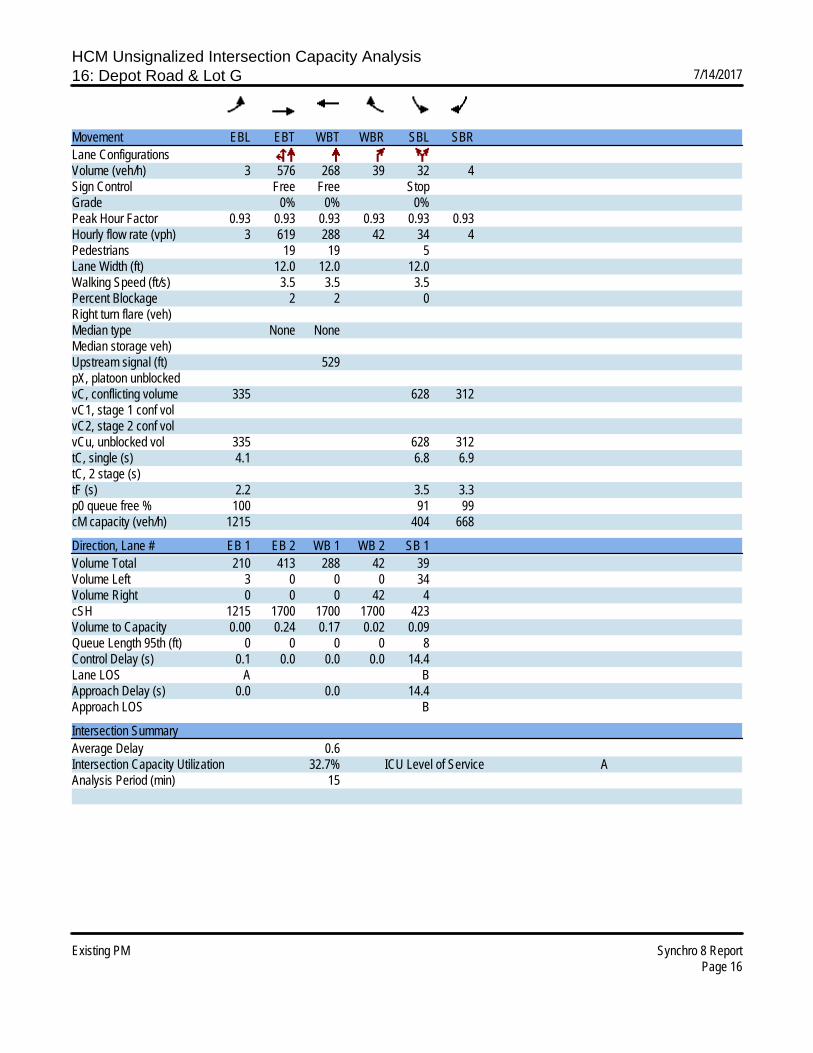
HCM Unsignalized Intersection Capacity Analysis16: Depot Road & Lot G 7/14/2017
Existing PM Synchro 8 ReportPage 16
Movement EBL EBT WBT WBR SBL SBRLane ConfigurationsVolume (veh/h) 3 576 268 39 32 4Sign Control Free Free StopGrade 0% 0% 0%Peak Hour Factor 0.93 0.93 0.93 0.93 0.93 0.93Hourly flow rate (vph) 3 619 288 42 34 4Pedestrians 19 19 5Lane Width (ft) 12.0 12.0 12.0Walking Speed (ft/s) 3.5 3.5 3.5Percent Blockage 2 2 0Right turn flare (veh)Median type None NoneMedian storage veh)Upstream signal (ft) 529pX, platoon unblockedvC, conflicting volume 335 628 312vC1, stage 1 conf volvC2, stage 2 conf volvCu, unblocked vol 335 628 312tC, single (s) 4.1 6.8 6.9tC, 2 stage (s)tF (s) 2.2 3.5 3.3p0 queue free % 100 91 99cM capacity (veh/h) 1215 404 668
Direction, Lane # EB 1 EB 2 WB 1 WB 2 SB 1Volume Total 210 413 288 42 39Volume Left 3 0 0 0 34Volume Right 0 0 0 42 4cSH 1215 1700 1700 1700 423Volume to Capacity 0.00 0.24 0.17 0.02 0.09Queue Length 95th (ft) 0 0 0 0 8Control Delay (s) 0.1 0.0 0.0 0.0 14.4Lane LOS A BApproach Delay (s) 0.0 0.0 14.4Approach LOS B
Intersection SummaryAverage Delay 0.6Intersection Capacity Utilization 32.7% ICU Level of Service AAnalysis Period (min) 15
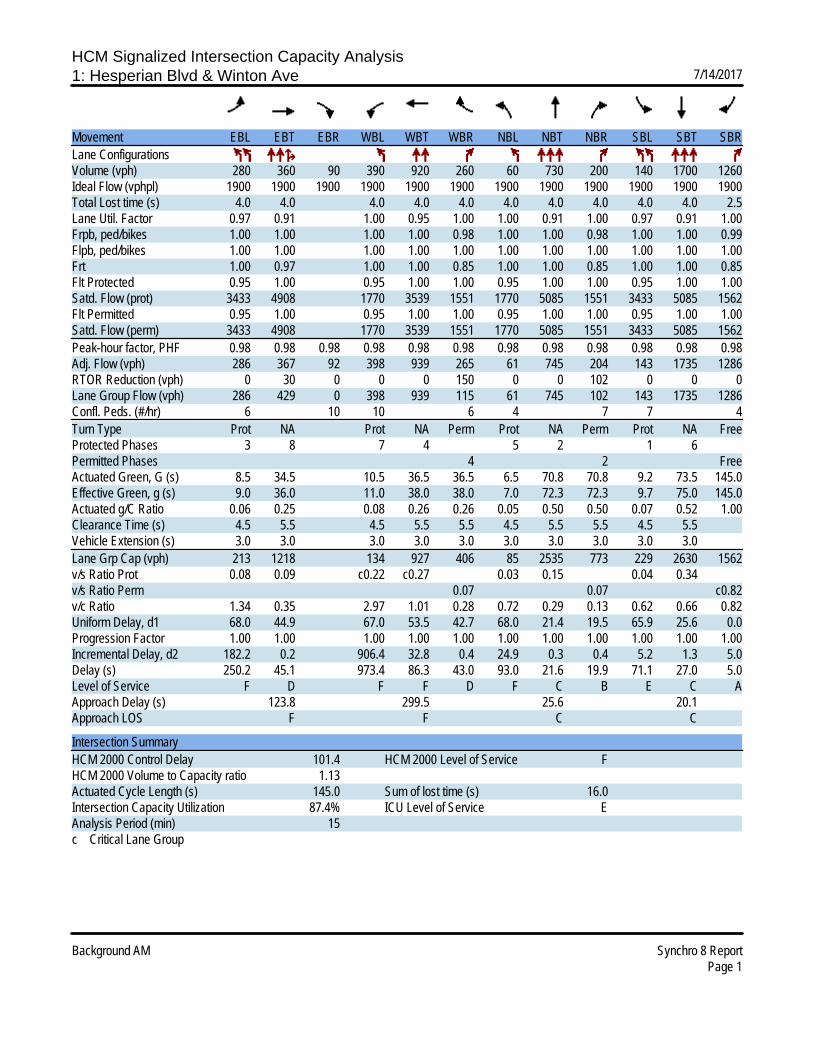
HCM Signalized Intersection Capacity Analysis1: Hesperian Blvd & Winton Ave 7/14/2017
Background AM Synchro 8 ReportPage 1
Movement EBL EBT EBR WBL WBT WBR NBL NBT NBR SBL SBT SBRLane ConfigurationsVolume (vph) 280 360 90 390 920 260 60 730 200 140 1700 1260Ideal Flow (vphpl) 1900 1900 1900 1900 1900 1900 1900 1900 1900 1900 1900 1900Total Lost time (s) 4.0 4.0 4.0 4.0 4.0 4.0 4.0 4.0 4.0 4.0 2.5Lane Util. Factor 0.97 0.91 1.00 0.95 1.00 1.00 0.91 1.00 0.97 0.91 1.00Frpb, ped/bikes 1.00 1.00 1.00 1.00 0.98 1.00 1.00 0.98 1.00 1.00 0.99Flpb, ped/bikes 1.00 1.00 1.00 1.00 1.00 1.00 1.00 1.00 1.00 1.00 1.00Frt 1.00 0.97 1.00 1.00 0.85 1.00 1.00 0.85 1.00 1.00 0.85Flt Protected 0.95 1.00 0.95 1.00 1.00 0.95 1.00 1.00 0.95 1.00 1.00Satd. Flow (prot) 3433 4908 1770 3539 1551 1770 5085 1551 3433 5085 1562Flt Permitted 0.95 1.00 0.95 1.00 1.00 0.95 1.00 1.00 0.95 1.00 1.00Satd. Flow (perm) 3433 4908 1770 3539 1551 1770 5085 1551 3433 5085 1562Peak-hour factor, PHF 0.98 0.98 0.98 0.98 0.98 0.98 0.98 0.98 0.98 0.98 0.98 0.98Adj. Flow (vph) 286 367 92 398 939 265 61 745 204 143 1735 1286RTOR Reduction (vph) 0 30 0 0 0 150 0 0 102 0 0 0Lane Group Flow (vph) 286 429 0 398 939 115 61 745 102 143 1735 1286Confl. Peds. (#/hr) 6 10 10 6 4 7 7 4Turn Type Prot NA Prot NA Perm Prot NA Perm Prot NA FreeProtected Phases 3 8 7 4 5 2 1 6Permitted Phases 4 2 FreeActuated Green, G (s) 8.5 34.5 10.5 36.5 36.5 6.5 70.8 70.8 9.2 73.5 145.0Effective Green, g (s) 9.0 36.0 11.0 38.0 38.0 7.0 72.3 72.3 9.7 75.0 145.0Actuated g/C Ratio 0.06 0.25 0.08 0.26 0.26 0.05 0.50 0.50 0.07 0.52 1.00Clearance Time (s) 4.5 5.5 4.5 5.5 5.5 4.5 5.5 5.5 4.5 5.5Vehicle Extension (s) 3.0 3.0 3.0 3.0 3.0 3.0 3.0 3.0 3.0 3.0Lane Grp Cap (vph) 213 1218 134 927 406 85 2535 773 229 2630 1562v/s Ratio Prot 0.08 0.09 c0.22 c0.27 0.03 0.15 0.04 0.34v/s Ratio Perm 0.07 0.07 c0.82v/c Ratio 1.34 0.35 2.97 1.01 0.28 0.72 0.29 0.13 0.62 0.66 0.82Uniform Delay, d1 68.0 44.9 67.0 53.5 42.7 68.0 21.4 19.5 65.9 25.6 0.0Progression Factor 1.00 1.00 1.00 1.00 1.00 1.00 1.00 1.00 1.00 1.00 1.00Incremental Delay, d2 182.2 0.2 906.4 32.8 0.4 24.9 0.3 0.4 5.2 1.3 5.0Delay (s) 250.2 45.1 973.4 86.3 43.0 93.0 21.6 19.9 71.1 27.0 5.0Level of Service F D F F D F C B E C AApproach Delay (s) 123.8 299.5 25.6 20.1Approach LOS F F C C
Intersection SummaryHCM 2000 Control Delay 101.4 HCM 2000 Level of Service FHCM 2000 Volume to Capacity ratio 1.13Actuated Cycle Length (s) 145.0 Sum of lost time (s) 16.0Intersection Capacity Utilization 87.4% ICU Level of Service EAnalysis Period (min) 15c Critical Lane Group
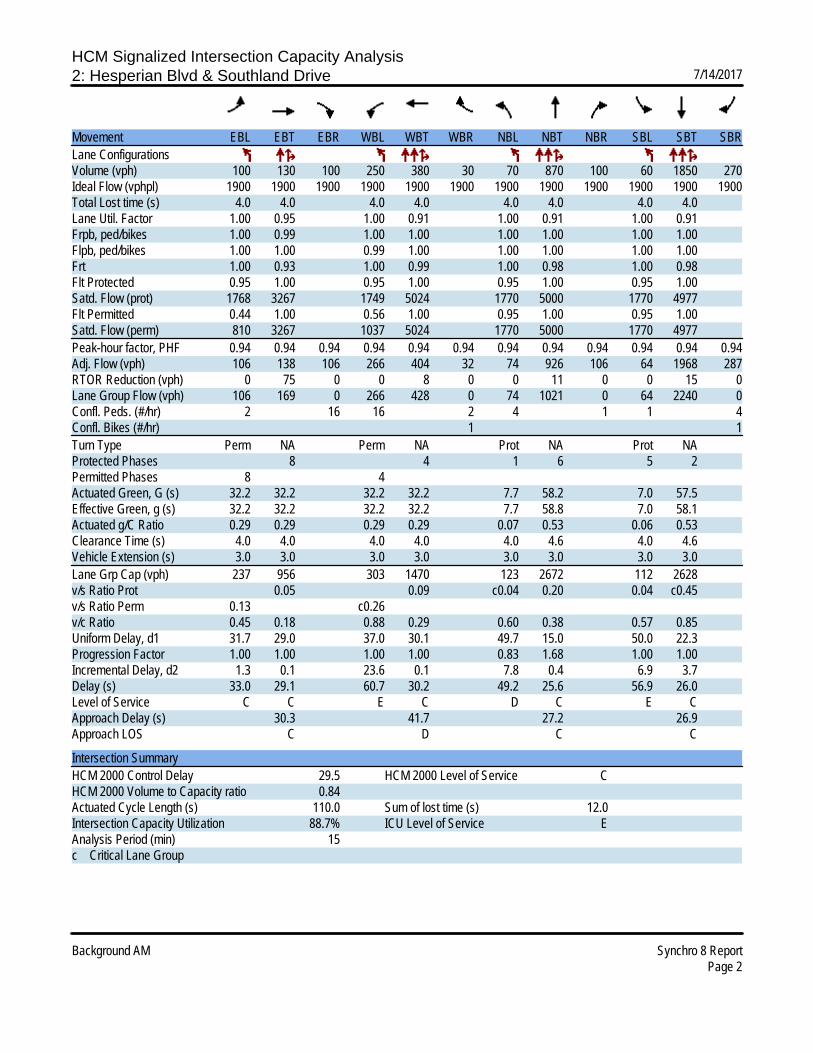
HCM Signalized Intersection Capacity Analysis2: Hesperian Blvd & Southland Drive 7/14/2017
Background AM Synchro 8 ReportPage 2
Movement EBL EBT EBR WBL WBT WBR NBL NBT NBR SBL SBT SBRLane ConfigurationsVolume (vph) 100 130 100 250 380 30 70 870 100 60 1850 270Ideal Flow (vphpl) 1900 1900 1900 1900 1900 1900 1900 1900 1900 1900 1900 1900Total Lost time (s) 4.0 4.0 4.0 4.0 4.0 4.0 4.0 4.0Lane Util. Factor 1.00 0.95 1.00 0.91 1.00 0.91 1.00 0.91Frpb, ped/bikes 1.00 0.99 1.00 1.00 1.00 1.00 1.00 1.00Flpb, ped/bikes 1.00 1.00 0.99 1.00 1.00 1.00 1.00 1.00Frt 1.00 0.93 1.00 0.99 1.00 0.98 1.00 0.98Flt Protected 0.95 1.00 0.95 1.00 0.95 1.00 0.95 1.00Satd. Flow (prot) 1768 3267 1749 5024 1770 5000 1770 4977Flt Permitted 0.44 1.00 0.56 1.00 0.95 1.00 0.95 1.00Satd. Flow (perm) 810 3267 1037 5024 1770 5000 1770 4977Peak-hour factor, PHF 0.94 0.94 0.94 0.94 0.94 0.94 0.94 0.94 0.94 0.94 0.94 0.94Adj. Flow (vph) 106 138 106 266 404 32 74 926 106 64 1968 287RTOR Reduction (vph) 0 75 0 0 8 0 0 11 0 0 15 0Lane Group Flow (vph) 106 169 0 266 428 0 74 1021 0 64 2240 0Confl. Peds. (#/hr) 2 16 16 2 4 1 1 4Confl. Bikes (#/hr) 1 1Turn Type Perm NA Perm NA Prot NA Prot NAProtected Phases 8 4 1 6 5 2Permitted Phases 8 4Actuated Green, G (s) 32.2 32.2 32.2 32.2 7.7 58.2 7.0 57.5Effective Green, g (s) 32.2 32.2 32.2 32.2 7.7 58.8 7.0 58.1Actuated g/C Ratio 0.29 0.29 0.29 0.29 0.07 0.53 0.06 0.53Clearance Time (s) 4.0 4.0 4.0 4.0 4.0 4.6 4.0 4.6Vehicle Extension (s) 3.0 3.0 3.0 3.0 3.0 3.0 3.0 3.0Lane Grp Cap (vph) 237 956 303 1470 123 2672 112 2628v/s Ratio Prot 0.05 0.09 c0.04 0.20 0.04 c0.45v/s Ratio Perm 0.13 c0.26v/c Ratio 0.45 0.18 0.88 0.29 0.60 0.38 0.57 0.85Uniform Delay, d1 31.7 29.0 37.0 30.1 49.7 15.0 50.0 22.3Progression Factor 1.00 1.00 1.00 1.00 0.83 1.68 1.00 1.00Incremental Delay, d2 1.3 0.1 23.6 0.1 7.8 0.4 6.9 3.7Delay (s) 33.0 29.1 60.7 30.2 49.2 25.6 56.9 26.0Level of Service C C E C D C E CApproach Delay (s) 30.3 41.7 27.2 26.9Approach LOS C D C C
Intersection SummaryHCM 2000 Control Delay 29.5 HCM 2000 Level of Service CHCM 2000 Volume to Capacity ratio 0.84Actuated Cycle Length (s) 110.0 Sum of lost time (s) 12.0Intersection Capacity Utilization 88.7% ICU Level of Service EAnalysis Period (min) 15c Critical Lane Group
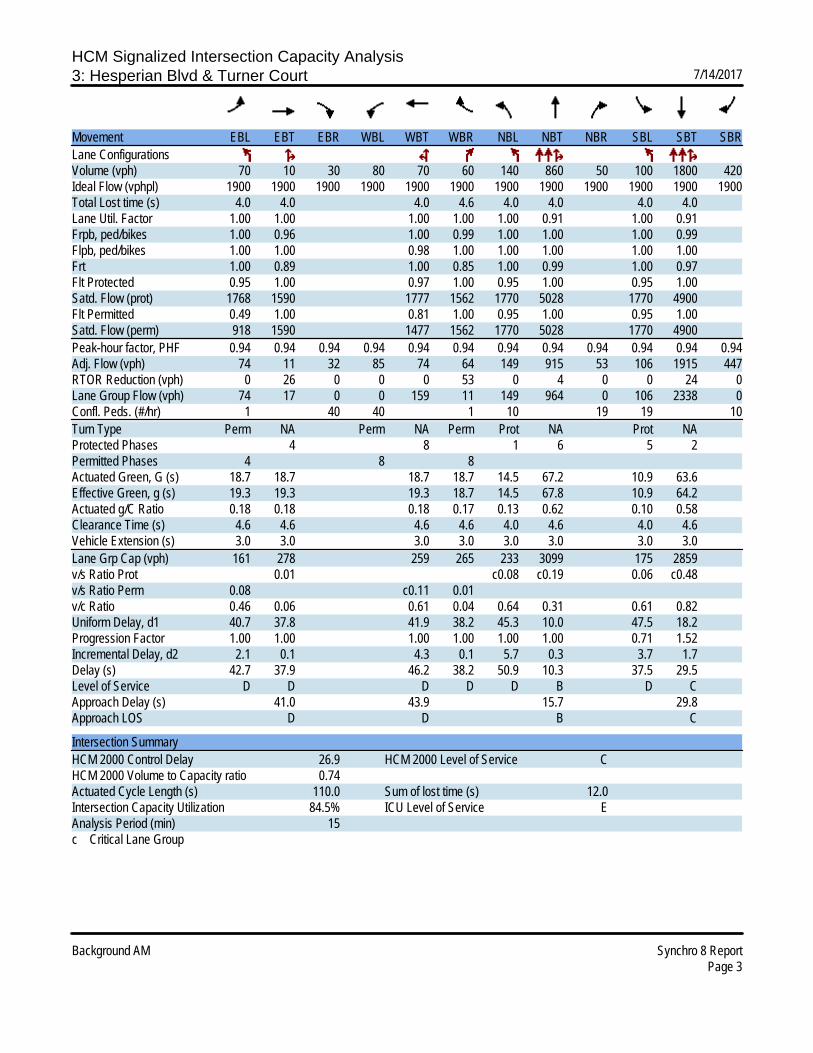
HCM Signalized Intersection Capacity Analysis3: Hesperian Blvd & Turner Court 7/14/2017
Background AM Synchro 8 ReportPage 3
Movement EBL EBT EBR WBL WBT WBR NBL NBT NBR SBL SBT SBRLane ConfigurationsVolume (vph) 70 10 30 80 70 60 140 860 50 100 1800 420Ideal Flow (vphpl) 1900 1900 1900 1900 1900 1900 1900 1900 1900 1900 1900 1900Total Lost time (s) 4.0 4.0 4.0 4.6 4.0 4.0 4.0 4.0Lane Util. Factor 1.00 1.00 1.00 1.00 1.00 0.91 1.00 0.91Frpb, ped/bikes 1.00 0.96 1.00 0.99 1.00 1.00 1.00 0.99Flpb, ped/bikes 1.00 1.00 0.98 1.00 1.00 1.00 1.00 1.00Frt 1.00 0.89 1.00 0.85 1.00 0.99 1.00 0.97Flt Protected 0.95 1.00 0.97 1.00 0.95 1.00 0.95 1.00Satd. Flow (prot) 1768 1590 1777 1562 1770 5028 1770 4900Flt Permitted 0.49 1.00 0.81 1.00 0.95 1.00 0.95 1.00Satd. Flow (perm) 918 1590 1477 1562 1770 5028 1770 4900Peak-hour factor, PHF 0.94 0.94 0.94 0.94 0.94 0.94 0.94 0.94 0.94 0.94 0.94 0.94Adj. Flow (vph) 74 11 32 85 74 64 149 915 53 106 1915 447RTOR Reduction (vph) 0 26 0 0 0 53 0 4 0 0 24 0Lane Group Flow (vph) 74 17 0 0 159 11 149 964 0 106 2338 0Confl. Peds. (#/hr) 1 40 40 1 10 19 19 10Turn Type Perm NA Perm NA Perm Prot NA Prot NAProtected Phases 4 8 1 6 5 2Permitted Phases 4 8 8Actuated Green, G (s) 18.7 18.7 18.7 18.7 14.5 67.2 10.9 63.6Effective Green, g (s) 19.3 19.3 19.3 18.7 14.5 67.8 10.9 64.2Actuated g/C Ratio 0.18 0.18 0.18 0.17 0.13 0.62 0.10 0.58Clearance Time (s) 4.6 4.6 4.6 4.6 4.0 4.6 4.0 4.6Vehicle Extension (s) 3.0 3.0 3.0 3.0 3.0 3.0 3.0 3.0Lane Grp Cap (vph) 161 278 259 265 233 3099 175 2859v/s Ratio Prot 0.01 c0.08 c0.19 0.06 c0.48v/s Ratio Perm 0.08 c0.11 0.01v/c Ratio 0.46 0.06 0.61 0.04 0.64 0.31 0.61 0.82Uniform Delay, d1 40.7 37.8 41.9 38.2 45.3 10.0 47.5 18.2Progression Factor 1.00 1.00 1.00 1.00 1.00 1.00 0.71 1.52Incremental Delay, d2 2.1 0.1 4.3 0.1 5.7 0.3 3.7 1.7Delay (s) 42.7 37.9 46.2 38.2 50.9 10.3 37.5 29.5Level of Service D D D D D B D CApproach Delay (s) 41.0 43.9 15.7 29.8Approach LOS D D B C
Intersection SummaryHCM 2000 Control Delay 26.9 HCM 2000 Level of Service CHCM 2000 Volume to Capacity ratio 0.74Actuated Cycle Length (s) 110.0 Sum of lost time (s) 12.0Intersection Capacity Utilization 84.5% ICU Level of Service EAnalysis Period (min) 15c Critical Lane Group
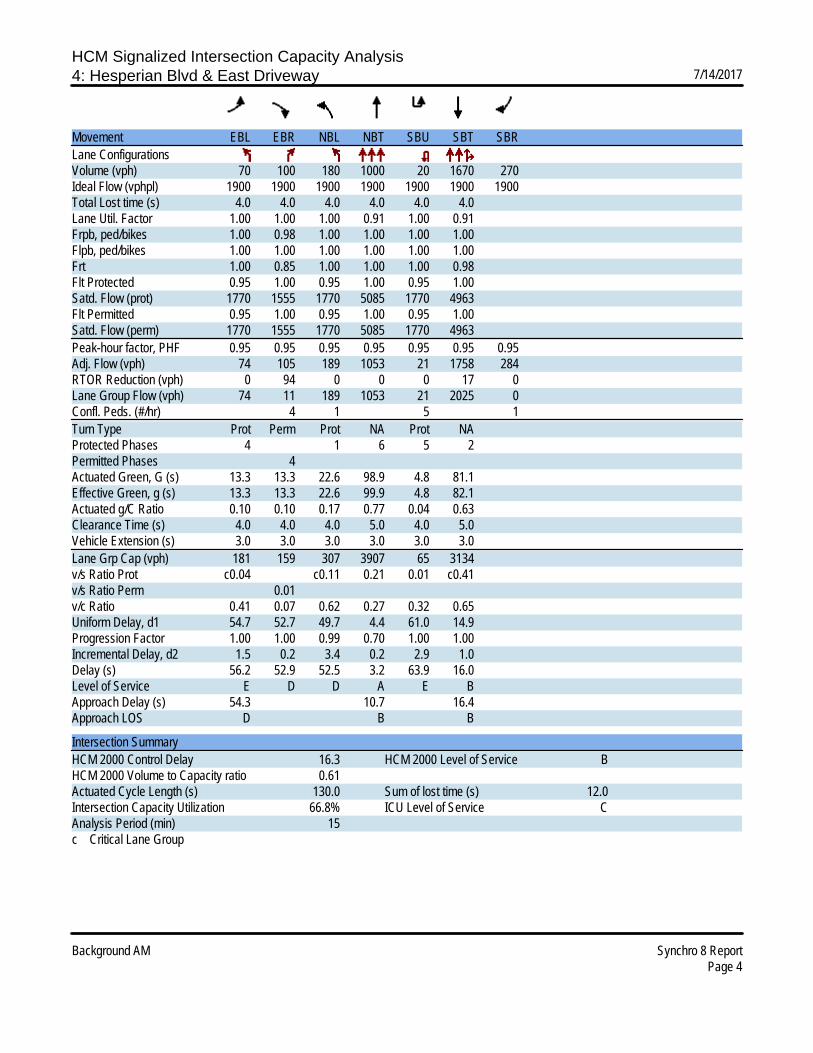
HCM Signalized Intersection Capacity Analysis4: Hesperian Blvd & East Driveway 7/14/2017
Background AM Synchro 8 ReportPage 4
Movement EBL EBR NBL NBT SBU SBT SBRLane ConfigurationsVolume (vph) 70 100 180 1000 20 1670 270Ideal Flow (vphpl) 1900 1900 1900 1900 1900 1900 1900Total Lost time (s) 4.0 4.0 4.0 4.0 4.0 4.0Lane Util. Factor 1.00 1.00 1.00 0.91 1.00 0.91Frpb, ped/bikes 1.00 0.98 1.00 1.00 1.00 1.00Flpb, ped/bikes 1.00 1.00 1.00 1.00 1.00 1.00Frt 1.00 0.85 1.00 1.00 1.00 0.98Flt Protected 0.95 1.00 0.95 1.00 0.95 1.00Satd. Flow (prot) 1770 1555 1770 5085 1770 4963Flt Permitted 0.95 1.00 0.95 1.00 0.95 1.00Satd. Flow (perm) 1770 1555 1770 5085 1770 4963Peak-hour factor, PHF 0.95 0.95 0.95 0.95 0.95 0.95 0.95Adj. Flow (vph) 74 105 189 1053 21 1758 284RTOR Reduction (vph) 0 94 0 0 0 17 0Lane Group Flow (vph) 74 11 189 1053 21 2025 0Confl. Peds. (#/hr) 4 1 5 1Turn Type Prot Perm Prot NA Prot NAProtected Phases 4 1 6 5 2Permitted Phases 4Actuated Green, G (s) 13.3 13.3 22.6 98.9 4.8 81.1Effective Green, g (s) 13.3 13.3 22.6 99.9 4.8 82.1Actuated g/C Ratio 0.10 0.10 0.17 0.77 0.04 0.63Clearance Time (s) 4.0 4.0 4.0 5.0 4.0 5.0Vehicle Extension (s) 3.0 3.0 3.0 3.0 3.0 3.0Lane Grp Cap (vph) 181 159 307 3907 65 3134v/s Ratio Prot c0.04 c0.11 0.21 0.01 c0.41v/s Ratio Perm 0.01v/c Ratio 0.41 0.07 0.62 0.27 0.32 0.65Uniform Delay, d1 54.7 52.7 49.7 4.4 61.0 14.9Progression Factor 1.00 1.00 0.99 0.70 1.00 1.00Incremental Delay, d2 1.5 0.2 3.4 0.2 2.9 1.0Delay (s) 56.2 52.9 52.5 3.2 63.9 16.0Level of Service E D D A E BApproach Delay (s) 54.3 10.7 16.4Approach LOS D B B
Intersection SummaryHCM 2000 Control Delay 16.3 HCM 2000 Level of Service BHCM 2000 Volume to Capacity ratio 0.61Actuated Cycle Length (s) 130.0 Sum of lost time (s) 12.0Intersection Capacity Utilization 66.8% ICU Level of Service CAnalysis Period (min) 15c Critical Lane Group
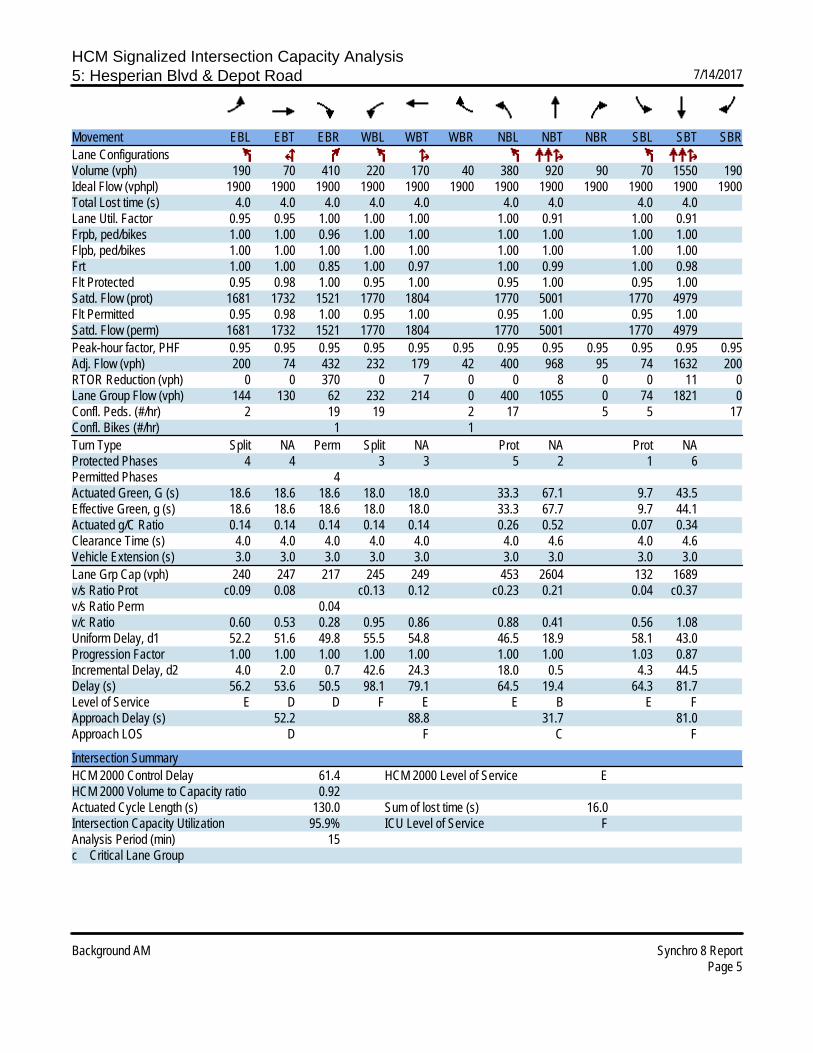
HCM Signalized Intersection Capacity Analysis5: Hesperian Blvd & Depot Road 7/14/2017
Background AM Synchro 8 ReportPage 5
Movement EBL EBT EBR WBL WBT WBR NBL NBT NBR SBL SBT SBRLane ConfigurationsVolume (vph) 190 70 410 220 170 40 380 920 90 70 1550 190Ideal Flow (vphpl) 1900 1900 1900 1900 1900 1900 1900 1900 1900 1900 1900 1900Total Lost time (s) 4.0 4.0 4.0 4.0 4.0 4.0 4.0 4.0 4.0Lane Util. Factor 0.95 0.95 1.00 1.00 1.00 1.00 0.91 1.00 0.91Frpb, ped/bikes 1.00 1.00 0.96 1.00 1.00 1.00 1.00 1.00 1.00Flpb, ped/bikes 1.00 1.00 1.00 1.00 1.00 1.00 1.00 1.00 1.00Frt 1.00 1.00 0.85 1.00 0.97 1.00 0.99 1.00 0.98Flt Protected 0.95 0.98 1.00 0.95 1.00 0.95 1.00 0.95 1.00Satd. Flow (prot) 1681 1732 1521 1770 1804 1770 5001 1770 4979Flt Permitted 0.95 0.98 1.00 0.95 1.00 0.95 1.00 0.95 1.00Satd. Flow (perm) 1681 1732 1521 1770 1804 1770 5001 1770 4979Peak-hour factor, PHF 0.95 0.95 0.95 0.95 0.95 0.95 0.95 0.95 0.95 0.95 0.95 0.95Adj. Flow (vph) 200 74 432 232 179 42 400 968 95 74 1632 200RTOR Reduction (vph) 0 0 370 0 7 0 0 8 0 0 11 0Lane Group Flow (vph) 144 130 62 232 214 0 400 1055 0 74 1821 0Confl. Peds. (#/hr) 2 19 19 2 17 5 5 17Confl. Bikes (#/hr) 1 1Turn Type Split NA Perm Split NA Prot NA Prot NAProtected Phases 4 4 3 3 5 2 1 6Permitted Phases 4Actuated Green, G (s) 18.6 18.6 18.6 18.0 18.0 33.3 67.1 9.7 43.5Effective Green, g (s) 18.6 18.6 18.6 18.0 18.0 33.3 67.7 9.7 44.1Actuated g/C Ratio 0.14 0.14 0.14 0.14 0.14 0.26 0.52 0.07 0.34Clearance Time (s) 4.0 4.0 4.0 4.0 4.0 4.0 4.6 4.0 4.6Vehicle Extension (s) 3.0 3.0 3.0 3.0 3.0 3.0 3.0 3.0 3.0Lane Grp Cap (vph) 240 247 217 245 249 453 2604 132 1689v/s Ratio Prot c0.09 0.08 c0.13 0.12 c0.23 0.21 0.04 c0.37v/s Ratio Perm 0.04v/c Ratio 0.60 0.53 0.28 0.95 0.86 0.88 0.41 0.56 1.08Uniform Delay, d1 52.2 51.6 49.8 55.5 54.8 46.5 18.9 58.1 43.0Progression Factor 1.00 1.00 1.00 1.00 1.00 1.00 1.00 1.03 0.87Incremental Delay, d2 4.0 2.0 0.7 42.6 24.3 18.0 0.5 4.3 44.5Delay (s) 56.2 53.6 50.5 98.1 79.1 64.5 19.4 64.3 81.7Level of Service E D D F E E B E FApproach Delay (s) 52.2 88.8 31.7 81.0Approach LOS D F C F
Intersection SummaryHCM 2000 Control Delay 61.4 HCM 2000 Level of Service EHCM 2000 Volume to Capacity ratio 0.92Actuated Cycle Length (s) 130.0 Sum of lost time (s) 16.0Intersection Capacity Utilization 95.9% ICU Level of Service FAnalysis Period (min) 15c Critical Lane Group

HCM Signalized Intersection Capacity Analysis6: Hesperian Blvd & WB Ramp SR-92 7/14/2017
Background AM Synchro 8 ReportPage 6
Movement EBL EBR NBL NBT SBT SBRLane ConfigurationsVolume (vph) 340 540 320 1010 1660 610Ideal Flow (vphpl) 1900 1900 1900 1900 1900 1900Total Lost time (s) 3.7 3.7 3.7 4.1 4.1Lane Util. Factor 0.97 1.00 1.00 0.91 0.91Frpb, ped/bikes 1.00 1.00 1.00 1.00 0.99Flpb, ped/bikes 1.00 1.00 1.00 1.00 1.00Frt 1.00 0.85 1.00 1.00 0.96Flt Protected 0.95 1.00 0.95 1.00 1.00Satd. Flow (prot) 3433 1583 1770 5085 4832Flt Permitted 0.95 1.00 0.95 1.00 1.00Satd. Flow (perm) 3433 1583 1770 5085 4832Peak-hour factor, PHF 0.97 0.97 0.97 0.97 0.97 0.97Adj. Flow (vph) 351 557 330 1041 1711 629RTOR Reduction (vph) 0 240 0 0 74 0Lane Group Flow (vph) 351 317 330 1041 2266 0Confl. Peds. (#/hr) 13 13Turn Type Perm Perm Prot NA NAProtected Phases 5 2 6Permitted Phases 4 4Actuated Green, G (s) 16.9 16.9 16.0 64.3 44.1Effective Green, g (s) 17.4 17.4 16.5 64.8 44.6Actuated g/C Ratio 0.19 0.19 0.18 0.72 0.50Clearance Time (s) 4.2 4.2 4.2 4.6 4.6Vehicle Extension (s) 3.0 3.0 3.0 3.0 3.0Lane Grp Cap (vph) 663 306 324 3661 2394v/s Ratio Prot c0.19 0.20 c0.47v/s Ratio Perm 0.10 c0.20v/c Ratio 0.53 1.04 1.02 0.28 0.95Uniform Delay, d1 32.6 36.3 36.8 4.4 21.6Progression Factor 1.00 1.00 1.11 1.24 1.00Incremental Delay, d2 0.8 61.5 45.8 0.1 9.5Delay (s) 33.4 97.8 86.5 5.6 31.1Level of Service C F F A CApproach Delay (s) 72.9 25.1 31.1Approach LOS E C C
Intersection SummaryHCM 2000 Control Delay 37.5 HCM 2000 Level of Service DHCM 2000 Volume to Capacity ratio 0.99Actuated Cycle Length (s) 90.0 Sum of lost time (s) 12.0Intersection Capacity Utilization 86.2% ICU Level of Service EAnalysis Period (min) 15c Critical Lane Group

HCM Signalized Intersection Capacity Analysis7: Hesperian Blvd & EB Ramp SR-92 7/14/2017
Background AM Synchro 8 ReportPage 7
Movement EBL EBT EBR WBL WBT WBR NBL NBT NBR SBL SBT SBRLane ConfigurationsVolume (vph) 110 0 120 0 0 0 0 1210 770 300 1920 0Ideal Flow (vphpl) 1900 1900 1900 1900 1900 1900 1900 1900 1900 1900 1900 1900Total Lost time (s) 3.7 3.7 4.1 4.1 3.7 4.1Lane Util. Factor 1.00 0.88 0.95 1.00 1.00 0.91Frpb, ped/bikes 1.00 1.00 1.00 0.98 1.00 1.00Flpb, ped/bikes 1.00 1.00 1.00 1.00 1.00 1.00Frt 1.00 0.85 1.00 0.85 1.00 1.00Flt Protected 0.95 1.00 1.00 1.00 0.95 1.00Satd. Flow (prot) 1770 2787 3539 1551 1770 5085Flt Permitted 0.95 1.00 1.00 1.00 0.95 1.00Satd. Flow (perm) 1770 2787 3539 1551 1770 5085Peak-hour factor, PHF 0.92 0.92 0.92 0.92 0.92 0.92 0.92 0.92 0.92 0.92 0.92 0.92Adj. Flow (vph) 120 0 130 0 0 0 0 1315 837 326 2087 0RTOR Reduction (vph) 0 0 61 0 0 0 0 0 261 0 0 0Lane Group Flow (vph) 0 120 69 0 0 0 0 1315 576 326 2087 0Confl. Peds. (#/hr) 16 6 6Turn Type Perm NA Perm NA Perm Prot NAProtected Phases 4 2 1 6Permitted Phases 4 4 2Actuated Green, G (s) 11.4 11.4 43.3 43.3 22.3 69.8Effective Green, g (s) 11.9 11.9 43.8 43.8 22.8 70.3Actuated g/C Ratio 0.13 0.13 0.49 0.49 0.25 0.78Clearance Time (s) 4.2 4.2 4.6 4.6 4.2 4.6Vehicle Extension (s) 3.0 3.0 3.0 3.0 3.0 3.0Lane Grp Cap (vph) 234 368 1722 754 448 3971v/s Ratio Prot c0.37 c0.18 0.41v/s Ratio Perm 0.07 0.02 0.37v/c Ratio 0.51 0.19 0.76 0.76 0.73 0.53Uniform Delay, d1 36.4 34.8 18.9 18.9 30.8 3.7Progression Factor 1.00 1.00 1.00 1.00 1.07 1.24Incremental Delay, d2 1.9 0.2 3.3 7.2 2.4 0.2Delay (s) 38.2 35.0 22.1 26.1 35.3 4.7Level of Service D D C C D AApproach Delay (s) 36.6 0.0 23.7 8.9Approach LOS D A C A
Intersection SummaryHCM 2000 Control Delay 16.9 HCM 2000 Level of Service BHCM 2000 Volume to Capacity ratio 0.71Actuated Cycle Length (s) 90.0 Sum of lost time (s) 11.5Intersection Capacity Utilization 81.1% ICU Level of Service DAnalysis Period (min) 15c Critical Lane Group

HCM Signalized Intersection Capacity Analysis8: Hesperian Blvd & Sleepy Hollow Ave 7/14/2017
Background AM Synchro 8 ReportPage 8
Movement EBL EBT EBR WBL WBT WBR NBL NBT NBR SBL SBT SBRLane ConfigurationsVolume (vph) 190 90 50 50 110 260 40 1600 40 100 1740 190Ideal Flow (vphpl) 1900 1900 1900 1900 1900 1900 1900 1900 1900 1900 1900 1900Total Lost time (s) 4.0 4.0 4.0 4.0 4.0 4.0 4.0 4.0 4.0 4.0Lane Util. Factor 1.00 1.00 1.00 1.00 1.00 1.00 1.00 0.91 1.00 0.91Frpb, ped/bikes 1.00 1.00 0.97 1.00 1.00 0.98 1.00 1.00 1.00 1.00Flpb, ped/bikes 0.99 1.00 1.00 0.98 1.00 1.00 1.00 1.00 1.00 1.00Frt 1.00 1.00 0.85 1.00 1.00 0.85 1.00 1.00 1.00 0.99Flt Protected 0.95 1.00 1.00 0.95 1.00 1.00 0.95 1.00 0.95 1.00Satd. Flow (prot) 1755 1863 1534 1742 1863 1549 1770 5063 1770 4994Flt Permitted 0.60 1.00 1.00 0.65 1.00 1.00 0.95 1.00 0.95 1.00Satd. Flow (perm) 1115 1863 1534 1191 1863 1549 1770 5063 1770 4994Peak-hour factor, PHF 0.92 0.92 0.92 0.92 0.92 0.92 0.92 0.92 0.92 0.92 0.92 0.92Adj. Flow (vph) 207 98 54 54 120 283 43 1739 43 109 1891 207RTOR Reduction (vph) 0 0 42 0 0 183 0 2 0 0 8 0Lane Group Flow (vph) 207 98 12 54 120 100 43 1780 0 109 2090 0Confl. Peds. (#/hr) 8 15 15 8 5 4 4 5Confl. Bikes (#/hr) 1 2Turn Type Perm NA Perm Perm NA Perm Prot NA Prot NAProtected Phases 8 4 5 2 1 6Permitted Phases 8 8 4 4Actuated Green, G (s) 27.7 27.7 27.7 27.7 27.7 27.7 7.4 75.0 13.3 80.9Effective Green, g (s) 28.7 28.7 28.7 28.7 28.7 28.7 7.4 76.0 13.3 81.9Actuated g/C Ratio 0.22 0.22 0.22 0.22 0.22 0.22 0.06 0.58 0.10 0.63Clearance Time (s) 5.0 5.0 5.0 5.0 5.0 5.0 4.0 5.0 4.0 5.0Vehicle Extension (s) 3.0 3.0 3.0 3.0 3.0 3.0 3.0 3.0 3.0 3.0Lane Grp Cap (vph) 246 411 338 262 411 341 100 2959 181 3146v/s Ratio Prot 0.05 0.06 0.02 0.35 c0.06 c0.42v/s Ratio Perm c0.19 0.01 0.05 0.06v/c Ratio 0.84 0.24 0.04 0.21 0.29 0.29 0.43 0.60 0.60 0.66Uniform Delay, d1 48.5 41.7 39.8 41.3 42.2 42.2 59.3 17.3 55.8 15.3Progression Factor 1.00 1.00 1.00 1.00 1.00 1.00 0.70 1.82 1.00 1.00Incremental Delay, d2 22.1 0.3 0.0 0.4 0.4 0.5 2.5 0.8 5.5 1.1Delay (s) 70.5 42.0 39.8 41.7 42.6 42.7 43.9 32.2 61.4 16.4Level of Service E D D D D D D C E BApproach Delay (s) 58.1 42.5 32.5 18.6Approach LOS E D C B
Intersection SummaryHCM 2000 Control Delay 29.0 HCM 2000 Level of Service CHCM 2000 Volume to Capacity ratio 0.71Actuated Cycle Length (s) 130.0 Sum of lost time (s) 12.0Intersection Capacity Utilization 73.0% ICU Level of Service CAnalysis Period (min) 15c Critical Lane Group

HCM Signalized Intersection Capacity Analysis9: Hesperian Blvd & Tennyson Road 7/14/2017
Background AM Synchro 8 ReportPage 9
Movement EBL EBT EBR WBL WBT WBR NBL NBT NBR SBL SBT SBRLane ConfigurationsVolume (vph) 160 190 40 280 550 200 90 1090 80 180 1300 320Ideal Flow (vphpl) 1900 1900 1900 1900 1900 1900 1900 1900 1900 1900 1900 1900Total Lost time (s) 4.0 4.0 4.0 4.0 4.0 4.0 4.0 4.0 4.0 4.0Lane Util. Factor 1.00 0.95 1.00 1.00 0.95 1.00 1.00 0.91 1.00 0.91Frpb, ped/bikes 1.00 1.00 0.96 1.00 1.00 0.97 1.00 1.00 1.00 0.99Flpb, ped/bikes 1.00 1.00 1.00 1.00 1.00 1.00 1.00 1.00 1.00 1.00Frt 1.00 1.00 0.85 1.00 1.00 0.85 1.00 0.99 1.00 0.97Flt Protected 0.95 1.00 1.00 0.95 1.00 1.00 0.95 1.00 0.95 1.00Satd. Flow (prot) 1770 3539 1523 1770 3539 1542 1770 5019 1770 4906Flt Permitted 0.95 1.00 1.00 0.95 1.00 1.00 0.95 1.00 0.95 1.00Satd. Flow (perm) 1770 3539 1523 1770 3539 1542 1770 5019 1770 4906Peak-hour factor, PHF 0.92 0.92 0.92 0.92 0.92 0.92 0.92 0.92 0.92 0.92 0.92 0.92Adj. Flow (vph) 174 207 43 304 598 217 98 1185 87 196 1413 348RTOR Reduction (vph) 0 0 35 0 0 167 0 6 0 0 27 0Lane Group Flow (vph) 174 207 8 304 598 50 98 1266 0 196 1734 0Confl. Peds. (#/hr) 12 21 21 12 15 25 25 15Confl. Bikes (#/hr) 2 1Turn Type Prot NA Perm Prot NA Perm Prot NA Prot NAProtected Phases 3 8 7 4 1 6 5 2Permitted Phases 8 4Actuated Green, G (s) 16.3 23.4 23.4 22.0 29.1 29.1 11.8 47.6 18.9 54.7Effective Green, g (s) 16.3 24.4 24.4 22.0 30.1 30.1 11.8 48.7 18.9 55.8Actuated g/C Ratio 0.13 0.19 0.19 0.17 0.23 0.23 0.09 0.37 0.15 0.43Clearance Time (s) 4.0 5.0 5.0 4.0 5.0 5.0 4.0 5.1 4.0 5.1Vehicle Extension (s) 3.0 3.0 3.0 3.0 3.0 3.0 3.0 3.0 3.0 3.0Lane Grp Cap (vph) 221 664 285 299 819 357 160 1880 257 2105v/s Ratio Prot 0.10 0.06 c0.17 c0.17 0.06 0.25 c0.11 c0.35v/s Ratio Perm 0.01 0.03v/c Ratio 0.79 0.31 0.03 1.02 0.73 0.14 0.61 0.67 0.76 0.82Uniform Delay, d1 55.2 45.6 43.1 54.0 46.2 39.7 56.9 34.0 53.4 32.8Progression Factor 1.00 1.00 1.00 1.00 1.00 1.00 1.00 1.00 1.51 0.63Incremental Delay, d2 16.7 0.3 0.0 56.4 3.4 0.2 6.8 2.0 9.9 3.0Delay (s) 71.9 45.8 43.2 110.4 49.6 39.9 63.7 36.0 90.4 23.7Level of Service E D D F D D E D F CApproach Delay (s) 56.3 64.2 37.9 30.4Approach LOS E E D C
Intersection SummaryHCM 2000 Control Delay 42.5 HCM 2000 Level of Service DHCM 2000 Volume to Capacity ratio 0.86Actuated Cycle Length (s) 130.0 Sum of lost time (s) 16.0Intersection Capacity Utilization 85.1% ICU Level of Service EAnalysis Period (min) 15c Critical Lane Group

HCM Signalized Intersection Capacity Analysis10: Industrial Blvd & EB Ramp SR-92 7/14/2017
Background AM Synchro 8 ReportPage 10
Movement EBL EBT EBR WBL WBT WBR NBL NBT NBR SBL SBT SBRLane ConfigurationsVolume (vph) 140 10 290 60 60 150 160 1430 30 30 640 220Ideal Flow (vphpl) 1900 1900 1900 1900 1900 1900 1900 1900 1900 1900 1900 1900Total Lost time (s) 4.2 4.2 4.2 4.2 3.2 3.6 3.6 3.2 3.6 3.6Lane Util. Factor 1.00 1.00 1.00 1.00 1.00 0.95 1.00 1.00 0.95 1.00Frpb, ped/bikes 1.00 1.00 1.00 1.00 1.00 1.00 0.97 1.00 1.00 0.97Flpb, ped/bikes 1.00 1.00 1.00 1.00 1.00 1.00 1.00 1.00 1.00 1.00Frt 1.00 0.85 1.00 0.85 1.00 1.00 0.85 1.00 1.00 0.85Flt Protected 0.96 1.00 0.98 1.00 0.95 1.00 1.00 0.95 1.00 1.00Satd. Flow (prot) 1780 1583 1817 1583 1770 3539 1534 1770 3539 1532Flt Permitted 0.64 1.00 0.77 1.00 0.95 1.00 1.00 0.95 1.00 1.00Satd. Flow (perm) 1196 1583 1433 1583 1770 3539 1534 1770 3539 1532Peak-hour factor, PHF 0.91 0.91 0.91 0.91 0.91 0.91 0.91 0.91 0.91 0.91 0.91 0.91Adj. Flow (vph) 154 11 319 66 66 165 176 1571 33 33 703 242RTOR Reduction (vph) 0 0 250 0 0 129 0 0 14 0 0 125Lane Group Flow (vph) 0 165 69 0 132 36 176 1571 19 33 703 117Confl. Peds. (#/hr) 6 6 6 6Confl. Bikes (#/hr) 1Turn Type Perm NA Perm Perm NA Perm Prot NA Perm Prot NA PermProtected Phases 8 4 1 6 5 2Permitted Phases 8 8 4 4 6 2Actuated Green, G (s) 14.7 14.7 14.7 14.7 9.5 39.2 39.2 3.6 33.3 33.3Effective Green, g (s) 15.2 15.2 15.2 15.2 10.0 39.7 39.7 4.1 33.8 33.8Actuated g/C Ratio 0.22 0.22 0.22 0.22 0.14 0.57 0.57 0.06 0.48 0.48Clearance Time (s) 4.7 4.7 4.7 4.7 3.7 4.1 4.1 3.7 4.1 4.1Vehicle Extension (s) 3.0 3.0 3.0 3.0 3.0 3.0 3.0 3.0 3.0 3.0Lane Grp Cap (vph) 259 343 311 343 252 2007 869 103 1708 739v/s Ratio Prot c0.10 c0.44 0.02 0.20v/s Ratio Perm c0.14 0.04 0.09 0.02 0.01 0.08v/c Ratio 0.64 0.20 0.42 0.10 0.70 0.78 0.02 0.32 0.41 0.16Uniform Delay, d1 24.9 22.4 23.6 21.9 28.6 11.8 6.6 31.6 11.7 10.1Progression Factor 1.00 1.00 1.00 1.00 1.00 1.00 1.00 0.68 2.14 6.60Incremental Delay, d2 5.1 0.3 0.9 0.1 8.2 3.1 0.0 0.4 0.2 0.1Delay (s) 30.0 22.7 24.6 22.1 36.7 14.9 6.7 21.9 25.1 67.0Level of Service C C C C D B A C C EApproach Delay (s) 25.2 23.2 16.9 35.4Approach LOS C C B D
Intersection SummaryHCM 2000 Control Delay 23.7 HCM 2000 Level of Service CHCM 2000 Volume to Capacity ratio 0.76Actuated Cycle Length (s) 70.0 Sum of lost time (s) 11.0Intersection Capacity Utilization 72.1% ICU Level of Service CAnalysis Period (min) 15c Critical Lane Group
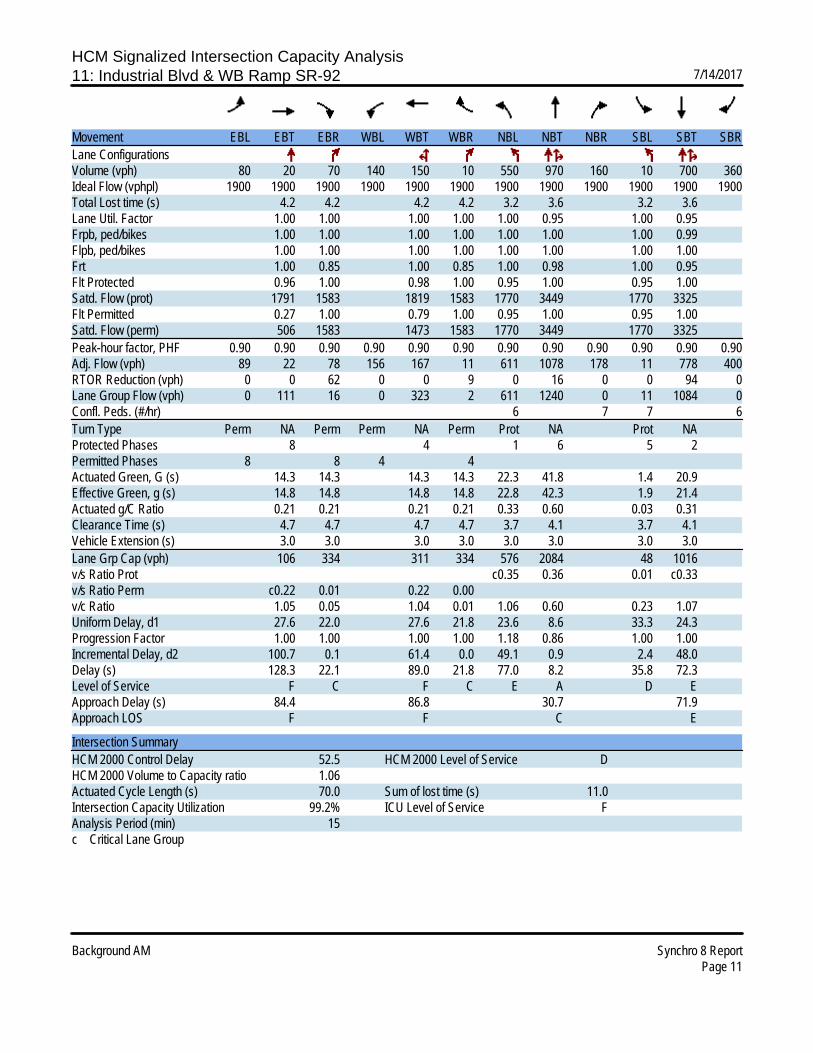
HCM Signalized Intersection Capacity Analysis11: Industrial Blvd & WB Ramp SR-92 7/14/2017
Background AM Synchro 8 ReportPage 11
Movement EBL EBT EBR WBL WBT WBR NBL NBT NBR SBL SBT SBRLane ConfigurationsVolume (vph) 80 20 70 140 150 10 550 970 160 10 700 360Ideal Flow (vphpl) 1900 1900 1900 1900 1900 1900 1900 1900 1900 1900 1900 1900Total Lost time (s) 4.2 4.2 4.2 4.2 3.2 3.6 3.2 3.6Lane Util. Factor 1.00 1.00 1.00 1.00 1.00 0.95 1.00 0.95Frpb, ped/bikes 1.00 1.00 1.00 1.00 1.00 1.00 1.00 0.99Flpb, ped/bikes 1.00 1.00 1.00 1.00 1.00 1.00 1.00 1.00Frt 1.00 0.85 1.00 0.85 1.00 0.98 1.00 0.95Flt Protected 0.96 1.00 0.98 1.00 0.95 1.00 0.95 1.00Satd. Flow (prot) 1791 1583 1819 1583 1770 3449 1770 3325Flt Permitted 0.27 1.00 0.79 1.00 0.95 1.00 0.95 1.00Satd. Flow (perm) 506 1583 1473 1583 1770 3449 1770 3325Peak-hour factor, PHF 0.90 0.90 0.90 0.90 0.90 0.90 0.90 0.90 0.90 0.90 0.90 0.90Adj. Flow (vph) 89 22 78 156 167 11 611 1078 178 11 778 400RTOR Reduction (vph) 0 0 62 0 0 9 0 16 0 0 94 0Lane Group Flow (vph) 0 111 16 0 323 2 611 1240 0 11 1084 0Confl. Peds. (#/hr) 6 7 7 6Turn Type Perm NA Perm Perm NA Perm Prot NA Prot NAProtected Phases 8 4 1 6 5 2Permitted Phases 8 8 4 4Actuated Green, G (s) 14.3 14.3 14.3 14.3 22.3 41.8 1.4 20.9Effective Green, g (s) 14.8 14.8 14.8 14.8 22.8 42.3 1.9 21.4Actuated g/C Ratio 0.21 0.21 0.21 0.21 0.33 0.60 0.03 0.31Clearance Time (s) 4.7 4.7 4.7 4.7 3.7 4.1 3.7 4.1Vehicle Extension (s) 3.0 3.0 3.0 3.0 3.0 3.0 3.0 3.0Lane Grp Cap (vph) 106 334 311 334 576 2084 48 1016v/s Ratio Prot c0.35 0.36 0.01 c0.33v/s Ratio Perm c0.22 0.01 0.22 0.00v/c Ratio 1.05 0.05 1.04 0.01 1.06 0.60 0.23 1.07Uniform Delay, d1 27.6 22.0 27.6 21.8 23.6 8.6 33.3 24.3Progression Factor 1.00 1.00 1.00 1.00 1.18 0.86 1.00 1.00Incremental Delay, d2 100.7 0.1 61.4 0.0 49.1 0.9 2.4 48.0Delay (s) 128.3 22.1 89.0 21.8 77.0 8.2 35.8 72.3Level of Service F C F C E A D EApproach Delay (s) 84.4 86.8 30.7 71.9Approach LOS F F C E
Intersection SummaryHCM 2000 Control Delay 52.5 HCM 2000 Level of Service DHCM 2000 Volume to Capacity ratio 1.06Actuated Cycle Length (s) 70.0 Sum of lost time (s) 11.0Intersection Capacity Utilization 99.2% ICU Level of Service FAnalysis Period (min) 15c Critical Lane Group

HCM Signalized Intersection Capacity Analysis12: Industrial Blvd & Depot Road 7/14/2017
Background AM Synchro 8 ReportPage 12
Movement EBL EBT EBR WBL WBT WBR NBL NBT NBR SBL SBT SBRLane ConfigurationsVolume (vph) 20 40 180 140 150 60 360 370 80 30 740 120Ideal Flow (vphpl) 1900 1900 1900 1900 1900 1900 1900 1900 1900 1900 1900 1900Total Lost time (s) 4.0 4.0 4.0 4.5 4.0 4.0 4.0 4.0 4.0 4.0Lane Util. Factor 1.00 1.00 1.00 0.95 1.00 0.95 1.00 1.00 0.95 1.00Frpb, ped/bikes 1.00 1.00 0.98 1.00 1.00 1.00 1.00 1.00 1.00 0.99Flpb, ped/bikes 1.00 1.00 1.00 1.00 1.00 1.00 1.00 1.00 1.00 1.00Frt 1.00 1.00 0.85 0.97 1.00 1.00 0.85 1.00 1.00 0.85Flt Protected 0.95 1.00 1.00 0.98 0.95 1.00 1.00 0.95 1.00 1.00Satd. Flow (prot) 1770 1863 1554 3376 1770 3539 1583 1770 3539 1562Flt Permitted 0.44 1.00 1.00 0.82 0.95 1.00 1.00 0.95 1.00 1.00Satd. Flow (perm) 825 1863 1554 2818 1770 3539 1583 1770 3539 1562Peak-hour factor, PHF 0.93 0.93 0.93 0.93 0.93 0.93 0.93 0.93 0.93 0.93 0.93 0.93Adj. Flow (vph) 22 43 194 151 161 65 387 398 86 32 796 129RTOR Reduction (vph) 0 0 143 0 19 0 0 0 40 0 0 82Lane Group Flow (vph) 22 43 51 0 358 0 387 398 46 32 796 47Confl. Peds. (#/hr) 3 3 1 1Confl. Bikes (#/hr) 4Turn Type Perm NA Perm Perm NA Prot NA Perm Prot NA PermProtected Phases 4 4 5 2 1 6Permitted Phases 4 4 4 2 6Actuated Green, G (s) 22.9 22.9 22.9 22.9 21.4 47.2 47.2 6.1 31.9 31.9Effective Green, g (s) 23.4 23.4 23.4 22.9 21.4 48.2 48.2 6.1 32.9 32.9Actuated g/C Ratio 0.26 0.26 0.26 0.26 0.24 0.54 0.54 0.07 0.37 0.37Clearance Time (s) 4.5 4.5 4.5 4.5 4.0 5.0 5.0 4.0 5.0 5.0Vehicle Extension (s) 6.0 6.0 6.0 6.0 6.0 8.0 8.0 6.0 8.0 8.0Lane Grp Cap (vph) 215 486 405 719 422 1901 850 120 1298 572v/s Ratio Prot 0.02 c0.22 0.11 0.02 c0.22v/s Ratio Perm 0.03 0.03 c0.13 0.03 0.03v/c Ratio 0.10 0.09 0.12 0.50 0.92 0.21 0.05 0.27 0.61 0.08Uniform Delay, d1 25.2 25.1 25.3 28.5 33.3 10.8 9.9 39.7 23.2 18.5Progression Factor 1.00 1.00 1.00 1.00 1.00 1.00 1.00 1.00 1.00 1.00Incremental Delay, d2 0.6 0.2 0.4 1.5 26.2 0.2 0.1 3.3 2.0 0.3Delay (s) 25.8 25.3 25.7 30.0 59.5 11.1 10.0 43.0 25.2 18.8Level of Service C C C C E B B D C BApproach Delay (s) 25.7 30.0 32.5 25.0Approach LOS C C C C
Intersection SummaryHCM 2000 Control Delay 28.5 HCM 2000 Level of Service CHCM 2000 Volume to Capacity ratio 0.66Actuated Cycle Length (s) 89.7 Sum of lost time (s) 12.5Intersection Capacity Utilization 67.6% ICU Level of Service CAnalysis Period (min) 15c Critical Lane Group

HCM Unsignalized Intersection Capacity Analysis13: Depot Road & West Driveway 7/14/2017
Background AM Synchro 8 ReportPage 13
Movement EBL EBT WBT WBR SBL SBRLane ConfigurationsVolume (veh/h) 20 470 450 80 20 10Sign Control Free Free StopGrade 0% 0% 0%Peak Hour Factor 0.91 0.91 0.91 0.91 0.91 0.91Hourly flow rate (vph) 22 516 495 88 22 11Pedestrians 2 29Lane Width (ft) 12.0 12.0Walking Speed (ft/s) 3.5 3.5Percent Blockage 0 3Right turn flare (veh)Median type None NoneMedian storage veh)Upstream signal (ft)pX, platoon unblockedvC, conflicting volume 611 872 567vC1, stage 1 conf volvC2, stage 2 conf volvCu, unblocked vol 611 872 567tC, single (s) 4.1 6.8 6.9tC, 2 stage (s)tF (s) 2.2 3.5 3.3p0 queue free % 98 92 98cM capacity (veh/h) 937 275 454
Direction, Lane # EB 1 EB 2 WB 1 SB 1Volume Total 194 344 582 33Volume Left 22 0 0 22Volume Right 0 0 88 11cSH 937 1700 1700 316Volume to Capacity 0.02 0.20 0.34 0.10Queue Length 95th (ft) 2 0 0 9Control Delay (s) 1.2 0.0 0.0 17.7Lane LOS A CApproach Delay (s) 0.4 0.0 17.7Approach LOS C
Intersection SummaryAverage Delay 0.7Intersection Capacity Utilization 38.9% ICU Level of Service AAnalysis Period (min) 15
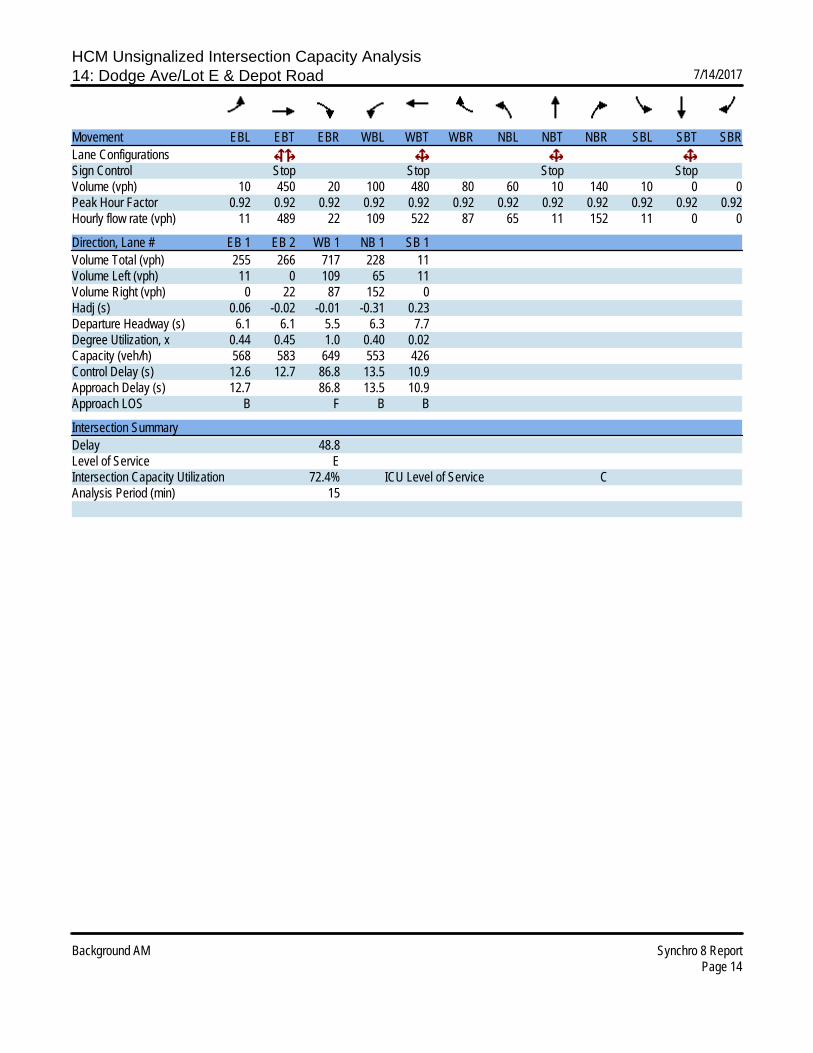
HCM Unsignalized Intersection Capacity Analysis14: Dodge Ave/Lot E & Depot Road 7/14/2017
Background AM Synchro 8 ReportPage 14
Movement EBL EBT EBR WBL WBT WBR NBL NBT NBR SBL SBT SBRLane ConfigurationsSign Control Stop Stop Stop StopVolume (vph) 10 450 20 100 480 80 60 10 140 10 0 0Peak Hour Factor 0.92 0.92 0.92 0.92 0.92 0.92 0.92 0.92 0.92 0.92 0.92 0.92Hourly flow rate (vph) 11 489 22 109 522 87 65 11 152 11 0 0
Direction, Lane # EB 1 EB 2 WB 1 NB 1 SB 1Volume Total (vph) 255 266 717 228 11Volume Left (vph) 11 0 109 65 11Volume Right (vph) 0 22 87 152 0Hadj (s) 0.06 -0.02 -0.01 -0.31 0.23Departure Headway (s) 6.1 6.1 5.5 6.3 7.7Degree Utilization, x 0.44 0.45 1.0 0.40 0.02Capacity (veh/h) 568 583 649 553 426Control Delay (s) 12.6 12.7 86.8 13.5 10.9Approach Delay (s) 12.7 86.8 13.5 10.9Approach LOS B F B B
Intersection SummaryDelay 48.8Level of Service EIntersection Capacity Utilization 72.4% ICU Level of Service CAnalysis Period (min) 15

HCM Unsignalized Intersection Capacity Analysis15: Depot Road & Lot F 7/14/2017
Background AM Synchro 8 ReportPage 15
Movement EBL EBT WBT WBR SBL SBRLane ConfigurationsVolume (veh/h) 20 570 550 30 10 110Sign Control Free Free StopGrade 0% 0% 0%Peak Hour Factor 0.92 0.92 0.92 0.92 0.92 0.92Hourly flow rate (vph) 22 620 598 33 11 120Pedestrians 9Lane Width (ft) 12.0Walking Speed (ft/s) 3.5Percent Blockage 1Right turn flare (veh)Median type None NoneMedian storage veh)Upstream signal (ft) 957pX, platoon unblocked 0.97 0.97 0.97vC, conflicting volume 639 976 623vC1, stage 1 conf volvC2, stage 2 conf volvCu, unblocked vol 611 959 594tC, single (s) 4.1 6.8 6.9tC, 2 stage (s)tF (s) 2.2 3.5 3.3p0 queue free % 98 95 72cM capacity (veh/h) 925 239 430
Direction, Lane # EB 1 EB 2 WB 1 SB 1Volume Total 228 413 630 130Volume Left 22 0 0 11Volume Right 0 0 33 120cSH 925 1700 1700 403Volume to Capacity 0.02 0.24 0.37 0.32Queue Length 95th (ft) 2 0 0 34Control Delay (s) 1.1 0.0 0.0 18.1Lane LOS A CApproach Delay (s) 0.4 0.0 18.1Approach LOS C
Intersection SummaryAverage Delay 1.9Intersection Capacity Utilization 44.8% ICU Level of Service AAnalysis Period (min) 15

HCM Unsignalized Intersection Capacity Analysis16: Depot Road & Lot G 7/14/2017
Background AM Synchro 8 ReportPage 16
Movement EBL EBT WBT WBR SBL SBRLane ConfigurationsVolume (veh/h) 0 590 580 80 10 10Sign Control Free Free StopGrade 0% 0% 0%Peak Hour Factor 0.93 0.93 0.93 0.93 0.93 0.93Hourly flow rate (vph) 0 634 624 86 11 11Pedestrians 19 19 5Lane Width (ft) 12.0 12.0 12.0Walking Speed (ft/s) 3.5 3.5 3.5Percent Blockage 2 2 0Right turn flare (veh)Median type None NoneMedian storage veh)Upstream signal (ft) 529pX, platoon unblocked 0.93 0.93 0.93vC, conflicting volume 715 965 648vC1, stage 1 conf volvC2, stage 2 conf volvCu, unblocked vol 654 924 582tC, single (s) 4.1 6.8 6.9tC, 2 stage (s)tF (s) 2.2 3.5 3.3p0 queue free % 100 96 97cM capacity (veh/h) 858 244 414
Direction, Lane # EB 1 EB 2 WB 1 WB 2 SB 1Volume Total 211 423 624 86 22Volume Left 0 0 0 0 11Volume Right 0 0 0 86 11cSH 858 1700 1700 1700 307Volume to Capacity 0.00 0.25 0.37 0.05 0.07Queue Length 95th (ft) 0 0 0 0 6Control Delay (s) 0.0 0.0 0.0 0.0 17.6Lane LOS CApproach Delay (s) 0.0 0.0 17.6Approach LOS C
Intersection SummaryAverage Delay 0.3Intersection Capacity Utilization 45.2% ICU Level of Service AAnalysis Period (min) 15

HCM Signalized Intersection Capacity Analysis1: Hesperian Blvd & Winton Ave 7/14/2017
Background PM Synchro 8 ReportPage 1
Movement EBL EBT EBR WBL WBT WBR NBL NBT NBR SBL SBT SBRLane ConfigurationsVolume (vph) 760 1150 90 320 340 190 80 1530 300 240 770 260Ideal Flow (vphpl) 1900 1900 1900 1900 1900 1900 1900 1900 1900 1900 1900 1900Total Lost time (s) 4.0 4.0 4.0 4.0 4.0 4.0 4.0 4.0 4.0 4.0 2.5Lane Util. Factor 0.97 0.91 1.00 0.95 1.00 1.00 0.91 1.00 0.97 0.91 1.00Frpb, ped/bikes 1.00 1.00 1.00 1.00 0.98 1.00 1.00 0.98 1.00 1.00 0.99Flpb, ped/bikes 1.00 1.00 1.00 1.00 1.00 1.00 1.00 1.00 1.00 1.00 1.00Frt 1.00 0.99 1.00 1.00 0.85 1.00 1.00 0.85 1.00 1.00 0.85Flt Protected 0.95 1.00 0.95 1.00 1.00 0.95 1.00 1.00 0.95 1.00 1.00Satd. Flow (prot) 3433 5021 1770 3539 1551 1770 5085 1551 3433 5085 1562Flt Permitted 0.95 1.00 0.95 1.00 1.00 0.95 1.00 1.00 0.95 1.00 1.00Satd. Flow (perm) 3433 5021 1770 3539 1551 1770 5085 1551 3433 5085 1562Peak-hour factor, PHF 0.98 0.98 0.98 0.98 0.98 0.98 0.98 0.98 0.98 0.98 0.98 0.98Adj. Flow (vph) 776 1173 92 327 347 194 82 1561 306 245 786 265RTOR Reduction (vph) 0 6 0 0 0 70 0 0 80 0 0 0Lane Group Flow (vph) 776 1259 0 327 347 124 82 1561 226 245 786 265Confl. Peds. (#/hr) 6 10 10 6 4 7 7 4Turn Type Prot NA Prot NA Perm Prot NA Perm Prot NA FreeProtected Phases 3 8 7 4 5 2 1 6Permitted Phases 4 2 FreeActuated Green, G (s) 8.5 34.5 10.5 36.5 36.5 6.5 70.5 70.5 9.5 73.5 145.0Effective Green, g (s) 9.0 36.0 11.0 38.0 38.0 7.0 72.0 72.0 10.0 75.0 145.0Actuated g/C Ratio 0.06 0.25 0.08 0.26 0.26 0.05 0.50 0.50 0.07 0.52 1.00Clearance Time (s) 4.5 5.5 4.5 5.5 5.5 4.5 5.5 5.5 4.5 5.5Vehicle Extension (s) 3.0 3.0 3.0 3.0 3.0 3.0 3.0 3.0 3.0 3.0Lane Grp Cap (vph) 213 1246 134 927 406 85 2524 770 236 2630 1562v/s Ratio Prot c0.23 c0.25 0.18 0.10 0.05 c0.31 c0.07 0.15v/s Ratio Perm 0.08 0.15 c0.17v/c Ratio 3.64 1.01 2.44 0.37 0.31 0.96 0.62 0.29 1.04 0.30 0.17Uniform Delay, d1 68.0 54.5 67.0 43.8 42.9 68.9 26.5 21.5 67.5 20.0 0.0Progression Factor 1.00 1.00 1.00 1.00 1.00 1.00 1.00 1.00 1.00 1.00 1.00Incremental Delay, d2 1201.0 28.1 670.1 0.3 0.4 85.2 1.1 1.0 68.9 0.3 0.2Delay (s) 1269.0 82.6 737.1 44.0 43.3 154.0 27.7 22.5 136.4 20.3 0.2Level of Service F F F D D F C C F C AApproach Delay (s) 533.7 305.0 32.2 38.1Approach LOS F F C D
Intersection SummaryHCM 2000 Control Delay 238.2 HCM 2000 Level of Service FHCM 2000 Volume to Capacity ratio 0.96Actuated Cycle Length (s) 145.0 Sum of lost time (s) 16.0Intersection Capacity Utilization 92.9% ICU Level of Service FAnalysis Period (min) 15c Critical Lane Group

HCM Signalized Intersection Capacity Analysis2: Hesperian Blvd & Southland Drive 7/14/2017
Background PM Synchro 8 ReportPage 2
Movement EBL EBT EBR WBL WBT WBR NBL NBT NBR SBL SBT SBRLane ConfigurationsVolume (vph) 240 470 80 110 110 130 80 1590 160 180 820 150Ideal Flow (vphpl) 1900 1900 1900 1900 1900 1900 1900 1900 1900 1900 1900 1900Total Lost time (s) 4.0 4.0 4.0 4.0 4.0 4.0 4.0 4.0Lane Util. Factor 1.00 0.95 1.00 0.91 1.00 0.91 1.00 0.91Frpb, ped/bikes 1.00 1.00 1.00 0.99 1.00 1.00 1.00 1.00Flpb, ped/bikes 1.00 1.00 0.99 1.00 1.00 1.00 1.00 1.00Frt 1.00 0.98 1.00 0.92 1.00 0.99 1.00 0.98Flt Protected 0.95 1.00 0.95 1.00 0.95 1.00 0.95 1.00Satd. Flow (prot) 1767 3448 1759 4635 1770 5010 1770 4954Flt Permitted 0.58 1.00 0.26 1.00 0.95 1.00 0.95 1.00Satd. Flow (perm) 1083 3448 489 4635 1770 5010 1770 4954Peak-hour factor, PHF 0.94 0.94 0.94 0.94 0.94 0.94 0.94 0.94 0.94 0.94 0.94 0.94Adj. Flow (vph) 255 500 85 117 117 138 85 1691 170 191 872 160RTOR Reduction (vph) 0 14 0 0 98 0 0 11 0 0 21 0Lane Group Flow (vph) 255 571 0 117 157 0 85 1850 0 191 1011 0Confl. Peds. (#/hr) 2 16 16 2 4 1 1 4Confl. Bikes (#/hr) 1 1Turn Type Perm NA Perm NA Prot NA Prot NAProtected Phases 8 4 1 6 5 2Permitted Phases 8 4Actuated Green, G (s) 31.5 31.5 31.5 31.5 7.9 50.4 15.5 58.0Effective Green, g (s) 31.5 31.5 31.5 31.5 7.9 51.0 15.5 58.6Actuated g/C Ratio 0.29 0.29 0.29 0.29 0.07 0.46 0.14 0.53Clearance Time (s) 4.0 4.0 4.0 4.0 4.0 4.6 4.0 4.6Vehicle Extension (s) 3.0 3.0 3.0 3.0 3.0 3.0 3.0 3.0Lane Grp Cap (vph) 310 987 140 1327 127 2322 249 2639v/s Ratio Prot 0.17 0.03 0.05 c0.37 c0.11 0.20v/s Ratio Perm 0.24 c0.24v/c Ratio 0.82 0.58 0.84 0.12 0.67 0.80 0.77 0.38Uniform Delay, d1 36.6 33.6 36.8 29.0 49.8 25.1 45.5 15.1Progression Factor 1.00 1.00 1.00 1.00 0.71 1.59 1.00 1.00Incremental Delay, d2 16.0 0.8 32.9 0.0 10.2 2.4 13.2 0.4Delay (s) 52.6 34.4 69.8 29.0 45.4 42.3 58.7 15.5Level of Service D C E C D D E BApproach Delay (s) 39.9 41.8 42.5 22.3Approach LOS D D D C
Intersection SummaryHCM 2000 Control Delay 36.3 HCM 2000 Level of Service DHCM 2000 Volume to Capacity ratio 0.80Actuated Cycle Length (s) 110.0 Sum of lost time (s) 12.0Intersection Capacity Utilization 85.0% ICU Level of Service EAnalysis Period (min) 15c Critical Lane Group

HCM Signalized Intersection Capacity Analysis3: Hesperian Blvd & Turner Court 7/14/2017
Background PM Synchro 8 ReportPage 3
Movement EBL EBT EBR WBL WBT WBR NBL NBT NBR SBL SBT SBRLane ConfigurationsVolume (vph) 150 30 70 60 20 70 80 1760 70 110 930 120Ideal Flow (vphpl) 1900 1900 1900 1900 1900 1900 1900 1900 1900 1900 1900 1900Total Lost time (s) 4.0 4.0 4.0 4.6 4.0 4.0 4.0 4.0Lane Util. Factor 1.00 1.00 1.00 1.00 1.00 0.91 1.00 0.91Frpb, ped/bikes 1.00 0.96 1.00 0.99 1.00 1.00 1.00 1.00Flpb, ped/bikes 1.00 1.00 0.97 1.00 1.00 1.00 1.00 1.00Frt 1.00 0.90 1.00 0.85 1.00 0.99 1.00 0.98Flt Protected 0.95 1.00 0.96 1.00 0.95 1.00 0.95 1.00Satd. Flow (prot) 1768 1607 1748 1562 1770 5045 1770 4973Flt Permitted 0.69 1.00 0.72 1.00 0.95 1.00 0.95 1.00Satd. Flow (perm) 1278 1607 1310 1562 1770 5045 1770 4973Peak-hour factor, PHF 0.94 0.94 0.94 0.94 0.94 0.94 0.94 0.94 0.94 0.94 0.94 0.94Adj. Flow (vph) 160 32 74 64 21 74 85 1872 74 117 989 128RTOR Reduction (vph) 0 60 0 0 0 61 0 3 0 0 9 0Lane Group Flow (vph) 160 46 0 0 85 13 85 1943 0 117 1108 0Confl. Peds. (#/hr) 1 40 40 1 10 19 19 10Turn Type Perm NA Perm NA Perm Prot NA Prot NAProtected Phases 4 8 1 6 5 2Permitted Phases 4 8 8Actuated Green, G (s) 19.9 19.9 19.9 19.9 9.3 65.3 11.6 67.6Effective Green, g (s) 20.5 20.5 20.5 19.9 9.3 65.9 11.6 68.2Actuated g/C Ratio 0.19 0.19 0.19 0.18 0.08 0.60 0.11 0.62Clearance Time (s) 4.6 4.6 4.6 4.6 4.0 4.6 4.0 4.6Vehicle Extension (s) 3.0 3.0 3.0 3.0 3.0 3.0 3.0 3.0Lane Grp Cap (vph) 238 299 244 282 149 3022 186 3083v/s Ratio Prot 0.03 0.05 c0.39 c0.07 0.22v/s Ratio Perm c0.13 0.06 0.01v/c Ratio 0.67 0.15 0.35 0.05 0.57 0.64 0.63 0.36Uniform Delay, d1 41.6 37.5 38.9 37.2 48.4 14.4 47.1 10.2Progression Factor 1.00 1.00 1.00 1.00 1.00 1.00 0.92 1.23Incremental Delay, d2 7.3 0.2 0.9 0.1 5.2 1.1 6.2 0.3Delay (s) 48.9 37.7 39.8 37.3 53.6 15.4 49.5 12.9Level of Service D D D D D B D BApproach Delay (s) 44.4 38.6 17.0 16.3Approach LOS D D B B
Intersection SummaryHCM 2000 Control Delay 19.7 HCM 2000 Level of Service BHCM 2000 Volume to Capacity ratio 0.64Actuated Cycle Length (s) 110.0 Sum of lost time (s) 12.0Intersection Capacity Utilization 75.3% ICU Level of Service DAnalysis Period (min) 15c Critical Lane Group

HCM Signalized Intersection Capacity Analysis4: Hesperian Blvd & East Driveway 7/14/2017
Background PM Synchro 8 ReportPage 4
Movement EBL EBR NBL NBT SBU SBT SBRLane ConfigurationsVolume (vph) 80 120 100 1860 10 990 70Ideal Flow (vphpl) 1900 1900 1900 1900 1900 1900 1900Total Lost time (s) 4.0 4.0 4.0 4.0 4.0 4.0Lane Util. Factor 1.00 1.00 1.00 0.91 1.00 0.91Frpb, ped/bikes 1.00 0.98 1.00 1.00 1.00 1.00Flpb, ped/bikes 1.00 1.00 1.00 1.00 1.00 1.00Frt 1.00 0.85 1.00 1.00 1.00 0.99Flt Protected 0.95 1.00 0.95 1.00 0.95 1.00Satd. Flow (prot) 1770 1555 1770 5085 1770 5027Flt Permitted 0.95 1.00 0.95 1.00 0.95 1.00Satd. Flow (perm) 1770 1555 1770 5085 1770 5027Peak-hour factor, PHF 0.95 0.95 0.95 0.95 0.95 0.95 0.95Adj. Flow (vph) 84 126 105 1958 11 1042 74RTOR Reduction (vph) 0 113 0 0 0 5 0Lane Group Flow (vph) 84 13 105 1958 11 1111 0Confl. Peds. (#/hr) 4 1 5 1Turn Type Prot Perm Prot NA Prot NAProtected Phases 4 1 6 5 2Permitted Phases 4Actuated Green, G (s) 13.7 13.7 12.0 101.7 1.6 91.3Effective Green, g (s) 13.7 13.7 12.0 102.7 1.6 92.3Actuated g/C Ratio 0.11 0.11 0.09 0.79 0.01 0.71Clearance Time (s) 4.0 4.0 4.0 5.0 4.0 5.0Vehicle Extension (s) 3.0 3.0 3.0 3.0 3.0 3.0Lane Grp Cap (vph) 186 163 163 4017 21 3569v/s Ratio Prot c0.05 c0.06 c0.39 0.01 0.22v/s Ratio Perm 0.01v/c Ratio 0.45 0.08 0.64 0.49 0.52 0.31Uniform Delay, d1 54.6 52.5 56.9 4.7 63.8 7.0Progression Factor 1.00 1.00 0.77 1.53 1.00 1.00Incremental Delay, d2 1.7 0.2 6.3 0.3 21.6 0.2Delay (s) 56.4 52.7 50.1 7.4 85.4 7.2Level of Service E D D A F AApproach Delay (s) 54.2 9.6 8.0Approach LOS D A A
Intersection SummaryHCM 2000 Control Delay 11.8 HCM 2000 Level of Service BHCM 2000 Volume to Capacity ratio 0.51Actuated Cycle Length (s) 130.0 Sum of lost time (s) 12.0Intersection Capacity Utilization 57.8% ICU Level of Service BAnalysis Period (min) 15c Critical Lane Group

HCM Signalized Intersection Capacity Analysis5: Hesperian Blvd & Depot Road 7/14/2017
Background PM Synchro 8 ReportPage 5
Movement EBL EBT EBR WBL WBT WBR NBL NBT NBR SBL SBT SBRLane ConfigurationsVolume (vph) 240 160 290 80 70 70 260 1620 190 40 950 80Ideal Flow (vphpl) 1900 1900 1900 1900 1900 1900 1900 1900 1900 1900 1900 1900Total Lost time (s) 4.0 4.0 4.0 4.0 4.0 4.0 4.0 4.0 4.0Lane Util. Factor 0.95 0.95 1.00 1.00 1.00 1.00 0.91 1.00 0.91Frpb, ped/bikes 1.00 1.00 0.96 1.00 0.99 1.00 1.00 1.00 1.00Flpb, ped/bikes 1.00 1.00 1.00 1.00 1.00 1.00 1.00 1.00 1.00Frt 1.00 1.00 0.85 1.00 0.93 1.00 0.98 1.00 0.99Flt Protected 0.95 0.99 1.00 0.95 1.00 0.95 1.00 0.95 1.00Satd. Flow (prot) 1681 1744 1521 1770 1706 1770 4987 1770 5010Flt Permitted 0.95 0.99 1.00 0.95 1.00 0.95 1.00 0.95 1.00Satd. Flow (perm) 1681 1744 1521 1770 1706 1770 4987 1770 5010Peak-hour factor, PHF 0.95 0.95 0.95 0.95 0.95 0.95 0.95 0.95 0.95 0.95 0.95 0.95Adj. Flow (vph) 253 168 305 84 74 74 274 1705 200 42 1000 84RTOR Reduction (vph) 0 0 250 0 29 0 0 10 0 0 6 0Lane Group Flow (vph) 182 239 55 84 119 0 274 1895 0 42 1078 0Confl. Peds. (#/hr) 2 19 19 2 17 5 5 17Confl. Bikes (#/hr) 1 1Turn Type Split NA Perm Split NA Prot NA Prot NAProtected Phases 4 4 3 3 5 2 1 6Permitted Phases 4Actuated Green, G (s) 23.5 23.5 23.5 14.0 14.0 25.4 69.4 6.5 50.5Effective Green, g (s) 23.5 23.5 23.5 14.0 14.0 25.4 70.0 6.5 51.1Actuated g/C Ratio 0.18 0.18 0.18 0.11 0.11 0.20 0.54 0.05 0.39Clearance Time (s) 4.0 4.0 4.0 4.0 4.0 4.0 4.6 4.0 4.6Vehicle Extension (s) 3.0 3.0 3.0 3.0 3.0 3.0 3.0 3.0 3.0Lane Grp Cap (vph) 303 315 274 190 183 345 2685 88 1969v/s Ratio Prot 0.11 c0.14 0.05 c0.07 c0.15 c0.38 0.02 0.22v/s Ratio Perm 0.04v/c Ratio 0.60 0.76 0.20 0.44 0.65 0.79 0.71 0.48 0.55Uniform Delay, d1 48.9 50.6 45.3 54.3 55.7 49.8 22.3 60.1 30.5Progression Factor 1.00 1.00 1.00 1.00 1.00 1.00 1.00 0.87 0.99Incremental Delay, d2 3.3 10.0 0.4 1.6 8.1 11.9 1.6 3.9 1.1Delay (s) 52.3 60.6 45.6 56.0 63.8 61.7 23.9 56.2 31.3Level of Service D E D E E E C E CApproach Delay (s) 52.2 60.9 28.7 32.2Approach LOS D E C C
Intersection SummaryHCM 2000 Control Delay 35.4 HCM 2000 Level of Service DHCM 2000 Volume to Capacity ratio 0.74Actuated Cycle Length (s) 130.0 Sum of lost time (s) 16.0Intersection Capacity Utilization 77.9% ICU Level of Service DAnalysis Period (min) 15c Critical Lane Group

HCM Signalized Intersection Capacity Analysis6: Hesperian Blvd & WB Ramp SR-92 7/14/2017
Background PM Synchro 8 ReportPage 6
Movement EBL EBR NBL NBT SBT SBRLane ConfigurationsVolume (vph) 330 440 150 1790 1210 130Ideal Flow (vphpl) 1900 1900 1900 1900 1900 1900Total Lost time (s) 3.7 3.7 3.7 4.1 4.1Lane Util. Factor 0.97 1.00 1.00 0.91 0.91Frpb, ped/bikes 1.00 1.00 1.00 1.00 1.00Flpb, ped/bikes 1.00 1.00 1.00 1.00 1.00Frt 1.00 0.85 1.00 1.00 0.99Flt Protected 0.95 1.00 0.95 1.00 1.00Satd. Flow (prot) 3433 1583 1770 5085 4993Flt Permitted 0.95 1.00 0.95 1.00 1.00Satd. Flow (perm) 3433 1583 1770 5085 4993Peak-hour factor, PHF 0.97 0.97 0.97 0.97 0.97 0.97Adj. Flow (vph) 340 454 155 1845 1247 134RTOR Reduction (vph) 0 262 0 0 13 0Lane Group Flow (vph) 340 192 155 1845 1368 0Confl. Peds. (#/hr) 13 13Turn Type Perm Perm Prot NA NAProtected Phases 5 2 6Permitted Phases 4 4Actuated Green, G (s) 14.7 14.7 12.7 66.5 49.6Effective Green, g (s) 15.2 15.2 13.2 67.0 50.1Actuated g/C Ratio 0.17 0.17 0.15 0.74 0.56Clearance Time (s) 4.2 4.2 4.2 4.6 4.6Vehicle Extension (s) 3.0 3.0 3.0 3.0 3.0Lane Grp Cap (vph) 579 267 259 3785 2779v/s Ratio Prot c0.09 c0.36 0.27v/s Ratio Perm 0.10 c0.12v/c Ratio 0.59 0.72 0.60 0.49 0.49Uniform Delay, d1 34.5 35.4 35.9 4.6 12.2Progression Factor 1.00 1.00 0.84 1.54 1.00Incremental Delay, d2 1.5 9.0 0.3 0.0 0.6Delay (s) 36.0 44.3 30.4 7.1 12.8Level of Service D D C A BApproach Delay (s) 40.8 8.9 12.8Approach LOS D A B
Intersection SummaryHCM 2000 Control Delay 16.3 HCM 2000 Level of Service BHCM 2000 Volume to Capacity ratio 0.57Actuated Cycle Length (s) 90.0 Sum of lost time (s) 12.0Intersection Capacity Utilization 62.3% ICU Level of Service BAnalysis Period (min) 15c Critical Lane Group
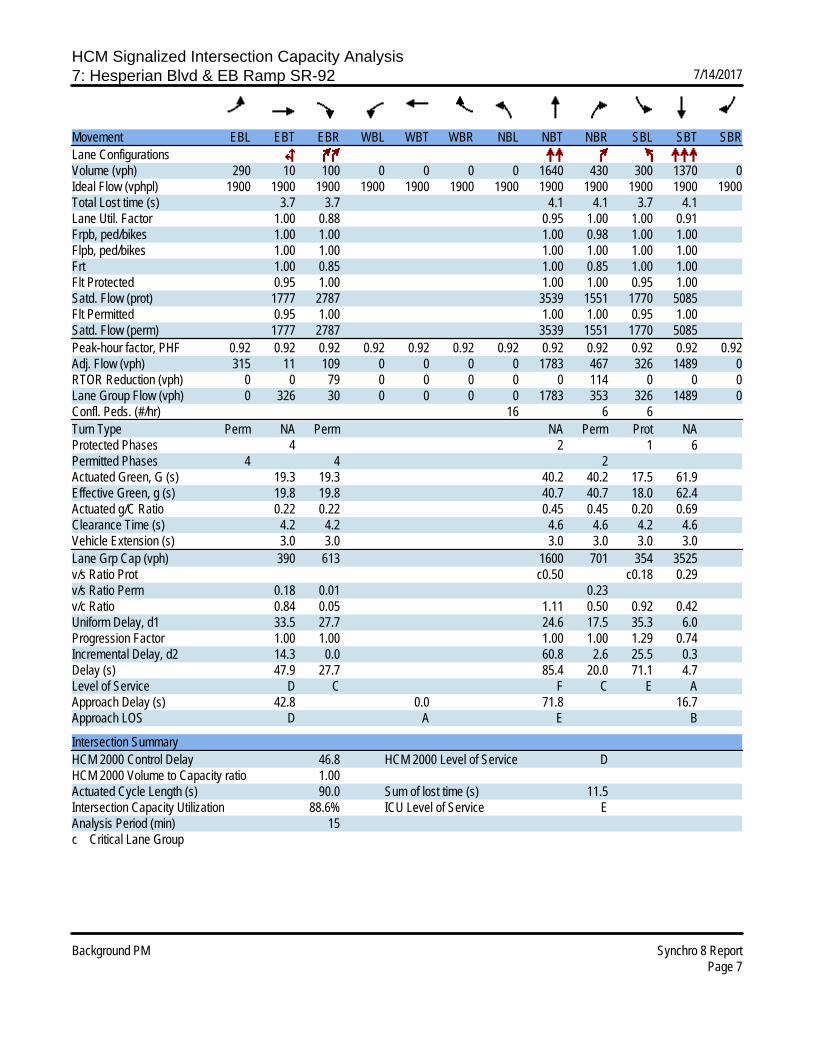
HCM Signalized Intersection Capacity Analysis7: Hesperian Blvd & EB Ramp SR-92 7/14/2017
Background PM Synchro 8 ReportPage 7
Movement EBL EBT EBR WBL WBT WBR NBL NBT NBR SBL SBT SBRLane ConfigurationsVolume (vph) 290 10 100 0 0 0 0 1640 430 300 1370 0Ideal Flow (vphpl) 1900 1900 1900 1900 1900 1900 1900 1900 1900 1900 1900 1900Total Lost time (s) 3.7 3.7 4.1 4.1 3.7 4.1Lane Util. Factor 1.00 0.88 0.95 1.00 1.00 0.91Frpb, ped/bikes 1.00 1.00 1.00 0.98 1.00 1.00Flpb, ped/bikes 1.00 1.00 1.00 1.00 1.00 1.00Frt 1.00 0.85 1.00 0.85 1.00 1.00Flt Protected 0.95 1.00 1.00 1.00 0.95 1.00Satd. Flow (prot) 1777 2787 3539 1551 1770 5085Flt Permitted 0.95 1.00 1.00 1.00 0.95 1.00Satd. Flow (perm) 1777 2787 3539 1551 1770 5085Peak-hour factor, PHF 0.92 0.92 0.92 0.92 0.92 0.92 0.92 0.92 0.92 0.92 0.92 0.92Adj. Flow (vph) 315 11 109 0 0 0 0 1783 467 326 1489 0RTOR Reduction (vph) 0 0 79 0 0 0 0 0 114 0 0 0Lane Group Flow (vph) 0 326 30 0 0 0 0 1783 353 326 1489 0Confl. Peds. (#/hr) 16 6 6Turn Type Perm NA Perm NA Perm Prot NAProtected Phases 4 2 1 6Permitted Phases 4 4 2Actuated Green, G (s) 19.3 19.3 40.2 40.2 17.5 61.9Effective Green, g (s) 19.8 19.8 40.7 40.7 18.0 62.4Actuated g/C Ratio 0.22 0.22 0.45 0.45 0.20 0.69Clearance Time (s) 4.2 4.2 4.6 4.6 4.2 4.6Vehicle Extension (s) 3.0 3.0 3.0 3.0 3.0 3.0Lane Grp Cap (vph) 390 613 1600 701 354 3525v/s Ratio Prot c0.50 c0.18 0.29v/s Ratio Perm 0.18 0.01 0.23v/c Ratio 0.84 0.05 1.11 0.50 0.92 0.42Uniform Delay, d1 33.5 27.7 24.6 17.5 35.3 6.0Progression Factor 1.00 1.00 1.00 1.00 1.29 0.74Incremental Delay, d2 14.3 0.0 60.8 2.6 25.5 0.3Delay (s) 47.9 27.7 85.4 20.0 71.1 4.7Level of Service D C F C E AApproach Delay (s) 42.8 0.0 71.8 16.7Approach LOS D A E B
Intersection SummaryHCM 2000 Control Delay 46.8 HCM 2000 Level of Service DHCM 2000 Volume to Capacity ratio 1.00Actuated Cycle Length (s) 90.0 Sum of lost time (s) 11.5Intersection Capacity Utilization 88.6% ICU Level of Service EAnalysis Period (min) 15c Critical Lane Group
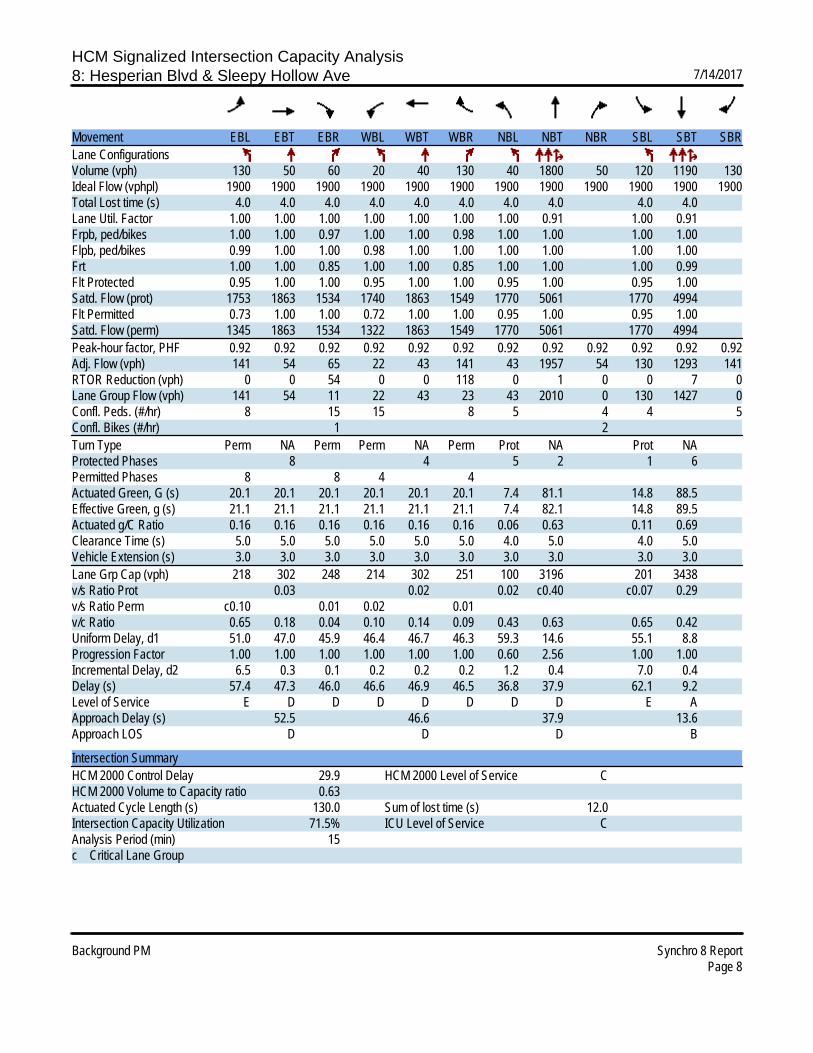
HCM Signalized Intersection Capacity Analysis8: Hesperian Blvd & Sleepy Hollow Ave 7/14/2017
Background PM Synchro 8 ReportPage 8
Movement EBL EBT EBR WBL WBT WBR NBL NBT NBR SBL SBT SBRLane ConfigurationsVolume (vph) 130 50 60 20 40 130 40 1800 50 120 1190 130Ideal Flow (vphpl) 1900 1900 1900 1900 1900 1900 1900 1900 1900 1900 1900 1900Total Lost time (s) 4.0 4.0 4.0 4.0 4.0 4.0 4.0 4.0 4.0 4.0Lane Util. Factor 1.00 1.00 1.00 1.00 1.00 1.00 1.00 0.91 1.00 0.91Frpb, ped/bikes 1.00 1.00 0.97 1.00 1.00 0.98 1.00 1.00 1.00 1.00Flpb, ped/bikes 0.99 1.00 1.00 0.98 1.00 1.00 1.00 1.00 1.00 1.00Frt 1.00 1.00 0.85 1.00 1.00 0.85 1.00 1.00 1.00 0.99Flt Protected 0.95 1.00 1.00 0.95 1.00 1.00 0.95 1.00 0.95 1.00Satd. Flow (prot) 1753 1863 1534 1740 1863 1549 1770 5061 1770 4994Flt Permitted 0.73 1.00 1.00 0.72 1.00 1.00 0.95 1.00 0.95 1.00Satd. Flow (perm) 1345 1863 1534 1322 1863 1549 1770 5061 1770 4994Peak-hour factor, PHF 0.92 0.92 0.92 0.92 0.92 0.92 0.92 0.92 0.92 0.92 0.92 0.92Adj. Flow (vph) 141 54 65 22 43 141 43 1957 54 130 1293 141RTOR Reduction (vph) 0 0 54 0 0 118 0 1 0 0 7 0Lane Group Flow (vph) 141 54 11 22 43 23 43 2010 0 130 1427 0Confl. Peds. (#/hr) 8 15 15 8 5 4 4 5Confl. Bikes (#/hr) 1 2Turn Type Perm NA Perm Perm NA Perm Prot NA Prot NAProtected Phases 8 4 5 2 1 6Permitted Phases 8 8 4 4Actuated Green, G (s) 20.1 20.1 20.1 20.1 20.1 20.1 7.4 81.1 14.8 88.5Effective Green, g (s) 21.1 21.1 21.1 21.1 21.1 21.1 7.4 82.1 14.8 89.5Actuated g/C Ratio 0.16 0.16 0.16 0.16 0.16 0.16 0.06 0.63 0.11 0.69Clearance Time (s) 5.0 5.0 5.0 5.0 5.0 5.0 4.0 5.0 4.0 5.0Vehicle Extension (s) 3.0 3.0 3.0 3.0 3.0 3.0 3.0 3.0 3.0 3.0Lane Grp Cap (vph) 218 302 248 214 302 251 100 3196 201 3438v/s Ratio Prot 0.03 0.02 0.02 c0.40 c0.07 0.29v/s Ratio Perm c0.10 0.01 0.02 0.01v/c Ratio 0.65 0.18 0.04 0.10 0.14 0.09 0.43 0.63 0.65 0.42Uniform Delay, d1 51.0 47.0 45.9 46.4 46.7 46.3 59.3 14.6 55.1 8.8Progression Factor 1.00 1.00 1.00 1.00 1.00 1.00 0.60 2.56 1.00 1.00Incremental Delay, d2 6.5 0.3 0.1 0.2 0.2 0.2 1.2 0.4 7.0 0.4Delay (s) 57.4 47.3 46.0 46.6 46.9 46.5 36.8 37.9 62.1 9.2Level of Service E D D D D D D D E AApproach Delay (s) 52.5 46.6 37.9 13.6Approach LOS D D D B
Intersection SummaryHCM 2000 Control Delay 29.9 HCM 2000 Level of Service CHCM 2000 Volume to Capacity ratio 0.63Actuated Cycle Length (s) 130.0 Sum of lost time (s) 12.0Intersection Capacity Utilization 71.5% ICU Level of Service CAnalysis Period (min) 15c Critical Lane Group

HCM Signalized Intersection Capacity Analysis9: Hesperian Blvd & Tennyson Road 7/14/2017
Background PM Synchro 8 ReportPage 9
Movement EBL EBT EBR WBL WBT WBR NBL NBT NBR SBL SBT SBRLane ConfigurationsVolume (vph) 190 650 80 280 270 190 90 1370 150 230 820 100Ideal Flow (vphpl) 1900 1900 1900 1900 1900 1900 1900 1900 1900 1900 1900 1900Total Lost time (s) 4.0 4.0 4.0 4.0 4.0 4.0 4.0 4.0 4.0 4.0Lane Util. Factor 1.00 0.95 1.00 1.00 0.95 1.00 1.00 0.91 1.00 0.91Frpb, ped/bikes 1.00 1.00 0.96 1.00 1.00 0.97 1.00 1.00 1.00 1.00Flpb, ped/bikes 1.00 1.00 1.00 1.00 1.00 1.00 1.00 1.00 1.00 1.00Frt 1.00 1.00 0.85 1.00 1.00 0.85 1.00 0.99 1.00 0.98Flt Protected 0.95 1.00 1.00 0.95 1.00 1.00 0.95 1.00 0.95 1.00Satd. Flow (prot) 1770 3539 1524 1770 3539 1542 1770 4990 1770 4986Flt Permitted 0.95 1.00 1.00 0.95 1.00 1.00 0.95 1.00 0.95 1.00Satd. Flow (perm) 1770 3539 1524 1770 3539 1542 1770 4990 1770 4986Peak-hour factor, PHF 0.92 0.92 0.92 0.92 0.92 0.92 0.92 0.92 0.92 0.92 0.92 0.92Adj. Flow (vph) 207 707 87 304 293 207 98 1489 163 250 891 109RTOR Reduction (vph) 0 0 65 0 0 148 0 11 0 0 11 0Lane Group Flow (vph) 207 707 22 304 293 59 98 1642 0 250 989 0Confl. Peds. (#/hr) 12 21 21 12 15 25 25 15Confl. Bikes (#/hr) 2 1Turn Type Prot NA Perm Prot NA Perm Prot NA Prot NAProtected Phases 3 8 7 4 1 6 5 2Permitted Phases 8 4Actuated Green, G (s) 17.4 31.3 31.3 22.0 35.9 35.9 11.4 37.9 20.7 47.2Effective Green, g (s) 17.4 32.3 32.3 22.0 36.9 36.9 11.4 39.0 20.7 48.3Actuated g/C Ratio 0.13 0.25 0.25 0.17 0.28 0.28 0.09 0.30 0.16 0.37Clearance Time (s) 4.0 5.0 5.0 4.0 5.0 5.0 4.0 5.1 4.0 5.1Vehicle Extension (s) 3.0 3.0 3.0 3.0 3.0 3.0 3.0 3.0 3.0 3.0Lane Grp Cap (vph) 236 879 378 299 1004 437 155 1497 281 1852v/s Ratio Prot 0.12 c0.20 c0.17 0.08 0.06 c0.33 c0.14 0.20v/s Ratio Perm 0.01 0.04v/c Ratio 0.88 0.80 0.06 1.02 0.29 0.13 0.63 1.10 0.89 0.53Uniform Delay, d1 55.3 45.9 37.2 54.0 36.3 34.7 57.3 45.5 53.5 32.0Progression Factor 1.00 1.00 1.00 1.00 1.00 1.00 1.00 1.00 1.07 0.72Incremental Delay, d2 28.5 5.4 0.1 56.4 0.2 0.1 8.1 54.4 25.7 1.0Delay (s) 83.7 51.3 37.3 110.4 36.5 34.8 65.4 99.9 83.1 24.2Level of Service F D D F D C E F F CApproach Delay (s) 56.8 64.0 97.9 36.0Approach LOS E E F D
Intersection SummaryHCM 2000 Control Delay 67.6 HCM 2000 Level of Service EHCM 2000 Volume to Capacity ratio 0.96Actuated Cycle Length (s) 130.0 Sum of lost time (s) 16.0Intersection Capacity Utilization 94.8% ICU Level of Service FAnalysis Period (min) 15c Critical Lane Group

HCM Signalized Intersection Capacity Analysis10: Industrial Blvd & EB Ramp SR-92 7/14/2017
Background PM Synchro 8 ReportPage 10
Movement EBL EBT EBR WBL WBT WBR NBL NBT NBR SBL SBT SBRLane ConfigurationsVolume (vph) 230 90 850 10 20 50 80 910 50 70 930 240Ideal Flow (vphpl) 1900 1900 1900 1900 1900 1900 1900 1900 1900 1900 1900 1900Total Lost time (s) 4.2 4.2 4.2 4.2 3.2 3.6 3.6 3.2 3.6 3.6Lane Util. Factor 1.00 1.00 1.00 1.00 1.00 0.95 1.00 1.00 0.95 1.00Frpb, ped/bikes 1.00 1.00 1.00 1.00 1.00 1.00 0.97 1.00 1.00 0.97Flpb, ped/bikes 1.00 1.00 1.00 1.00 1.00 1.00 1.00 1.00 1.00 1.00Frt 1.00 0.85 1.00 0.85 1.00 1.00 0.85 1.00 1.00 0.85Flt Protected 0.97 1.00 0.98 1.00 0.95 1.00 1.00 0.95 1.00 1.00Satd. Flow (prot) 1798 1583 1832 1583 1770 3539 1534 1770 3539 1532Flt Permitted 0.77 1.00 0.87 1.00 0.95 1.00 1.00 0.95 1.00 1.00Satd. Flow (perm) 1427 1583 1621 1583 1770 3539 1534 1770 3539 1532Peak-hour factor, PHF 0.91 0.91 0.91 0.91 0.91 0.91 0.91 0.91 0.91 0.91 0.91 0.91Adj. Flow (vph) 253 99 934 11 22 55 88 1000 55 77 1022 264RTOR Reduction (vph) 0 0 205 0 0 40 0 0 29 0 0 138Lane Group Flow (vph) 0 352 729 0 33 15 88 1000 26 77 1022 126Confl. Peds. (#/hr) 6 6 6 6Confl. Bikes (#/hr) 1Turn Type Perm NA Perm Perm NA Perm Prot NA Perm Prot NA PermProtected Phases 8 4 1 6 5 2Permitted Phases 8 8 4 4 6 2Actuated Green, G (s) 18.0 18.0 18.0 18.0 6.7 32.3 32.3 7.2 32.8 32.8Effective Green, g (s) 18.5 18.5 18.5 18.5 7.2 32.8 32.8 7.7 33.3 33.3Actuated g/C Ratio 0.26 0.26 0.26 0.26 0.10 0.47 0.47 0.11 0.48 0.48Clearance Time (s) 4.7 4.7 4.7 4.7 3.7 4.1 4.1 3.7 4.1 4.1Vehicle Extension (s) 3.0 3.0 3.0 3.0 3.0 3.0 3.0 3.0 3.0 3.0Lane Grp Cap (vph) 377 418 428 418 182 1658 718 194 1683 728v/s Ratio Prot c0.05 0.28 0.04 c0.29v/s Ratio Perm 0.25 c0.46 0.02 0.01 0.02 0.08v/c Ratio 0.93 1.75 0.08 0.03 0.48 0.60 0.04 0.40 0.61 0.17Uniform Delay, d1 25.2 25.8 19.3 19.1 29.6 13.8 10.1 29.0 13.5 10.5Progression Factor 1.00 1.00 1.00 1.00 1.00 1.00 1.00 0.68 2.06 7.57Incremental Delay, d2 29.8 345.1 0.1 0.0 2.0 1.6 0.1 0.6 0.7 0.2Delay (s) 55.0 370.9 19.4 19.2 31.7 15.4 10.1 20.4 28.7 79.6Level of Service D F B B C B B C C EApproach Delay (s) 284.4 19.3 16.4 38.1Approach LOS F B B D
Intersection SummaryHCM 2000 Control Delay 112.9 HCM 2000 Level of Service FHCM 2000 Volume to Capacity ratio 0.95Actuated Cycle Length (s) 70.0 Sum of lost time (s) 11.0Intersection Capacity Utilization 97.0% ICU Level of Service FAnalysis Period (min) 15c Critical Lane Group
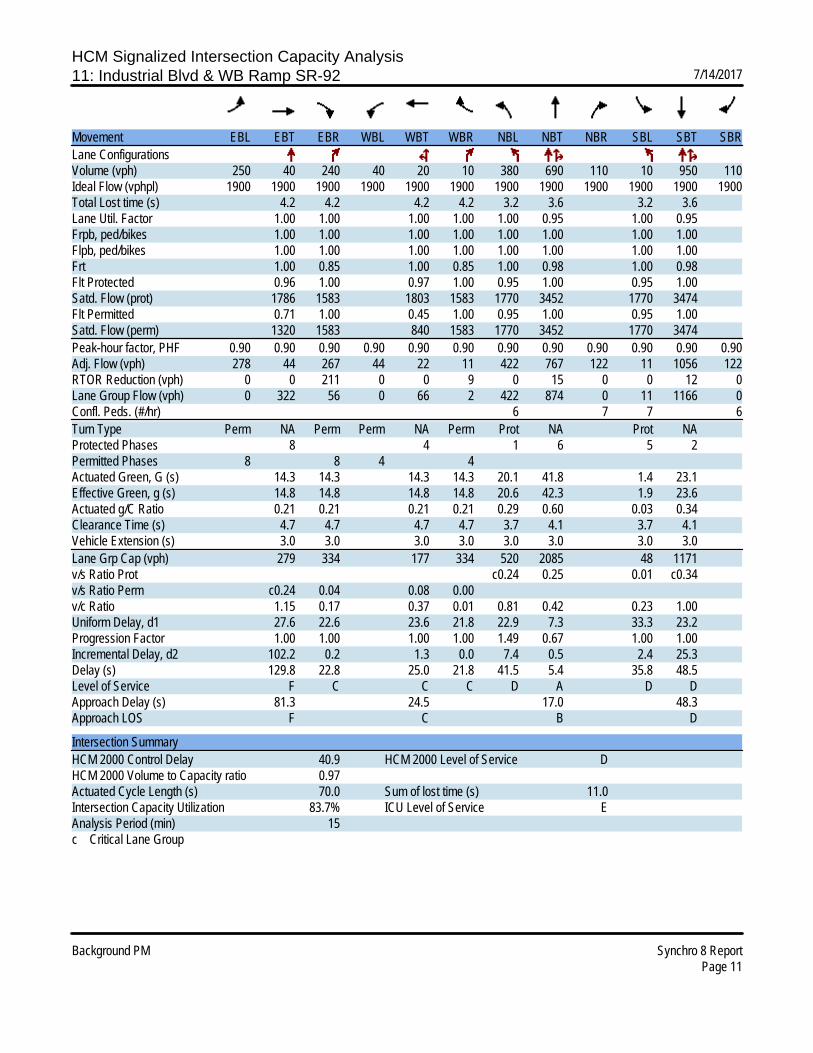
HCM Signalized Intersection Capacity Analysis11: Industrial Blvd & WB Ramp SR-92 7/14/2017
Background PM Synchro 8 ReportPage 11
Movement EBL EBT EBR WBL WBT WBR NBL NBT NBR SBL SBT SBRLane ConfigurationsVolume (vph) 250 40 240 40 20 10 380 690 110 10 950 110Ideal Flow (vphpl) 1900 1900 1900 1900 1900 1900 1900 1900 1900 1900 1900 1900Total Lost time (s) 4.2 4.2 4.2 4.2 3.2 3.6 3.2 3.6Lane Util. Factor 1.00 1.00 1.00 1.00 1.00 0.95 1.00 0.95Frpb, ped/bikes 1.00 1.00 1.00 1.00 1.00 1.00 1.00 1.00Flpb, ped/bikes 1.00 1.00 1.00 1.00 1.00 1.00 1.00 1.00Frt 1.00 0.85 1.00 0.85 1.00 0.98 1.00 0.98Flt Protected 0.96 1.00 0.97 1.00 0.95 1.00 0.95 1.00Satd. Flow (prot) 1786 1583 1803 1583 1770 3452 1770 3474Flt Permitted 0.71 1.00 0.45 1.00 0.95 1.00 0.95 1.00Satd. Flow (perm) 1320 1583 840 1583 1770 3452 1770 3474Peak-hour factor, PHF 0.90 0.90 0.90 0.90 0.90 0.90 0.90 0.90 0.90 0.90 0.90 0.90Adj. Flow (vph) 278 44 267 44 22 11 422 767 122 11 1056 122RTOR Reduction (vph) 0 0 211 0 0 9 0 15 0 0 12 0Lane Group Flow (vph) 0 322 56 0 66 2 422 874 0 11 1166 0Confl. Peds. (#/hr) 6 7 7 6Turn Type Perm NA Perm Perm NA Perm Prot NA Prot NAProtected Phases 8 4 1 6 5 2Permitted Phases 8 8 4 4Actuated Green, G (s) 14.3 14.3 14.3 14.3 20.1 41.8 1.4 23.1Effective Green, g (s) 14.8 14.8 14.8 14.8 20.6 42.3 1.9 23.6Actuated g/C Ratio 0.21 0.21 0.21 0.21 0.29 0.60 0.03 0.34Clearance Time (s) 4.7 4.7 4.7 4.7 3.7 4.1 3.7 4.1Vehicle Extension (s) 3.0 3.0 3.0 3.0 3.0 3.0 3.0 3.0Lane Grp Cap (vph) 279 334 177 334 520 2085 48 1171v/s Ratio Prot c0.24 0.25 0.01 c0.34v/s Ratio Perm c0.24 0.04 0.08 0.00v/c Ratio 1.15 0.17 0.37 0.01 0.81 0.42 0.23 1.00Uniform Delay, d1 27.6 22.6 23.6 21.8 22.9 7.3 33.3 23.2Progression Factor 1.00 1.00 1.00 1.00 1.49 0.67 1.00 1.00Incremental Delay, d2 102.2 0.2 1.3 0.0 7.4 0.5 2.4 25.3Delay (s) 129.8 22.8 25.0 21.8 41.5 5.4 35.8 48.5Level of Service F C C C D A D DApproach Delay (s) 81.3 24.5 17.0 48.3Approach LOS F C B D
Intersection SummaryHCM 2000 Control Delay 40.9 HCM 2000 Level of Service DHCM 2000 Volume to Capacity ratio 0.97Actuated Cycle Length (s) 70.0 Sum of lost time (s) 11.0Intersection Capacity Utilization 83.7% ICU Level of Service EAnalysis Period (min) 15c Critical Lane Group

HCM Signalized Intersection Capacity Analysis12: Industrial Blvd & Depot Road 7/14/2017
Background PM Synchro 8 ReportPage 12
Movement EBL EBT EBR WBL WBT WBR NBL NBT NBR SBL SBT SBRLane ConfigurationsVolume (vph) 80 220 280 50 30 20 130 590 130 50 430 10Ideal Flow (vphpl) 1900 1900 1900 1900 1900 1900 1900 1900 1900 1900 1900 1900Total Lost time (s) 4.0 4.0 4.0 4.5 4.0 4.0 4.0 4.0 4.0 4.0Lane Util. Factor 1.00 1.00 1.00 0.95 1.00 0.95 1.00 1.00 0.95 1.00Frpb, ped/bikes 1.00 1.00 0.98 1.00 1.00 1.00 1.00 1.00 1.00 0.99Flpb, ped/bikes 1.00 1.00 1.00 1.00 1.00 1.00 1.00 1.00 1.00 1.00Frt 1.00 1.00 0.85 0.97 1.00 1.00 0.85 1.00 1.00 0.85Flt Protected 0.95 1.00 1.00 0.98 0.95 1.00 1.00 0.95 1.00 1.00Satd. Flow (prot) 1770 1863 1556 3345 1770 3539 1583 1770 3539 1563Flt Permitted 0.68 1.00 1.00 0.77 0.95 1.00 1.00 0.95 1.00 1.00Satd. Flow (perm) 1274 1863 1556 2649 1770 3539 1583 1770 3539 1563Peak-hour factor, PHF 0.93 0.93 0.93 0.93 0.93 0.93 0.93 0.93 0.93 0.93 0.93 0.93Adj. Flow (vph) 86 237 301 54 32 22 140 634 140 54 462 11RTOR Reduction (vph) 0 0 203 0 15 0 0 0 82 0 0 7Lane Group Flow (vph) 86 237 98 0 93 0 140 634 58 54 462 4Confl. Peds. (#/hr) 3 3 1 1Confl. Bikes (#/hr) 4Turn Type Perm NA Perm Perm NA Prot NA Perm Prot NA PermProtected Phases 4 4 5 2 1 6Permitted Phases 4 4 4 2 6Actuated Green, G (s) 22.6 22.6 22.6 22.6 11.2 28.5 28.5 6.2 23.5 23.5Effective Green, g (s) 23.1 23.1 23.1 22.6 11.2 29.5 29.5 6.2 24.5 24.5Actuated g/C Ratio 0.33 0.33 0.33 0.32 0.16 0.42 0.42 0.09 0.35 0.35Clearance Time (s) 4.5 4.5 4.5 4.5 4.0 5.0 5.0 4.0 5.0 5.0Vehicle Extension (s) 6.0 6.0 6.0 6.0 6.0 8.0 8.0 6.0 8.0 8.0Lane Grp Cap (vph) 415 607 507 845 280 1474 659 155 1224 540v/s Ratio Prot c0.13 c0.08 c0.18 0.03 0.13v/s Ratio Perm 0.07 0.06 0.04 0.04 0.00v/c Ratio 0.21 0.39 0.19 0.11 0.50 0.43 0.09 0.35 0.38 0.01Uniform Delay, d1 17.2 18.4 17.2 17.0 27.2 14.7 12.5 30.4 17.4 15.2Progression Factor 1.00 1.00 1.00 1.00 1.00 1.00 1.00 1.00 1.00 1.00Incremental Delay, d2 0.7 1.2 0.5 0.2 3.9 0.9 0.2 3.8 0.8 0.0Delay (s) 17.9 19.6 17.7 17.2 31.2 15.5 12.8 34.2 18.2 15.2Level of Service B B B B C B B C B BApproach Delay (s) 18.4 17.2 17.5 19.8Approach LOS B B B B
Intersection SummaryHCM 2000 Control Delay 18.3 HCM 2000 Level of Service BHCM 2000 Volume to Capacity ratio 0.45Actuated Cycle Length (s) 70.8 Sum of lost time (s) 12.5Intersection Capacity Utilization 49.3% ICU Level of Service AAnalysis Period (min) 15c Critical Lane Group

HCM Unsignalized Intersection Capacity Analysis13: Depot Road & West Driveway 7/14/2017
Background PM Synchro 8 ReportPage 13
Movement EBL EBT WBT WBR SBL SBRLane ConfigurationsVolume (veh/h) 20 470 150 60 60 10Sign Control Free Free StopGrade 0% 0% 0%Peak Hour Factor 0.91 0.91 0.91 0.91 0.91 0.91Hourly flow rate (vph) 22 516 165 66 66 11Pedestrians 2 29Lane Width (ft) 12.0 12.0Walking Speed (ft/s) 3.5 3.5Percent Blockage 0 3Right turn flare (veh)Median type None NoneMedian storage veh)Upstream signal (ft)pX, platoon unblockedvC, conflicting volume 260 531 227vC1, stage 1 conf volvC2, stage 2 conf volvCu, unblocked vol 260 531 227tC, single (s) 4.1 6.8 6.9tC, 2 stage (s)tF (s) 2.2 3.5 3.3p0 queue free % 98 86 99cM capacity (veh/h) 1266 456 755
Direction, Lane # EB 1 EB 2 WB 1 SB 1Volume Total 194 344 231 77Volume Left 22 0 0 66Volume Right 0 0 66 11cSH 1266 1700 1700 483Volume to Capacity 0.02 0.20 0.14 0.16Queue Length 95th (ft) 1 0 0 14Control Delay (s) 1.0 0.0 0.0 13.9Lane LOS A BApproach Delay (s) 0.4 0.0 13.9Approach LOS B
Intersection SummaryAverage Delay 1.5Intersection Capacity Utilization 38.3% ICU Level of Service AAnalysis Period (min) 15

HCM Unsignalized Intersection Capacity Analysis14: Dodge Ave/Lot E & Depot Road 7/14/2017
Background PM Synchro 8 ReportPage 14
Movement EBL EBT EBR WBL WBT WBR NBL NBT NBR SBL SBT SBRLane ConfigurationsSign Control Stop Stop Stop StopVolume (vph) 10 500 10 50 200 40 10 0 50 50 0 10Peak Hour Factor 0.92 0.92 0.92 0.92 0.92 0.92 0.92 0.92 0.92 0.92 0.92 0.92Hourly flow rate (vph) 11 543 11 54 217 43 11 0 54 54 0 11
Direction, Lane # EB 1 EB 2 WB 1 NB 1 SB 1Volume Total (vph) 283 283 315 65 65Volume Left (vph) 11 0 54 11 54Volume Right (vph) 0 11 43 54 11Hadj (s) 0.05 0.01 -0.01 -0.43 0.10Departure Headway (s) 5.2 5.2 5.0 5.5 6.0Degree Utilization, x 0.41 0.41 0.43 0.10 0.11Capacity (veh/h) 673 677 701 569 529Control Delay (s) 10.7 10.5 11.7 9.1 9.7Approach Delay (s) 10.6 11.7 9.1 9.7Approach LOS B B A A
Intersection SummaryDelay 10.8Level of Service BIntersection Capacity Utilization 50.6% ICU Level of Service AAnalysis Period (min) 15

HCM Unsignalized Intersection Capacity Analysis15: Depot Road & Lot F 7/14/2017
Background PM Synchro 8 ReportPage 15
Movement EBL EBT WBT WBR SBL SBRLane ConfigurationsVolume (veh/h) 20 580 280 20 40 20Sign Control Free Free StopGrade 0% 0% 0%Peak Hour Factor 0.92 0.92 0.92 0.92 0.92 0.92Hourly flow rate (vph) 22 630 304 22 43 22Pedestrians 9Lane Width (ft) 12.0Walking Speed (ft/s) 3.5Percent Blockage 1Right turn flare (veh)Median type None NoneMedian storage veh)Upstream signal (ft) 957pX, platoon unblockedvC, conflicting volume 335 683 324vC1, stage 1 conf volvC2, stage 2 conf volvCu, unblocked vol 335 683 324tC, single (s) 4.1 6.8 6.9tC, 2 stage (s)tF (s) 2.2 3.5 3.3p0 queue free % 98 88 97cM capacity (veh/h) 1210 373 666
Direction, Lane # EB 1 EB 2 WB 1 SB 1Volume Total 232 420 326 65Volume Left 22 0 0 43Volume Right 0 0 22 22cSH 1210 1700 1700 437Volume to Capacity 0.02 0.25 0.19 0.15Queue Length 95th (ft) 1 0 0 13Control Delay (s) 0.9 0.0 0.0 14.7Lane LOS A BApproach Delay (s) 0.3 0.0 14.7Approach LOS B
Intersection SummaryAverage Delay 1.1Intersection Capacity Utilization 40.7% ICU Level of Service AAnalysis Period (min) 15

HCM Unsignalized Intersection Capacity Analysis16: Depot Road & Lot G 7/14/2017
Background PM Synchro 8 ReportPage 16
Movement EBL EBT WBT WBR SBL SBRLane ConfigurationsVolume (veh/h) 10 630 290 40 40 10Sign Control Free Free StopGrade 0% 0% 0%Peak Hour Factor 0.93 0.93 0.93 0.93 0.93 0.93Hourly flow rate (vph) 11 677 312 43 43 11Pedestrians 19 19 5Lane Width (ft) 12.0 12.0 12.0Walking Speed (ft/s) 3.5 3.5 3.5Percent Blockage 2 2 0Right turn flare (veh)Median type None NoneMedian storage veh)Upstream signal (ft) 529pX, platoon unblockedvC, conflicting volume 360 696 336vC1, stage 1 conf volvC2, stage 2 conf volvCu, unblocked vol 360 696 336tC, single (s) 4.1 6.8 6.9tC, 2 stage (s)tF (s) 2.2 3.5 3.3p0 queue free % 99 88 98cM capacity (veh/h) 1190 364 645
Direction, Lane # EB 1 EB 2 WB 1 WB 2 SB 1Volume Total 237 452 312 43 54Volume Left 11 0 0 0 43Volume Right 0 0 0 43 11cSH 1190 1700 1700 1700 399Volume to Capacity 0.01 0.27 0.18 0.03 0.13Queue Length 95th (ft) 1 0 0 0 12Control Delay (s) 0.4 0.0 0.0 0.0 15.4Lane LOS A CApproach Delay (s) 0.2 0.0 15.4Approach LOS C
Intersection SummaryAverage Delay 0.9Intersection Capacity Utilization 39.2% ICU Level of Service AAnalysis Period (min) 15
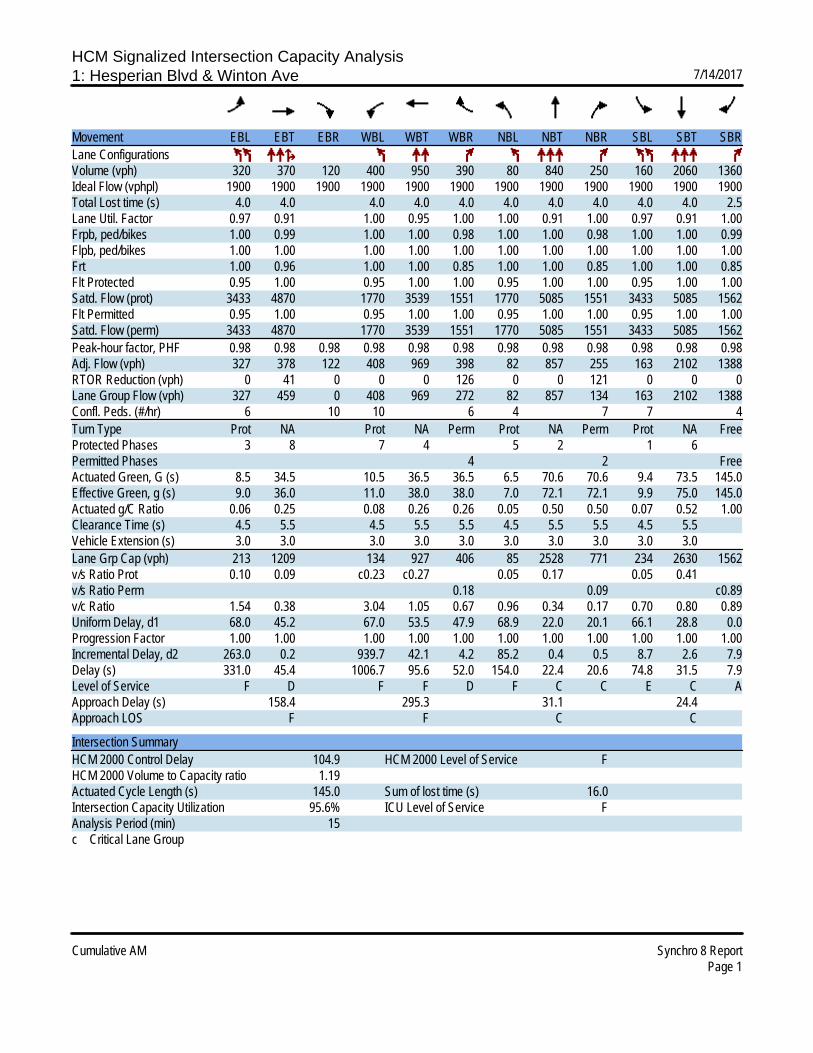
HCM Signalized Intersection Capacity Analysis1: Hesperian Blvd & Winton Ave 7/14/2017
Cumulative AM Synchro 8 ReportPage 1
Movement EBL EBT EBR WBL WBT WBR NBL NBT NBR SBL SBT SBRLane ConfigurationsVolume (vph) 320 370 120 400 950 390 80 840 250 160 2060 1360Ideal Flow (vphpl) 1900 1900 1900 1900 1900 1900 1900 1900 1900 1900 1900 1900Total Lost time (s) 4.0 4.0 4.0 4.0 4.0 4.0 4.0 4.0 4.0 4.0 2.5Lane Util. Factor 0.97 0.91 1.00 0.95 1.00 1.00 0.91 1.00 0.97 0.91 1.00Frpb, ped/bikes 1.00 0.99 1.00 1.00 0.98 1.00 1.00 0.98 1.00 1.00 0.99Flpb, ped/bikes 1.00 1.00 1.00 1.00 1.00 1.00 1.00 1.00 1.00 1.00 1.00Frt 1.00 0.96 1.00 1.00 0.85 1.00 1.00 0.85 1.00 1.00 0.85Flt Protected 0.95 1.00 0.95 1.00 1.00 0.95 1.00 1.00 0.95 1.00 1.00Satd. Flow (prot) 3433 4870 1770 3539 1551 1770 5085 1551 3433 5085 1562Flt Permitted 0.95 1.00 0.95 1.00 1.00 0.95 1.00 1.00 0.95 1.00 1.00Satd. Flow (perm) 3433 4870 1770 3539 1551 1770 5085 1551 3433 5085 1562Peak-hour factor, PHF 0.98 0.98 0.98 0.98 0.98 0.98 0.98 0.98 0.98 0.98 0.98 0.98Adj. Flow (vph) 327 378 122 408 969 398 82 857 255 163 2102 1388RTOR Reduction (vph) 0 41 0 0 0 126 0 0 121 0 0 0Lane Group Flow (vph) 327 459 0 408 969 272 82 857 134 163 2102 1388Confl. Peds. (#/hr) 6 10 10 6 4 7 7 4Turn Type Prot NA Prot NA Perm Prot NA Perm Prot NA FreeProtected Phases 3 8 7 4 5 2 1 6Permitted Phases 4 2 FreeActuated Green, G (s) 8.5 34.5 10.5 36.5 36.5 6.5 70.6 70.6 9.4 73.5 145.0Effective Green, g (s) 9.0 36.0 11.0 38.0 38.0 7.0 72.1 72.1 9.9 75.0 145.0Actuated g/C Ratio 0.06 0.25 0.08 0.26 0.26 0.05 0.50 0.50 0.07 0.52 1.00Clearance Time (s) 4.5 5.5 4.5 5.5 5.5 4.5 5.5 5.5 4.5 5.5Vehicle Extension (s) 3.0 3.0 3.0 3.0 3.0 3.0 3.0 3.0 3.0 3.0Lane Grp Cap (vph) 213 1209 134 927 406 85 2528 771 234 2630 1562v/s Ratio Prot 0.10 0.09 c0.23 c0.27 0.05 0.17 0.05 0.41v/s Ratio Perm 0.18 0.09 c0.89v/c Ratio 1.54 0.38 3.04 1.05 0.67 0.96 0.34 0.17 0.70 0.80 0.89Uniform Delay, d1 68.0 45.2 67.0 53.5 47.9 68.9 22.0 20.1 66.1 28.8 0.0Progression Factor 1.00 1.00 1.00 1.00 1.00 1.00 1.00 1.00 1.00 1.00 1.00Incremental Delay, d2 263.0 0.2 939.7 42.1 4.2 85.2 0.4 0.5 8.7 2.6 7.9Delay (s) 331.0 45.4 1006.7 95.6 52.0 154.0 22.4 20.6 74.8 31.5 7.9Level of Service F D F F D F C C E C AApproach Delay (s) 158.4 295.3 31.1 24.4Approach LOS F F C C
Intersection SummaryHCM 2000 Control Delay 104.9 HCM 2000 Level of Service FHCM 2000 Volume to Capacity ratio 1.19Actuated Cycle Length (s) 145.0 Sum of lost time (s) 16.0Intersection Capacity Utilization 95.6% ICU Level of Service FAnalysis Period (min) 15c Critical Lane Group

HCM Signalized Intersection Capacity Analysis2: Hesperian Blvd & Southland Drive 7/14/2017
Cumulative AM Synchro 8 ReportPage 2
Movement EBL EBT EBR WBL WBT WBR NBL NBT NBR SBL SBT SBRLane ConfigurationsVolume (vph) 120 140 150 270 390 40 80 1030 110 60 2240 280Ideal Flow (vphpl) 1900 1900 1900 1900 1900 1900 1900 1900 1900 1900 1900 1900Total Lost time (s) 4.0 4.0 4.0 4.0 4.0 4.0 4.0 4.0Lane Util. Factor 1.00 0.95 1.00 0.91 1.00 0.91 1.00 0.91Frpb, ped/bikes 1.00 0.99 1.00 1.00 1.00 1.00 1.00 1.00Flpb, ped/bikes 1.00 1.00 0.99 1.00 1.00 1.00 1.00 1.00Frt 1.00 0.92 1.00 0.99 1.00 0.99 1.00 0.98Flt Protected 0.95 1.00 0.95 1.00 0.95 1.00 0.95 1.00Satd. Flow (prot) 1768 3216 1751 5007 1770 5005 1770 4991Flt Permitted 0.43 1.00 0.51 1.00 0.95 1.00 0.95 1.00Satd. Flow (perm) 800 3216 940 5007 1770 5005 1770 4991Peak-hour factor, PHF 0.94 0.94 0.94 0.94 0.94 0.94 0.94 0.94 0.94 0.94 0.94 0.94Adj. Flow (vph) 128 149 160 287 415 43 85 1096 117 64 2383 298RTOR Reduction (vph) 0 108 0 0 11 0 0 11 0 0 13 0Lane Group Flow (vph) 128 201 0 287 447 0 85 1202 0 64 2668 0Confl. Peds. (#/hr) 2 16 16 2 4 1 1 4Confl. Bikes (#/hr) 1 1Turn Type Perm NA Perm NA Prot NA Prot NAProtected Phases 8 4 1 6 5 2Permitted Phases 8 4Actuated Green, G (s) 35.6 35.6 35.6 35.6 7.8 54.8 7.0 54.0Effective Green, g (s) 35.6 35.6 35.6 35.6 7.8 55.4 7.0 54.6Actuated g/C Ratio 0.32 0.32 0.32 0.32 0.07 0.50 0.06 0.50Clearance Time (s) 4.0 4.0 4.0 4.0 4.0 4.6 4.0 4.6Vehicle Extension (s) 3.0 3.0 3.0 3.0 3.0 3.0 3.0 3.0Lane Grp Cap (vph) 258 1040 304 1620 125 2520 112 2477v/s Ratio Prot 0.06 0.09 c0.05 0.24 0.04 c0.53v/s Ratio Perm 0.16 c0.31v/c Ratio 0.50 0.19 0.94 0.28 0.68 0.48 0.57 1.08Uniform Delay, d1 30.0 26.8 36.2 27.6 49.9 17.8 50.0 27.7Progression Factor 1.00 1.00 1.00 1.00 0.81 1.69 1.00 1.00Incremental Delay, d2 1.5 0.1 36.7 0.1 13.6 0.6 6.9 42.9Delay (s) 31.5 26.9 73.0 27.7 54.0 30.8 56.9 70.6Level of Service C C E C D C E EApproach Delay (s) 28.3 45.1 32.4 70.3Approach LOS C D C E
Intersection SummaryHCM 2000 Control Delay 53.8 HCM 2000 Level of Service DHCM 2000 Volume to Capacity ratio 1.00Actuated Cycle Length (s) 110.0 Sum of lost time (s) 12.0Intersection Capacity Utilization 98.5% ICU Level of Service FAnalysis Period (min) 15c Critical Lane Group
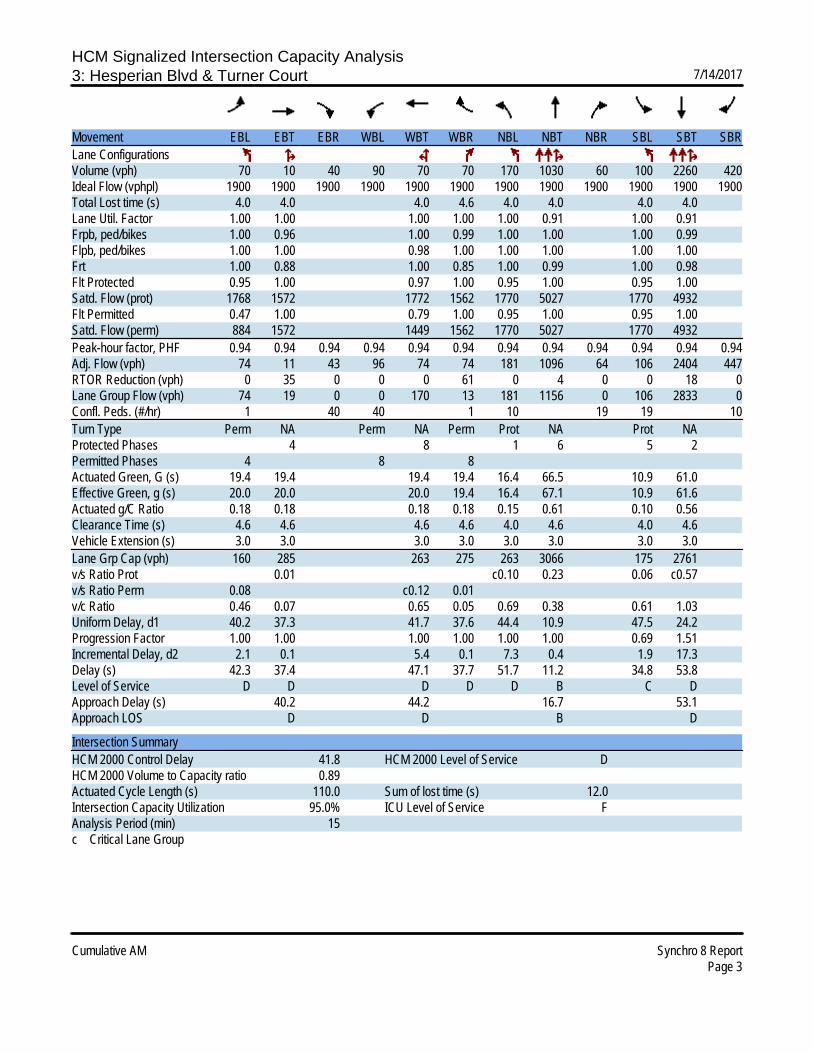
HCM Signalized Intersection Capacity Analysis3: Hesperian Blvd & Turner Court 7/14/2017
Cumulative AM Synchro 8 ReportPage 3
Movement EBL EBT EBR WBL WBT WBR NBL NBT NBR SBL SBT SBRLane ConfigurationsVolume (vph) 70 10 40 90 70 70 170 1030 60 100 2260 420Ideal Flow (vphpl) 1900 1900 1900 1900 1900 1900 1900 1900 1900 1900 1900 1900Total Lost time (s) 4.0 4.0 4.0 4.6 4.0 4.0 4.0 4.0Lane Util. Factor 1.00 1.00 1.00 1.00 1.00 0.91 1.00 0.91Frpb, ped/bikes 1.00 0.96 1.00 0.99 1.00 1.00 1.00 0.99Flpb, ped/bikes 1.00 1.00 0.98 1.00 1.00 1.00 1.00 1.00Frt 1.00 0.88 1.00 0.85 1.00 0.99 1.00 0.98Flt Protected 0.95 1.00 0.97 1.00 0.95 1.00 0.95 1.00Satd. Flow (prot) 1768 1572 1772 1562 1770 5027 1770 4932Flt Permitted 0.47 1.00 0.79 1.00 0.95 1.00 0.95 1.00Satd. Flow (perm) 884 1572 1449 1562 1770 5027 1770 4932Peak-hour factor, PHF 0.94 0.94 0.94 0.94 0.94 0.94 0.94 0.94 0.94 0.94 0.94 0.94Adj. Flow (vph) 74 11 43 96 74 74 181 1096 64 106 2404 447RTOR Reduction (vph) 0 35 0 0 0 61 0 4 0 0 18 0Lane Group Flow (vph) 74 19 0 0 170 13 181 1156 0 106 2833 0Confl. Peds. (#/hr) 1 40 40 1 10 19 19 10Turn Type Perm NA Perm NA Perm Prot NA Prot NAProtected Phases 4 8 1 6 5 2Permitted Phases 4 8 8Actuated Green, G (s) 19.4 19.4 19.4 19.4 16.4 66.5 10.9 61.0Effective Green, g (s) 20.0 20.0 20.0 19.4 16.4 67.1 10.9 61.6Actuated g/C Ratio 0.18 0.18 0.18 0.18 0.15 0.61 0.10 0.56Clearance Time (s) 4.6 4.6 4.6 4.6 4.0 4.6 4.0 4.6Vehicle Extension (s) 3.0 3.0 3.0 3.0 3.0 3.0 3.0 3.0Lane Grp Cap (vph) 160 285 263 275 263 3066 175 2761v/s Ratio Prot 0.01 c0.10 0.23 0.06 c0.57v/s Ratio Perm 0.08 c0.12 0.01v/c Ratio 0.46 0.07 0.65 0.05 0.69 0.38 0.61 1.03Uniform Delay, d1 40.2 37.3 41.7 37.6 44.4 10.9 47.5 24.2Progression Factor 1.00 1.00 1.00 1.00 1.00 1.00 0.69 1.51Incremental Delay, d2 2.1 0.1 5.4 0.1 7.3 0.4 1.9 17.3Delay (s) 42.3 37.4 47.1 37.7 51.7 11.2 34.8 53.8Level of Service D D D D D B C DApproach Delay (s) 40.2 44.2 16.7 53.1Approach LOS D D B D
Intersection SummaryHCM 2000 Control Delay 41.8 HCM 2000 Level of Service DHCM 2000 Volume to Capacity ratio 0.89Actuated Cycle Length (s) 110.0 Sum of lost time (s) 12.0Intersection Capacity Utilization 95.0% ICU Level of Service FAnalysis Period (min) 15c Critical Lane Group

HCM Signalized Intersection Capacity Analysis4: Hesperian Blvd & East Driveway 7/14/2017
Cumulative AM Synchro 8 ReportPage 4
Movement EBL EBR NBL NBT SBU SBT SBRLane ConfigurationsVolume (vph) 70 110 180 1190 20 2130 280Ideal Flow (vphpl) 1900 1900 1900 1900 1900 1900 1900Total Lost time (s) 4.0 4.0 4.0 4.0 4.0 4.0Lane Util. Factor 1.00 1.00 1.00 0.91 1.00 0.91Frpb, ped/bikes 1.00 0.98 1.00 1.00 1.00 1.00Flpb, ped/bikes 1.00 1.00 1.00 1.00 1.00 1.00Frt 1.00 0.85 1.00 1.00 1.00 0.98Flt Protected 0.95 1.00 0.95 1.00 0.95 1.00Satd. Flow (prot) 1770 1555 1770 5085 1770 4983Flt Permitted 0.95 1.00 0.95 1.00 0.95 1.00Satd. Flow (perm) 1770 1555 1770 5085 1770 4983Peak-hour factor, PHF 0.95 0.95 0.95 0.95 0.95 0.95 0.95Adj. Flow (vph) 74 116 189 1253 21 2242 295RTOR Reduction (vph) 0 104 0 0 0 13 0Lane Group Flow (vph) 74 12 189 1253 21 2524 0Confl. Peds. (#/hr) 4 1 5 1Turn Type Prot Perm Prot NA Prot NAProtected Phases 4 1 6 5 2Permitted Phases 4Actuated Green, G (s) 13.3 13.3 22.6 98.9 4.8 81.1Effective Green, g (s) 13.3 13.3 22.6 99.9 4.8 82.1Actuated g/C Ratio 0.10 0.10 0.17 0.77 0.04 0.63Clearance Time (s) 4.0 4.0 4.0 5.0 4.0 5.0Vehicle Extension (s) 3.0 3.0 3.0 3.0 3.0 3.0Lane Grp Cap (vph) 181 159 307 3907 65 3146v/s Ratio Prot c0.04 c0.11 0.25 0.01 c0.51v/s Ratio Perm 0.01v/c Ratio 0.41 0.07 0.62 0.32 0.32 0.80Uniform Delay, d1 54.7 52.8 49.7 4.6 61.0 17.9Progression Factor 1.00 1.00 0.92 0.83 1.00 1.00Incremental Delay, d2 1.5 0.2 3.2 0.2 2.9 2.3Delay (s) 56.2 53.0 48.9 4.0 63.9 20.2Level of Service E D D A E CApproach Delay (s) 54.2 9.9 20.5Approach LOS D A C
Intersection SummaryHCM 2000 Control Delay 18.4 HCM 2000 Level of Service BHCM 2000 Volume to Capacity ratio 0.72Actuated Cycle Length (s) 130.0 Sum of lost time (s) 12.0Intersection Capacity Utilization 75.9% ICU Level of Service DAnalysis Period (min) 15c Critical Lane Group

HCM Signalized Intersection Capacity Analysis5: Hesperian Blvd & Depot Road 7/14/2017
Cumulative AM Synchro 8 ReportPage 5
Movement EBL EBT EBR WBL WBT WBR NBL NBT NBR SBL SBT SBRLane ConfigurationsVolume (vph) 200 80 420 250 180 50 390 1100 120 100 1950 220Ideal Flow (vphpl) 1900 1900 1900 1900 1900 1900 1900 1900 1900 1900 1900 1900Total Lost time (s) 4.0 4.0 4.0 4.0 4.0 4.0 4.0 4.0 4.0Lane Util. Factor 0.95 0.95 1.00 1.00 1.00 1.00 0.91 1.00 0.91Frpb, ped/bikes 1.00 1.00 0.96 1.00 1.00 1.00 1.00 1.00 1.00Flpb, ped/bikes 1.00 1.00 1.00 1.00 1.00 1.00 1.00 1.00 1.00Frt 1.00 1.00 0.85 1.00 0.97 1.00 0.99 1.00 0.98Flt Protected 0.95 0.98 1.00 0.95 1.00 0.95 1.00 0.95 1.00Satd. Flow (prot) 1681 1734 1521 1770 1795 1770 4993 1770 4987Flt Permitted 0.95 0.98 1.00 0.95 1.00 0.95 1.00 0.95 1.00Satd. Flow (perm) 1681 1734 1521 1770 1795 1770 4993 1770 4987Peak-hour factor, PHF 0.95 0.95 0.95 0.95 0.95 0.95 0.95 0.95 0.95 0.95 0.95 0.95Adj. Flow (vph) 211 84 442 263 189 53 411 1158 126 105 2053 232RTOR Reduction (vph) 0 0 377 0 8 0 0 10 0 0 9 0Lane Group Flow (vph) 152 143 65 263 234 0 411 1274 0 105 2276 0Confl. Peds. (#/hr) 2 19 19 2 17 5 5 17Confl. Bikes (#/hr) 1 1Turn Type Split NA Perm Split NA Prot NA Prot NAProtected Phases 4 4 3 3 5 2 1 6Permitted Phases 4Actuated Green, G (s) 19.1 19.1 19.1 18.0 18.0 34.0 63.6 12.7 42.3Effective Green, g (s) 19.1 19.1 19.1 18.0 18.0 34.0 64.2 12.7 42.9Actuated g/C Ratio 0.15 0.15 0.15 0.14 0.14 0.26 0.49 0.10 0.33Clearance Time (s) 4.0 4.0 4.0 4.0 4.0 4.0 4.6 4.0 4.6Vehicle Extension (s) 3.0 3.0 3.0 3.0 3.0 3.0 3.0 3.0 3.0Lane Grp Cap (vph) 246 254 223 245 248 462 2465 172 1645v/s Ratio Prot c0.09 0.08 c0.15 0.13 c0.23 0.26 0.06 c0.46v/s Ratio Perm 0.04v/c Ratio 0.62 0.56 0.29 1.07 0.94 0.89 0.52 0.61 1.38Uniform Delay, d1 52.0 51.6 49.4 56.0 55.5 46.2 22.4 56.3 43.5Progression Factor 1.00 1.00 1.00 1.00 1.00 1.00 1.00 1.11 0.81Incremental Delay, d2 4.6 2.8 0.7 78.4 41.8 18.5 0.8 3.9 174.9Delay (s) 56.6 54.4 50.1 134.4 97.3 64.7 23.1 66.5 210.3Level of Service E D D F F E C E FApproach Delay (s) 52.3 116.6 33.2 204.0Approach LOS D F C F
Intersection SummaryHCM 2000 Control Delay 120.4 HCM 2000 Level of Service FHCM 2000 Volume to Capacity ratio 1.06Actuated Cycle Length (s) 130.0 Sum of lost time (s) 16.0Intersection Capacity Utilization 106.5% ICU Level of Service GAnalysis Period (min) 15c Critical Lane Group

HCM Signalized Intersection Capacity Analysis6: Hesperian Blvd & WB Ramp SR-92 7/14/2017
Cumulative AM Synchro 8 ReportPage 6
Movement EBL EBR NBL NBT SBT SBRLane ConfigurationsVolume (vph) 490 810 480 1090 1860 850Ideal Flow (vphpl) 1900 1900 1900 1900 1900 1900Total Lost time (s) 3.7 3.7 3.7 4.1 4.1Lane Util. Factor 0.97 1.00 1.00 0.91 0.91Frpb, ped/bikes 1.00 1.00 1.00 1.00 0.99Flpb, ped/bikes 1.00 1.00 1.00 1.00 1.00Frt 1.00 0.85 1.00 1.00 0.95Flt Protected 0.95 1.00 0.95 1.00 1.00Satd. Flow (prot) 3433 1583 1770 5085 4790Flt Permitted 0.95 1.00 0.95 1.00 1.00Satd. Flow (perm) 3433 1583 1770 5085 4790Peak-hour factor, PHF 0.97 0.97 0.97 0.97 0.97 0.97Adj. Flow (vph) 505 835 495 1124 1918 876RTOR Reduction (vph) 0 237 0 0 91 0Lane Group Flow (vph) 505 598 495 1124 2703 0Confl. Peds. (#/hr) 13 13Turn Type Perm Perm Prot NA NAProtected Phases 5 2 6Permitted Phases 4 4Actuated Green, G (s) 16.9 16.9 16.0 64.3 44.1Effective Green, g (s) 17.4 17.4 16.5 64.8 44.6Actuated g/C Ratio 0.19 0.19 0.18 0.72 0.50Clearance Time (s) 4.2 4.2 4.2 4.6 4.6Vehicle Extension (s) 3.0 3.0 3.0 3.0 3.0Lane Grp Cap (vph) 663 306 324 3661 2373v/s Ratio Prot c0.28 0.22 c0.56v/s Ratio Perm 0.15 c0.38v/c Ratio 0.76 1.95 1.53 0.31 1.14Uniform Delay, d1 34.3 36.3 36.8 4.5 22.7Progression Factor 1.00 1.00 1.01 1.56 1.00Incremental Delay, d2 5.2 440.9 243.6 0.1 68.2Delay (s) 39.5 477.2 280.7 7.2 90.9Level of Service D F F A FApproach Delay (s) 312.3 90.8 90.9Approach LOS F F F
Intersection SummaryHCM 2000 Control Delay 142.4 HCM 2000 Level of Service FHCM 2000 Volume to Capacity ratio 1.41Actuated Cycle Length (s) 90.0 Sum of lost time (s) 12.0Intersection Capacity Utilization 112.3% ICU Level of Service HAnalysis Period (min) 15c Critical Lane Group
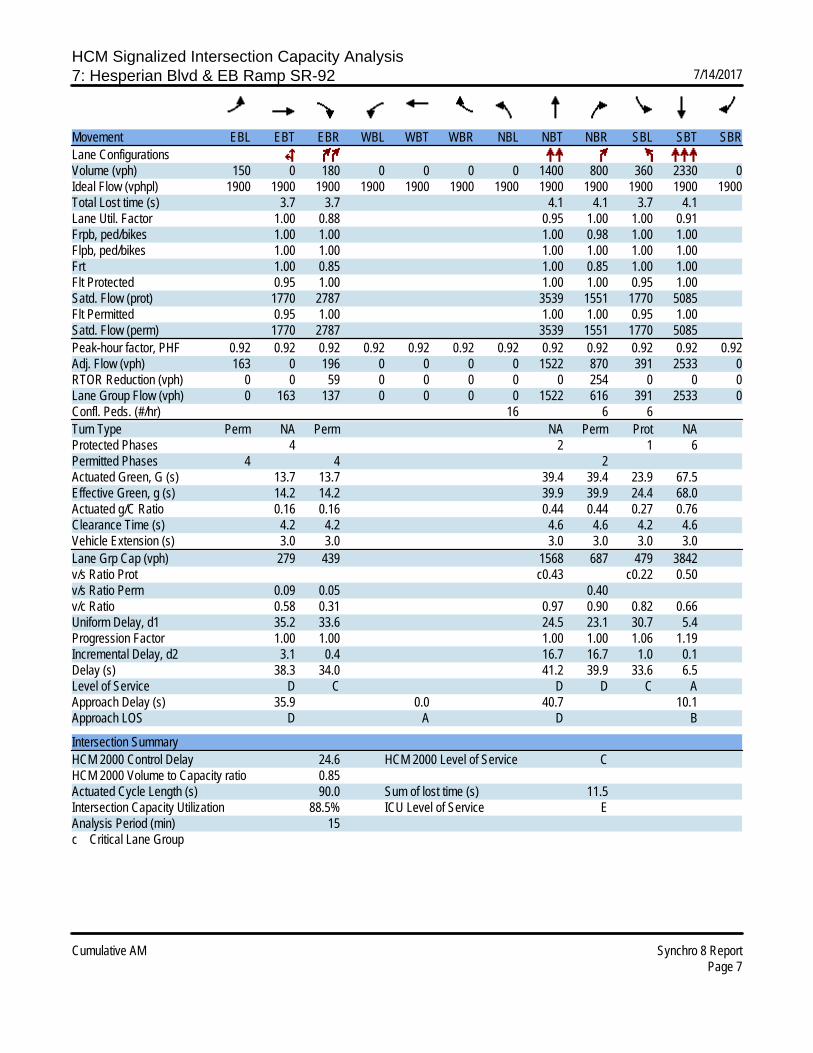
HCM Signalized Intersection Capacity Analysis7: Hesperian Blvd & EB Ramp SR-92 7/14/2017
Cumulative AM Synchro 8 ReportPage 7
Movement EBL EBT EBR WBL WBT WBR NBL NBT NBR SBL SBT SBRLane ConfigurationsVolume (vph) 150 0 180 0 0 0 0 1400 800 360 2330 0Ideal Flow (vphpl) 1900 1900 1900 1900 1900 1900 1900 1900 1900 1900 1900 1900Total Lost time (s) 3.7 3.7 4.1 4.1 3.7 4.1Lane Util. Factor 1.00 0.88 0.95 1.00 1.00 0.91Frpb, ped/bikes 1.00 1.00 1.00 0.98 1.00 1.00Flpb, ped/bikes 1.00 1.00 1.00 1.00 1.00 1.00Frt 1.00 0.85 1.00 0.85 1.00 1.00Flt Protected 0.95 1.00 1.00 1.00 0.95 1.00Satd. Flow (prot) 1770 2787 3539 1551 1770 5085Flt Permitted 0.95 1.00 1.00 1.00 0.95 1.00Satd. Flow (perm) 1770 2787 3539 1551 1770 5085Peak-hour factor, PHF 0.92 0.92 0.92 0.92 0.92 0.92 0.92 0.92 0.92 0.92 0.92 0.92Adj. Flow (vph) 163 0 196 0 0 0 0 1522 870 391 2533 0RTOR Reduction (vph) 0 0 59 0 0 0 0 0 254 0 0 0Lane Group Flow (vph) 0 163 137 0 0 0 0 1522 616 391 2533 0Confl. Peds. (#/hr) 16 6 6Turn Type Perm NA Perm NA Perm Prot NAProtected Phases 4 2 1 6Permitted Phases 4 4 2Actuated Green, G (s) 13.7 13.7 39.4 39.4 23.9 67.5Effective Green, g (s) 14.2 14.2 39.9 39.9 24.4 68.0Actuated g/C Ratio 0.16 0.16 0.44 0.44 0.27 0.76Clearance Time (s) 4.2 4.2 4.6 4.6 4.2 4.6Vehicle Extension (s) 3.0 3.0 3.0 3.0 3.0 3.0Lane Grp Cap (vph) 279 439 1568 687 479 3842v/s Ratio Prot c0.43 c0.22 0.50v/s Ratio Perm 0.09 0.05 0.40v/c Ratio 0.58 0.31 0.97 0.90 0.82 0.66Uniform Delay, d1 35.2 33.6 24.5 23.1 30.7 5.4Progression Factor 1.00 1.00 1.00 1.00 1.06 1.19Incremental Delay, d2 3.1 0.4 16.7 16.7 1.0 0.1Delay (s) 38.3 34.0 41.2 39.9 33.6 6.5Level of Service D C D D C AApproach Delay (s) 35.9 0.0 40.7 10.1Approach LOS D A D B
Intersection SummaryHCM 2000 Control Delay 24.6 HCM 2000 Level of Service CHCM 2000 Volume to Capacity ratio 0.85Actuated Cycle Length (s) 90.0 Sum of lost time (s) 11.5Intersection Capacity Utilization 88.5% ICU Level of Service EAnalysis Period (min) 15c Critical Lane Group
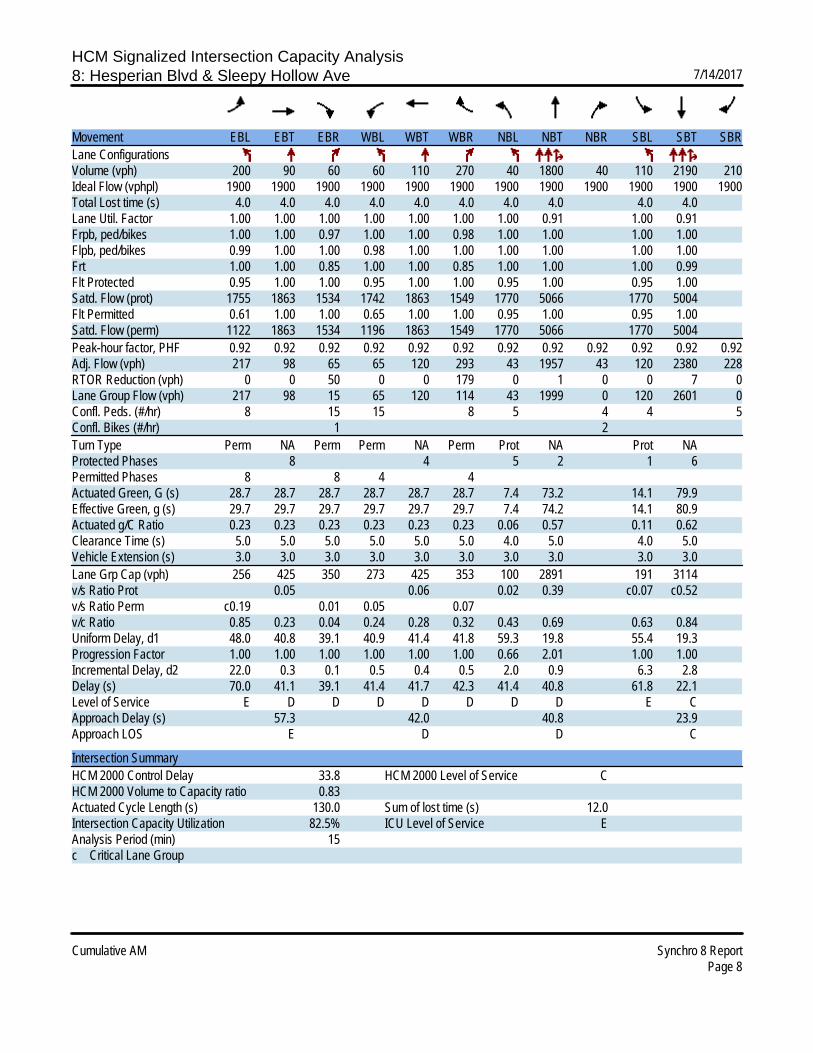
HCM Signalized Intersection Capacity Analysis8: Hesperian Blvd & Sleepy Hollow Ave 7/14/2017
Cumulative AM Synchro 8 ReportPage 8
Movement EBL EBT EBR WBL WBT WBR NBL NBT NBR SBL SBT SBRLane ConfigurationsVolume (vph) 200 90 60 60 110 270 40 1800 40 110 2190 210Ideal Flow (vphpl) 1900 1900 1900 1900 1900 1900 1900 1900 1900 1900 1900 1900Total Lost time (s) 4.0 4.0 4.0 4.0 4.0 4.0 4.0 4.0 4.0 4.0Lane Util. Factor 1.00 1.00 1.00 1.00 1.00 1.00 1.00 0.91 1.00 0.91Frpb, ped/bikes 1.00 1.00 0.97 1.00 1.00 0.98 1.00 1.00 1.00 1.00Flpb, ped/bikes 0.99 1.00 1.00 0.98 1.00 1.00 1.00 1.00 1.00 1.00Frt 1.00 1.00 0.85 1.00 1.00 0.85 1.00 1.00 1.00 0.99Flt Protected 0.95 1.00 1.00 0.95 1.00 1.00 0.95 1.00 0.95 1.00Satd. Flow (prot) 1755 1863 1534 1742 1863 1549 1770 5066 1770 5004Flt Permitted 0.61 1.00 1.00 0.65 1.00 1.00 0.95 1.00 0.95 1.00Satd. Flow (perm) 1122 1863 1534 1196 1863 1549 1770 5066 1770 5004Peak-hour factor, PHF 0.92 0.92 0.92 0.92 0.92 0.92 0.92 0.92 0.92 0.92 0.92 0.92Adj. Flow (vph) 217 98 65 65 120 293 43 1957 43 120 2380 228RTOR Reduction (vph) 0 0 50 0 0 179 0 1 0 0 7 0Lane Group Flow (vph) 217 98 15 65 120 114 43 1999 0 120 2601 0Confl. Peds. (#/hr) 8 15 15 8 5 4 4 5Confl. Bikes (#/hr) 1 2Turn Type Perm NA Perm Perm NA Perm Prot NA Prot NAProtected Phases 8 4 5 2 1 6Permitted Phases 8 8 4 4Actuated Green, G (s) 28.7 28.7 28.7 28.7 28.7 28.7 7.4 73.2 14.1 79.9Effective Green, g (s) 29.7 29.7 29.7 29.7 29.7 29.7 7.4 74.2 14.1 80.9Actuated g/C Ratio 0.23 0.23 0.23 0.23 0.23 0.23 0.06 0.57 0.11 0.62Clearance Time (s) 5.0 5.0 5.0 5.0 5.0 5.0 4.0 5.0 4.0 5.0Vehicle Extension (s) 3.0 3.0 3.0 3.0 3.0 3.0 3.0 3.0 3.0 3.0Lane Grp Cap (vph) 256 425 350 273 425 353 100 2891 191 3114v/s Ratio Prot 0.05 0.06 0.02 0.39 c0.07 c0.52v/s Ratio Perm c0.19 0.01 0.05 0.07v/c Ratio 0.85 0.23 0.04 0.24 0.28 0.32 0.43 0.69 0.63 0.84Uniform Delay, d1 48.0 40.8 39.1 40.9 41.4 41.8 59.3 19.8 55.4 19.3Progression Factor 1.00 1.00 1.00 1.00 1.00 1.00 0.66 2.01 1.00 1.00Incremental Delay, d2 22.0 0.3 0.1 0.5 0.4 0.5 2.0 0.9 6.3 2.8Delay (s) 70.0 41.1 39.1 41.4 41.7 42.3 41.4 40.8 61.8 22.1Level of Service E D D D D D D D E CApproach Delay (s) 57.3 42.0 40.8 23.9Approach LOS E D D C
Intersection SummaryHCM 2000 Control Delay 33.8 HCM 2000 Level of Service CHCM 2000 Volume to Capacity ratio 0.83Actuated Cycle Length (s) 130.0 Sum of lost time (s) 12.0Intersection Capacity Utilization 82.5% ICU Level of Service EAnalysis Period (min) 15c Critical Lane Group

HCM Signalized Intersection Capacity Analysis9: Hesperian Blvd & Tennyson Road 7/14/2017
Cumulative AM Synchro 8 ReportPage 9
Movement EBL EBT EBR WBL WBT WBR NBL NBT NBR SBL SBT SBRLane ConfigurationsVolume (vph) 180 220 50 380 570 250 90 1230 110 220 1710 340Ideal Flow (vphpl) 1900 1900 1900 1900 1900 1900 1900 1900 1900 1900 1900 1900Total Lost time (s) 4.0 4.0 4.0 4.0 4.0 4.0 4.0 4.0 4.0 4.0Lane Util. Factor 1.00 0.95 1.00 1.00 0.95 1.00 1.00 0.91 1.00 0.91Frpb, ped/bikes 1.00 1.00 0.96 1.00 1.00 0.97 1.00 1.00 1.00 1.00Flpb, ped/bikes 1.00 1.00 1.00 1.00 1.00 1.00 1.00 1.00 1.00 1.00Frt 1.00 1.00 0.85 1.00 1.00 0.85 1.00 0.99 1.00 0.98Flt Protected 0.95 1.00 1.00 0.95 1.00 1.00 0.95 1.00 0.95 1.00Satd. Flow (prot) 1770 3539 1524 1770 3539 1542 1770 5006 1770 4935Flt Permitted 0.95 1.00 1.00 0.95 1.00 1.00 0.95 1.00 0.95 1.00Satd. Flow (perm) 1770 3539 1524 1770 3539 1542 1770 5006 1770 4935Peak-hour factor, PHF 0.92 0.92 0.92 0.92 0.92 0.92 0.92 0.92 0.92 0.92 0.92 0.92Adj. Flow (vph) 196 239 54 413 620 272 98 1337 120 239 1859 370RTOR Reduction (vph) 0 0 43 0 0 191 0 7 0 0 20 0Lane Group Flow (vph) 196 239 11 413 620 81 98 1450 0 239 2209 0Confl. Peds. (#/hr) 12 21 21 12 15 25 25 15Confl. Bikes (#/hr) 2 1Turn Type Prot NA Perm Prot NA Perm Prot NA Prot NAProtected Phases 3 8 7 4 1 6 5 2Permitted Phases 8 4Actuated Green, G (s) 17.0 25.1 25.1 22.0 30.1 30.1 11.8 41.2 23.6 53.0Effective Green, g (s) 17.0 26.1 26.1 22.0 31.1 31.1 11.8 42.3 23.6 54.1Actuated g/C Ratio 0.13 0.20 0.20 0.17 0.24 0.24 0.09 0.33 0.18 0.42Clearance Time (s) 4.0 5.0 5.0 4.0 5.0 5.0 4.0 5.1 4.0 5.1Vehicle Extension (s) 3.0 3.0 3.0 3.0 3.0 3.0 3.0 3.0 3.0 3.0Lane Grp Cap (vph) 231 710 305 299 846 368 160 1628 321 2053v/s Ratio Prot 0.11 0.07 c0.23 c0.18 0.06 0.29 c0.14 c0.45v/s Ratio Perm 0.01 0.05v/c Ratio 0.85 0.34 0.04 1.38 0.73 0.22 0.61 0.89 0.74 1.08Uniform Delay, d1 55.2 44.5 41.8 54.0 45.6 39.7 56.9 41.6 50.3 38.0Progression Factor 1.00 1.00 1.00 1.00 1.00 1.00 1.00 1.00 1.41 0.74Incremental Delay, d2 24.0 0.3 0.0 191.1 3.3 0.3 6.8 7.8 5.4 40.4Delay (s) 79.3 44.8 41.9 245.1 48.9 40.0 63.7 49.4 76.6 68.5Level of Service E D D F D D E D E EApproach Delay (s) 58.3 109.2 50.3 69.3Approach LOS E F D E
Intersection SummaryHCM 2000 Control Delay 72.2 HCM 2000 Level of Service EHCM 2000 Volume to Capacity ratio 1.05Actuated Cycle Length (s) 130.0 Sum of lost time (s) 16.0Intersection Capacity Utilization 98.2% ICU Level of Service FAnalysis Period (min) 15c Critical Lane Group

HCM Signalized Intersection Capacity Analysis10: Industrial Blvd & EB Ramp SR-92 7/14/2017
Cumulative AM Synchro 8 ReportPage 10
Movement EBL EBT EBR WBL WBT WBR NBL NBT NBR SBL SBT SBRLane ConfigurationsVolume (vph) 140 20 300 90 80 150 230 1570 50 40 800 250Ideal Flow (vphpl) 1900 1900 1900 1900 1900 1900 1900 1900 1900 1900 1900 1900Total Lost time (s) 4.2 4.2 4.2 4.2 3.2 3.6 3.6 3.2 3.6 3.6Lane Util. Factor 1.00 1.00 1.00 1.00 1.00 0.95 1.00 1.00 0.95 1.00Frpb, ped/bikes 1.00 1.00 1.00 1.00 1.00 1.00 0.97 1.00 1.00 0.97Flpb, ped/bikes 1.00 1.00 1.00 1.00 1.00 1.00 1.00 1.00 1.00 1.00Frt 1.00 0.85 1.00 0.85 1.00 1.00 0.85 1.00 1.00 0.85Flt Protected 0.96 1.00 0.97 1.00 0.95 1.00 1.00 0.95 1.00 1.00Satd. Flow (prot) 1785 1583 1815 1583 1770 3539 1534 1770 3539 1532Flt Permitted 0.55 1.00 0.67 1.00 0.95 1.00 1.00 0.95 1.00 1.00Satd. Flow (perm) 1020 1583 1243 1583 1770 3539 1534 1770 3539 1532Peak-hour factor, PHF 0.91 0.91 0.91 0.91 0.91 0.91 0.91 0.91 0.91 0.91 0.91 0.91Adj. Flow (vph) 154 22 330 99 88 165 253 1725 55 44 879 275RTOR Reduction (vph) 0 0 231 0 0 127 0 0 26 0 0 152Lane Group Flow (vph) 0 176 99 0 187 38 253 1725 29 44 879 123Confl. Peds. (#/hr) 6 6 6 6Confl. Bikes (#/hr) 1Turn Type Perm NA Perm Perm NA Perm Prot NA Perm Prot NA PermProtected Phases 8 4 1 6 5 2Permitted Phases 8 8 4 4 6 2Actuated Green, G (s) 15.5 15.5 15.5 15.5 11.1 36.6 36.6 5.4 30.9 30.9Effective Green, g (s) 16.0 16.0 16.0 16.0 11.6 37.1 37.1 5.9 31.4 31.4Actuated g/C Ratio 0.23 0.23 0.23 0.23 0.17 0.53 0.53 0.08 0.45 0.45Clearance Time (s) 4.7 4.7 4.7 4.7 3.7 4.1 4.1 3.7 4.1 4.1Vehicle Extension (s) 3.0 3.0 3.0 3.0 3.0 3.0 3.0 3.0 3.0 3.0Lane Grp Cap (vph) 233 361 284 361 293 1875 813 149 1587 687v/s Ratio Prot c0.14 c0.49 0.02 0.25v/s Ratio Perm c0.17 0.06 0.15 0.02 0.02 0.08v/c Ratio 0.76 0.27 0.66 0.10 0.86 0.92 0.04 0.30 0.55 0.18Uniform Delay, d1 25.2 22.2 24.5 21.3 28.4 15.1 7.9 30.1 14.2 11.6Progression Factor 1.00 1.00 1.00 1.00 1.00 1.00 1.00 0.67 2.07 7.07Incremental Delay, d2 13.0 0.4 5.4 0.1 22.2 8.9 0.1 0.1 0.1 0.1Delay (s) 38.2 22.6 29.9 21.5 50.6 23.9 8.0 20.2 29.4 81.9Level of Service D C C C D C A C C FApproach Delay (s) 28.0 26.0 26.8 41.1Approach LOS C C C D
Intersection SummaryHCM 2000 Control Delay 31.1 HCM 2000 Level of Service CHCM 2000 Volume to Capacity ratio 0.90Actuated Cycle Length (s) 70.0 Sum of lost time (s) 11.0Intersection Capacity Utilization 76.9% ICU Level of Service DAnalysis Period (min) 15c Critical Lane Group
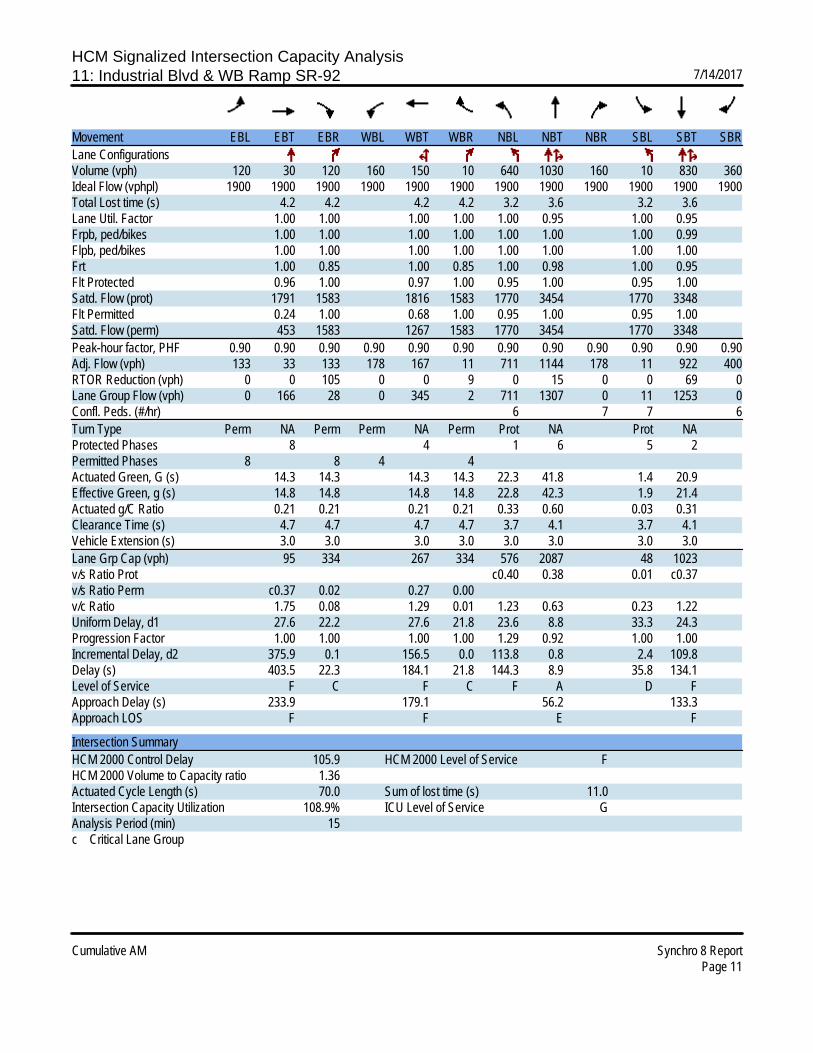
HCM Signalized Intersection Capacity Analysis11: Industrial Blvd & WB Ramp SR-92 7/14/2017
Cumulative AM Synchro 8 ReportPage 11
Movement EBL EBT EBR WBL WBT WBR NBL NBT NBR SBL SBT SBRLane ConfigurationsVolume (vph) 120 30 120 160 150 10 640 1030 160 10 830 360Ideal Flow (vphpl) 1900 1900 1900 1900 1900 1900 1900 1900 1900 1900 1900 1900Total Lost time (s) 4.2 4.2 4.2 4.2 3.2 3.6 3.2 3.6Lane Util. Factor 1.00 1.00 1.00 1.00 1.00 0.95 1.00 0.95Frpb, ped/bikes 1.00 1.00 1.00 1.00 1.00 1.00 1.00 0.99Flpb, ped/bikes 1.00 1.00 1.00 1.00 1.00 1.00 1.00 1.00Frt 1.00 0.85 1.00 0.85 1.00 0.98 1.00 0.95Flt Protected 0.96 1.00 0.97 1.00 0.95 1.00 0.95 1.00Satd. Flow (prot) 1791 1583 1816 1583 1770 3454 1770 3348Flt Permitted 0.24 1.00 0.68 1.00 0.95 1.00 0.95 1.00Satd. Flow (perm) 453 1583 1267 1583 1770 3454 1770 3348Peak-hour factor, PHF 0.90 0.90 0.90 0.90 0.90 0.90 0.90 0.90 0.90 0.90 0.90 0.90Adj. Flow (vph) 133 33 133 178 167 11 711 1144 178 11 922 400RTOR Reduction (vph) 0 0 105 0 0 9 0 15 0 0 69 0Lane Group Flow (vph) 0 166 28 0 345 2 711 1307 0 11 1253 0Confl. Peds. (#/hr) 6 7 7 6Turn Type Perm NA Perm Perm NA Perm Prot NA Prot NAProtected Phases 8 4 1 6 5 2Permitted Phases 8 8 4 4Actuated Green, G (s) 14.3 14.3 14.3 14.3 22.3 41.8 1.4 20.9Effective Green, g (s) 14.8 14.8 14.8 14.8 22.8 42.3 1.9 21.4Actuated g/C Ratio 0.21 0.21 0.21 0.21 0.33 0.60 0.03 0.31Clearance Time (s) 4.7 4.7 4.7 4.7 3.7 4.1 3.7 4.1Vehicle Extension (s) 3.0 3.0 3.0 3.0 3.0 3.0 3.0 3.0Lane Grp Cap (vph) 95 334 267 334 576 2087 48 1023v/s Ratio Prot c0.40 0.38 0.01 c0.37v/s Ratio Perm c0.37 0.02 0.27 0.00v/c Ratio 1.75 0.08 1.29 0.01 1.23 0.63 0.23 1.22Uniform Delay, d1 27.6 22.2 27.6 21.8 23.6 8.8 33.3 24.3Progression Factor 1.00 1.00 1.00 1.00 1.29 0.92 1.00 1.00Incremental Delay, d2 375.9 0.1 156.5 0.0 113.8 0.8 2.4 109.8Delay (s) 403.5 22.3 184.1 21.8 144.3 8.9 35.8 134.1Level of Service F C F C F A D FApproach Delay (s) 233.9 179.1 56.2 133.3Approach LOS F F E F
Intersection SummaryHCM 2000 Control Delay 105.9 HCM 2000 Level of Service FHCM 2000 Volume to Capacity ratio 1.36Actuated Cycle Length (s) 70.0 Sum of lost time (s) 11.0Intersection Capacity Utilization 108.9% ICU Level of Service GAnalysis Period (min) 15c Critical Lane Group
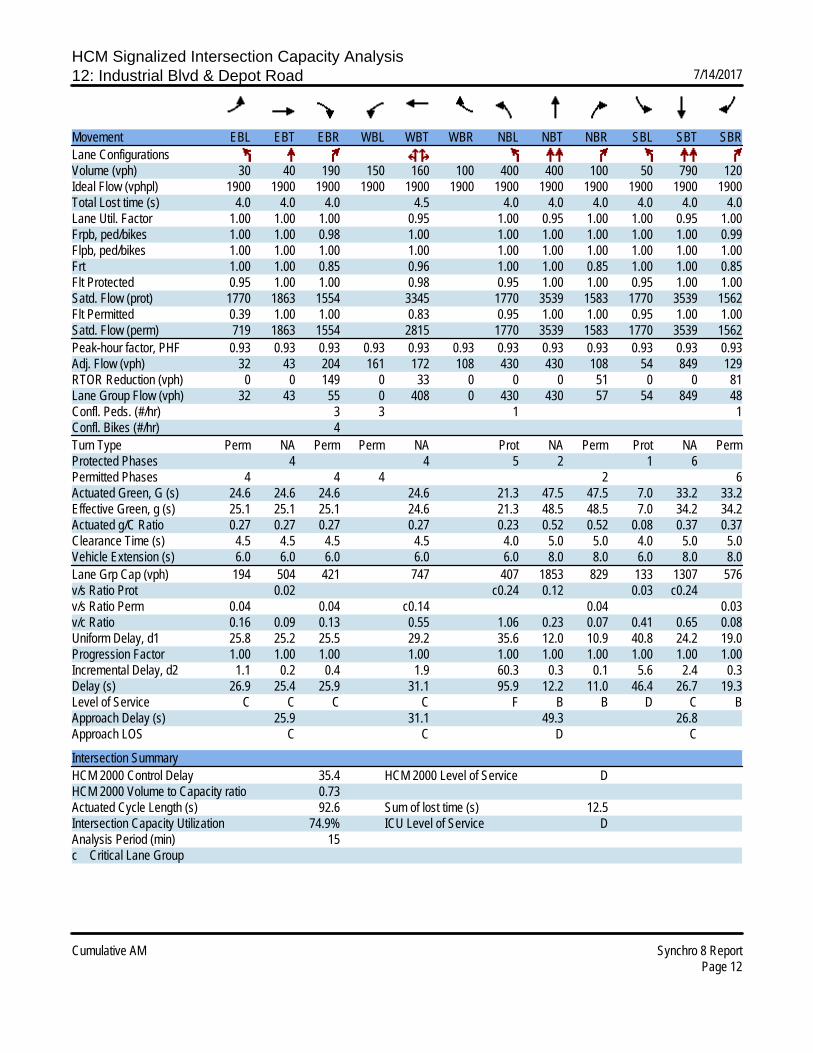
HCM Signalized Intersection Capacity Analysis12: Industrial Blvd & Depot Road 7/14/2017
Cumulative AM Synchro 8 ReportPage 12
Movement EBL EBT EBR WBL WBT WBR NBL NBT NBR SBL SBT SBRLane ConfigurationsVolume (vph) 30 40 190 150 160 100 400 400 100 50 790 120Ideal Flow (vphpl) 1900 1900 1900 1900 1900 1900 1900 1900 1900 1900 1900 1900Total Lost time (s) 4.0 4.0 4.0 4.5 4.0 4.0 4.0 4.0 4.0 4.0Lane Util. Factor 1.00 1.00 1.00 0.95 1.00 0.95 1.00 1.00 0.95 1.00Frpb, ped/bikes 1.00 1.00 0.98 1.00 1.00 1.00 1.00 1.00 1.00 0.99Flpb, ped/bikes 1.00 1.00 1.00 1.00 1.00 1.00 1.00 1.00 1.00 1.00Frt 1.00 1.00 0.85 0.96 1.00 1.00 0.85 1.00 1.00 0.85Flt Protected 0.95 1.00 1.00 0.98 0.95 1.00 1.00 0.95 1.00 1.00Satd. Flow (prot) 1770 1863 1554 3345 1770 3539 1583 1770 3539 1562Flt Permitted 0.39 1.00 1.00 0.83 0.95 1.00 1.00 0.95 1.00 1.00Satd. Flow (perm) 719 1863 1554 2815 1770 3539 1583 1770 3539 1562Peak-hour factor, PHF 0.93 0.93 0.93 0.93 0.93 0.93 0.93 0.93 0.93 0.93 0.93 0.93Adj. Flow (vph) 32 43 204 161 172 108 430 430 108 54 849 129RTOR Reduction (vph) 0 0 149 0 33 0 0 0 51 0 0 81Lane Group Flow (vph) 32 43 55 0 408 0 430 430 57 54 849 48Confl. Peds. (#/hr) 3 3 1 1Confl. Bikes (#/hr) 4Turn Type Perm NA Perm Perm NA Prot NA Perm Prot NA PermProtected Phases 4 4 5 2 1 6Permitted Phases 4 4 4 2 6Actuated Green, G (s) 24.6 24.6 24.6 24.6 21.3 47.5 47.5 7.0 33.2 33.2Effective Green, g (s) 25.1 25.1 25.1 24.6 21.3 48.5 48.5 7.0 34.2 34.2Actuated g/C Ratio 0.27 0.27 0.27 0.27 0.23 0.52 0.52 0.08 0.37 0.37Clearance Time (s) 4.5 4.5 4.5 4.5 4.0 5.0 5.0 4.0 5.0 5.0Vehicle Extension (s) 6.0 6.0 6.0 6.0 6.0 8.0 8.0 6.0 8.0 8.0Lane Grp Cap (vph) 194 504 421 747 407 1853 829 133 1307 576v/s Ratio Prot 0.02 c0.24 0.12 0.03 c0.24v/s Ratio Perm 0.04 0.04 c0.14 0.04 0.03v/c Ratio 0.16 0.09 0.13 0.55 1.06 0.23 0.07 0.41 0.65 0.08Uniform Delay, d1 25.8 25.2 25.5 29.2 35.6 12.0 10.9 40.8 24.2 19.0Progression Factor 1.00 1.00 1.00 1.00 1.00 1.00 1.00 1.00 1.00 1.00Incremental Delay, d2 1.1 0.2 0.4 1.9 60.3 0.3 0.1 5.6 2.4 0.3Delay (s) 26.9 25.4 25.9 31.1 95.9 12.2 11.0 46.4 26.7 19.3Level of Service C C C C F B B D C BApproach Delay (s) 25.9 31.1 49.3 26.8Approach LOS C C D C
Intersection SummaryHCM 2000 Control Delay 35.4 HCM 2000 Level of Service DHCM 2000 Volume to Capacity ratio 0.73Actuated Cycle Length (s) 92.6 Sum of lost time (s) 12.5Intersection Capacity Utilization 74.9% ICU Level of Service DAnalysis Period (min) 15c Critical Lane Group

HCM Unsignalized Intersection Capacity Analysis13: Depot Road & West Driveway 7/14/2017
Cumulative AM Synchro 8 ReportPage 13
Movement EBL EBT WBT WBR SBL SBRLane ConfigurationsVolume (veh/h) 30 520 500 80 20 20Sign Control Free Free StopGrade 0% 0% 0%Peak Hour Factor 0.91 0.91 0.91 0.91 0.91 0.91Hourly flow rate (vph) 33 571 549 88 22 22Pedestrians 2 29Lane Width (ft) 12.0 12.0Walking Speed (ft/s) 3.5 3.5Percent Blockage 0 3Right turn flare (veh)Median type None NoneMedian storage veh)Upstream signal (ft)pX, platoon unblockedvC, conflicting volume 666 976 622vC1, stage 1 conf volvC2, stage 2 conf volvCu, unblocked vol 666 976 622tC, single (s) 4.1 6.8 6.9tC, 2 stage (s)tF (s) 2.2 3.5 3.3p0 queue free % 96 91 95cM capacity (veh/h) 894 232 417
Direction, Lane # EB 1 EB 2 WB 1 SB 1Volume Total 223 381 637 44Volume Left 33 0 0 22Volume Right 0 0 88 22cSH 894 1700 1700 298Volume to Capacity 0.04 0.22 0.37 0.15Queue Length 95th (ft) 3 0 0 13Control Delay (s) 1.7 0.0 0.0 19.1Lane LOS A CApproach Delay (s) 0.6 0.0 19.1Approach LOS C
Intersection SummaryAverage Delay 0.9Intersection Capacity Utilization 46.8% ICU Level of Service AAnalysis Period (min) 15
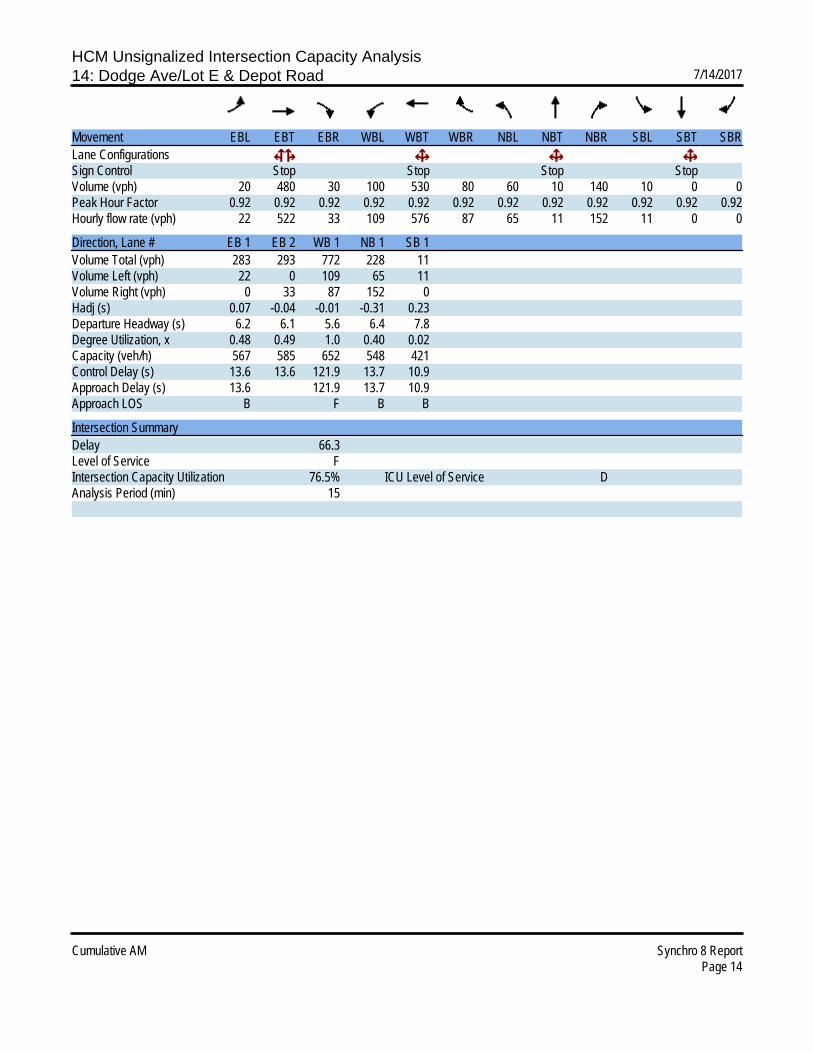
HCM Unsignalized Intersection Capacity Analysis14: Dodge Ave/Lot E & Depot Road 7/14/2017
Cumulative AM Synchro 8 ReportPage 14
Movement EBL EBT EBR WBL WBT WBR NBL NBT NBR SBL SBT SBRLane ConfigurationsSign Control Stop Stop Stop StopVolume (vph) 20 480 30 100 530 80 60 10 140 10 0 0Peak Hour Factor 0.92 0.92 0.92 0.92 0.92 0.92 0.92 0.92 0.92 0.92 0.92 0.92Hourly flow rate (vph) 22 522 33 109 576 87 65 11 152 11 0 0
Direction, Lane # EB 1 EB 2 WB 1 NB 1 SB 1Volume Total (vph) 283 293 772 228 11Volume Left (vph) 22 0 109 65 11Volume Right (vph) 0 33 87 152 0Hadj (s) 0.07 -0.04 -0.01 -0.31 0.23Departure Headway (s) 6.2 6.1 5.6 6.4 7.8Degree Utilization, x 0.48 0.49 1.0 0.40 0.02Capacity (veh/h) 567 585 652 548 421Control Delay (s) 13.6 13.6 121.9 13.7 10.9Approach Delay (s) 13.6 121.9 13.7 10.9Approach LOS B F B B
Intersection SummaryDelay 66.3Level of Service FIntersection Capacity Utilization 76.5% ICU Level of Service DAnalysis Period (min) 15

HCM Unsignalized Intersection Capacity Analysis15: Depot Road & Lot F 7/14/2017
Cumulative AM Synchro 8 ReportPage 15
Movement EBL EBT WBT WBR SBL SBRLane ConfigurationsVolume (veh/h) 30 600 600 30 10 120Sign Control Free Free StopGrade 0% 0% 0%Peak Hour Factor 0.92 0.92 0.92 0.92 0.92 0.92Hourly flow rate (vph) 33 652 652 33 11 130Pedestrians 9Lane Width (ft) 12.0Walking Speed (ft/s) 3.5Percent Blockage 1Right turn flare (veh)Median type None NoneMedian storage veh)Upstream signal (ft) 957pX, platoon unblocked 0.96 0.96 0.96vC, conflicting volume 694 1069 677vC1, stage 1 conf volvC2, stage 2 conf volvCu, unblocked vol 662 1052 645tC, single (s) 4.1 6.8 6.9tC, 2 stage (s)tF (s) 2.2 3.5 3.3p0 queue free % 96 95 67cM capacity (veh/h) 880 204 396
Direction, Lane # EB 1 EB 2 WB 1 SB 1Volume Total 250 435 685 141Volume Left 33 0 0 11Volume Right 0 0 33 130cSH 880 1700 1700 369Volume to Capacity 0.04 0.26 0.40 0.38Queue Length 95th (ft) 3 0 0 44Control Delay (s) 1.5 0.0 0.0 20.7Lane LOS A CApproach Delay (s) 0.6 0.0 20.7Approach LOS C
Intersection SummaryAverage Delay 2.2Intersection Capacity Utilization 53.4% ICU Level of Service AAnalysis Period (min) 15

HCM Unsignalized Intersection Capacity Analysis16: Depot Road & Lot G 7/14/2017
Cumulative AM Synchro 8 ReportPage 16
Movement EBL EBT WBT WBR SBL SBRLane ConfigurationsVolume (veh/h) 0 610 630 90 10 10Sign Control Free Free StopGrade 0% 0% 0%Peak Hour Factor 0.93 0.93 0.93 0.93 0.93 0.93Hourly flow rate (vph) 0 656 677 97 11 11Pedestrians 19 19 5Lane Width (ft) 12.0 12.0 12.0Walking Speed (ft/s) 3.5 3.5 3.5Percent Blockage 2 2 0Right turn flare (veh)Median type None NoneMedian storage veh)Upstream signal (ft) 529pX, platoon unblocked 0.92 0.92 0.92vC, conflicting volume 779 1029 701vC1, stage 1 conf volvC2, stage 2 conf volvCu, unblocked vol 716 988 632tC, single (s) 4.1 6.8 6.9tC, 2 stage (s)tF (s) 2.2 3.5 3.3p0 queue free % 100 95 97cM capacity (veh/h) 806 219 380
Direction, Lane # EB 1 EB 2 WB 1 WB 2 SB 1Volume Total 219 437 677 97 22Volume Left 0 0 0 0 11Volume Right 0 0 0 97 11cSH 806 1700 1700 1700 278Volume to Capacity 0.00 0.26 0.40 0.06 0.08Queue Length 95th (ft) 0 0 0 0 6Control Delay (s) 0.0 0.0 0.0 0.0 19.0Lane LOS CApproach Delay (s) 0.0 0.0 19.0Approach LOS C
Intersection SummaryAverage Delay 0.3Intersection Capacity Utilization 47.8% ICU Level of Service AAnalysis Period (min) 15

HCM Signalized Intersection Capacity Analysis1: Hesperian Blvd & Winton Ave 7/14/2017
Cumulative PM Synchro 8 ReportPage 1
Movement EBL EBT EBR WBL WBT WBR NBL NBT NBR SBL SBT SBRLane ConfigurationsVolume (vph) 760 1210 110 330 350 200 100 1770 350 300 800 320Ideal Flow (vphpl) 1900 1900 1900 1900 1900 1900 1900 1900 1900 1900 1900 1900Total Lost time (s) 4.0 4.0 4.0 4.0 4.0 4.0 4.0 4.0 4.0 4.0 2.5Lane Util. Factor 0.97 0.91 1.00 0.95 1.00 1.00 0.91 1.00 0.97 0.91 1.00Frpb, ped/bikes 1.00 1.00 1.00 1.00 0.98 1.00 1.00 0.98 1.00 1.00 0.99Flpb, ped/bikes 1.00 1.00 1.00 1.00 1.00 1.00 1.00 1.00 1.00 1.00 1.00Frt 1.00 0.99 1.00 1.00 0.85 1.00 1.00 0.85 1.00 1.00 0.85Flt Protected 0.95 1.00 0.95 1.00 1.00 0.95 1.00 1.00 0.95 1.00 1.00Satd. Flow (prot) 3433 5012 1770 3539 1551 1770 5085 1551 3433 5085 1562Flt Permitted 0.95 1.00 0.95 1.00 1.00 0.95 1.00 1.00 0.95 1.00 1.00Satd. Flow (perm) 3433 5012 1770 3539 1551 1770 5085 1551 3433 5085 1562Peak-hour factor, PHF 0.98 0.98 0.98 0.98 0.98 0.98 0.98 0.98 0.98 0.98 0.98 0.98Adj. Flow (vph) 776 1235 112 337 357 204 102 1806 357 306 816 327RTOR Reduction (vph) 0 8 0 0 0 66 0 0 81 0 0 0Lane Group Flow (vph) 776 1339 0 337 357 138 102 1806 276 306 816 327Confl. Peds. (#/hr) 6 10 10 6 4 7 7 4Turn Type Prot NA Prot NA Perm Prot NA Perm Prot NA FreeProtected Phases 3 8 7 4 5 2 1 6Permitted Phases 4 2 FreeActuated Green, G (s) 8.5 34.5 10.5 36.5 36.5 6.5 70.5 70.5 9.5 73.5 145.0Effective Green, g (s) 9.0 36.0 11.0 38.0 38.0 7.0 72.0 72.0 10.0 75.0 145.0Actuated g/C Ratio 0.06 0.25 0.08 0.26 0.26 0.05 0.50 0.50 0.07 0.52 1.00Clearance Time (s) 4.5 5.5 4.5 5.5 5.5 4.5 5.5 5.5 4.5 5.5Vehicle Extension (s) 3.0 3.0 3.0 3.0 3.0 3.0 3.0 3.0 3.0 3.0Lane Grp Cap (vph) 213 1244 134 927 406 85 2524 770 236 2630 1562v/s Ratio Prot c0.23 c0.27 0.19 0.10 0.06 c0.36 c0.09 0.16v/s Ratio Perm 0.09 0.18 c0.21v/c Ratio 3.64 1.08 2.51 0.39 0.34 1.20 0.72 0.36 1.30 0.31 0.21Uniform Delay, d1 68.0 54.5 67.0 43.9 43.3 69.0 28.5 22.4 67.5 20.1 0.0Progression Factor 1.00 1.00 1.00 1.00 1.00 1.00 1.00 1.00 1.00 1.00 1.00Incremental Delay, d2 1201.0 48.9 703.3 0.3 0.5 161.0 1.8 1.3 161.1 0.3 0.3Delay (s) 1269.0 103.4 770.3 44.2 43.9 230.0 30.3 23.7 228.6 20.4 0.3Level of Service F F F D D F C C F C AApproach Delay (s) 529.4 316.6 38.2 59.9Approach LOS F F D E
Intersection SummaryHCM 2000 Control Delay 234.8 HCM 2000 Level of Service FHCM 2000 Volume to Capacity ratio 1.05Actuated Cycle Length (s) 145.0 Sum of lost time (s) 16.0Intersection Capacity Utilization 101.0% ICU Level of Service GAnalysis Period (min) 15c Critical Lane Group

HCM Signalized Intersection Capacity Analysis2: Hesperian Blvd & Southland Drive 7/14/2017
Cumulative PM Synchro 8 ReportPage 2
Movement EBL EBT EBR WBL WBT WBR NBL NBT NBR SBL SBT SBRLane ConfigurationsVolume (vph) 280 480 110 120 120 140 90 1850 180 180 850 180Ideal Flow (vphpl) 1900 1900 1900 1900 1900 1900 1900 1900 1900 1900 1900 1900Total Lost time (s) 4.0 4.0 4.0 4.0 4.0 4.0 4.0 4.0Lane Util. Factor 1.00 0.95 1.00 0.91 1.00 0.91 1.00 0.91Frpb, ped/bikes 1.00 0.99 1.00 0.99 1.00 1.00 1.00 1.00Flpb, ped/bikes 1.00 1.00 0.99 1.00 1.00 1.00 1.00 1.00Frt 1.00 0.97 1.00 0.92 1.00 0.99 1.00 0.97Flt Protected 0.95 1.00 0.95 1.00 0.95 1.00 0.95 1.00Satd. Flow (prot) 1767 3422 1760 4638 1770 5012 1770 4937Flt Permitted 0.57 1.00 0.26 1.00 0.95 1.00 0.95 1.00Satd. Flow (perm) 1054 3422 482 4638 1770 5012 1770 4937Peak-hour factor, PHF 0.94 0.94 0.94 0.94 0.94 0.94 0.94 0.94 0.94 0.94 0.94 0.94Adj. Flow (vph) 298 511 117 128 128 149 96 1968 191 191 904 191RTOR Reduction (vph) 0 18 0 0 102 0 0 10 0 0 28 0Lane Group Flow (vph) 298 610 0 128 175 0 96 2149 0 191 1067 0Confl. Peds. (#/hr) 2 16 16 2 4 1 1 4Confl. Bikes (#/hr) 1 1Turn Type Perm NA Perm NA Prot NA Prot NAProtected Phases 8 4 1 6 5 2Permitted Phases 8 4Actuated Green, G (s) 34.8 34.8 34.8 34.8 9.3 50.4 12.2 53.3Effective Green, g (s) 34.8 34.8 34.8 34.8 9.3 51.0 12.2 53.9Actuated g/C Ratio 0.32 0.32 0.32 0.32 0.08 0.46 0.11 0.49Clearance Time (s) 4.0 4.0 4.0 4.0 4.0 4.6 4.0 4.6Vehicle Extension (s) 3.0 3.0 3.0 3.0 3.0 3.0 3.0 3.0Lane Grp Cap (vph) 333 1082 152 1467 149 2323 196 2419v/s Ratio Prot 0.18 0.04 0.05 c0.43 c0.11 c0.22v/s Ratio Perm c0.28 0.27v/c Ratio 0.89 0.56 0.84 0.12 0.64 0.93 0.97 0.44Uniform Delay, d1 35.9 31.3 35.0 26.7 48.7 27.7 48.7 18.2Progression Factor 1.00 1.00 1.00 1.00 0.72 1.56 1.00 1.00Incremental Delay, d2 24.9 0.7 32.3 0.0 6.4 5.6 56.4 0.6Delay (s) 60.7 32.0 67.3 26.8 41.8 48.9 105.2 18.8Level of Service E C E C D D F BApproach Delay (s) 41.2 39.6 48.6 31.7Approach LOS D D D C
Intersection SummaryHCM 2000 Control Delay 42.0 HCM 2000 Level of Service DHCM 2000 Volume to Capacity ratio 0.91Actuated Cycle Length (s) 110.0 Sum of lost time (s) 12.0Intersection Capacity Utilization 91.3% ICU Level of Service FAnalysis Period (min) 15c Critical Lane Group

HCM Signalized Intersection Capacity Analysis3: Hesperian Blvd & Turner Court 7/14/2017
Cumulative PM Synchro 8 ReportPage 3
Movement EBL EBT EBR WBL WBT WBR NBL NBT NBR SBL SBT SBRLane ConfigurationsVolume (vph) 150 30 90 70 20 80 100 2050 90 110 1000 120Ideal Flow (vphpl) 1900 1900 1900 1900 1900 1900 1900 1900 1900 1900 1900 1900Total Lost time (s) 4.0 4.0 4.0 4.6 4.0 4.0 4.0 4.0Lane Util. Factor 1.00 1.00 1.00 1.00 1.00 0.91 1.00 0.91Frpb, ped/bikes 1.00 0.96 1.00 0.99 1.00 1.00 1.00 1.00Flpb, ped/bikes 1.00 1.00 0.97 1.00 1.00 1.00 1.00 1.00Frt 1.00 0.89 1.00 0.85 1.00 0.99 1.00 0.98Flt Protected 0.95 1.00 0.96 1.00 0.95 1.00 0.95 1.00Satd. Flow (prot) 1768 1588 1747 1562 1770 5041 1770 4980Flt Permitted 0.66 1.00 0.63 1.00 0.95 1.00 0.95 1.00Satd. Flow (perm) 1233 1588 1150 1562 1770 5041 1770 4980Peak-hour factor, PHF 0.94 0.94 0.94 0.94 0.94 0.94 0.94 0.94 0.94 0.94 0.94 0.94Adj. Flow (vph) 160 32 96 74 21 85 106 2181 96 117 1064 128RTOR Reduction (vph) 0 78 0 0 0 69 0 3 0 0 9 0Lane Group Flow (vph) 160 50 0 0 95 16 106 2274 0 117 1183 0Confl. Peds. (#/hr) 1 40 40 1 10 19 19 10Turn Type Perm NA Perm NA Perm Prot NA Prot NAProtected Phases 4 8 1 6 5 2Permitted Phases 4 8 8Actuated Green, G (s) 20.1 20.1 20.1 20.1 11.9 65.1 11.6 64.8Effective Green, g (s) 20.7 20.7 20.7 20.1 11.9 65.7 11.6 65.4Actuated g/C Ratio 0.19 0.19 0.19 0.18 0.11 0.60 0.11 0.59Clearance Time (s) 4.6 4.6 4.6 4.6 4.0 4.6 4.0 4.6Vehicle Extension (s) 3.0 3.0 3.0 3.0 3.0 3.0 3.0 3.0Lane Grp Cap (vph) 232 298 216 285 191 3010 186 2960v/s Ratio Prot 0.03 0.06 c0.45 c0.07 0.24v/s Ratio Perm c0.13 0.08 0.01v/c Ratio 0.69 0.17 0.44 0.05 0.55 0.76 0.63 0.40Uniform Delay, d1 41.7 37.4 39.5 37.1 46.5 16.3 47.1 11.9Progression Factor 1.00 1.00 1.00 1.00 1.00 1.00 0.91 1.30Incremental Delay, d2 8.3 0.3 1.4 0.1 3.5 1.8 6.0 0.4Delay (s) 49.9 37.7 40.9 37.2 50.0 18.1 48.9 15.8Level of Service D D D D D B D BApproach Delay (s) 44.5 39.2 19.5 18.7Approach LOS D D B B
Intersection SummaryHCM 2000 Control Delay 21.8 HCM 2000 Level of Service CHCM 2000 Volume to Capacity ratio 0.73Actuated Cycle Length (s) 110.0 Sum of lost time (s) 12.0Intersection Capacity Utilization 81.4% ICU Level of Service DAnalysis Period (min) 15c Critical Lane Group
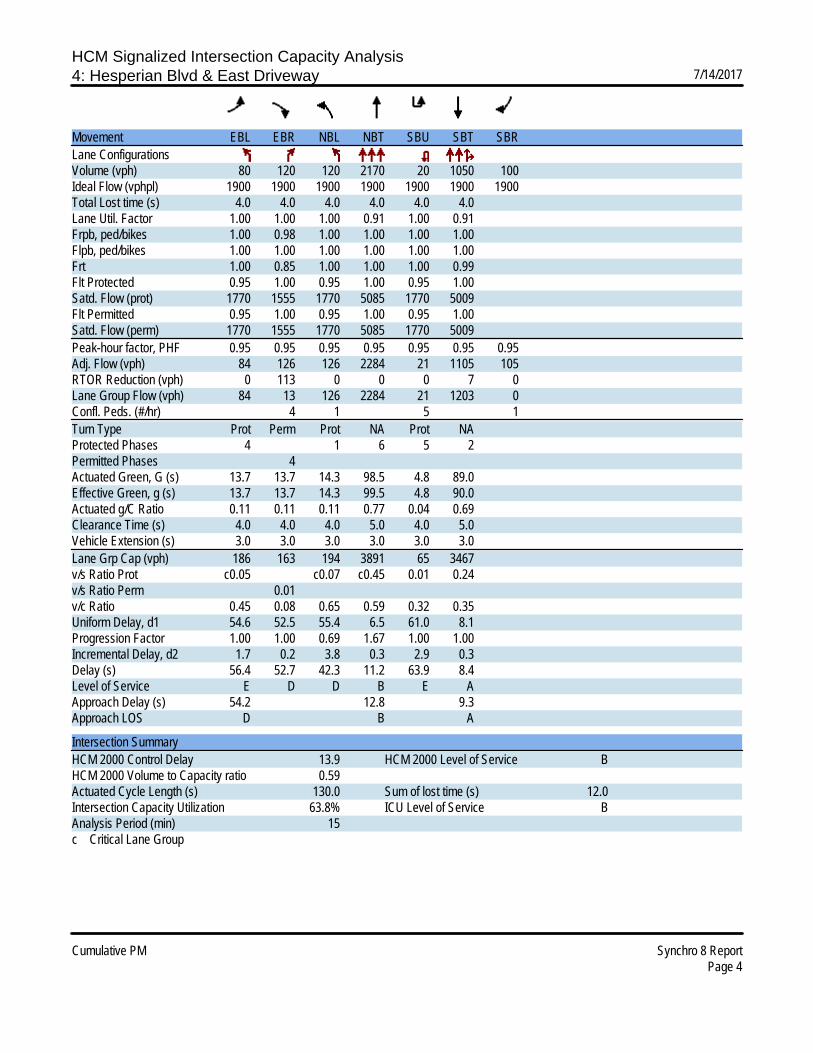
HCM Signalized Intersection Capacity Analysis4: Hesperian Blvd & East Driveway 7/14/2017
Cumulative PM Synchro 8 ReportPage 4
Movement EBL EBR NBL NBT SBU SBT SBRLane ConfigurationsVolume (vph) 80 120 120 2170 20 1050 100Ideal Flow (vphpl) 1900 1900 1900 1900 1900 1900 1900Total Lost time (s) 4.0 4.0 4.0 4.0 4.0 4.0Lane Util. Factor 1.00 1.00 1.00 0.91 1.00 0.91Frpb, ped/bikes 1.00 0.98 1.00 1.00 1.00 1.00Flpb, ped/bikes 1.00 1.00 1.00 1.00 1.00 1.00Frt 1.00 0.85 1.00 1.00 1.00 0.99Flt Protected 0.95 1.00 0.95 1.00 0.95 1.00Satd. Flow (prot) 1770 1555 1770 5085 1770 5009Flt Permitted 0.95 1.00 0.95 1.00 0.95 1.00Satd. Flow (perm) 1770 1555 1770 5085 1770 5009Peak-hour factor, PHF 0.95 0.95 0.95 0.95 0.95 0.95 0.95Adj. Flow (vph) 84 126 126 2284 21 1105 105RTOR Reduction (vph) 0 113 0 0 0 7 0Lane Group Flow (vph) 84 13 126 2284 21 1203 0Confl. Peds. (#/hr) 4 1 5 1Turn Type Prot Perm Prot NA Prot NAProtected Phases 4 1 6 5 2Permitted Phases 4Actuated Green, G (s) 13.7 13.7 14.3 98.5 4.8 89.0Effective Green, g (s) 13.7 13.7 14.3 99.5 4.8 90.0Actuated g/C Ratio 0.11 0.11 0.11 0.77 0.04 0.69Clearance Time (s) 4.0 4.0 4.0 5.0 4.0 5.0Vehicle Extension (s) 3.0 3.0 3.0 3.0 3.0 3.0Lane Grp Cap (vph) 186 163 194 3891 65 3467v/s Ratio Prot c0.05 c0.07 c0.45 0.01 0.24v/s Ratio Perm 0.01v/c Ratio 0.45 0.08 0.65 0.59 0.32 0.35Uniform Delay, d1 54.6 52.5 55.4 6.5 61.0 8.1Progression Factor 1.00 1.00 0.69 1.67 1.00 1.00Incremental Delay, d2 1.7 0.2 3.8 0.3 2.9 0.3Delay (s) 56.4 52.7 42.3 11.2 63.9 8.4Level of Service E D D B E AApproach Delay (s) 54.2 12.8 9.3Approach LOS D B A
Intersection SummaryHCM 2000 Control Delay 13.9 HCM 2000 Level of Service BHCM 2000 Volume to Capacity ratio 0.59Actuated Cycle Length (s) 130.0 Sum of lost time (s) 12.0Intersection Capacity Utilization 63.8% ICU Level of Service BAnalysis Period (min) 15c Critical Lane Group

HCM Signalized Intersection Capacity Analysis5: Hesperian Blvd & Depot Road 7/14/2017
Cumulative PM Synchro 8 ReportPage 5
Movement EBL EBT EBR WBL WBT WBR NBL NBT NBR SBL SBT SBRLane ConfigurationsVolume (vph) 250 200 300 110 100 110 260 1900 240 50 1000 90Ideal Flow (vphpl) 1900 1900 1900 1900 1900 1900 1900 1900 1900 1900 1900 1900Total Lost time (s) 4.0 4.0 4.0 4.0 4.0 4.0 4.0 4.0 4.0Lane Util. Factor 0.95 0.95 1.00 1.00 1.00 1.00 0.91 1.00 0.91Frpb, ped/bikes 1.00 1.00 0.96 1.00 0.99 1.00 1.00 1.00 1.00Flpb, ped/bikes 1.00 1.00 1.00 1.00 1.00 1.00 1.00 1.00 1.00Frt 1.00 1.00 0.85 1.00 0.92 1.00 0.98 1.00 0.99Flt Protected 0.95 0.99 1.00 0.95 1.00 0.95 1.00 0.95 1.00Satd. Flow (prot) 1681 1747 1522 1770 1700 1770 4980 1770 5005Flt Permitted 0.95 0.99 1.00 0.95 1.00 0.95 1.00 0.95 1.00Satd. Flow (perm) 1681 1747 1522 1770 1700 1770 4980 1770 5005Peak-hour factor, PHF 0.95 0.95 0.95 0.95 0.95 0.95 0.95 0.95 0.95 0.95 0.95 0.95Adj. Flow (vph) 263 211 316 116 105 116 274 2000 253 53 1053 95RTOR Reduction (vph) 0 0 254 0 31 0 0 11 0 0 7 0Lane Group Flow (vph) 189 285 62 116 190 0 274 2242 0 53 1141 0Confl. Peds. (#/hr) 2 19 19 2 17 5 5 17Confl. Bikes (#/hr) 1 1Turn Type Split NA Perm Split NA Prot NA Prot NAProtected Phases 4 4 3 3 5 2 1 6Permitted Phases 4Actuated Green, G (s) 25.5 25.5 25.5 17.0 17.0 25.4 64.5 6.4 45.5Effective Green, g (s) 25.5 25.5 25.5 17.0 17.0 25.4 65.1 6.4 46.1Actuated g/C Ratio 0.20 0.20 0.20 0.13 0.13 0.20 0.50 0.05 0.35Clearance Time (s) 4.0 4.0 4.0 4.0 4.0 4.0 4.6 4.0 4.6Vehicle Extension (s) 3.0 3.0 3.0 3.0 3.0 3.0 3.0 3.0 3.0Lane Grp Cap (vph) 329 342 298 231 222 345 2493 87 1774v/s Ratio Prot 0.11 c0.16 0.07 c0.11 c0.15 c0.45 0.03 0.23v/s Ratio Perm 0.04v/c Ratio 0.57 0.83 0.21 0.50 0.85 0.79 0.90 0.61 0.64Uniform Delay, d1 47.3 50.2 43.8 52.6 55.3 49.8 29.5 60.6 35.1Progression Factor 1.00 1.00 1.00 1.00 1.00 1.00 1.00 0.87 0.98Incremental Delay, d2 2.4 15.8 0.3 1.7 25.9 11.9 5.7 11.0 1.7Delay (s) 49.8 66.0 44.1 54.3 81.2 61.7 35.2 63.5 36.2Level of Service D E D D F E D E DApproach Delay (s) 53.4 71.9 38.1 37.4Approach LOS D E D D
Intersection SummaryHCM 2000 Control Delay 42.7 HCM 2000 Level of Service DHCM 2000 Volume to Capacity ratio 0.88Actuated Cycle Length (s) 130.0 Sum of lost time (s) 16.0Intersection Capacity Utilization 89.1% ICU Level of Service EAnalysis Period (min) 15c Critical Lane Group

HCM Signalized Intersection Capacity Analysis6: Hesperian Blvd & WB Ramp SR-92 7/14/2017
Cumulative PM Synchro 8 ReportPage 6
Movement EBL EBR NBL NBT SBT SBRLane ConfigurationsVolume (vph) 330 460 220 2120 1280 150Ideal Flow (vphpl) 1900 1900 1900 1900 1900 1900Total Lost time (s) 3.7 3.7 3.7 4.1 4.1Lane Util. Factor 0.97 1.00 1.00 0.91 0.91Frpb, ped/bikes 1.00 1.00 1.00 1.00 1.00Flpb, ped/bikes 1.00 1.00 1.00 1.00 1.00Frt 1.00 0.85 1.00 1.00 0.98Flt Protected 0.95 1.00 0.95 1.00 1.00Satd. Flow (prot) 3433 1583 1770 5085 4986Flt Permitted 0.95 1.00 0.95 1.00 1.00Satd. Flow (perm) 3433 1583 1770 5085 4986Peak-hour factor, PHF 0.97 0.97 0.97 0.97 0.97 0.97Adj. Flow (vph) 340 474 227 2186 1320 155RTOR Reduction (vph) 0 258 0 0 15 0Lane Group Flow (vph) 340 216 227 2186 1460 0Confl. Peds. (#/hr) 13 13Turn Type Perm Perm Prot NA NAProtected Phases 5 2 6Permitted Phases 4 4Actuated Green, G (s) 14.9 14.9 14.7 66.3 47.4Effective Green, g (s) 15.4 15.4 15.2 66.8 47.9Actuated g/C Ratio 0.17 0.17 0.17 0.74 0.53Clearance Time (s) 4.2 4.2 4.2 4.6 4.6Vehicle Extension (s) 3.0 3.0 3.0 3.0 3.0Lane Grp Cap (vph) 587 270 298 3774 2653v/s Ratio Prot c0.13 c0.43 0.29v/s Ratio Perm 0.10 c0.14v/c Ratio 0.58 0.80 0.76 0.58 0.55Uniform Delay, d1 34.3 35.8 35.7 5.2 13.9Progression Factor 1.00 1.00 0.84 1.51 1.00Incremental Delay, d2 1.4 15.5 1.1 0.1 0.8Delay (s) 35.7 51.4 31.1 8.0 14.8Level of Service D D C A BApproach Delay (s) 44.8 10.2 14.8Approach LOS D B B
Intersection SummaryHCM 2000 Control Delay 17.6 HCM 2000 Level of Service BHCM 2000 Volume to Capacity ratio 0.68Actuated Cycle Length (s) 90.0 Sum of lost time (s) 12.0Intersection Capacity Utilization 63.6% ICU Level of Service BAnalysis Period (min) 15c Critical Lane Group

HCM Signalized Intersection Capacity Analysis7: Hesperian Blvd & EB Ramp SR-92 7/14/2017
Cumulative PM Synchro 8 ReportPage 7
Movement EBL EBT EBR WBL WBT WBR NBL NBT NBR SBL SBT SBRLane ConfigurationsVolume (vph) 440 10 130 0 0 0 0 1920 450 350 1410 0Ideal Flow (vphpl) 1900 1900 1900 1900 1900 1900 1900 1900 1900 1900 1900 1900Total Lost time (s) 3.7 3.7 4.1 4.1 3.7 4.1Lane Util. Factor 1.00 0.88 0.95 1.00 1.00 0.91Frpb, ped/bikes 1.00 1.00 1.00 0.98 1.00 1.00Flpb, ped/bikes 1.00 1.00 1.00 1.00 1.00 1.00Frt 1.00 0.85 1.00 0.85 1.00 1.00Flt Protected 0.95 1.00 1.00 1.00 0.95 1.00Satd. Flow (prot) 1776 2787 3539 1551 1770 5085Flt Permitted 0.95 1.00 1.00 1.00 0.95 1.00Satd. Flow (perm) 1776 2787 3539 1551 1770 5085Peak-hour factor, PHF 0.92 0.92 0.92 0.92 0.92 0.92 0.92 0.92 0.92 0.92 0.92 0.92Adj. Flow (vph) 478 11 141 0 0 0 0 2087 489 380 1533 0RTOR Reduction (vph) 0 0 70 0 0 0 0 0 104 0 0 0Lane Group Flow (vph) 0 489 71 0 0 0 0 2087 385 380 1533 0Confl. Peds. (#/hr) 16 6 6Turn Type Perm NA Perm NA Perm Prot NAProtected Phases 4 2 1 6Permitted Phases 4 4 2Actuated Green, G (s) 20.8 20.8 39.4 39.4 16.8 60.4Effective Green, g (s) 21.3 21.3 39.9 39.9 17.3 60.9Actuated g/C Ratio 0.24 0.24 0.44 0.44 0.19 0.68Clearance Time (s) 4.2 4.2 4.6 4.6 4.2 4.6Vehicle Extension (s) 3.0 3.0 3.0 3.0 3.0 3.0Lane Grp Cap (vph) 420 659 1568 687 340 3440v/s Ratio Prot c0.59 c0.21 0.30v/s Ratio Perm 0.28 0.03 0.25v/c Ratio 1.16 0.11 1.33 0.56 1.12 0.45Uniform Delay, d1 34.4 26.9 25.1 18.6 36.4 6.7Progression Factor 1.00 1.00 1.00 1.00 1.27 0.72Incremental Delay, d2 97.1 0.1 153.4 3.3 79.9 0.3Delay (s) 131.4 27.0 178.5 21.8 125.9 5.2Level of Service F C F C F AApproach Delay (s) 108.0 0.0 148.7 29.2Approach LOS F A F C
Intersection SummaryHCM 2000 Control Delay 99.0 HCM 2000 Level of Service FHCM 2000 Volume to Capacity ratio 1.24Actuated Cycle Length (s) 90.0 Sum of lost time (s) 11.5Intersection Capacity Utilization 107.4% ICU Level of Service GAnalysis Period (min) 15c Critical Lane Group

HCM Signalized Intersection Capacity Analysis8: Hesperian Blvd & Sleepy Hollow Ave 7/14/2017
Cumulative PM Synchro 8 ReportPage 8
Movement EBL EBT EBR WBL WBT WBR NBL NBT NBR SBL SBT SBRLane ConfigurationsVolume (vph) 130 50 60 20 40 130 40 2090 50 140 1240 140Ideal Flow (vphpl) 1900 1900 1900 1900 1900 1900 1900 1900 1900 1900 1900 1900Total Lost time (s) 4.0 4.0 4.0 4.0 4.0 4.0 4.0 4.0 4.0 4.0Lane Util. Factor 1.00 1.00 1.00 1.00 1.00 1.00 1.00 0.91 1.00 0.91Frpb, ped/bikes 1.00 1.00 0.97 1.00 1.00 0.98 1.00 1.00 1.00 1.00Flpb, ped/bikes 0.99 1.00 1.00 0.98 1.00 1.00 1.00 1.00 1.00 1.00Frt 1.00 1.00 0.85 1.00 1.00 0.85 1.00 1.00 1.00 0.98Flt Protected 0.95 1.00 1.00 0.95 1.00 1.00 0.95 1.00 0.95 1.00Satd. Flow (prot) 1753 1863 1534 1740 1863 1549 1770 5064 1770 4992Flt Permitted 0.73 1.00 1.00 0.72 1.00 1.00 0.95 1.00 0.95 1.00Satd. Flow (perm) 1345 1863 1534 1322 1863 1549 1770 5064 1770 4992Peak-hour factor, PHF 0.92 0.92 0.92 0.92 0.92 0.92 0.92 0.92 0.92 0.92 0.92 0.92Adj. Flow (vph) 141 54 65 22 43 141 43 2272 54 152 1348 152RTOR Reduction (vph) 0 0 54 0 0 118 0 2 0 0 7 0Lane Group Flow (vph) 141 54 11 22 43 23 43 2324 0 152 1493 0Confl. Peds. (#/hr) 8 15 15 8 5 4 4 5Confl. Bikes (#/hr) 1 2Turn Type Perm NA Perm Perm NA Perm Prot NA Prot NAProtected Phases 8 4 5 2 1 6Permitted Phases 8 8 4 4Actuated Green, G (s) 20.1 20.1 20.1 20.1 20.1 20.1 7.4 79.5 16.4 88.5Effective Green, g (s) 21.1 21.1 21.1 21.1 21.1 21.1 7.4 80.5 16.4 89.5Actuated g/C Ratio 0.16 0.16 0.16 0.16 0.16 0.16 0.06 0.62 0.13 0.69Clearance Time (s) 5.0 5.0 5.0 5.0 5.0 5.0 4.0 5.0 4.0 5.0Vehicle Extension (s) 3.0 3.0 3.0 3.0 3.0 3.0 3.0 3.0 3.0 3.0Lane Grp Cap (vph) 218 302 248 214 302 251 100 3135 223 3436v/s Ratio Prot 0.03 0.02 0.02 c0.46 c0.09 0.30v/s Ratio Perm c0.10 0.01 0.02 0.01v/c Ratio 0.65 0.18 0.04 0.10 0.14 0.09 0.43 0.74 0.68 0.43Uniform Delay, d1 51.0 47.0 45.9 46.4 46.7 46.3 59.3 17.4 54.3 9.0Progression Factor 1.00 1.00 1.00 1.00 1.00 1.00 0.59 2.50 1.00 1.00Incremental Delay, d2 6.5 0.3 0.1 0.2 0.2 0.2 0.3 0.1 8.3 0.4Delay (s) 57.4 47.3 46.0 46.6 46.9 46.5 35.4 43.8 62.6 9.4Level of Service E D D D D D D D E AApproach Delay (s) 52.5 46.6 43.6 14.3Approach LOS D D D B
Intersection SummaryHCM 2000 Control Delay 33.5 HCM 2000 Level of Service CHCM 2000 Volume to Capacity ratio 0.72Actuated Cycle Length (s) 130.0 Sum of lost time (s) 12.0Intersection Capacity Utilization 78.2% ICU Level of Service DAnalysis Period (min) 15c Critical Lane Group
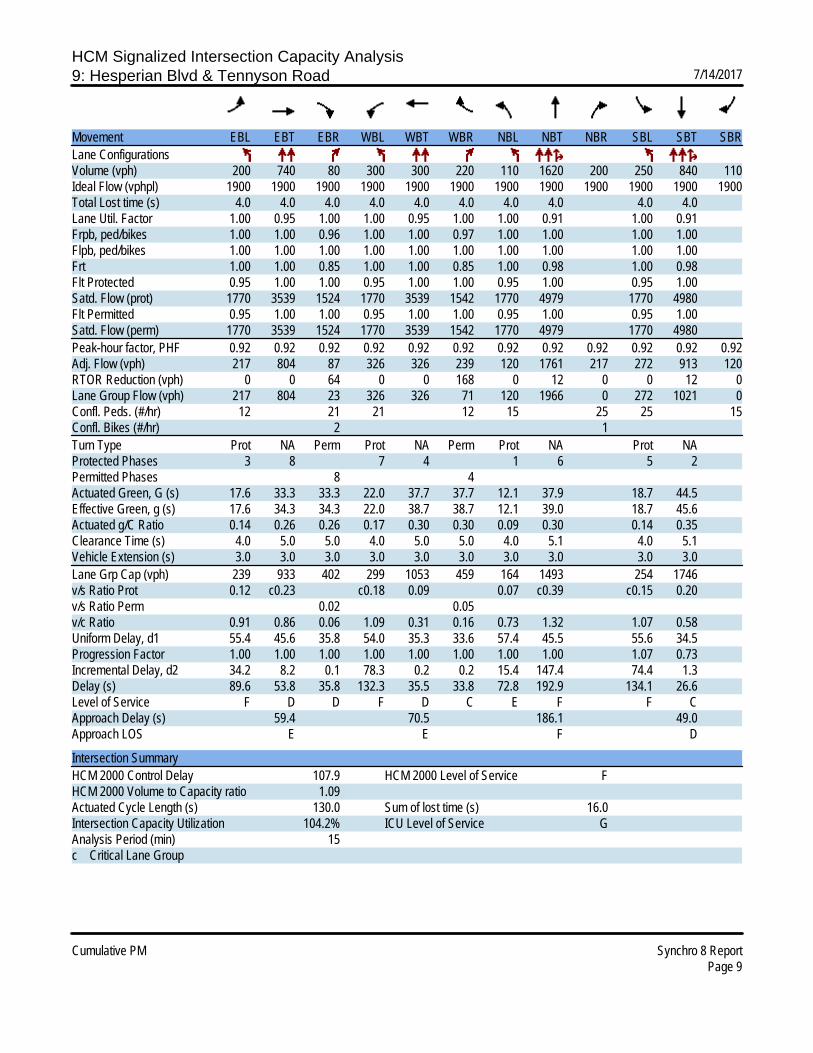
HCM Signalized Intersection Capacity Analysis9: Hesperian Blvd & Tennyson Road 7/14/2017
Cumulative PM Synchro 8 ReportPage 9
Movement EBL EBT EBR WBL WBT WBR NBL NBT NBR SBL SBT SBRLane ConfigurationsVolume (vph) 200 740 80 300 300 220 110 1620 200 250 840 110Ideal Flow (vphpl) 1900 1900 1900 1900 1900 1900 1900 1900 1900 1900 1900 1900Total Lost time (s) 4.0 4.0 4.0 4.0 4.0 4.0 4.0 4.0 4.0 4.0Lane Util. Factor 1.00 0.95 1.00 1.00 0.95 1.00 1.00 0.91 1.00 0.91Frpb, ped/bikes 1.00 1.00 0.96 1.00 1.00 0.97 1.00 1.00 1.00 1.00Flpb, ped/bikes 1.00 1.00 1.00 1.00 1.00 1.00 1.00 1.00 1.00 1.00Frt 1.00 1.00 0.85 1.00 1.00 0.85 1.00 0.98 1.00 0.98Flt Protected 0.95 1.00 1.00 0.95 1.00 1.00 0.95 1.00 0.95 1.00Satd. Flow (prot) 1770 3539 1524 1770 3539 1542 1770 4979 1770 4980Flt Permitted 0.95 1.00 1.00 0.95 1.00 1.00 0.95 1.00 0.95 1.00Satd. Flow (perm) 1770 3539 1524 1770 3539 1542 1770 4979 1770 4980Peak-hour factor, PHF 0.92 0.92 0.92 0.92 0.92 0.92 0.92 0.92 0.92 0.92 0.92 0.92Adj. Flow (vph) 217 804 87 326 326 239 120 1761 217 272 913 120RTOR Reduction (vph) 0 0 64 0 0 168 0 12 0 0 12 0Lane Group Flow (vph) 217 804 23 326 326 71 120 1966 0 272 1021 0Confl. Peds. (#/hr) 12 21 21 12 15 25 25 15Confl. Bikes (#/hr) 2 1Turn Type Prot NA Perm Prot NA Perm Prot NA Prot NAProtected Phases 3 8 7 4 1 6 5 2Permitted Phases 8 4Actuated Green, G (s) 17.6 33.3 33.3 22.0 37.7 37.7 12.1 37.9 18.7 44.5Effective Green, g (s) 17.6 34.3 34.3 22.0 38.7 38.7 12.1 39.0 18.7 45.6Actuated g/C Ratio 0.14 0.26 0.26 0.17 0.30 0.30 0.09 0.30 0.14 0.35Clearance Time (s) 4.0 5.0 5.0 4.0 5.0 5.0 4.0 5.1 4.0 5.1Vehicle Extension (s) 3.0 3.0 3.0 3.0 3.0 3.0 3.0 3.0 3.0 3.0Lane Grp Cap (vph) 239 933 402 299 1053 459 164 1493 254 1746v/s Ratio Prot 0.12 c0.23 c0.18 0.09 0.07 c0.39 c0.15 0.20v/s Ratio Perm 0.02 0.05v/c Ratio 0.91 0.86 0.06 1.09 0.31 0.16 0.73 1.32 1.07 0.58Uniform Delay, d1 55.4 45.6 35.8 54.0 35.3 33.6 57.4 45.5 55.6 34.5Progression Factor 1.00 1.00 1.00 1.00 1.00 1.00 1.00 1.00 1.07 0.73Incremental Delay, d2 34.2 8.2 0.1 78.3 0.2 0.2 15.4 147.4 74.4 1.3Delay (s) 89.6 53.8 35.8 132.3 35.5 33.8 72.8 192.9 134.1 26.6Level of Service F D D F D C E F F CApproach Delay (s) 59.4 70.5 186.1 49.0Approach LOS E E F D
Intersection SummaryHCM 2000 Control Delay 107.9 HCM 2000 Level of Service FHCM 2000 Volume to Capacity ratio 1.09Actuated Cycle Length (s) 130.0 Sum of lost time (s) 16.0Intersection Capacity Utilization 104.2% ICU Level of Service GAnalysis Period (min) 15c Critical Lane Group

HCM Signalized Intersection Capacity Analysis10: Industrial Blvd & EB Ramp SR-92 7/14/2017
Cumulative PM Synchro 8 ReportPage 10
Movement EBL EBT EBR WBL WBT WBR NBL NBT NBR SBL SBT SBRLane ConfigurationsVolume (vph) 240 90 980 10 30 50 100 990 80 90 1070 250Ideal Flow (vphpl) 1900 1900 1900 1900 1900 1900 1900 1900 1900 1900 1900 1900Total Lost time (s) 4.2 4.2 4.2 4.2 3.2 3.6 3.6 3.2 3.6 3.6Lane Util. Factor 1.00 1.00 1.00 1.00 1.00 0.95 1.00 1.00 0.95 1.00Frpb, ped/bikes 1.00 1.00 1.00 1.00 1.00 1.00 0.97 1.00 1.00 0.97Flpb, ped/bikes 1.00 1.00 1.00 1.00 1.00 1.00 1.00 1.00 1.00 1.00Frt 1.00 0.85 1.00 0.85 1.00 1.00 0.85 1.00 1.00 0.85Flt Protected 0.96 1.00 0.99 1.00 0.95 1.00 1.00 0.95 1.00 1.00Satd. Flow (prot) 1797 1583 1840 1583 1770 3539 1534 1770 3539 1532Flt Permitted 0.76 1.00 0.89 1.00 0.95 1.00 1.00 0.95 1.00 1.00Satd. Flow (perm) 1410 1583 1665 1583 1770 3539 1534 1770 3539 1532Peak-hour factor, PHF 0.91 0.91 0.91 0.91 0.91 0.91 0.91 0.91 0.91 0.91 0.91 0.91Adj. Flow (vph) 264 99 1077 11 33 55 110 1088 88 99 1176 275RTOR Reduction (vph) 0 0 194 0 0 40 0 0 45 0 0 145Lane Group Flow (vph) 0 363 883 0 44 15 110 1088 43 99 1176 130Confl. Peds. (#/hr) 6 6 6 6Confl. Bikes (#/hr) 1Turn Type Perm NA Perm Perm NA Perm Prot NA Perm Prot NA PermProtected Phases 8 4 1 6 5 2Permitted Phases 8 8 4 4 6 2Actuated Green, G (s) 18.0 18.0 18.0 18.0 6.8 32.3 32.3 7.2 32.7 32.7Effective Green, g (s) 18.5 18.5 18.5 18.5 7.3 32.8 32.8 7.7 33.2 33.2Actuated g/C Ratio 0.26 0.26 0.26 0.26 0.10 0.47 0.47 0.11 0.47 0.47Clearance Time (s) 4.7 4.7 4.7 4.7 3.7 4.1 4.1 3.7 4.1 4.1Vehicle Extension (s) 3.0 3.0 3.0 3.0 3.0 3.0 3.0 3.0 3.0 3.0Lane Grp Cap (vph) 372 418 440 418 184 1658 718 194 1678 726v/s Ratio Prot c0.06 0.31 0.06 c0.33v/s Ratio Perm 0.26 c0.56 0.03 0.01 0.03 0.09v/c Ratio 0.98 2.11 0.10 0.03 0.60 0.66 0.06 0.51 0.70 0.18Uniform Delay, d1 25.5 25.8 19.5 19.1 29.9 14.3 10.2 29.4 14.5 10.6Progression Factor 1.00 1.00 1.00 1.00 1.00 1.00 1.00 0.71 2.01 7.27Incremental Delay, d2 39.9 508.4 0.1 0.0 5.1 2.0 0.2 0.7 0.8 0.2Delay (s) 65.4 534.2 19.6 19.2 35.1 16.3 10.3 21.5 29.9 77.0Level of Service E F B B D B B C C EApproach Delay (s) 416.0 19.3 17.5 37.7Approach LOS F B B D
Intersection SummaryHCM 2000 Control Delay 155.9 HCM 2000 Level of Service FHCM 2000 Volume to Capacity ratio 1.13Actuated Cycle Length (s) 70.0 Sum of lost time (s) 11.0Intersection Capacity Utilization 108.9% ICU Level of Service GAnalysis Period (min) 15c Critical Lane Group
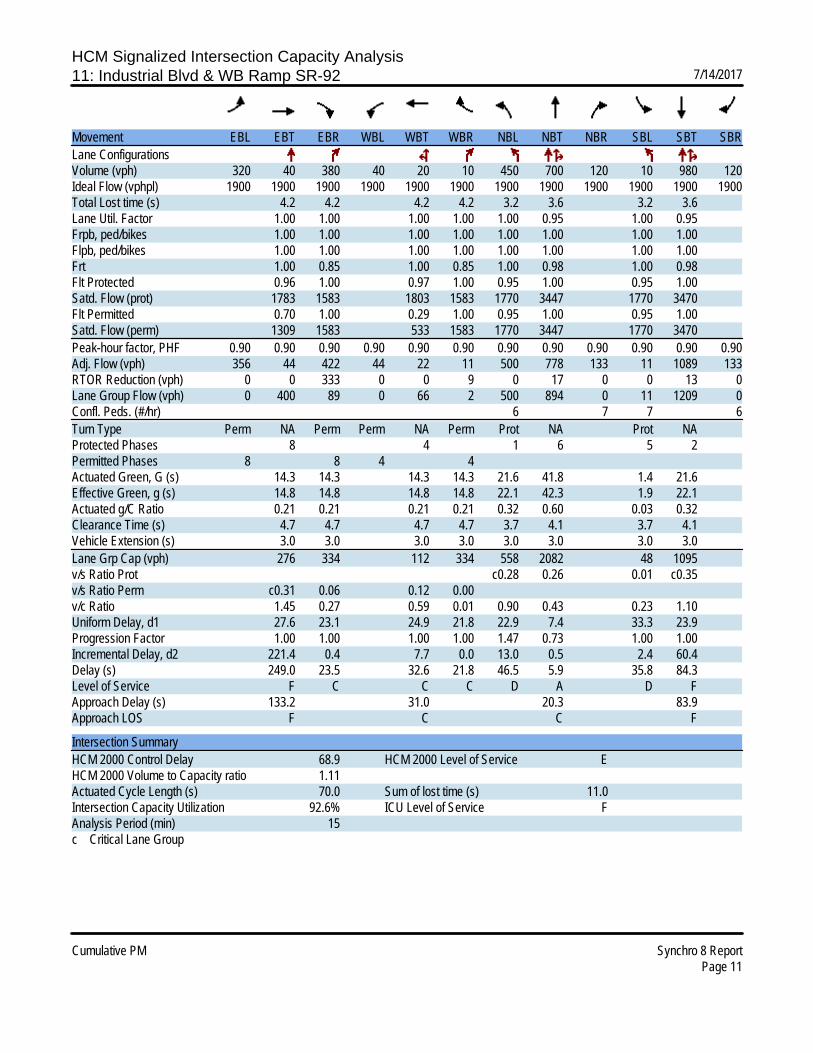
HCM Signalized Intersection Capacity Analysis11: Industrial Blvd & WB Ramp SR-92 7/14/2017
Cumulative PM Synchro 8 ReportPage 11
Movement EBL EBT EBR WBL WBT WBR NBL NBT NBR SBL SBT SBRLane ConfigurationsVolume (vph) 320 40 380 40 20 10 450 700 120 10 980 120Ideal Flow (vphpl) 1900 1900 1900 1900 1900 1900 1900 1900 1900 1900 1900 1900Total Lost time (s) 4.2 4.2 4.2 4.2 3.2 3.6 3.2 3.6Lane Util. Factor 1.00 1.00 1.00 1.00 1.00 0.95 1.00 0.95Frpb, ped/bikes 1.00 1.00 1.00 1.00 1.00 1.00 1.00 1.00Flpb, ped/bikes 1.00 1.00 1.00 1.00 1.00 1.00 1.00 1.00Frt 1.00 0.85 1.00 0.85 1.00 0.98 1.00 0.98Flt Protected 0.96 1.00 0.97 1.00 0.95 1.00 0.95 1.00Satd. Flow (prot) 1783 1583 1803 1583 1770 3447 1770 3470Flt Permitted 0.70 1.00 0.29 1.00 0.95 1.00 0.95 1.00Satd. Flow (perm) 1309 1583 533 1583 1770 3447 1770 3470Peak-hour factor, PHF 0.90 0.90 0.90 0.90 0.90 0.90 0.90 0.90 0.90 0.90 0.90 0.90Adj. Flow (vph) 356 44 422 44 22 11 500 778 133 11 1089 133RTOR Reduction (vph) 0 0 333 0 0 9 0 17 0 0 13 0Lane Group Flow (vph) 0 400 89 0 66 2 500 894 0 11 1209 0Confl. Peds. (#/hr) 6 7 7 6Turn Type Perm NA Perm Perm NA Perm Prot NA Prot NAProtected Phases 8 4 1 6 5 2Permitted Phases 8 8 4 4Actuated Green, G (s) 14.3 14.3 14.3 14.3 21.6 41.8 1.4 21.6Effective Green, g (s) 14.8 14.8 14.8 14.8 22.1 42.3 1.9 22.1Actuated g/C Ratio 0.21 0.21 0.21 0.21 0.32 0.60 0.03 0.32Clearance Time (s) 4.7 4.7 4.7 4.7 3.7 4.1 3.7 4.1Vehicle Extension (s) 3.0 3.0 3.0 3.0 3.0 3.0 3.0 3.0Lane Grp Cap (vph) 276 334 112 334 558 2082 48 1095v/s Ratio Prot c0.28 0.26 0.01 c0.35v/s Ratio Perm c0.31 0.06 0.12 0.00v/c Ratio 1.45 0.27 0.59 0.01 0.90 0.43 0.23 1.10Uniform Delay, d1 27.6 23.1 24.9 21.8 22.9 7.4 33.3 23.9Progression Factor 1.00 1.00 1.00 1.00 1.47 0.73 1.00 1.00Incremental Delay, d2 221.4 0.4 7.7 0.0 13.0 0.5 2.4 60.4Delay (s) 249.0 23.5 32.6 21.8 46.5 5.9 35.8 84.3Level of Service F C C C D A D FApproach Delay (s) 133.2 31.0 20.3 83.9Approach LOS F C C F
Intersection SummaryHCM 2000 Control Delay 68.9 HCM 2000 Level of Service EHCM 2000 Volume to Capacity ratio 1.11Actuated Cycle Length (s) 70.0 Sum of lost time (s) 11.0Intersection Capacity Utilization 92.6% ICU Level of Service FAnalysis Period (min) 15c Critical Lane Group
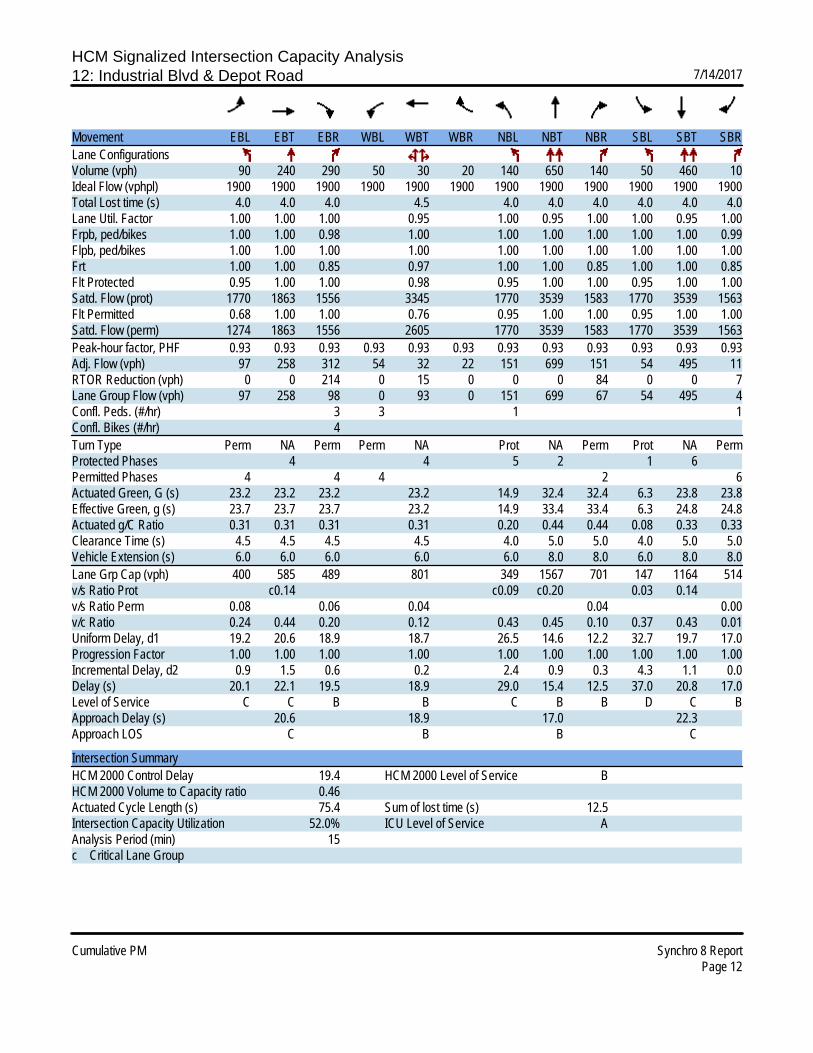
HCM Signalized Intersection Capacity Analysis12: Industrial Blvd & Depot Road 7/14/2017
Cumulative PM Synchro 8 ReportPage 12
Movement EBL EBT EBR WBL WBT WBR NBL NBT NBR SBL SBT SBRLane ConfigurationsVolume (vph) 90 240 290 50 30 20 140 650 140 50 460 10Ideal Flow (vphpl) 1900 1900 1900 1900 1900 1900 1900 1900 1900 1900 1900 1900Total Lost time (s) 4.0 4.0 4.0 4.5 4.0 4.0 4.0 4.0 4.0 4.0Lane Util. Factor 1.00 1.00 1.00 0.95 1.00 0.95 1.00 1.00 0.95 1.00Frpb, ped/bikes 1.00 1.00 0.98 1.00 1.00 1.00 1.00 1.00 1.00 0.99Flpb, ped/bikes 1.00 1.00 1.00 1.00 1.00 1.00 1.00 1.00 1.00 1.00Frt 1.00 1.00 0.85 0.97 1.00 1.00 0.85 1.00 1.00 0.85Flt Protected 0.95 1.00 1.00 0.98 0.95 1.00 1.00 0.95 1.00 1.00Satd. Flow (prot) 1770 1863 1556 3345 1770 3539 1583 1770 3539 1563Flt Permitted 0.68 1.00 1.00 0.76 0.95 1.00 1.00 0.95 1.00 1.00Satd. Flow (perm) 1274 1863 1556 2605 1770 3539 1583 1770 3539 1563Peak-hour factor, PHF 0.93 0.93 0.93 0.93 0.93 0.93 0.93 0.93 0.93 0.93 0.93 0.93Adj. Flow (vph) 97 258 312 54 32 22 151 699 151 54 495 11RTOR Reduction (vph) 0 0 214 0 15 0 0 0 84 0 0 7Lane Group Flow (vph) 97 258 98 0 93 0 151 699 67 54 495 4Confl. Peds. (#/hr) 3 3 1 1Confl. Bikes (#/hr) 4Turn Type Perm NA Perm Perm NA Prot NA Perm Prot NA PermProtected Phases 4 4 5 2 1 6Permitted Phases 4 4 4 2 6Actuated Green, G (s) 23.2 23.2 23.2 23.2 14.9 32.4 32.4 6.3 23.8 23.8Effective Green, g (s) 23.7 23.7 23.7 23.2 14.9 33.4 33.4 6.3 24.8 24.8Actuated g/C Ratio 0.31 0.31 0.31 0.31 0.20 0.44 0.44 0.08 0.33 0.33Clearance Time (s) 4.5 4.5 4.5 4.5 4.0 5.0 5.0 4.0 5.0 5.0Vehicle Extension (s) 6.0 6.0 6.0 6.0 6.0 8.0 8.0 6.0 8.0 8.0Lane Grp Cap (vph) 400 585 489 801 349 1567 701 147 1164 514v/s Ratio Prot c0.14 c0.09 c0.20 0.03 0.14v/s Ratio Perm 0.08 0.06 0.04 0.04 0.00v/c Ratio 0.24 0.44 0.20 0.12 0.43 0.45 0.10 0.37 0.43 0.01Uniform Delay, d1 19.2 20.6 18.9 18.7 26.5 14.6 12.2 32.7 19.7 17.0Progression Factor 1.00 1.00 1.00 1.00 1.00 1.00 1.00 1.00 1.00 1.00Incremental Delay, d2 0.9 1.5 0.6 0.2 2.4 0.9 0.3 4.3 1.1 0.0Delay (s) 20.1 22.1 19.5 18.9 29.0 15.4 12.5 37.0 20.8 17.0Level of Service C C B B C B B D C BApproach Delay (s) 20.6 18.9 17.0 22.3Approach LOS C B B C
Intersection SummaryHCM 2000 Control Delay 19.4 HCM 2000 Level of Service BHCM 2000 Volume to Capacity ratio 0.46Actuated Cycle Length (s) 75.4 Sum of lost time (s) 12.5Intersection Capacity Utilization 52.0% ICU Level of Service AAnalysis Period (min) 15c Critical Lane Group

HCM Unsignalized Intersection Capacity Analysis13: Depot Road & West Driveway 7/14/2017
Cumulative PM Synchro 8 ReportPage 13
Movement EBL EBT WBT WBR SBL SBRLane ConfigurationsVolume (veh/h) 20 490 160 70 60 10Sign Control Free Free StopGrade 0% 0% 0%Peak Hour Factor 0.91 0.91 0.91 0.91 0.91 0.91Hourly flow rate (vph) 22 538 176 77 66 11Pedestrians 2 29Lane Width (ft) 12.0 12.0Walking Speed (ft/s) 3.5 3.5Percent Blockage 0 3Right turn flare (veh)Median type None NoneMedian storage veh)Upstream signal (ft)pX, platoon unblockedvC, conflicting volume 282 558 243vC1, stage 1 conf volvC2, stage 2 conf volvCu, unblocked vol 282 558 243tC, single (s) 4.1 6.8 6.9tC, 2 stage (s)tF (s) 2.2 3.5 3.3p0 queue free % 98 85 99cM capacity (veh/h) 1242 438 736
Direction, Lane # EB 1 EB 2 WB 1 SB 1Volume Total 201 359 253 77Volume Left 22 0 0 66Volume Right 0 0 77 11cSH 1242 1700 1700 465Volume to Capacity 0.02 0.21 0.15 0.17Queue Length 95th (ft) 1 0 0 15Control Delay (s) 1.0 0.0 0.0 14.3Lane LOS A BApproach Delay (s) 0.4 0.0 14.3Approach LOS B
Intersection SummaryAverage Delay 1.5Intersection Capacity Utilization 38.8% ICU Level of Service AAnalysis Period (min) 15
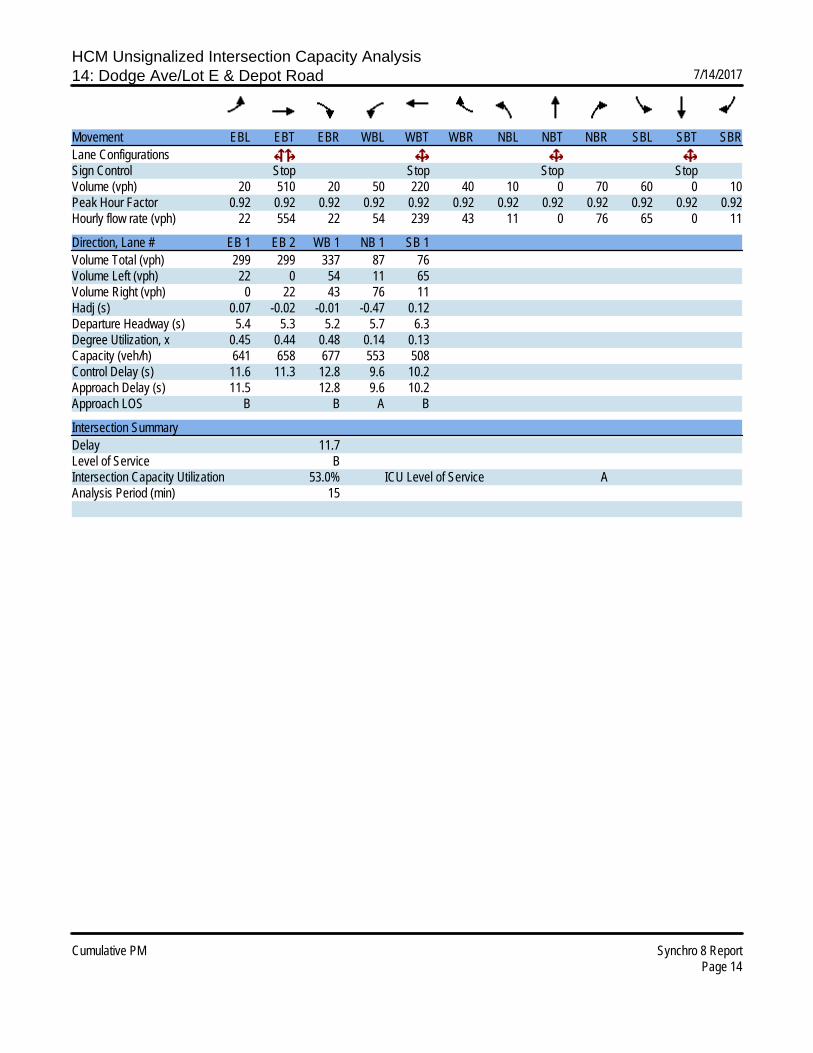
HCM Unsignalized Intersection Capacity Analysis14: Dodge Ave/Lot E & Depot Road 7/14/2017
Cumulative PM Synchro 8 ReportPage 14
Movement EBL EBT EBR WBL WBT WBR NBL NBT NBR SBL SBT SBRLane ConfigurationsSign Control Stop Stop Stop StopVolume (vph) 20 510 20 50 220 40 10 0 70 60 0 10Peak Hour Factor 0.92 0.92 0.92 0.92 0.92 0.92 0.92 0.92 0.92 0.92 0.92 0.92Hourly flow rate (vph) 22 554 22 54 239 43 11 0 76 65 0 11
Direction, Lane # EB 1 EB 2 WB 1 NB 1 SB 1Volume Total (vph) 299 299 337 87 76Volume Left (vph) 22 0 54 11 65Volume Right (vph) 0 22 43 76 11Hadj (s) 0.07 -0.02 -0.01 -0.47 0.12Departure Headway (s) 5.4 5.3 5.2 5.7 6.3Degree Utilization, x 0.45 0.44 0.48 0.14 0.13Capacity (veh/h) 641 658 677 553 508Control Delay (s) 11.6 11.3 12.8 9.6 10.2Approach Delay (s) 11.5 12.8 9.6 10.2Approach LOS B B A B
Intersection SummaryDelay 11.7Level of Service BIntersection Capacity Utilization 53.0% ICU Level of Service AAnalysis Period (min) 15

HCM Unsignalized Intersection Capacity Analysis15: Depot Road & Lot F 7/14/2017
Cumulative PM Synchro 8 ReportPage 15
Movement EBL EBT WBT WBR SBL SBRLane ConfigurationsVolume (veh/h) 20 620 300 20 60 20Sign Control Free Free StopGrade 0% 0% 0%Peak Hour Factor 0.92 0.92 0.92 0.92 0.92 0.92Hourly flow rate (vph) 22 674 326 22 65 22Pedestrians 9Lane Width (ft) 12.0Walking Speed (ft/s) 3.5Percent Blockage 1Right turn flare (veh)Median type None NoneMedian storage veh)Upstream signal (ft) 957pX, platoon unblockedvC, conflicting volume 357 726 346vC1, stage 1 conf volvC2, stage 2 conf volvCu, unblocked vol 357 726 346tC, single (s) 4.1 6.8 6.9tC, 2 stage (s)tF (s) 2.2 3.5 3.3p0 queue free % 98 81 97cM capacity (veh/h) 1188 350 645
Direction, Lane # EB 1 EB 2 WB 1 SB 1Volume Total 246 449 348 87Volume Left 22 0 0 65Volume Right 0 0 22 22cSH 1188 1700 1700 395Volume to Capacity 0.02 0.26 0.20 0.22Queue Length 95th (ft) 1 0 0 21Control Delay (s) 0.9 0.0 0.0 16.7Lane LOS A CApproach Delay (s) 0.3 0.0 16.7Approach LOS C
Intersection SummaryAverage Delay 1.5Intersection Capacity Utilization 42.8% ICU Level of Service AAnalysis Period (min) 15

HCM Unsignalized Intersection Capacity Analysis16: Depot Road & Lot G 7/14/2017
Cumulative PM Synchro 8 ReportPage 16
Movement EBL EBT WBT WBR SBL SBRLane ConfigurationsVolume (veh/h) 10 680 320 50 50 10Sign Control Free Free StopGrade 0% 0% 0%Peak Hour Factor 0.93 0.93 0.93 0.93 0.93 0.93Hourly flow rate (vph) 11 731 344 54 54 11Pedestrians 19 19 5Lane Width (ft) 12.0 12.0 12.0Walking Speed (ft/s) 3.5 3.5 3.5Percent Blockage 2 2 0Right turn flare (veh)Median type None NoneMedian storage veh)Upstream signal (ft) 529pX, platoon unblockedvC, conflicting volume 403 755 368vC1, stage 1 conf volvC2, stage 2 conf volvCu, unblocked vol 403 755 368tC, single (s) 4.1 6.8 6.9tC, 2 stage (s)tF (s) 2.2 3.5 3.3p0 queue free % 99 84 98cM capacity (veh/h) 1147 333 615
Direction, Lane # EB 1 EB 2 WB 1 WB 2 SB 1Volume Total 254 487 344 54 65Volume Left 11 0 0 0 54Volume Right 0 0 0 54 11cSH 1147 1700 1700 1700 361Volume to Capacity 0.01 0.29 0.20 0.03 0.18Queue Length 95th (ft) 1 0 0 0 16Control Delay (s) 0.4 0.0 0.0 0.0 17.1Lane LOS A CApproach Delay (s) 0.1 0.0 17.1Approach LOS C
Intersection SummaryAverage Delay 1.0Intersection Capacity Utilization 40.8% ICU Level of Service AAnalysis Period (min) 15
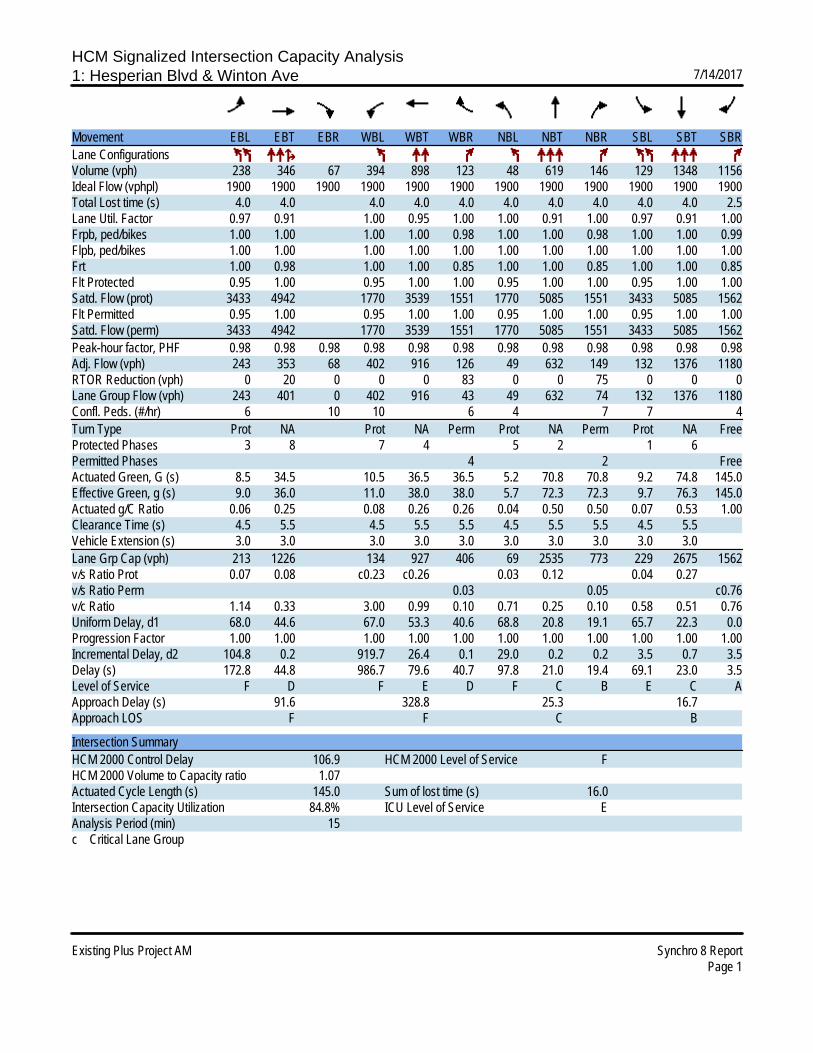
HCM Signalized Intersection Capacity Analysis1: Hesperian Blvd & Winton Ave 7/14/2017
Existing Plus Project AM Synchro 8 ReportPage 1
Movement EBL EBT EBR WBL WBT WBR NBL NBT NBR SBL SBT SBRLane ConfigurationsVolume (vph) 238 346 67 394 898 123 48 619 146 129 1348 1156Ideal Flow (vphpl) 1900 1900 1900 1900 1900 1900 1900 1900 1900 1900 1900 1900Total Lost time (s) 4.0 4.0 4.0 4.0 4.0 4.0 4.0 4.0 4.0 4.0 2.5Lane Util. Factor 0.97 0.91 1.00 0.95 1.00 1.00 0.91 1.00 0.97 0.91 1.00Frpb, ped/bikes 1.00 1.00 1.00 1.00 0.98 1.00 1.00 0.98 1.00 1.00 0.99Flpb, ped/bikes 1.00 1.00 1.00 1.00 1.00 1.00 1.00 1.00 1.00 1.00 1.00Frt 1.00 0.98 1.00 1.00 0.85 1.00 1.00 0.85 1.00 1.00 0.85Flt Protected 0.95 1.00 0.95 1.00 1.00 0.95 1.00 1.00 0.95 1.00 1.00Satd. Flow (prot) 3433 4942 1770 3539 1551 1770 5085 1551 3433 5085 1562Flt Permitted 0.95 1.00 0.95 1.00 1.00 0.95 1.00 1.00 0.95 1.00 1.00Satd. Flow (perm) 3433 4942 1770 3539 1551 1770 5085 1551 3433 5085 1562Peak-hour factor, PHF 0.98 0.98 0.98 0.98 0.98 0.98 0.98 0.98 0.98 0.98 0.98 0.98Adj. Flow (vph) 243 353 68 402 916 126 49 632 149 132 1376 1180RTOR Reduction (vph) 0 20 0 0 0 83 0 0 75 0 0 0Lane Group Flow (vph) 243 401 0 402 916 43 49 632 74 132 1376 1180Confl. Peds. (#/hr) 6 10 10 6 4 7 7 4Turn Type Prot NA Prot NA Perm Prot NA Perm Prot NA FreeProtected Phases 3 8 7 4 5 2 1 6Permitted Phases 4 2 FreeActuated Green, G (s) 8.5 34.5 10.5 36.5 36.5 5.2 70.8 70.8 9.2 74.8 145.0Effective Green, g (s) 9.0 36.0 11.0 38.0 38.0 5.7 72.3 72.3 9.7 76.3 145.0Actuated g/C Ratio 0.06 0.25 0.08 0.26 0.26 0.04 0.50 0.50 0.07 0.53 1.00Clearance Time (s) 4.5 5.5 4.5 5.5 5.5 4.5 5.5 5.5 4.5 5.5Vehicle Extension (s) 3.0 3.0 3.0 3.0 3.0 3.0 3.0 3.0 3.0 3.0Lane Grp Cap (vph) 213 1226 134 927 406 69 2535 773 229 2675 1562v/s Ratio Prot 0.07 0.08 c0.23 c0.26 0.03 0.12 0.04 0.27v/s Ratio Perm 0.03 0.05 c0.76v/c Ratio 1.14 0.33 3.00 0.99 0.10 0.71 0.25 0.10 0.58 0.51 0.76Uniform Delay, d1 68.0 44.6 67.0 53.3 40.6 68.8 20.8 19.1 65.7 22.3 0.0Progression Factor 1.00 1.00 1.00 1.00 1.00 1.00 1.00 1.00 1.00 1.00 1.00Incremental Delay, d2 104.8 0.2 919.7 26.4 0.1 29.0 0.2 0.2 3.5 0.7 3.5Delay (s) 172.8 44.8 986.7 79.6 40.7 97.8 21.0 19.4 69.1 23.0 3.5Level of Service F D F E D F C B E C AApproach Delay (s) 91.6 328.8 25.3 16.7Approach LOS F F C B
Intersection SummaryHCM 2000 Control Delay 106.9 HCM 2000 Level of Service FHCM 2000 Volume to Capacity ratio 1.07Actuated Cycle Length (s) 145.0 Sum of lost time (s) 16.0Intersection Capacity Utilization 84.8% ICU Level of Service EAnalysis Period (min) 15c Critical Lane Group

HCM Signalized Intersection Capacity Analysis2: Hesperian Blvd & Southland Drive 7/14/2017
Existing Plus Project AM Synchro 8 ReportPage 2
Movement EBL EBT EBR WBL WBT WBR NBL NBT NBR SBL SBT SBRLane ConfigurationsVolume (vph) 80 126 46 231 364 22 54 722 90 52 1488 263Ideal Flow (vphpl) 1900 1900 1900 1900 1900 1900 1900 1900 1900 1900 1900 1900Total Lost time (s) 4.0 4.0 4.0 4.0 4.0 4.0 4.0 4.0Lane Util. Factor 1.00 0.95 1.00 0.91 1.00 0.91 1.00 0.91Frpb, ped/bikes 1.00 0.99 1.00 1.00 1.00 1.00 1.00 1.00Flpb, ped/bikes 1.00 1.00 0.99 1.00 1.00 1.00 1.00 1.00Frt 1.00 0.96 1.00 0.99 1.00 0.98 1.00 0.98Flt Protected 0.95 1.00 0.95 1.00 0.95 1.00 0.95 1.00Satd. Flow (prot) 1768 3371 1746 5038 1770 4993 1770 4958Flt Permitted 0.44 1.00 0.62 1.00 0.95 1.00 0.95 1.00Satd. Flow (perm) 827 3371 1147 5038 1770 4993 1770 4958Peak-hour factor, PHF 0.94 0.94 0.94 0.94 0.94 0.94 0.94 0.94 0.94 0.94 0.94 0.94Adj. Flow (vph) 85 134 49 246 387 23 57 768 96 55 1583 280RTOR Reduction (vph) 0 36 0 0 7 0 0 12 0 0 18 0Lane Group Flow (vph) 85 147 0 246 403 0 57 852 0 55 1845 0Confl. Peds. (#/hr) 2 16 16 2 4 1 1 4Confl. Bikes (#/hr) 1 1Turn Type Perm NA Perm NA Prot NA Prot NAProtected Phases 8 4 1 6 5 2Permitted Phases 8 4Actuated Green, G (s) 29.1 29.1 29.1 29.1 7.3 61.2 7.1 61.0Effective Green, g (s) 29.1 29.1 29.1 29.1 7.3 61.8 7.1 61.6Actuated g/C Ratio 0.26 0.26 0.26 0.26 0.07 0.56 0.06 0.56Clearance Time (s) 4.0 4.0 4.0 4.0 4.0 4.6 4.0 4.6Vehicle Extension (s) 3.0 3.0 3.0 3.0 3.0 3.0 3.0 3.0Lane Grp Cap (vph) 218 891 303 1332 117 2805 114 2776v/s Ratio Prot 0.04 0.08 c0.03 0.17 0.03 c0.37v/s Ratio Perm 0.10 c0.21v/c Ratio 0.39 0.16 0.81 0.30 0.49 0.30 0.48 0.66Uniform Delay, d1 33.2 31.1 37.9 32.3 49.5 12.7 49.7 17.0Progression Factor 1.00 1.00 1.00 1.00 0.85 1.48 1.00 1.00Incremental Delay, d2 1.2 0.1 15.1 0.1 3.1 0.3 3.2 1.3Delay (s) 34.3 31.2 53.0 32.5 45.4 19.2 52.9 18.2Level of Service C C D C D B D BApproach Delay (s) 32.2 40.2 20.8 19.2Approach LOS C D C B
Intersection SummaryHCM 2000 Control Delay 24.2 HCM 2000 Level of Service CHCM 2000 Volume to Capacity ratio 0.69Actuated Cycle Length (s) 110.0 Sum of lost time (s) 12.0Intersection Capacity Utilization 80.5% ICU Level of Service DAnalysis Period (min) 15c Critical Lane Group

HCM Signalized Intersection Capacity Analysis3: Hesperian Blvd & Turner Court 7/14/2017
Existing Plus Project AM Synchro 8 ReportPage 3
Movement EBL EBT EBR WBL WBT WBR NBL NBT NBR SBL SBT SBRLane ConfigurationsVolume (vph) 62 7 23 67 60 58 112 698 38 92 1350 434Ideal Flow (vphpl) 1900 1900 1900 1900 1900 1900 1900 1900 1900 1900 1900 1900Total Lost time (s) 4.0 4.0 4.0 4.6 4.0 4.0 4.0 4.0Lane Util. Factor 1.00 1.00 1.00 1.00 1.00 0.91 1.00 0.91Frpb, ped/bikes 1.00 0.96 1.00 0.99 1.00 1.00 1.00 0.99Flpb, ped/bikes 1.00 1.00 0.98 1.00 1.00 1.00 1.00 1.00Frt 1.00 0.88 1.00 0.85 1.00 0.99 1.00 0.96Flt Protected 0.95 1.00 0.97 1.00 0.95 1.00 0.95 1.00Satd. Flow (prot) 1768 1580 1777 1561 1770 5032 1770 4848Flt Permitted 0.54 1.00 0.82 1.00 0.95 1.00 0.95 1.00Satd. Flow (perm) 1005 1580 1497 1561 1770 5032 1770 4848Peak-hour factor, PHF 0.94 0.94 0.94 0.94 0.94 0.94 0.94 0.94 0.94 0.94 0.94 0.94Adj. Flow (vph) 66 7 24 71 64 62 119 743 40 98 1436 462RTOR Reduction (vph) 0 20 0 0 0 52 0 4 0 0 33 0Lane Group Flow (vph) 66 11 0 0 135 10 119 779 0 98 1865 0Confl. Peds. (#/hr) 1 40 40 1 10 19 19 10Turn Type Perm NA Perm NA Perm Prot NA Prot NAProtected Phases 4 8 1 6 5 2Permitted Phases 4 8 8Actuated Green, G (s) 17.2 17.2 17.2 17.2 12.7 69.1 10.5 66.9Effective Green, g (s) 17.8 17.8 17.8 17.2 12.7 69.7 10.5 67.5Actuated g/C Ratio 0.16 0.16 0.16 0.16 0.12 0.63 0.10 0.61Clearance Time (s) 4.6 4.6 4.6 4.6 4.0 4.6 4.0 4.6Vehicle Extension (s) 3.0 3.0 3.0 3.0 3.0 3.0 3.0 3.0Lane Grp Cap (vph) 162 255 242 244 204 3188 168 2974v/s Ratio Prot 0.01 c0.07 0.15 0.06 c0.38v/s Ratio Perm 0.07 c0.09 0.01v/c Ratio 0.41 0.04 0.56 0.04 0.58 0.24 0.58 0.63Uniform Delay, d1 41.4 38.9 42.5 39.4 46.1 8.7 47.7 13.3Progression Factor 1.00 1.00 1.00 1.00 1.00 1.00 0.79 1.41Incremental Delay, d2 1.7 0.1 2.8 0.1 4.2 0.2 4.1 0.8Delay (s) 43.0 39.0 45.3 39.5 50.3 8.9 41.5 19.6Level of Service D D D D D A D BApproach Delay (s) 41.7 43.4 14.4 20.7Approach LOS D D B C
Intersection SummaryHCM 2000 Control Delay 20.9 HCM 2000 Level of Service CHCM 2000 Volume to Capacity ratio 0.60Actuated Cycle Length (s) 110.0 Sum of lost time (s) 12.0Intersection Capacity Utilization 74.5% ICU Level of Service DAnalysis Period (min) 15c Critical Lane Group
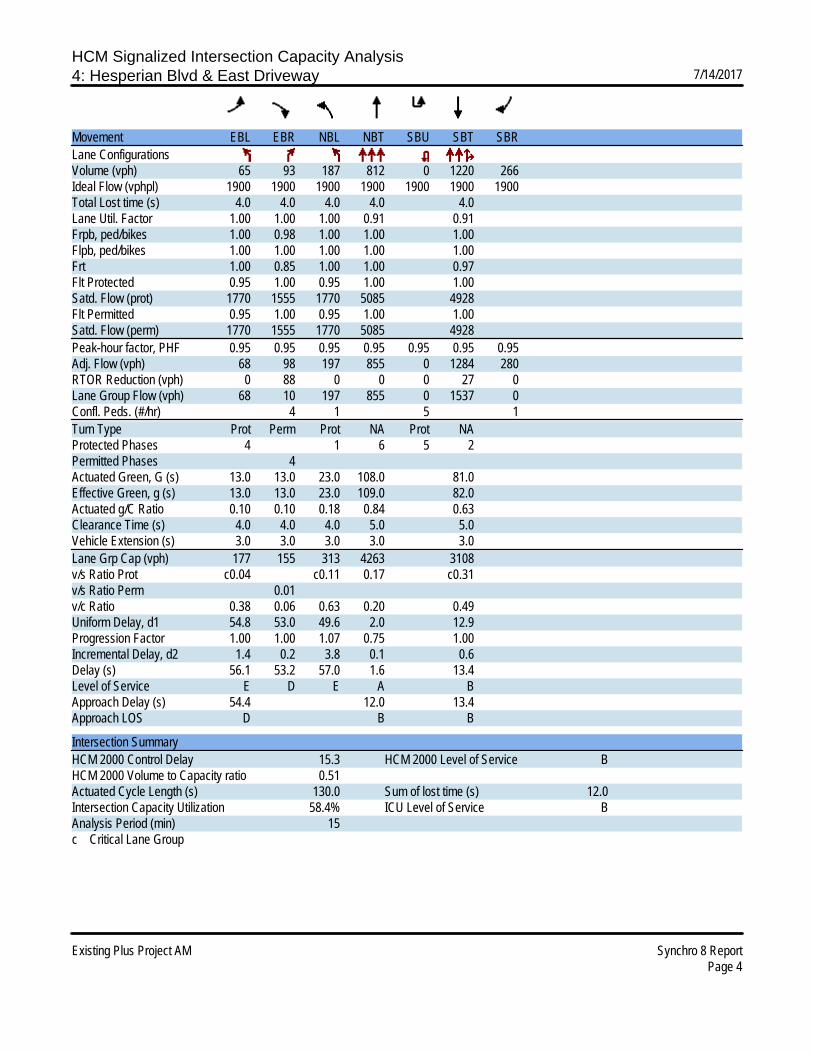
HCM Signalized Intersection Capacity Analysis4: Hesperian Blvd & East Driveway 7/14/2017
Existing Plus Project AM Synchro 8 ReportPage 4
Movement EBL EBR NBL NBT SBU SBT SBRLane ConfigurationsVolume (vph) 65 93 187 812 0 1220 266Ideal Flow (vphpl) 1900 1900 1900 1900 1900 1900 1900Total Lost time (s) 4.0 4.0 4.0 4.0 4.0Lane Util. Factor 1.00 1.00 1.00 0.91 0.91Frpb, ped/bikes 1.00 0.98 1.00 1.00 1.00Flpb, ped/bikes 1.00 1.00 1.00 1.00 1.00Frt 1.00 0.85 1.00 1.00 0.97Flt Protected 0.95 1.00 0.95 1.00 1.00Satd. Flow (prot) 1770 1555 1770 5085 4928Flt Permitted 0.95 1.00 0.95 1.00 1.00Satd. Flow (perm) 1770 1555 1770 5085 4928Peak-hour factor, PHF 0.95 0.95 0.95 0.95 0.95 0.95 0.95Adj. Flow (vph) 68 98 197 855 0 1284 280RTOR Reduction (vph) 0 88 0 0 0 27 0Lane Group Flow (vph) 68 10 197 855 0 1537 0Confl. Peds. (#/hr) 4 1 5 1Turn Type Prot Perm Prot NA Prot NAProtected Phases 4 1 6 5 2Permitted Phases 4Actuated Green, G (s) 13.0 13.0 23.0 108.0 81.0Effective Green, g (s) 13.0 13.0 23.0 109.0 82.0Actuated g/C Ratio 0.10 0.10 0.18 0.84 0.63Clearance Time (s) 4.0 4.0 4.0 5.0 5.0Vehicle Extension (s) 3.0 3.0 3.0 3.0 3.0Lane Grp Cap (vph) 177 155 313 4263 3108v/s Ratio Prot c0.04 c0.11 0.17 c0.31v/s Ratio Perm 0.01v/c Ratio 0.38 0.06 0.63 0.20 0.49Uniform Delay, d1 54.8 53.0 49.6 2.0 12.9Progression Factor 1.00 1.00 1.07 0.75 1.00Incremental Delay, d2 1.4 0.2 3.8 0.1 0.6Delay (s) 56.1 53.2 57.0 1.6 13.4Level of Service E D E A BApproach Delay (s) 54.4 12.0 13.4Approach LOS D B B
Intersection SummaryHCM 2000 Control Delay 15.3 HCM 2000 Level of Service BHCM 2000 Volume to Capacity ratio 0.51Actuated Cycle Length (s) 130.0 Sum of lost time (s) 12.0Intersection Capacity Utilization 58.4% ICU Level of Service BAnalysis Period (min) 15c Critical Lane Group
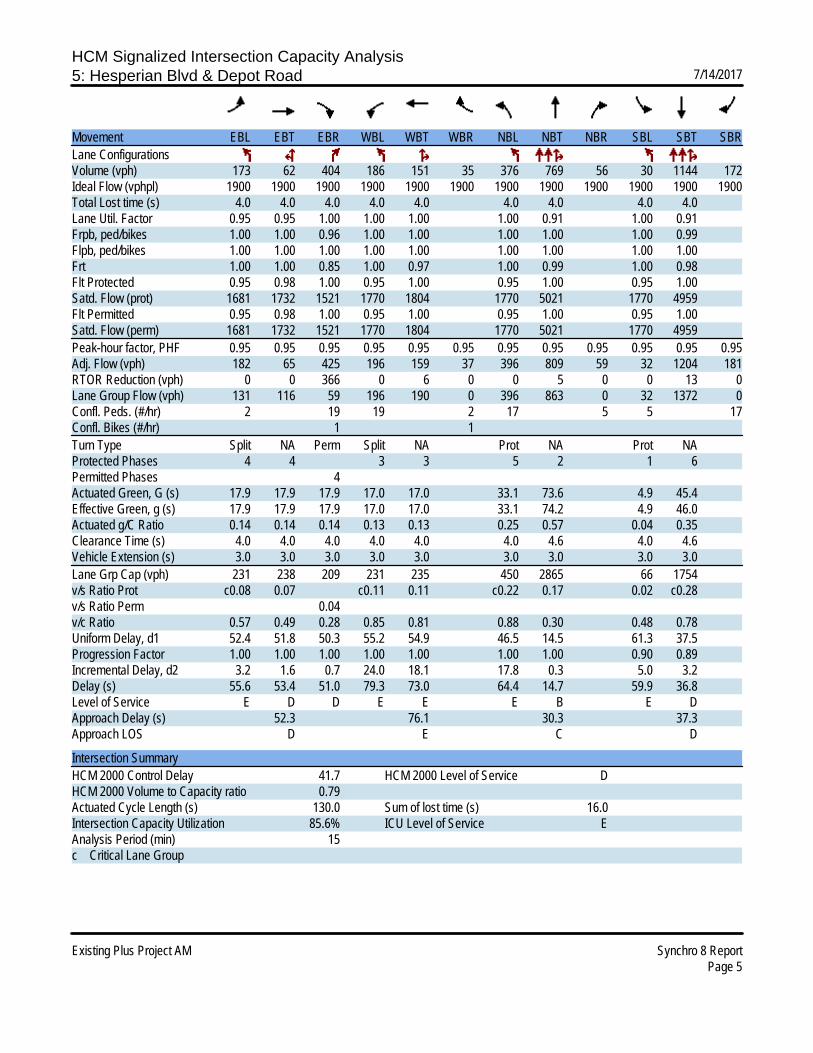
HCM Signalized Intersection Capacity Analysis5: Hesperian Blvd & Depot Road 7/14/2017
Existing Plus Project AM Synchro 8 ReportPage 5
Movement EBL EBT EBR WBL WBT WBR NBL NBT NBR SBL SBT SBRLane ConfigurationsVolume (vph) 173 62 404 186 151 35 376 769 56 30 1144 172Ideal Flow (vphpl) 1900 1900 1900 1900 1900 1900 1900 1900 1900 1900 1900 1900Total Lost time (s) 4.0 4.0 4.0 4.0 4.0 4.0 4.0 4.0 4.0Lane Util. Factor 0.95 0.95 1.00 1.00 1.00 1.00 0.91 1.00 0.91Frpb, ped/bikes 1.00 1.00 0.96 1.00 1.00 1.00 1.00 1.00 0.99Flpb, ped/bikes 1.00 1.00 1.00 1.00 1.00 1.00 1.00 1.00 1.00Frt 1.00 1.00 0.85 1.00 0.97 1.00 0.99 1.00 0.98Flt Protected 0.95 0.98 1.00 0.95 1.00 0.95 1.00 0.95 1.00Satd. Flow (prot) 1681 1732 1521 1770 1804 1770 5021 1770 4959Flt Permitted 0.95 0.98 1.00 0.95 1.00 0.95 1.00 0.95 1.00Satd. Flow (perm) 1681 1732 1521 1770 1804 1770 5021 1770 4959Peak-hour factor, PHF 0.95 0.95 0.95 0.95 0.95 0.95 0.95 0.95 0.95 0.95 0.95 0.95Adj. Flow (vph) 182 65 425 196 159 37 396 809 59 32 1204 181RTOR Reduction (vph) 0 0 366 0 6 0 0 5 0 0 13 0Lane Group Flow (vph) 131 116 59 196 190 0 396 863 0 32 1372 0Confl. Peds. (#/hr) 2 19 19 2 17 5 5 17Confl. Bikes (#/hr) 1 1Turn Type Split NA Perm Split NA Prot NA Prot NAProtected Phases 4 4 3 3 5 2 1 6Permitted Phases 4Actuated Green, G (s) 17.9 17.9 17.9 17.0 17.0 33.1 73.6 4.9 45.4Effective Green, g (s) 17.9 17.9 17.9 17.0 17.0 33.1 74.2 4.9 46.0Actuated g/C Ratio 0.14 0.14 0.14 0.13 0.13 0.25 0.57 0.04 0.35Clearance Time (s) 4.0 4.0 4.0 4.0 4.0 4.0 4.6 4.0 4.6Vehicle Extension (s) 3.0 3.0 3.0 3.0 3.0 3.0 3.0 3.0 3.0Lane Grp Cap (vph) 231 238 209 231 235 450 2865 66 1754v/s Ratio Prot c0.08 0.07 c0.11 0.11 c0.22 0.17 0.02 c0.28v/s Ratio Perm 0.04v/c Ratio 0.57 0.49 0.28 0.85 0.81 0.88 0.30 0.48 0.78Uniform Delay, d1 52.4 51.8 50.3 55.2 54.9 46.5 14.5 61.3 37.5Progression Factor 1.00 1.00 1.00 1.00 1.00 1.00 1.00 0.90 0.89Incremental Delay, d2 3.2 1.6 0.7 24.0 18.1 17.8 0.3 5.0 3.2Delay (s) 55.6 53.4 51.0 79.3 73.0 64.4 14.7 59.9 36.8Level of Service E D D E E E B E DApproach Delay (s) 52.3 76.1 30.3 37.3Approach LOS D E C D
Intersection SummaryHCM 2000 Control Delay 41.7 HCM 2000 Level of Service DHCM 2000 Volume to Capacity ratio 0.79Actuated Cycle Length (s) 130.0 Sum of lost time (s) 16.0Intersection Capacity Utilization 85.6% ICU Level of Service EAnalysis Period (min) 15c Critical Lane Group

HCM Signalized Intersection Capacity Analysis6: Hesperian Blvd & WB Ramp SR-92 7/14/2017
Existing Plus Project AM Synchro 8 ReportPage 6
Movement EBL EBR NBL NBT SBT SBRLane ConfigurationsVolume (vph) 202 264 167 968 1467 362Ideal Flow (vphpl) 1900 1900 1900 1900 1900 1900Total Lost time (s) 3.7 3.7 3.7 4.1 4.1Lane Util. Factor 0.97 1.00 1.00 0.91 0.91Frpb, ped/bikes 1.00 1.00 1.00 1.00 0.99Flpb, ped/bikes 1.00 1.00 1.00 1.00 1.00Frt 1.00 0.85 1.00 1.00 0.97Flt Protected 0.95 1.00 0.95 1.00 1.00Satd. Flow (prot) 3433 1583 1770 5085 4898Flt Permitted 0.95 1.00 0.95 1.00 1.00Satd. Flow (perm) 3433 1583 1770 5085 4898Peak-hour factor, PHF 0.97 0.97 0.97 0.97 0.97 0.97Adj. Flow (vph) 208 272 172 998 1512 373RTOR Reduction (vph) 0 237 0 0 38 0Lane Group Flow (vph) 208 35 172 998 1847 0Confl. Peds. (#/hr) 13 13Turn Type Perm Perm Prot NA NAProtected Phases 5 2 6Permitted Phases 4 4Actuated Green, G (s) 11.1 11.1 13.6 70.1 52.3Effective Green, g (s) 11.6 11.6 14.1 70.6 52.8Actuated g/C Ratio 0.13 0.13 0.16 0.78 0.59Clearance Time (s) 4.2 4.2 4.2 4.6 4.6Vehicle Extension (s) 3.0 3.0 3.0 3.0 3.0Lane Grp Cap (vph) 442 204 277 3988 2873v/s Ratio Prot c0.10 0.20 c0.38v/s Ratio Perm c0.06 0.02v/c Ratio 0.47 0.17 0.62 0.25 0.64Uniform Delay, d1 36.4 34.9 35.5 2.6 12.3Progression Factor 1.00 1.00 1.09 1.07 1.00Incremental Delay, d2 0.8 0.4 3.7 0.1 1.1Delay (s) 37.1 35.3 42.2 2.9 13.5Level of Service D D D A BApproach Delay (s) 36.1 8.7 13.5Approach LOS D A B
Intersection SummaryHCM 2000 Control Delay 15.0 HCM 2000 Level of Service BHCM 2000 Volume to Capacity ratio 0.62Actuated Cycle Length (s) 90.0 Sum of lost time (s) 12.0Intersection Capacity Utilization 61.8% ICU Level of Service BAnalysis Period (min) 15c Critical Lane Group

HCM Signalized Intersection Capacity Analysis7: Hesperian Blvd & EB Ramp SR-92 7/14/2017
Existing Plus Project AM Synchro 8 ReportPage 7
Movement EBL EBT EBR WBL WBT WBR NBL NBT NBR SBL SBT SBRLane ConfigurationsVolume (vph) 64 0 52 0 0 0 0 1049 733 243 1514 0Ideal Flow (vphpl) 1900 1900 1900 1900 1900 1900 1900 1900 1900 1900 1900 1900Total Lost time (s) 3.7 3.7 4.1 4.1 3.7 4.1Lane Util. Factor 1.00 0.88 0.95 1.00 1.00 0.91Frpb, ped/bikes 1.00 1.00 1.00 0.98 1.00 1.00Flpb, ped/bikes 1.00 1.00 1.00 1.00 1.00 1.00Frt 1.00 0.85 1.00 0.85 1.00 1.00Flt Protected 0.95 1.00 1.00 1.00 0.95 1.00Satd. Flow (prot) 1770 2787 3539 1551 1770 5085Flt Permitted 0.95 1.00 1.00 1.00 0.95 1.00Satd. Flow (perm) 1770 2787 3539 1551 1770 5085Peak-hour factor, PHF 0.92 0.92 0.92 0.92 0.92 0.92 0.92 0.92 0.92 0.92 0.92 0.92Adj. Flow (vph) 70 0 57 0 0 0 0 1140 797 264 1646 0RTOR Reduction (vph) 0 0 52 0 0 0 0 0 243 0 0 0Lane Group Flow (vph) 0 70 5 0 0 0 0 1140 554 264 1646 0Confl. Peds. (#/hr) 16 6 6Turn Type Perm NA Perm NA Perm Prot NAProtected Phases 4 2 1 6Permitted Phases 4 4 2Actuated Green, G (s) 7.8 7.8 50.3 50.3 18.9 73.4Effective Green, g (s) 8.3 8.3 50.8 50.8 19.4 73.9Actuated g/C Ratio 0.09 0.09 0.56 0.56 0.22 0.82Clearance Time (s) 4.2 4.2 4.6 4.6 4.2 4.6Vehicle Extension (s) 3.0 3.0 3.0 3.0 3.0 3.0Lane Grp Cap (vph) 163 257 1997 875 381 4175v/s Ratio Prot 0.32 c0.15 0.32v/s Ratio Perm 0.04 0.00 c0.36v/c Ratio 0.43 0.02 0.57 0.63 0.69 0.39Uniform Delay, d1 38.6 37.2 12.6 13.3 32.6 2.1Progression Factor 1.00 1.00 1.00 1.00 1.18 0.99Incremental Delay, d2 1.8 0.0 1.2 3.5 4.4 0.2Delay (s) 40.4 37.2 13.8 16.8 42.9 2.3Level of Service D D B B D AApproach Delay (s) 39.0 0.0 15.0 8.0Approach LOS D A B A
Intersection SummaryHCM 2000 Control Delay 12.4 HCM 2000 Level of Service BHCM 2000 Volume to Capacity ratio 0.63Actuated Cycle Length (s) 90.0 Sum of lost time (s) 11.5Intersection Capacity Utilization 73.7% ICU Level of Service DAnalysis Period (min) 15c Critical Lane Group
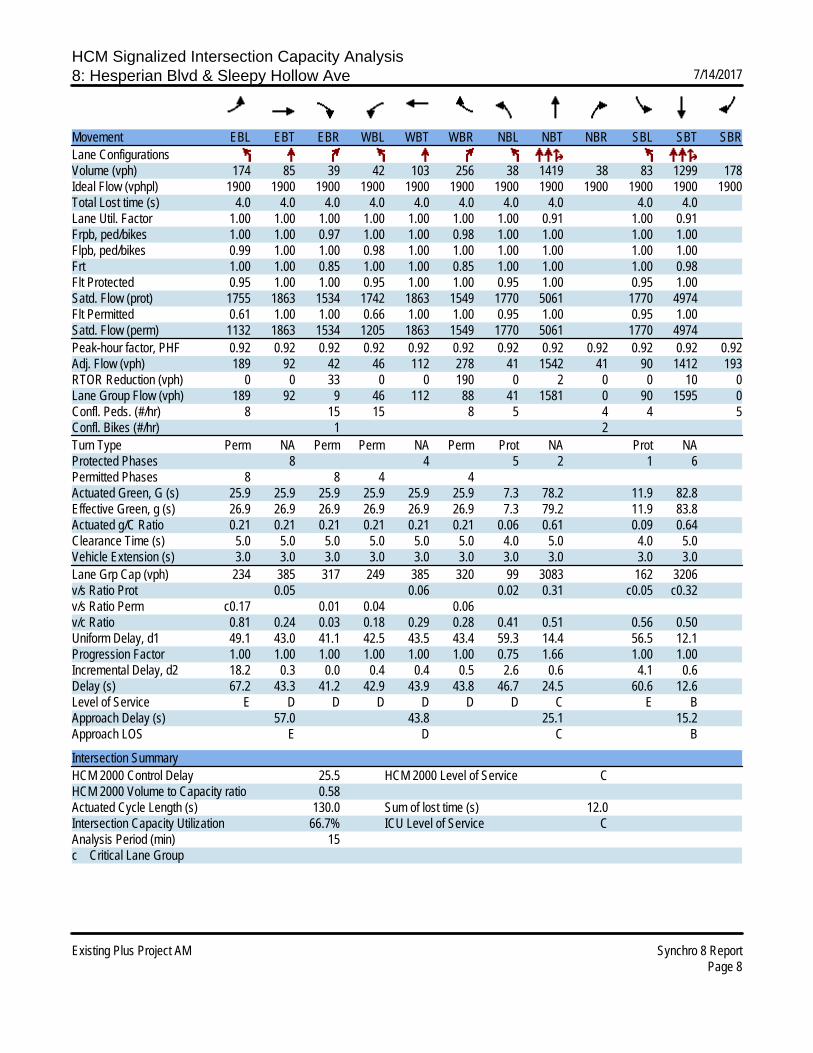
HCM Signalized Intersection Capacity Analysis8: Hesperian Blvd & Sleepy Hollow Ave 7/14/2017
Existing Plus Project AM Synchro 8 ReportPage 8
Movement EBL EBT EBR WBL WBT WBR NBL NBT NBR SBL SBT SBRLane ConfigurationsVolume (vph) 174 85 39 42 103 256 38 1419 38 83 1299 178Ideal Flow (vphpl) 1900 1900 1900 1900 1900 1900 1900 1900 1900 1900 1900 1900Total Lost time (s) 4.0 4.0 4.0 4.0 4.0 4.0 4.0 4.0 4.0 4.0Lane Util. Factor 1.00 1.00 1.00 1.00 1.00 1.00 1.00 0.91 1.00 0.91Frpb, ped/bikes 1.00 1.00 0.97 1.00 1.00 0.98 1.00 1.00 1.00 1.00Flpb, ped/bikes 0.99 1.00 1.00 0.98 1.00 1.00 1.00 1.00 1.00 1.00Frt 1.00 1.00 0.85 1.00 1.00 0.85 1.00 1.00 1.00 0.98Flt Protected 0.95 1.00 1.00 0.95 1.00 1.00 0.95 1.00 0.95 1.00Satd. Flow (prot) 1755 1863 1534 1742 1863 1549 1770 5061 1770 4974Flt Permitted 0.61 1.00 1.00 0.66 1.00 1.00 0.95 1.00 0.95 1.00Satd. Flow (perm) 1132 1863 1534 1205 1863 1549 1770 5061 1770 4974Peak-hour factor, PHF 0.92 0.92 0.92 0.92 0.92 0.92 0.92 0.92 0.92 0.92 0.92 0.92Adj. Flow (vph) 189 92 42 46 112 278 41 1542 41 90 1412 193RTOR Reduction (vph) 0 0 33 0 0 190 0 2 0 0 10 0Lane Group Flow (vph) 189 92 9 46 112 88 41 1581 0 90 1595 0Confl. Peds. (#/hr) 8 15 15 8 5 4 4 5Confl. Bikes (#/hr) 1 2Turn Type Perm NA Perm Perm NA Perm Prot NA Prot NAProtected Phases 8 4 5 2 1 6Permitted Phases 8 8 4 4Actuated Green, G (s) 25.9 25.9 25.9 25.9 25.9 25.9 7.3 78.2 11.9 82.8Effective Green, g (s) 26.9 26.9 26.9 26.9 26.9 26.9 7.3 79.2 11.9 83.8Actuated g/C Ratio 0.21 0.21 0.21 0.21 0.21 0.21 0.06 0.61 0.09 0.64Clearance Time (s) 5.0 5.0 5.0 5.0 5.0 5.0 4.0 5.0 4.0 5.0Vehicle Extension (s) 3.0 3.0 3.0 3.0 3.0 3.0 3.0 3.0 3.0 3.0Lane Grp Cap (vph) 234 385 317 249 385 320 99 3083 162 3206v/s Ratio Prot 0.05 0.06 0.02 0.31 c0.05 c0.32v/s Ratio Perm c0.17 0.01 0.04 0.06v/c Ratio 0.81 0.24 0.03 0.18 0.29 0.28 0.41 0.51 0.56 0.50Uniform Delay, d1 49.1 43.0 41.1 42.5 43.5 43.4 59.3 14.4 56.5 12.1Progression Factor 1.00 1.00 1.00 1.00 1.00 1.00 0.75 1.66 1.00 1.00Incremental Delay, d2 18.2 0.3 0.0 0.4 0.4 0.5 2.6 0.6 4.1 0.6Delay (s) 67.2 43.3 41.2 42.9 43.9 43.8 46.7 24.5 60.6 12.6Level of Service E D D D D D D C E BApproach Delay (s) 57.0 43.8 25.1 15.2Approach LOS E D C B
Intersection SummaryHCM 2000 Control Delay 25.5 HCM 2000 Level of Service CHCM 2000 Volume to Capacity ratio 0.58Actuated Cycle Length (s) 130.0 Sum of lost time (s) 12.0Intersection Capacity Utilization 66.7% ICU Level of Service CAnalysis Period (min) 15c Critical Lane Group

HCM Signalized Intersection Capacity Analysis9: Hesperian Blvd & Tennyson Road 7/14/2017
Existing Plus Project AM Synchro 8 ReportPage 9
Movement EBL EBT EBR WBL WBT WBR NBL NBT NBR SBL SBT SBRLane ConfigurationsVolume (vph) 147 166 38 173 523 153 87 970 55 148 883 308Ideal Flow (vphpl) 1900 1900 1900 1900 1900 1900 1900 1900 1900 1900 1900 1900Total Lost time (s) 4.0 4.0 4.0 4.0 4.0 4.0 4.0 4.0 4.0 4.0Lane Util. Factor 1.00 0.95 1.00 1.00 0.95 1.00 1.00 0.91 1.00 0.91Frpb, ped/bikes 1.00 1.00 0.96 1.00 1.00 0.97 1.00 1.00 1.00 0.99Flpb, ped/bikes 1.00 1.00 1.00 1.00 1.00 1.00 1.00 1.00 1.00 1.00Frt 1.00 1.00 0.85 1.00 1.00 0.85 1.00 0.99 1.00 0.96Flt Protected 0.95 1.00 1.00 0.95 1.00 1.00 0.95 1.00 0.95 1.00Satd. Flow (prot) 1770 3539 1524 1770 3539 1542 1770 5033 1770 4851Flt Permitted 0.95 1.00 1.00 0.95 1.00 1.00 0.95 1.00 0.95 1.00Satd. Flow (perm) 1770 3539 1524 1770 3539 1542 1770 5033 1770 4851Peak-hour factor, PHF 0.92 0.92 0.92 0.92 0.92 0.92 0.92 0.92 0.92 0.92 0.92 0.92Adj. Flow (vph) 160 180 41 188 568 166 95 1054 60 161 960 335RTOR Reduction (vph) 0 0 33 0 0 129 0 4 0 0 40 0Lane Group Flow (vph) 160 180 8 188 568 37 95 1110 0 161 1255 0Confl. Peds. (#/hr) 12 21 21 12 15 25 25 15Confl. Bikes (#/hr) 2 1Turn Type Prot NA Perm Prot NA Perm Prot NA Prot NAProtected Phases 3 8 7 4 1 6 5 2Permitted Phases 8 4Actuated Green, G (s) 15.6 25.4 25.4 18.3 28.1 28.1 11.7 52.0 16.2 56.5Effective Green, g (s) 15.6 26.4 26.4 18.3 29.1 29.1 11.7 53.1 16.2 57.6Actuated g/C Ratio 0.12 0.20 0.20 0.14 0.22 0.22 0.09 0.41 0.12 0.44Clearance Time (s) 4.0 5.0 5.0 4.0 5.0 5.0 4.0 5.1 4.0 5.1Vehicle Extension (s) 3.0 3.0 3.0 3.0 3.0 3.0 3.0 3.0 3.0 3.0Lane Grp Cap (vph) 212 718 309 249 792 345 159 2055 220 2149v/s Ratio Prot 0.09 0.05 c0.11 c0.16 0.05 0.22 c0.09 c0.26v/s Ratio Perm 0.01 0.02v/c Ratio 0.75 0.25 0.03 0.76 0.72 0.11 0.60 0.54 0.73 0.58Uniform Delay, d1 55.3 43.5 41.5 53.7 46.6 40.1 56.9 29.2 54.8 27.2Progression Factor 1.00 1.00 1.00 1.00 1.00 1.00 1.00 1.00 1.55 0.57Incremental Delay, d2 14.1 0.2 0.0 12.2 3.1 0.1 5.9 1.0 10.7 1.0Delay (s) 69.5 43.7 41.5 65.9 49.8 40.3 62.8 30.2 95.4 16.5Level of Service E D D E D D E C F BApproach Delay (s) 54.3 51.3 32.8 25.2Approach LOS D D C C
Intersection SummaryHCM 2000 Control Delay 36.4 HCM 2000 Level of Service DHCM 2000 Volume to Capacity ratio 0.68Actuated Cycle Length (s) 130.0 Sum of lost time (s) 16.0Intersection Capacity Utilization 77.4% ICU Level of Service DAnalysis Period (min) 15c Critical Lane Group

HCM Signalized Intersection Capacity Analysis10: Industrial Blvd & EB Ramp SR-92 7/14/2017
Existing Plus Project AM Synchro 8 ReportPage 10
Movement EBL EBT EBR WBL WBT WBR NBL NBT NBR SBL SBT SBRLane ConfigurationsVolume (vph) 137 8 271 20 42 148 82 1295 10 20 474 197Ideal Flow (vphpl) 1900 1900 1900 1900 1900 1900 1900 1900 1900 1900 1900 1900Total Lost time (s) 4.2 4.2 4.2 4.2 3.2 3.6 3.6 3.2 3.6 3.6Lane Util. Factor 1.00 1.00 1.00 1.00 1.00 0.95 1.00 1.00 0.95 1.00Frpb, ped/bikes 1.00 1.00 1.00 1.00 1.00 1.00 0.97 1.00 1.00 0.97Flpb, ped/bikes 1.00 1.00 1.00 1.00 1.00 1.00 1.00 1.00 1.00 1.00Frt 1.00 0.85 1.00 0.85 1.00 1.00 0.85 1.00 1.00 0.85Flt Protected 0.95 1.00 0.98 1.00 0.95 1.00 1.00 0.95 1.00 1.00Satd. Flow (prot) 1779 1583 1833 1583 1770 3539 1534 1770 3539 1532Flt Permitted 0.69 1.00 0.88 1.00 0.95 1.00 1.00 0.95 1.00 1.00Satd. Flow (perm) 1283 1583 1641 1583 1770 3539 1534 1770 3539 1532Peak-hour factor, PHF 0.91 0.91 0.91 0.91 0.91 0.91 0.91 0.91 0.91 0.91 0.91 0.91Adj. Flow (vph) 151 9 298 22 46 163 90 1423 11 22 521 216RTOR Reduction (vph) 0 0 236 0 0 129 0 0 4 0 0 102Lane Group Flow (vph) 0 160 62 0 68 34 90 1423 7 22 521 114Confl. Peds. (#/hr) 6 6 6 6Confl. Bikes (#/hr) 1Turn Type Perm NA Perm Perm NA Perm Prot NA Perm Prot NA PermProtected Phases 8 4 1 6 5 2Permitted Phases 8 8 4 4 6 2Actuated Green, G (s) 14.1 14.1 14.1 14.1 6.9 41.6 41.6 1.8 36.5 36.5Effective Green, g (s) 14.6 14.6 14.6 14.6 7.4 42.1 42.1 2.3 37.0 37.0Actuated g/C Ratio 0.21 0.21 0.21 0.21 0.11 0.60 0.60 0.03 0.53 0.53Clearance Time (s) 4.7 4.7 4.7 4.7 3.7 4.1 4.1 3.7 4.1 4.1Vehicle Extension (s) 3.0 3.0 3.0 3.0 3.0 3.0 3.0 3.0 3.0 3.0Lane Grp Cap (vph) 267 330 342 330 187 2128 922 58 1870 809v/s Ratio Prot c0.05 c0.40 0.01 0.15v/s Ratio Perm c0.12 0.04 0.04 0.02 0.00 0.07v/c Ratio 0.60 0.19 0.20 0.10 0.48 0.67 0.01 0.38 0.28 0.14Uniform Delay, d1 25.1 22.8 22.9 22.4 29.5 9.3 5.6 33.2 9.1 8.4Progression Factor 1.00 1.00 1.00 1.00 1.00 1.00 1.00 0.68 2.18 6.17Incremental Delay, d2 3.6 0.3 0.3 0.1 1.9 1.7 0.0 2.0 0.2 0.2Delay (s) 28.7 23.1 23.2 22.5 31.4 11.0 5.6 24.7 20.0 52.0Level of Service C C C C C B A C C DApproach Delay (s) 25.0 22.7 12.2 29.3Approach LOS C C B C
Intersection SummaryHCM 2000 Control Delay 19.3 HCM 2000 Level of Service BHCM 2000 Volume to Capacity ratio 0.66Actuated Cycle Length (s) 70.0 Sum of lost time (s) 11.0Intersection Capacity Utilization 68.1% ICU Level of Service CAnalysis Period (min) 15c Critical Lane Group

HCM Signalized Intersection Capacity Analysis11: Industrial Blvd & WB Ramp SR-92 7/14/2017
Existing Plus Project AM Synchro 8 ReportPage 11
Movement EBL EBT EBR WBL WBT WBR NBL NBT NBR SBL SBT SBRLane ConfigurationsVolume (vph) 42 12 20 113 149 10 469 919 158 4 570 354Ideal Flow (vphpl) 1900 1900 1900 1900 1900 1900 1900 1900 1900 1900 1900 1900Total Lost time (s) 4.2 4.2 4.2 4.2 3.2 3.6 3.2 3.6Lane Util. Factor 1.00 1.00 1.00 1.00 1.00 0.95 1.00 0.95Frpb, ped/bikes 1.00 1.00 1.00 1.00 1.00 1.00 1.00 0.99Flpb, ped/bikes 1.00 1.00 1.00 1.00 1.00 1.00 1.00 1.00Frt 1.00 0.85 1.00 0.85 1.00 0.98 1.00 0.94Flt Protected 0.96 1.00 0.98 1.00 0.95 1.00 0.95 1.00Satd. Flow (prot) 1793 1583 1823 1583 1770 3446 1770 3298Flt Permitted 0.47 1.00 0.83 1.00 0.95 1.00 0.95 1.00Satd. Flow (perm) 885 1583 1551 1583 1770 3446 1770 3298Peak-hour factor, PHF 0.90 0.90 0.90 0.90 0.90 0.90 0.90 0.90 0.90 0.90 0.90 0.90Adj. Flow (vph) 47 13 22 126 166 11 521 1021 176 4 633 393RTOR Reduction (vph) 0 0 17 0 0 9 0 17 0 0 136 0Lane Group Flow (vph) 0 60 5 0 292 2 521 1180 0 4 890 0Confl. Peds. (#/hr) 6 7 7 6Turn Type Perm NA Perm Perm NA Perm Prot NA Prot NAProtected Phases 8 4 1 6 5 2Permitted Phases 8 8 4 4Actuated Green, G (s) 14.2 14.2 14.2 14.2 21.8 41.9 1.4 21.5Effective Green, g (s) 14.7 14.7 14.7 14.7 22.3 42.4 1.9 22.0Actuated g/C Ratio 0.21 0.21 0.21 0.21 0.32 0.61 0.03 0.31Clearance Time (s) 4.7 4.7 4.7 4.7 3.7 4.1 3.7 4.1Vehicle Extension (s) 3.0 3.0 3.0 3.0 3.0 3.0 3.0 3.0Lane Grp Cap (vph) 185 332 325 332 563 2087 48 1036v/s Ratio Prot c0.29 0.34 0.00 c0.27v/s Ratio Perm 0.07 0.00 c0.19 0.00v/c Ratio 0.32 0.01 0.90 0.01 0.93 0.57 0.08 0.86Uniform Delay, d1 23.4 21.9 26.9 21.9 23.0 8.3 33.2 22.5Progression Factor 1.00 1.00 1.00 1.00 1.08 0.77 1.00 1.00Incremental Delay, d2 1.0 0.0 25.8 0.0 18.3 0.9 0.7 9.3Delay (s) 24.5 21.9 52.7 21.9 43.2 7.3 33.9 31.8Level of Service C C D C D A C CApproach Delay (s) 23.8 51.6 18.2 31.8Approach LOS C D B C
Intersection SummaryHCM 2000 Control Delay 26.0 HCM 2000 Level of Service CHCM 2000 Volume to Capacity ratio 0.89Actuated Cycle Length (s) 70.0 Sum of lost time (s) 11.0Intersection Capacity Utilization 89.4% ICU Level of Service EAnalysis Period (min) 15c Critical Lane Group
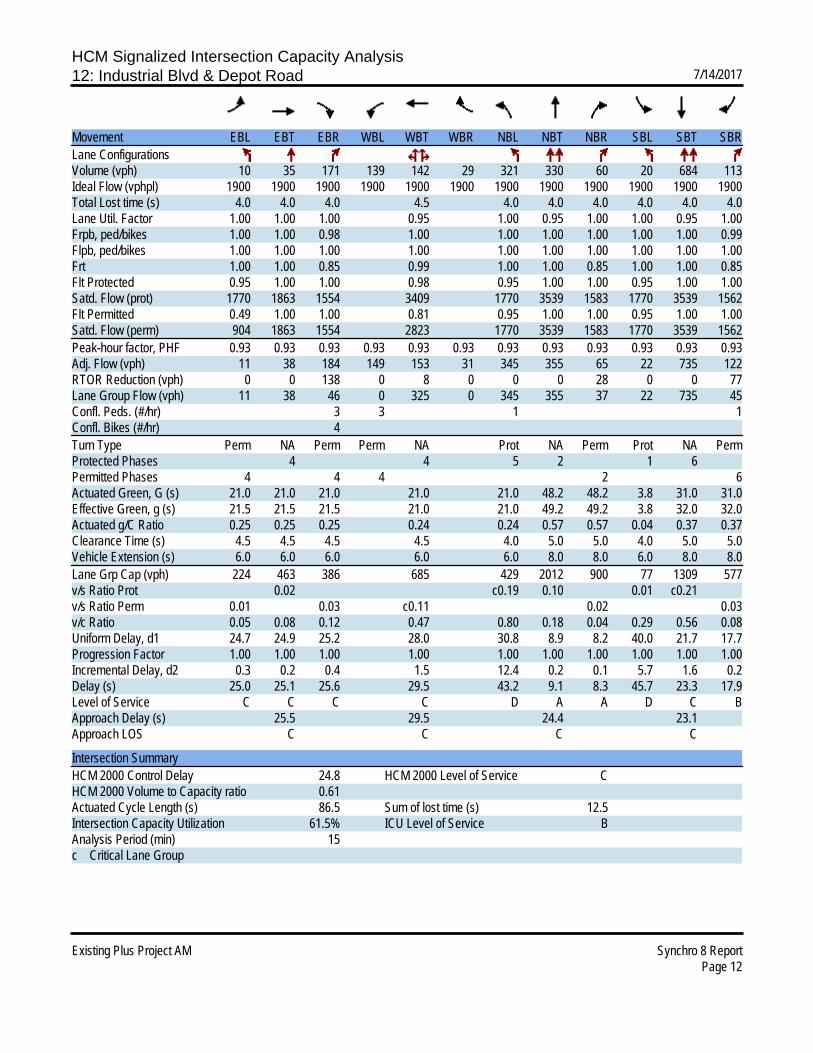
HCM Signalized Intersection Capacity Analysis12: Industrial Blvd & Depot Road 7/14/2017
Existing Plus Project AM Synchro 8 ReportPage 12
Movement EBL EBT EBR WBL WBT WBR NBL NBT NBR SBL SBT SBRLane ConfigurationsVolume (vph) 10 35 171 139 142 29 321 330 60 20 684 113Ideal Flow (vphpl) 1900 1900 1900 1900 1900 1900 1900 1900 1900 1900 1900 1900Total Lost time (s) 4.0 4.0 4.0 4.5 4.0 4.0 4.0 4.0 4.0 4.0Lane Util. Factor 1.00 1.00 1.00 0.95 1.00 0.95 1.00 1.00 0.95 1.00Frpb, ped/bikes 1.00 1.00 0.98 1.00 1.00 1.00 1.00 1.00 1.00 0.99Flpb, ped/bikes 1.00 1.00 1.00 1.00 1.00 1.00 1.00 1.00 1.00 1.00Frt 1.00 1.00 0.85 0.99 1.00 1.00 0.85 1.00 1.00 0.85Flt Protected 0.95 1.00 1.00 0.98 0.95 1.00 1.00 0.95 1.00 1.00Satd. Flow (prot) 1770 1863 1554 3409 1770 3539 1583 1770 3539 1562Flt Permitted 0.49 1.00 1.00 0.81 0.95 1.00 1.00 0.95 1.00 1.00Satd. Flow (perm) 904 1863 1554 2823 1770 3539 1583 1770 3539 1562Peak-hour factor, PHF 0.93 0.93 0.93 0.93 0.93 0.93 0.93 0.93 0.93 0.93 0.93 0.93Adj. Flow (vph) 11 38 184 149 153 31 345 355 65 22 735 122RTOR Reduction (vph) 0 0 138 0 8 0 0 0 28 0 0 77Lane Group Flow (vph) 11 38 46 0 325 0 345 355 37 22 735 45Confl. Peds. (#/hr) 3 3 1 1Confl. Bikes (#/hr) 4Turn Type Perm NA Perm Perm NA Prot NA Perm Prot NA PermProtected Phases 4 4 5 2 1 6Permitted Phases 4 4 4 2 6Actuated Green, G (s) 21.0 21.0 21.0 21.0 21.0 48.2 48.2 3.8 31.0 31.0Effective Green, g (s) 21.5 21.5 21.5 21.0 21.0 49.2 49.2 3.8 32.0 32.0Actuated g/C Ratio 0.25 0.25 0.25 0.24 0.24 0.57 0.57 0.04 0.37 0.37Clearance Time (s) 4.5 4.5 4.5 4.5 4.0 5.0 5.0 4.0 5.0 5.0Vehicle Extension (s) 6.0 6.0 6.0 6.0 6.0 8.0 8.0 6.0 8.0 8.0Lane Grp Cap (vph) 224 463 386 685 429 2012 900 77 1309 577v/s Ratio Prot 0.02 c0.19 0.10 0.01 c0.21v/s Ratio Perm 0.01 0.03 c0.11 0.02 0.03v/c Ratio 0.05 0.08 0.12 0.47 0.80 0.18 0.04 0.29 0.56 0.08Uniform Delay, d1 24.7 24.9 25.2 28.0 30.8 8.9 8.2 40.0 21.7 17.7Progression Factor 1.00 1.00 1.00 1.00 1.00 1.00 1.00 1.00 1.00 1.00Incremental Delay, d2 0.3 0.2 0.4 1.5 12.4 0.2 0.1 5.7 1.6 0.2Delay (s) 25.0 25.1 25.6 29.5 43.2 9.1 8.3 45.7 23.3 17.9Level of Service C C C C D A A D C BApproach Delay (s) 25.5 29.5 24.4 23.1Approach LOS C C C C
Intersection SummaryHCM 2000 Control Delay 24.8 HCM 2000 Level of Service CHCM 2000 Volume to Capacity ratio 0.61Actuated Cycle Length (s) 86.5 Sum of lost time (s) 12.5Intersection Capacity Utilization 61.5% ICU Level of Service BAnalysis Period (min) 15c Critical Lane Group

HCM Unsignalized Intersection Capacity Analysis13: Depot Road & West Driveway 7/14/2017
Existing Plus Project AM Synchro 8 ReportPage 13
Movement EBL EBT WBT WBR SBL SBRLane ConfigurationsVolume (veh/h) 33 423 402 72 16 10Sign Control Free Free StopGrade 0% 0% 0%Peak Hour Factor 0.91 0.91 0.91 0.91 0.91 0.91Hourly flow rate (vph) 36 465 442 79 18 11Pedestrians 2 29Lane Width (ft) 12.0 12.0Walking Speed (ft/s) 3.5 3.5Percent Blockage 0 3Right turn flare (veh)Median type None NoneMedian storage veh)Upstream signal (ft)pX, platoon unblockedvC, conflicting volume 550 817 510vC1, stage 1 conf volvC2, stage 2 conf volvCu, unblocked vol 550 817 510tC, single (s) 4.1 6.8 6.9tC, 2 stage (s)tF (s) 2.2 3.5 3.3p0 queue free % 96 94 98cM capacity (veh/h) 988 294 494
Direction, Lane # EB 1 EB 2 WB 1 SB 1Volume Total 191 310 521 29Volume Left 36 0 0 18Volume Right 0 0 79 11cSH 988 1700 1700 348Volume to Capacity 0.04 0.18 0.31 0.08Queue Length 95th (ft) 3 0 0 7Control Delay (s) 2.0 0.0 0.0 16.3Lane LOS A CApproach Delay (s) 0.7 0.0 16.3Approach LOS C
Intersection SummaryAverage Delay 0.8Intersection Capacity Utilization 46.8% ICU Level of Service AAnalysis Period (min) 15

HCM Unsignalized Intersection Capacity Analysis14: Dodge Ave/Lot E & Depot Road 7/14/2017
Existing Plus Project AM Synchro 8 ReportPage 14
Movement EBL EBT EBR WBL WBT WBR NBL NBT NBR SBL SBT SBRLane ConfigurationsSign Control Stop Stop Stop StopVolume (vph) 3 417 14 96 429 83 57 2 139 4 0 1Peak Hour Factor 0.92 0.92 0.92 0.92 0.92 0.92 0.92 0.92 0.92 0.92 0.92 0.92Hourly flow rate (vph) 3 453 15 104 466 90 62 2 151 4 0 1
Direction, Lane # EB 1 EB 2 WB 1 NB 1 SB 1Volume Total (vph) 230 242 661 215 5Volume Left (vph) 3 0 104 62 4Volume Right (vph) 0 15 90 151 1Hadj (s) 0.04 -0.01 -0.02 -0.33 0.07Departure Headway (s) 6.1 6.0 5.4 6.3 7.5Degree Utilization, x 0.39 0.41 0.98 0.37 0.01Capacity (veh/h) 579 591 665 563 446Control Delay (s) 11.7 11.9 53.5 13.0 10.6Approach Delay (s) 11.8 53.5 13.0 10.6Approach LOS B F B B
Intersection SummaryDelay 32.4Level of Service DIntersection Capacity Utilization 68.7% ICU Level of Service CAnalysis Period (min) 15

HCM Unsignalized Intersection Capacity Analysis15: Depot Road & Lot F 7/14/2017
Existing Plus Project AM Synchro 8 ReportPage 15
Movement EBL EBT WBT WBR SBL SBRLane ConfigurationsVolume (veh/h) 16 546 504 22 10 103Sign Control Free Free StopGrade 0% 0% 0%Peak Hour Factor 0.92 0.92 0.92 0.92 0.92 0.92Hourly flow rate (vph) 17 593 548 24 11 112Pedestrians 9Lane Width (ft) 12.0Walking Speed (ft/s) 3.5Percent Blockage 1Right turn flare (veh)Median type None NoneMedian storage veh)Upstream signal (ft) 957pX, platoon unblocked 0.99 0.99 0.99vC, conflicting volume 581 900 569vC1, stage 1 conf volvC2, stage 2 conf volvCu, unblocked vol 575 897 563tC, single (s) 4.1 6.8 6.9tC, 2 stage (s)tF (s) 2.2 3.5 3.3p0 queue free % 98 96 76cM capacity (veh/h) 980 271 463
Direction, Lane # EB 1 EB 2 WB 1 SB 1Volume Total 215 396 572 123Volume Left 17 0 0 11Volume Right 0 0 24 112cSH 980 1700 1700 435Volume to Capacity 0.02 0.23 0.34 0.28Queue Length 95th (ft) 1 0 0 29Control Delay (s) 0.9 0.0 0.0 16.5Lane LOS A CApproach Delay (s) 0.3 0.0 16.5Approach LOS C
Intersection SummaryAverage Delay 1.7Intersection Capacity Utilization 41.5% ICU Level of Service AAnalysis Period (min) 15

HCM Unsignalized Intersection Capacity Analysis16: Depot Road & Lot G 7/14/2017
Existing Plus Project AM Synchro 8 ReportPage 16
Movement EBL EBT WBT WBR SBL SBRLane ConfigurationsVolume (veh/h) 0 560 533 87 3 2Sign Control Free Free StopGrade 0% 0% 0%Peak Hour Factor 0.93 0.93 0.93 0.93 0.93 0.93Hourly flow rate (vph) 0 602 573 94 3 2Pedestrians 19 19 5Lane Width (ft) 12.0 12.0 12.0Walking Speed (ft/s) 3.5 3.5 3.5Percent Blockage 2 2 0Right turn flare (veh)Median type None NoneMedian storage veh)Upstream signal (ft) 529pX, platoon unblocked 0.95 0.95 0.95vC, conflicting volume 672 898 597vC1, stage 1 conf volvC2, stage 2 conf volvCu, unblocked vol 627 866 548tC, single (s) 4.1 6.8 6.9tC, 2 stage (s)tF (s) 2.2 3.5 3.3p0 queue free % 100 99 100cM capacity (veh/h) 898 271 445
Direction, Lane # EB 1 EB 2 WB 1 WB 2 SB 1Volume Total 201 401 573 94 5Volume Left 0 0 0 0 3Volume Right 0 0 0 94 2cSH 898 1700 1700 1700 322Volume to Capacity 0.00 0.24 0.34 0.06 0.02Queue Length 95th (ft) 0 0 0 0 1Control Delay (s) 0.0 0.0 0.0 0.0 16.4Lane LOS CApproach Delay (s) 0.0 0.0 16.4Approach LOS C
Intersection SummaryAverage Delay 0.1Intersection Capacity Utilization 42.7% ICU Level of Service AAnalysis Period (min) 15

HCM Signalized Intersection Capacity Analysis1: Hesperian Blvd & Winton Ave 7/14/2017
Existing Plus Project PM Synchro 8 ReportPage 1
Movement EBL EBT EBR WBL WBT WBR NBL NBT NBR SBL SBT SBRLane ConfigurationsVolume (vph) 753 1097 69 312 326 181 62 1297 257 171 745 193Ideal Flow (vphpl) 1900 1900 1900 1900 1900 1900 1900 1900 1900 1900 1900 1900Total Lost time (s) 4.0 4.0 4.0 4.0 4.0 4.0 4.0 4.0 4.0 4.0 2.5Lane Util. Factor 0.97 0.91 1.00 0.95 1.00 1.00 0.91 1.00 0.97 0.91 1.00Frpb, ped/bikes 1.00 1.00 1.00 1.00 0.98 1.00 1.00 0.98 1.00 1.00 0.99Flpb, ped/bikes 1.00 1.00 1.00 1.00 1.00 1.00 1.00 1.00 1.00 1.00 1.00Frt 1.00 0.99 1.00 1.00 0.85 1.00 1.00 0.85 1.00 1.00 0.85Flt Protected 0.95 1.00 0.95 1.00 1.00 0.95 1.00 1.00 0.95 1.00 1.00Satd. Flow (prot) 3433 5033 1770 3539 1551 1770 5085 1551 3433 5085 1562Flt Permitted 0.95 1.00 0.95 1.00 1.00 0.95 1.00 1.00 0.95 1.00 1.00Satd. Flow (perm) 3433 5033 1770 3539 1551 1770 5085 1551 3433 5085 1562Peak-hour factor, PHF 0.98 0.98 0.98 0.98 0.98 0.98 0.98 0.98 0.98 0.98 0.98 0.98Adj. Flow (vph) 768 1119 70 318 333 185 63 1323 262 174 760 197RTOR Reduction (vph) 0 5 0 0 0 78 0 0 81 0 0 0Lane Group Flow (vph) 768 1184 0 318 333 107 63 1323 181 174 760 197Confl. Peds. (#/hr) 6 10 10 6 4 7 7 4Turn Type Prot NA Prot NA Perm Prot NA Perm Prot NA FreeProtected Phases 3 8 7 4 5 2 1 6Permitted Phases 4 2 FreeActuated Green, G (s) 8.5 34.5 10.5 36.5 36.5 6.5 70.5 70.5 9.5 73.5 145.0Effective Green, g (s) 9.0 36.0 11.0 38.0 38.0 7.0 72.0 72.0 10.0 75.0 145.0Actuated g/C Ratio 0.06 0.25 0.08 0.26 0.26 0.05 0.50 0.50 0.07 0.52 1.00Clearance Time (s) 4.5 5.5 4.5 5.5 5.5 4.5 5.5 5.5 4.5 5.5Vehicle Extension (s) 3.0 3.0 3.0 3.0 3.0 3.0 3.0 3.0 3.0 3.0Lane Grp Cap (vph) 213 1249 134 927 406 85 2524 770 236 2630 1562v/s Ratio Prot c0.22 c0.24 0.18 0.09 0.04 c0.26 c0.05 0.15v/s Ratio Perm 0.07 0.12 c0.13v/c Ratio 3.61 0.95 2.37 0.36 0.26 0.74 0.52 0.24 0.74 0.29 0.13Uniform Delay, d1 68.0 53.6 67.0 43.6 42.4 68.1 24.8 20.8 66.2 19.9 0.0Progression Factor 1.00 1.00 1.00 1.00 1.00 1.00 1.00 1.00 1.00 1.00 1.00Incremental Delay, d2 1184.1 14.7 640.3 0.2 0.3 28.9 0.8 0.7 11.4 0.3 0.2Delay (s) 1252.1 68.3 707.3 43.8 42.7 97.1 25.6 21.5 77.6 20.1 0.2Level of Service F E F D D F C C E C AApproach Delay (s) 532.8 296.0 27.7 25.5Approach LOS F F C C
Intersection SummaryHCM 2000 Control Delay 244.9 HCM 2000 Level of Service FHCM 2000 Volume to Capacity ratio 0.86Actuated Cycle Length (s) 145.0 Sum of lost time (s) 16.0Intersection Capacity Utilization 90.0% ICU Level of Service EAnalysis Period (min) 15c Critical Lane Group

HCM Signalized Intersection Capacity Analysis2: Hesperian Blvd & Southland Drive 7/14/2017
Existing Plus Project PM Synchro 8 ReportPage 2
Movement EBL EBT EBR WBL WBT WBR NBL NBT NBR SBL SBT SBRLane ConfigurationsVolume (vph) 194 467 56 90 101 129 61 1341 130 177 799 120Ideal Flow (vphpl) 1900 1900 1900 1900 1900 1900 1900 1900 1900 1900 1900 1900Total Lost time (s) 4.0 4.0 4.0 4.0 4.0 4.0 4.0 4.0Lane Util. Factor 1.00 0.95 1.00 0.91 1.00 0.91 1.00 0.91Frpb, ped/bikes 1.00 1.00 1.00 0.99 1.00 1.00 1.00 1.00Flpb, ped/bikes 1.00 1.00 0.99 1.00 1.00 1.00 1.00 1.00Frt 1.00 0.98 1.00 0.92 1.00 0.99 1.00 0.98Flt Protected 0.95 1.00 0.95 1.00 0.95 1.00 0.95 1.00Satd. Flow (prot) 1767 3471 1758 4618 1770 5012 1770 4974Flt Permitted 0.59 1.00 0.25 1.00 0.95 1.00 0.95 1.00Satd. Flow (perm) 1094 3471 468 4618 1770 5012 1770 4974Peak-hour factor, PHF 0.94 0.94 0.94 0.94 0.94 0.94 0.94 0.94 0.94 0.94 0.94 0.94Adj. Flow (vph) 206 497 60 96 107 137 65 1427 138 188 850 128RTOR Reduction (vph) 0 10 0 0 102 0 0 10 0 0 14 0Lane Group Flow (vph) 206 547 0 96 142 0 65 1555 0 188 964 0Confl. Peds. (#/hr) 2 16 16 2 4 1 1 4Confl. Bikes (#/hr) 1 1Turn Type Perm NA Perm NA Prot NA Prot NAProtected Phases 8 4 1 6 5 2Permitted Phases 8 4Actuated Green, G (s) 27.9 27.9 27.9 27.9 7.6 50.8 18.7 61.9Effective Green, g (s) 27.9 27.9 27.9 27.9 7.6 51.4 18.7 62.5Actuated g/C Ratio 0.25 0.25 0.25 0.25 0.07 0.47 0.17 0.57Clearance Time (s) 4.0 4.0 4.0 4.0 4.0 4.6 4.0 4.6Vehicle Extension (s) 3.0 3.0 3.0 3.0 3.0 3.0 3.0 3.0Lane Grp Cap (vph) 277 880 118 1171 122 2341 300 2826v/s Ratio Prot 0.16 0.03 0.04 c0.31 c0.11 0.19v/s Ratio Perm 0.19 c0.20v/c Ratio 0.74 0.62 0.81 0.12 0.53 0.66 0.63 0.34Uniform Delay, d1 37.8 36.4 38.6 31.6 49.5 22.6 42.4 12.7Progression Factor 1.00 1.00 1.00 1.00 0.75 1.63 1.00 1.00Incremental Delay, d2 10.3 1.4 33.2 0.0 3.9 1.3 4.1 0.3Delay (s) 48.1 37.8 71.8 31.7 40.9 38.1 46.5 13.0Level of Service D D E C D D D BApproach Delay (s) 40.5 43.0 38.2 18.4Approach LOS D D D B
Intersection SummaryHCM 2000 Control Delay 33.2 HCM 2000 Level of Service CHCM 2000 Volume to Capacity ratio 0.70Actuated Cycle Length (s) 110.0 Sum of lost time (s) 12.0Intersection Capacity Utilization 78.9% ICU Level of Service DAnalysis Period (min) 15c Critical Lane Group

HCM Signalized Intersection Capacity Analysis3: Hesperian Blvd & Turner Court 7/14/2017
Existing Plus Project PM Synchro 8 ReportPage 3
Movement EBL EBT EBR WBL WBT WBR NBL NBT NBR SBL SBT SBRLane ConfigurationsVolume (vph) 148 25 45 56 16 60 60 1485 53 104 872 121Ideal Flow (vphpl) 1900 1900 1900 1900 1900 1900 1900 1900 1900 1900 1900 1900Total Lost time (s) 4.0 4.0 4.0 4.6 4.0 4.0 4.0 4.0Lane Util. Factor 1.00 1.00 1.00 1.00 1.00 0.91 1.00 0.91Frpb, ped/bikes 1.00 0.97 1.00 0.99 1.00 1.00 1.00 0.99Flpb, ped/bikes 1.00 1.00 0.97 1.00 1.00 1.00 1.00 1.00Frt 1.00 0.90 1.00 0.85 1.00 0.99 1.00 0.98Flt Protected 0.95 1.00 0.96 1.00 0.95 1.00 0.95 1.00Satd. Flow (prot) 1768 1627 1741 1562 1770 5049 1770 4966Flt Permitted 0.71 1.00 0.75 1.00 0.95 1.00 0.95 1.00Satd. Flow (perm) 1315 1627 1348 1562 1770 5049 1770 4966Peak-hour factor, PHF 0.94 0.94 0.94 0.94 0.94 0.94 0.94 0.94 0.94 0.94 0.94 0.94Adj. Flow (vph) 157 27 48 60 17 64 64 1580 56 111 928 129RTOR Reduction (vph) 0 39 0 0 0 53 0 3 0 0 10 0Lane Group Flow (vph) 157 36 0 0 77 11 64 1633 0 111 1047 0Confl. Peds. (#/hr) 1 40 40 1 10 19 19 10Turn Type Perm NA Perm NA Perm Prot NA Prot NAProtected Phases 4 8 1 6 5 2Permitted Phases 4 8 8Actuated Green, G (s) 19.6 19.6 19.6 19.6 8.2 66.0 11.2 69.0Effective Green, g (s) 20.2 20.2 20.2 19.6 8.2 66.6 11.2 69.6Actuated g/C Ratio 0.18 0.18 0.18 0.18 0.07 0.61 0.10 0.63Clearance Time (s) 4.6 4.6 4.6 4.6 4.0 4.6 4.0 4.6Vehicle Extension (s) 3.0 3.0 3.0 3.0 3.0 3.0 3.0 3.0Lane Grp Cap (vph) 241 298 247 278 131 3056 180 3142v/s Ratio Prot 0.02 0.04 c0.32 c0.06 c0.21v/s Ratio Perm c0.12 0.06 0.01v/c Ratio 0.65 0.12 0.31 0.04 0.49 0.53 0.62 0.33Uniform Delay, d1 41.6 37.5 38.9 37.4 48.9 12.7 47.3 9.4Progression Factor 1.00 1.00 1.00 1.00 1.00 1.00 0.93 1.10Incremental Delay, d2 6.2 0.2 0.7 0.1 2.9 0.7 5.9 0.3Delay (s) 47.8 37.7 39.6 37.5 51.7 13.3 49.8 10.6Level of Service D D D D D B D BApproach Delay (s) 44.5 38.6 14.8 14.3Approach LOS D D B B
Intersection SummaryHCM 2000 Control Delay 17.8 HCM 2000 Level of Service BHCM 2000 Volume to Capacity ratio 0.56Actuated Cycle Length (s) 110.0 Sum of lost time (s) 12.0Intersection Capacity Utilization 69.3% ICU Level of Service CAnalysis Period (min) 15c Critical Lane Group

HCM Signalized Intersection Capacity Analysis4: Hesperian Blvd & East Driveway 7/14/2017
Existing Plus Project PM Synchro 8 ReportPage 4
Movement EBL EBR NBL NBT SBU SBT SBRLane ConfigurationsVolume (vph) 84 126 92 1543 0 931 49Ideal Flow (vphpl) 1900 1900 1900 1900 1900 1900 1900Total Lost time (s) 4.0 4.0 4.0 4.0 4.0Lane Util. Factor 1.00 1.00 1.00 0.91 0.91Frpb, ped/bikes 1.00 0.98 1.00 1.00 1.00Flpb, ped/bikes 1.00 1.00 1.00 1.00 1.00Frt 1.00 0.85 1.00 1.00 0.99Flt Protected 0.95 1.00 0.95 1.00 1.00Satd. Flow (prot) 1770 1555 1770 5085 5041Flt Permitted 0.95 1.00 0.95 1.00 1.00Satd. Flow (perm) 1770 1555 1770 5085 5041Peak-hour factor, PHF 0.95 0.95 0.95 0.95 0.95 0.95 0.95Adj. Flow (vph) 88 133 97 1624 0 980 52RTOR Reduction (vph) 0 119 0 0 0 3 0Lane Group Flow (vph) 88 14 97 1624 0 1029 0Confl. Peds. (#/hr) 4 1 5 1Turn Type Prot Perm Prot NA Prot NAProtected Phases 4 1 6 5 2Permitted Phases 4Actuated Green, G (s) 13.9 13.9 11.4 107.1 91.7Effective Green, g (s) 13.9 13.9 11.4 108.1 92.7Actuated g/C Ratio 0.11 0.11 0.09 0.83 0.71Clearance Time (s) 4.0 4.0 4.0 5.0 5.0Vehicle Extension (s) 3.0 3.0 3.0 3.0 3.0Lane Grp Cap (vph) 189 166 155 4228 3594v/s Ratio Prot c0.05 c0.05 c0.32 0.20v/s Ratio Perm 0.01v/c Ratio 0.47 0.09 0.63 0.38 0.29Uniform Delay, d1 54.6 52.3 57.2 2.7 6.7Progression Factor 1.00 1.00 0.88 1.20 1.00Incremental Delay, d2 1.8 0.2 6.7 0.2 0.2Delay (s) 56.4 52.5 57.1 3.5 6.9Level of Service E D E A AApproach Delay (s) 54.1 6.5 6.9Approach LOS D A A
Intersection SummaryHCM 2000 Control Delay 10.2 HCM 2000 Level of Service BHCM 2000 Volume to Capacity ratio 0.43Actuated Cycle Length (s) 130.0 Sum of lost time (s) 12.0Intersection Capacity Utilization 51.7% ICU Level of Service AAnalysis Period (min) 15c Critical Lane Group
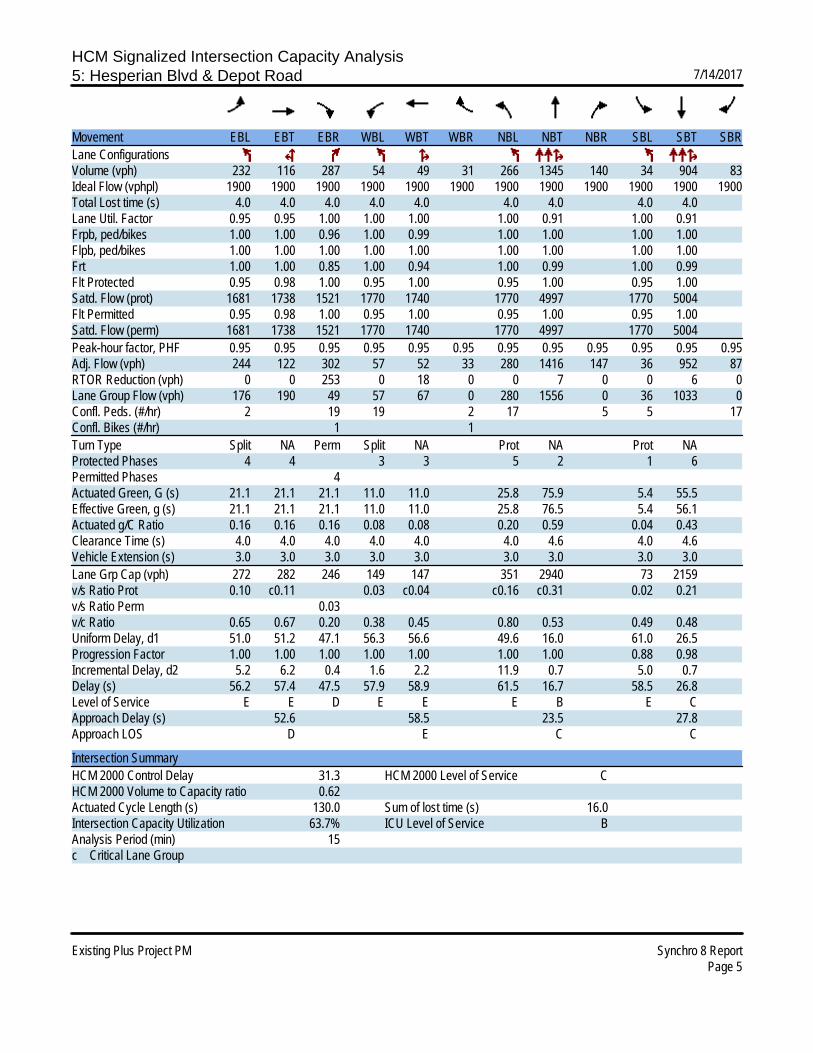
HCM Signalized Intersection Capacity Analysis5: Hesperian Blvd & Depot Road 7/14/2017
Existing Plus Project PM Synchro 8 ReportPage 5
Movement EBL EBT EBR WBL WBT WBR NBL NBT NBR SBL SBT SBRLane ConfigurationsVolume (vph) 232 116 287 54 49 31 266 1345 140 34 904 83Ideal Flow (vphpl) 1900 1900 1900 1900 1900 1900 1900 1900 1900 1900 1900 1900Total Lost time (s) 4.0 4.0 4.0 4.0 4.0 4.0 4.0 4.0 4.0Lane Util. Factor 0.95 0.95 1.00 1.00 1.00 1.00 0.91 1.00 0.91Frpb, ped/bikes 1.00 1.00 0.96 1.00 0.99 1.00 1.00 1.00 1.00Flpb, ped/bikes 1.00 1.00 1.00 1.00 1.00 1.00 1.00 1.00 1.00Frt 1.00 1.00 0.85 1.00 0.94 1.00 0.99 1.00 0.99Flt Protected 0.95 0.98 1.00 0.95 1.00 0.95 1.00 0.95 1.00Satd. Flow (prot) 1681 1738 1521 1770 1740 1770 4997 1770 5004Flt Permitted 0.95 0.98 1.00 0.95 1.00 0.95 1.00 0.95 1.00Satd. Flow (perm) 1681 1738 1521 1770 1740 1770 4997 1770 5004Peak-hour factor, PHF 0.95 0.95 0.95 0.95 0.95 0.95 0.95 0.95 0.95 0.95 0.95 0.95Adj. Flow (vph) 244 122 302 57 52 33 280 1416 147 36 952 87RTOR Reduction (vph) 0 0 253 0 18 0 0 7 0 0 6 0Lane Group Flow (vph) 176 190 49 57 67 0 280 1556 0 36 1033 0Confl. Peds. (#/hr) 2 19 19 2 17 5 5 17Confl. Bikes (#/hr) 1 1Turn Type Split NA Perm Split NA Prot NA Prot NAProtected Phases 4 4 3 3 5 2 1 6Permitted Phases 4Actuated Green, G (s) 21.1 21.1 21.1 11.0 11.0 25.8 75.9 5.4 55.5Effective Green, g (s) 21.1 21.1 21.1 11.0 11.0 25.8 76.5 5.4 56.1Actuated g/C Ratio 0.16 0.16 0.16 0.08 0.08 0.20 0.59 0.04 0.43Clearance Time (s) 4.0 4.0 4.0 4.0 4.0 4.0 4.6 4.0 4.6Vehicle Extension (s) 3.0 3.0 3.0 3.0 3.0 3.0 3.0 3.0 3.0Lane Grp Cap (vph) 272 282 246 149 147 351 2940 73 2159v/s Ratio Prot 0.10 c0.11 0.03 c0.04 c0.16 c0.31 0.02 0.21v/s Ratio Perm 0.03v/c Ratio 0.65 0.67 0.20 0.38 0.45 0.80 0.53 0.49 0.48Uniform Delay, d1 51.0 51.2 47.1 56.3 56.6 49.6 16.0 61.0 26.5Progression Factor 1.00 1.00 1.00 1.00 1.00 1.00 1.00 0.88 0.98Incremental Delay, d2 5.2 6.2 0.4 1.6 2.2 11.9 0.7 5.0 0.7Delay (s) 56.2 57.4 47.5 57.9 58.9 61.5 16.7 58.5 26.8Level of Service E E D E E E B E CApproach Delay (s) 52.6 58.5 23.5 27.8Approach LOS D E C C
Intersection SummaryHCM 2000 Control Delay 31.3 HCM 2000 Level of Service CHCM 2000 Volume to Capacity ratio 0.62Actuated Cycle Length (s) 130.0 Sum of lost time (s) 16.0Intersection Capacity Utilization 63.7% ICU Level of Service BAnalysis Period (min) 15c Critical Lane Group

HCM Signalized Intersection Capacity Analysis6: Hesperian Blvd & WB Ramp SR-92 7/14/2017
Existing Plus Project PM Synchro 8 ReportPage 6
Movement EBL EBR NBL NBT SBT SBRLane ConfigurationsVolume (vph) 323 423 74 1481 1149 113Ideal Flow (vphpl) 1900 1900 1900 1900 1900 1900Total Lost time (s) 3.7 3.7 3.7 4.1 4.1Lane Util. Factor 0.97 1.00 1.00 0.91 0.91Frpb, ped/bikes 1.00 1.00 1.00 1.00 1.00Flpb, ped/bikes 1.00 1.00 1.00 1.00 1.00Frt 1.00 0.85 1.00 1.00 0.99Flt Protected 0.95 1.00 0.95 1.00 1.00Satd. Flow (prot) 3433 1583 1770 5085 5001Flt Permitted 0.95 1.00 0.95 1.00 1.00Satd. Flow (perm) 3433 1583 1770 5085 5001Peak-hour factor, PHF 0.97 0.97 0.97 0.97 0.97 0.97Adj. Flow (vph) 333 436 76 1527 1185 116RTOR Reduction (vph) 0 267 0 0 10 0Lane Group Flow (vph) 333 169 76 1527 1291 0Confl. Peds. (#/hr) 13 13Turn Type Perm Perm Prot NA NAProtected Phases 5 2 6Permitted Phases 4 4Actuated Green, G (s) 14.3 14.3 8.1 66.9 54.6Effective Green, g (s) 14.8 14.8 8.6 67.4 55.1Actuated g/C Ratio 0.16 0.16 0.10 0.75 0.61Clearance Time (s) 4.2 4.2 4.2 4.6 4.6Vehicle Extension (s) 3.0 3.0 3.0 3.0 3.0Lane Grp Cap (vph) 564 260 169 3808 3061v/s Ratio Prot 0.04 c0.30 c0.26v/s Ratio Perm 0.10 c0.11v/c Ratio 0.59 0.65 0.45 0.40 0.42Uniform Delay, d1 34.8 35.2 38.5 4.1 9.1Progression Factor 1.00 1.00 0.87 1.33 1.00Incremental Delay, d2 1.7 5.5 1.1 0.2 0.4Delay (s) 36.5 40.6 34.7 5.6 9.6Level of Service D D C A AApproach Delay (s) 38.8 7.0 9.6Approach LOS D A A
Intersection SummaryHCM 2000 Control Delay 14.6 HCM 2000 Level of Service BHCM 2000 Volume to Capacity ratio 0.47Actuated Cycle Length (s) 90.0 Sum of lost time (s) 12.0Intersection Capacity Utilization 61.3% ICU Level of Service BAnalysis Period (min) 15c Critical Lane Group

HCM Signalized Intersection Capacity Analysis7: Hesperian Blvd & EB Ramp SR-92 7/14/2017
Existing Plus Project PM Synchro 8 ReportPage 7
Movement EBL EBT EBR WBL WBT WBR NBL NBT NBR SBL SBT SBRLane ConfigurationsVolume (vph) 141 1 61 0 0 0 0 1377 416 250 1348 0Ideal Flow (vphpl) 1900 1900 1900 1900 1900 1900 1900 1900 1900 1900 1900 1900Total Lost time (s) 3.7 3.7 4.1 4.1 3.7 4.1Lane Util. Factor 1.00 0.88 0.95 1.00 1.00 0.91Frpb, ped/bikes 1.00 1.00 1.00 0.98 1.00 1.00Flpb, ped/bikes 1.00 1.00 1.00 1.00 1.00 1.00Frt 1.00 0.85 1.00 0.85 1.00 1.00Flt Protected 0.95 1.00 1.00 1.00 0.95 1.00Satd. Flow (prot) 1775 2787 3539 1551 1770 5085Flt Permitted 0.95 1.00 1.00 1.00 0.95 1.00Satd. Flow (perm) 1775 2787 3539 1551 1770 5085Peak-hour factor, PHF 0.92 0.92 0.92 0.92 0.92 0.92 0.92 0.92 0.92 0.92 0.92 0.92Adj. Flow (vph) 153 1 66 0 0 0 0 1497 452 272 1465 0RTOR Reduction (vph) 0 0 56 0 0 0 0 0 118 0 0 0Lane Group Flow (vph) 0 154 10 0 0 0 0 1497 334 272 1465 0Confl. Peds. (#/hr) 16 6 6Turn Type Perm NA Perm NA Perm Prot NAProtected Phases 4 2 1 6Permitted Phases 4 4 2Actuated Green, G (s) 13.1 13.1 45.6 45.6 18.3 68.1Effective Green, g (s) 13.6 13.6 46.1 46.1 18.8 68.6Actuated g/C Ratio 0.15 0.15 0.51 0.51 0.21 0.76Clearance Time (s) 4.2 4.2 4.6 4.6 4.2 4.6Vehicle Extension (s) 3.0 3.0 3.0 3.0 3.0 3.0Lane Grp Cap (vph) 268 421 1812 794 369 3875v/s Ratio Prot c0.42 c0.15 0.29v/s Ratio Perm 0.09 0.00 0.22v/c Ratio 0.57 0.02 0.83 0.42 0.74 0.38Uniform Delay, d1 35.5 32.5 18.6 13.7 33.3 3.6Progression Factor 1.00 1.00 1.00 1.00 1.28 0.78Incremental Delay, d2 3.0 0.0 4.5 1.6 6.7 0.3Delay (s) 38.5 32.6 23.0 15.3 49.3 3.0Level of Service D C C B D AApproach Delay (s) 36.7 0.0 21.2 10.3Approach LOS D A C B
Intersection SummaryHCM 2000 Control Delay 17.2 HCM 2000 Level of Service BHCM 2000 Volume to Capacity ratio 0.76Actuated Cycle Length (s) 90.0 Sum of lost time (s) 11.5Intersection Capacity Utilization 69.9% ICU Level of Service CAnalysis Period (min) 15c Critical Lane Group

HCM Signalized Intersection Capacity Analysis8: Hesperian Blvd & Sleepy Hollow Ave 7/14/2017
Existing Plus Project PM Synchro 8 ReportPage 8
Movement EBL EBT EBR WBL WBT WBR NBL NBT NBR SBL SBT SBRLane ConfigurationsVolume (vph) 122 48 55 16 30 122 39 1528 41 109 1153 125Ideal Flow (vphpl) 1900 1900 1900 1900 1900 1900 1900 1900 1900 1900 1900 1900Total Lost time (s) 4.0 4.0 4.0 4.0 4.0 4.0 4.0 4.0 4.0 4.0Lane Util. Factor 1.00 1.00 1.00 1.00 1.00 1.00 1.00 0.91 1.00 0.91Frpb, ped/bikes 1.00 1.00 0.97 1.00 1.00 0.98 1.00 1.00 1.00 1.00Flpb, ped/bikes 0.99 1.00 1.00 0.98 1.00 1.00 1.00 1.00 1.00 1.00Frt 1.00 1.00 0.85 1.00 1.00 0.85 1.00 1.00 1.00 0.99Flt Protected 0.95 1.00 1.00 0.95 1.00 1.00 0.95 1.00 0.95 1.00Satd. Flow (prot) 1753 1863 1534 1740 1863 1549 1770 5061 1770 4995Flt Permitted 0.74 1.00 1.00 0.72 1.00 1.00 0.95 1.00 0.95 1.00Satd. Flow (perm) 1357 1863 1534 1324 1863 1549 1770 5061 1770 4995Peak-hour factor, PHF 0.92 0.92 0.92 0.92 0.92 0.92 0.92 0.92 0.92 0.92 0.92 0.92Adj. Flow (vph) 133 52 60 17 33 133 42 1661 45 118 1253 136RTOR Reduction (vph) 0 0 51 0 0 112 0 1 0 0 7 0Lane Group Flow (vph) 133 52 9 17 33 21 42 1705 0 118 1382 0Confl. Peds. (#/hr) 8 15 15 8 5 4 4 5Confl. Bikes (#/hr) 1 2Turn Type Perm NA Perm Perm NA Perm Prot NA Prot NAProtected Phases 8 4 5 2 1 6Permitted Phases 8 8 4 4Actuated Green, G (s) 19.4 19.4 19.4 19.4 19.4 19.4 7.4 82.6 14.0 89.2Effective Green, g (s) 20.4 20.4 20.4 20.4 20.4 20.4 7.4 83.6 14.0 90.2Actuated g/C Ratio 0.16 0.16 0.16 0.16 0.16 0.16 0.06 0.64 0.11 0.69Clearance Time (s) 5.0 5.0 5.0 5.0 5.0 5.0 4.0 5.0 4.0 5.0Vehicle Extension (s) 3.0 3.0 3.0 3.0 3.0 3.0 3.0 3.0 3.0 3.0Lane Grp Cap (vph) 212 292 240 207 292 243 100 3254 190 3465v/s Ratio Prot 0.03 0.02 0.02 c0.34 c0.07 0.28v/s Ratio Perm c0.10 0.01 0.01 0.01v/c Ratio 0.63 0.18 0.04 0.08 0.11 0.09 0.42 0.52 0.62 0.40Uniform Delay, d1 51.2 47.5 46.5 46.8 47.0 46.8 59.2 12.5 55.5 8.4Progression Factor 1.00 1.00 1.00 1.00 1.00 1.00 0.62 2.47 1.00 1.00Incremental Delay, d2 5.7 0.3 0.1 0.2 0.2 0.2 2.0 0.4 6.2 0.3Delay (s) 56.9 47.8 46.6 47.0 47.2 47.0 39.0 31.2 61.6 8.8Level of Service E D D D D D D C E AApproach Delay (s) 52.5 47.0 31.4 12.9Approach LOS D D C B
Intersection SummaryHCM 2000 Control Delay 26.0 HCM 2000 Level of Service CHCM 2000 Volume to Capacity ratio 0.55Actuated Cycle Length (s) 130.0 Sum of lost time (s) 12.0Intersection Capacity Utilization 65.1% ICU Level of Service CAnalysis Period (min) 15c Critical Lane Group
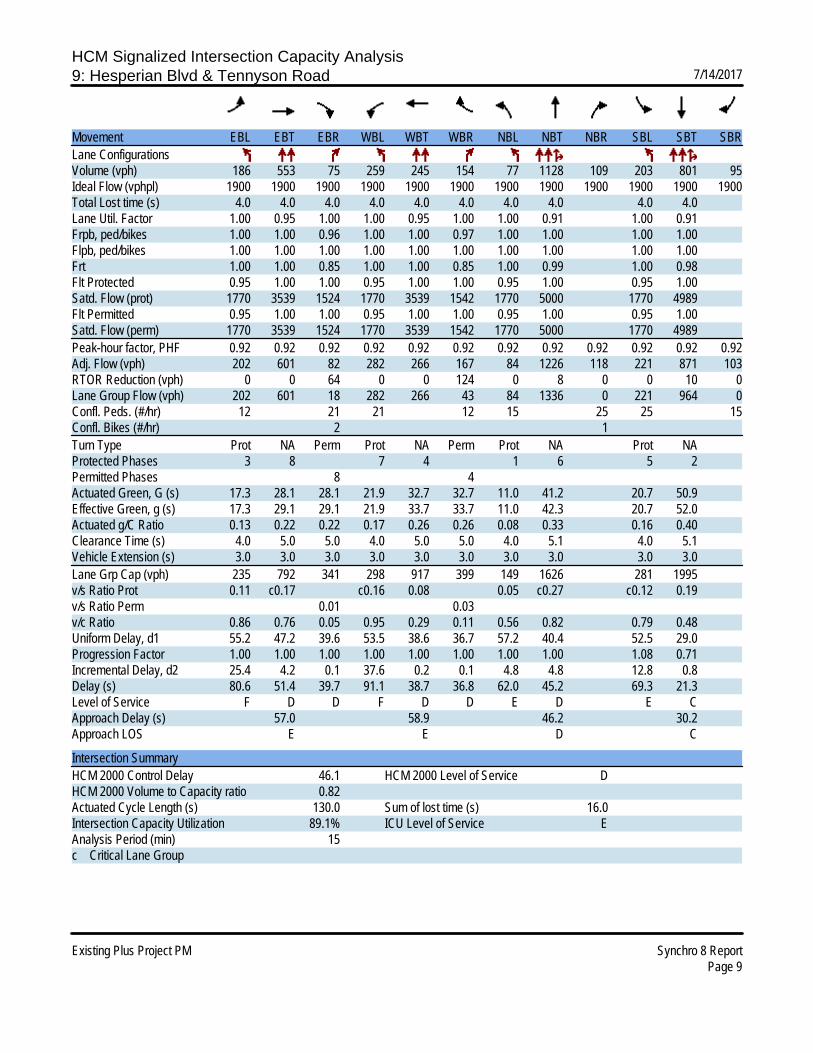
HCM Signalized Intersection Capacity Analysis9: Hesperian Blvd & Tennyson Road 7/14/2017
Existing Plus Project PM Synchro 8 ReportPage 9
Movement EBL EBT EBR WBL WBT WBR NBL NBT NBR SBL SBT SBRLane ConfigurationsVolume (vph) 186 553 75 259 245 154 77 1128 109 203 801 95Ideal Flow (vphpl) 1900 1900 1900 1900 1900 1900 1900 1900 1900 1900 1900 1900Total Lost time (s) 4.0 4.0 4.0 4.0 4.0 4.0 4.0 4.0 4.0 4.0Lane Util. Factor 1.00 0.95 1.00 1.00 0.95 1.00 1.00 0.91 1.00 0.91Frpb, ped/bikes 1.00 1.00 0.96 1.00 1.00 0.97 1.00 1.00 1.00 1.00Flpb, ped/bikes 1.00 1.00 1.00 1.00 1.00 1.00 1.00 1.00 1.00 1.00Frt 1.00 1.00 0.85 1.00 1.00 0.85 1.00 0.99 1.00 0.98Flt Protected 0.95 1.00 1.00 0.95 1.00 1.00 0.95 1.00 0.95 1.00Satd. Flow (prot) 1770 3539 1524 1770 3539 1542 1770 5000 1770 4989Flt Permitted 0.95 1.00 1.00 0.95 1.00 1.00 0.95 1.00 0.95 1.00Satd. Flow (perm) 1770 3539 1524 1770 3539 1542 1770 5000 1770 4989Peak-hour factor, PHF 0.92 0.92 0.92 0.92 0.92 0.92 0.92 0.92 0.92 0.92 0.92 0.92Adj. Flow (vph) 202 601 82 282 266 167 84 1226 118 221 871 103RTOR Reduction (vph) 0 0 64 0 0 124 0 8 0 0 10 0Lane Group Flow (vph) 202 601 18 282 266 43 84 1336 0 221 964 0Confl. Peds. (#/hr) 12 21 21 12 15 25 25 15Confl. Bikes (#/hr) 2 1Turn Type Prot NA Perm Prot NA Perm Prot NA Prot NAProtected Phases 3 8 7 4 1 6 5 2Permitted Phases 8 4Actuated Green, G (s) 17.3 28.1 28.1 21.9 32.7 32.7 11.0 41.2 20.7 50.9Effective Green, g (s) 17.3 29.1 29.1 21.9 33.7 33.7 11.0 42.3 20.7 52.0Actuated g/C Ratio 0.13 0.22 0.22 0.17 0.26 0.26 0.08 0.33 0.16 0.40Clearance Time (s) 4.0 5.0 5.0 4.0 5.0 5.0 4.0 5.1 4.0 5.1Vehicle Extension (s) 3.0 3.0 3.0 3.0 3.0 3.0 3.0 3.0 3.0 3.0Lane Grp Cap (vph) 235 792 341 298 917 399 149 1626 281 1995v/s Ratio Prot 0.11 c0.17 c0.16 0.08 0.05 c0.27 c0.12 0.19v/s Ratio Perm 0.01 0.03v/c Ratio 0.86 0.76 0.05 0.95 0.29 0.11 0.56 0.82 0.79 0.48Uniform Delay, d1 55.2 47.2 39.6 53.5 38.6 36.7 57.2 40.4 52.5 29.0Progression Factor 1.00 1.00 1.00 1.00 1.00 1.00 1.00 1.00 1.08 0.71Incremental Delay, d2 25.4 4.2 0.1 37.6 0.2 0.1 4.8 4.8 12.8 0.8Delay (s) 80.6 51.4 39.7 91.1 38.7 36.8 62.0 45.2 69.3 21.3Level of Service F D D F D D E D E CApproach Delay (s) 57.0 58.9 46.2 30.2Approach LOS E E D C
Intersection SummaryHCM 2000 Control Delay 46.1 HCM 2000 Level of Service DHCM 2000 Volume to Capacity ratio 0.82Actuated Cycle Length (s) 130.0 Sum of lost time (s) 16.0Intersection Capacity Utilization 89.1% ICU Level of Service EAnalysis Period (min) 15c Critical Lane Group

HCM Signalized Intersection Capacity Analysis10: Industrial Blvd & EB Ramp SR-92 7/14/2017
Existing Plus Project PM Synchro 8 ReportPage 10
Movement EBL EBT EBR WBL WBT WBR NBL NBT NBR SBL SBT SBRLane ConfigurationsVolume (vph) 219 83 712 1 8 45 55 835 18 61 784 220Ideal Flow (vphpl) 1900 1900 1900 1900 1900 1900 1900 1900 1900 1900 1900 1900Total Lost time (s) 4.2 4.2 4.2 4.2 3.2 3.6 3.6 3.2 3.6 3.6Lane Util. Factor 1.00 1.00 1.00 1.00 1.00 0.95 1.00 1.00 0.95 1.00Frpb, ped/bikes 1.00 1.00 1.00 1.00 1.00 1.00 0.97 1.00 1.00 0.97Flpb, ped/bikes 1.00 1.00 1.00 1.00 1.00 1.00 1.00 1.00 1.00 1.00Frt 1.00 0.85 1.00 0.85 1.00 1.00 0.85 1.00 1.00 0.85Flt Protected 0.96 1.00 1.00 1.00 0.95 1.00 1.00 0.95 1.00 1.00Satd. Flow (prot) 1798 1583 1853 1583 1770 3539 1534 1770 3539 1532Flt Permitted 0.78 1.00 0.97 1.00 0.95 1.00 1.00 0.95 1.00 1.00Satd. Flow (perm) 1452 1583 1811 1583 1770 3539 1534 1770 3539 1532Peak-hour factor, PHF 0.91 0.91 0.91 0.91 0.91 0.91 0.91 0.91 0.91 0.91 0.91 0.91Adj. Flow (vph) 241 91 782 1 9 49 60 918 20 67 862 242RTOR Reduction (vph) 0 0 224 0 0 36 0 0 10 0 0 121Lane Group Flow (vph) 0 332 558 0 10 13 60 918 10 67 862 121Confl. Peds. (#/hr) 6 6 6 6Confl. Bikes (#/hr) 1Turn Type Perm NA Perm Perm NA Perm Prot NA Perm Prot NA PermProtected Phases 8 4 1 6 5 2Permitted Phases 8 8 4 4 6 2Actuated Green, G (s) 18.0 18.0 18.0 18.0 5.0 34.1 34.1 5.4 34.5 34.5Effective Green, g (s) 18.5 18.5 18.5 18.5 5.5 34.6 34.6 5.9 35.0 35.0Actuated g/C Ratio 0.26 0.26 0.26 0.26 0.08 0.49 0.49 0.08 0.50 0.50Clearance Time (s) 4.7 4.7 4.7 4.7 3.7 4.1 4.1 3.7 4.1 4.1Vehicle Extension (s) 3.0 3.0 3.0 3.0 3.0 3.0 3.0 3.0 3.0 3.0Lane Grp Cap (vph) 383 418 478 418 139 1749 758 149 1769 766v/s Ratio Prot 0.03 c0.26 c0.04 0.24v/s Ratio Perm 0.23 c0.35 0.01 0.01 0.01 0.08v/c Ratio 0.87 1.34 0.02 0.03 0.43 0.52 0.01 0.45 0.49 0.16Uniform Delay, d1 24.6 25.8 19.0 19.1 30.8 12.1 9.0 30.5 11.6 9.5Progression Factor 1.00 1.00 1.00 1.00 1.00 1.00 1.00 0.70 2.11 7.33Incremental Delay, d2 18.2 166.6 0.0 0.0 2.1 1.1 0.0 1.3 0.6 0.3Delay (s) 42.8 192.4 19.1 19.1 32.9 13.2 9.0 22.6 25.0 69.9Level of Service D F B B C B A C C EApproach Delay (s) 147.8 19.1 14.3 34.2Approach LOS F B B C
Intersection SummaryHCM 2000 Control Delay 65.8 HCM 2000 Level of Service EHCM 2000 Volume to Capacity ratio 0.77Actuated Cycle Length (s) 70.0 Sum of lost time (s) 11.0Intersection Capacity Utilization 84.4% ICU Level of Service EAnalysis Period (min) 15c Critical Lane Group
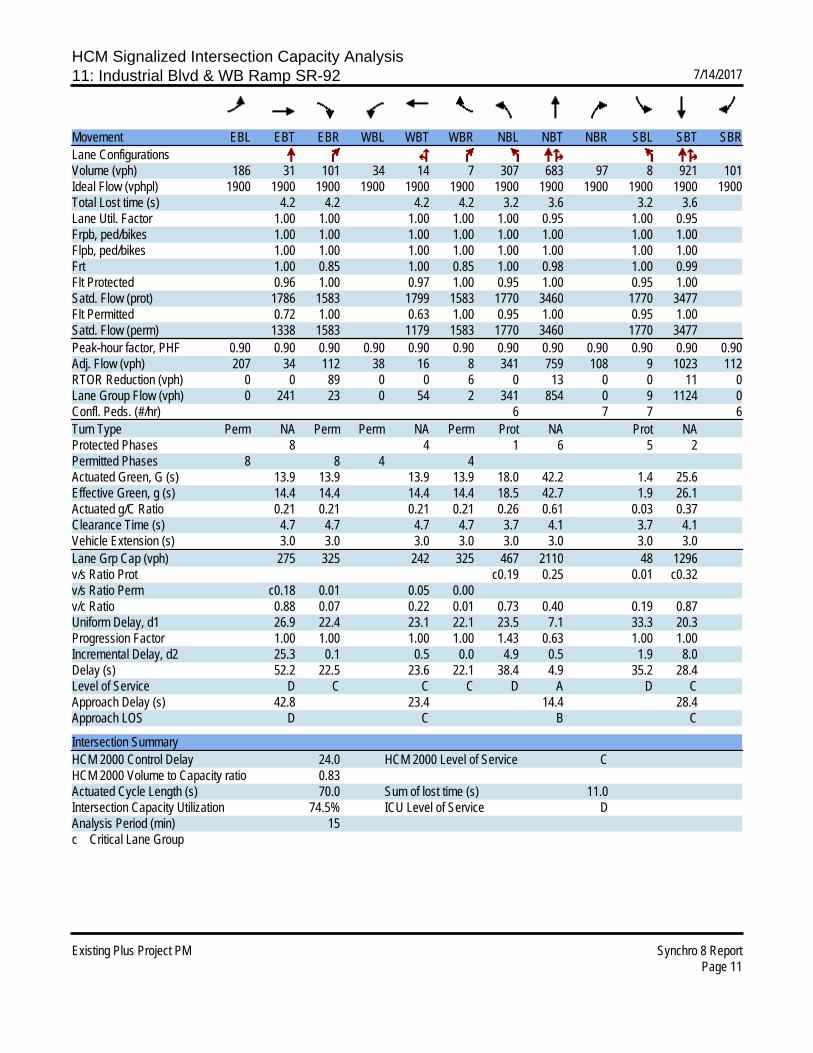
HCM Signalized Intersection Capacity Analysis11: Industrial Blvd & WB Ramp SR-92 7/14/2017
Existing Plus Project PM Synchro 8 ReportPage 11
Movement EBL EBT EBR WBL WBT WBR NBL NBT NBR SBL SBT SBRLane ConfigurationsVolume (vph) 186 31 101 34 14 7 307 683 97 8 921 101Ideal Flow (vphpl) 1900 1900 1900 1900 1900 1900 1900 1900 1900 1900 1900 1900Total Lost time (s) 4.2 4.2 4.2 4.2 3.2 3.6 3.2 3.6Lane Util. Factor 1.00 1.00 1.00 1.00 1.00 0.95 1.00 0.95Frpb, ped/bikes 1.00 1.00 1.00 1.00 1.00 1.00 1.00 1.00Flpb, ped/bikes 1.00 1.00 1.00 1.00 1.00 1.00 1.00 1.00Frt 1.00 0.85 1.00 0.85 1.00 0.98 1.00 0.99Flt Protected 0.96 1.00 0.97 1.00 0.95 1.00 0.95 1.00Satd. Flow (prot) 1786 1583 1799 1583 1770 3460 1770 3477Flt Permitted 0.72 1.00 0.63 1.00 0.95 1.00 0.95 1.00Satd. Flow (perm) 1338 1583 1179 1583 1770 3460 1770 3477Peak-hour factor, PHF 0.90 0.90 0.90 0.90 0.90 0.90 0.90 0.90 0.90 0.90 0.90 0.90Adj. Flow (vph) 207 34 112 38 16 8 341 759 108 9 1023 112RTOR Reduction (vph) 0 0 89 0 0 6 0 13 0 0 11 0Lane Group Flow (vph) 0 241 23 0 54 2 341 854 0 9 1124 0Confl. Peds. (#/hr) 6 7 7 6Turn Type Perm NA Perm Perm NA Perm Prot NA Prot NAProtected Phases 8 4 1 6 5 2Permitted Phases 8 8 4 4Actuated Green, G (s) 13.9 13.9 13.9 13.9 18.0 42.2 1.4 25.6Effective Green, g (s) 14.4 14.4 14.4 14.4 18.5 42.7 1.9 26.1Actuated g/C Ratio 0.21 0.21 0.21 0.21 0.26 0.61 0.03 0.37Clearance Time (s) 4.7 4.7 4.7 4.7 3.7 4.1 3.7 4.1Vehicle Extension (s) 3.0 3.0 3.0 3.0 3.0 3.0 3.0 3.0Lane Grp Cap (vph) 275 325 242 325 467 2110 48 1296v/s Ratio Prot c0.19 0.25 0.01 c0.32v/s Ratio Perm c0.18 0.01 0.05 0.00v/c Ratio 0.88 0.07 0.22 0.01 0.73 0.40 0.19 0.87Uniform Delay, d1 26.9 22.4 23.1 22.1 23.5 7.1 33.3 20.3Progression Factor 1.00 1.00 1.00 1.00 1.43 0.63 1.00 1.00Incremental Delay, d2 25.3 0.1 0.5 0.0 4.9 0.5 1.9 8.0Delay (s) 52.2 22.5 23.6 22.1 38.4 4.9 35.2 28.4Level of Service D C C C D A D CApproach Delay (s) 42.8 23.4 14.4 28.4Approach LOS D C B C
Intersection SummaryHCM 2000 Control Delay 24.0 HCM 2000 Level of Service CHCM 2000 Volume to Capacity ratio 0.83Actuated Cycle Length (s) 70.0 Sum of lost time (s) 11.0Intersection Capacity Utilization 74.5% ICU Level of Service DAnalysis Period (min) 15c Critical Lane Group

HCM Signalized Intersection Capacity Analysis12: Industrial Blvd & Depot Road 7/14/2017
Existing Plus Project PM Synchro 8 ReportPage 12
Movement EBL EBT EBR WBL WBT WBR NBL NBT NBR SBL SBT SBRLane ConfigurationsVolume (vph) 70 197 269 50 28 16 118 526 129 46 402 9Ideal Flow (vphpl) 1900 1900 1900 1900 1900 1900 1900 1900 1900 1900 1900 1900Total Lost time (s) 4.0 4.0 4.0 4.5 4.0 4.0 4.0 4.0 4.0 4.0Lane Util. Factor 1.00 1.00 1.00 0.95 1.00 0.95 1.00 1.00 0.95 1.00Frpb, ped/bikes 1.00 1.00 0.98 1.00 1.00 1.00 1.00 1.00 1.00 0.99Flpb, ped/bikes 1.00 1.00 1.00 1.00 1.00 1.00 1.00 1.00 1.00 1.00Frt 1.00 1.00 0.85 0.97 1.00 1.00 0.85 1.00 1.00 0.85Flt Protected 0.95 1.00 1.00 0.97 0.95 1.00 1.00 0.95 1.00 1.00Satd. Flow (prot) 1770 1863 1557 3357 1770 3539 1583 1770 3539 1563Flt Permitted 0.69 1.00 1.00 0.77 0.95 1.00 1.00 0.95 1.00 1.00Satd. Flow (perm) 1282 1863 1557 2666 1770 3539 1583 1770 3539 1563Peak-hour factor, PHF 0.93 0.93 0.93 0.93 0.93 0.93 0.93 0.93 0.93 0.93 0.93 0.93Adj. Flow (vph) 75 212 289 54 30 17 127 566 139 49 432 10RTOR Reduction (vph) 0 0 197 0 12 0 0 0 82 0 0 7Lane Group Flow (vph) 75 212 92 0 89 0 127 566 57 49 432 3Confl. Peds. (#/hr) 3 3 1 1Confl. Bikes (#/hr) 4Turn Type Perm NA Perm Perm NA Prot NA Perm Prot NA PermProtected Phases 4 4 5 2 1 6Permitted Phases 4 4 4 2 6Actuated Green, G (s) 20.6 20.6 20.6 20.6 10.5 26.2 26.2 5.9 21.6 21.6Effective Green, g (s) 21.1 21.1 21.1 20.6 10.5 27.2 27.2 5.9 22.6 22.6Actuated g/C Ratio 0.32 0.32 0.32 0.31 0.16 0.41 0.41 0.09 0.34 0.34Clearance Time (s) 4.5 4.5 4.5 4.5 4.0 5.0 5.0 4.0 5.0 5.0Vehicle Extension (s) 6.0 6.0 6.0 6.0 6.0 8.0 8.0 6.0 8.0 8.0Lane Grp Cap (vph) 408 593 496 829 280 1454 650 157 1208 533v/s Ratio Prot c0.11 c0.07 c0.16 0.03 0.12v/s Ratio Perm 0.06 0.06 0.03 0.04 0.00v/c Ratio 0.18 0.36 0.19 0.11 0.45 0.39 0.09 0.31 0.36 0.01Uniform Delay, d1 16.3 17.3 16.3 16.2 25.2 13.7 11.9 28.2 16.4 14.4Progression Factor 1.00 1.00 1.00 1.00 1.00 1.00 1.00 1.00 1.00 1.00Incremental Delay, d2 0.6 1.0 0.5 0.2 3.3 0.7 0.3 3.2 0.8 0.0Delay (s) 16.9 18.4 16.8 16.4 28.5 14.4 12.2 31.4 17.1 14.4Level of Service B B B B C B B C B BApproach Delay (s) 17.4 16.4 16.2 18.5Approach LOS B B B B
Intersection SummaryHCM 2000 Control Delay 17.1 HCM 2000 Level of Service BHCM 2000 Volume to Capacity ratio 0.41Actuated Cycle Length (s) 66.2 Sum of lost time (s) 12.5Intersection Capacity Utilization 46.5% ICU Level of Service AAnalysis Period (min) 15c Critical Lane Group

HCM Unsignalized Intersection Capacity Analysis13: Depot Road & West Driveway 7/14/2017
Existing Plus Project PM Synchro 8 ReportPage 13
Movement EBL EBT WBT WBR SBL SBRLane ConfigurationsVolume (veh/h) 17 443 145 41 56 15Sign Control Free Free StopGrade 0% 0% 0%Peak Hour Factor 0.91 0.91 0.91 0.91 0.91 0.91Hourly flow rate (vph) 19 487 159 45 62 16Pedestrians 2 29Lane Width (ft) 12.0 12.0Walking Speed (ft/s) 3.5 3.5Percent Blockage 0 3Right turn flare (veh)Median type None NoneMedian storage veh)Upstream signal (ft)pX, platoon unblockedvC, conflicting volume 233 494 211vC1, stage 1 conf volvC2, stage 2 conf volvCu, unblocked vol 233 494 211tC, single (s) 4.1 6.8 6.9tC, 2 stage (s)tF (s) 2.2 3.5 3.3p0 queue free % 99 87 98cM capacity (veh/h) 1294 483 773
Direction, Lane # EB 1 EB 2 WB 1 SB 1Volume Total 181 325 204 78Volume Left 19 0 0 62Volume Right 0 0 45 16cSH 1294 1700 1700 524Volume to Capacity 0.01 0.19 0.12 0.15Queue Length 95th (ft) 1 0 0 13Control Delay (s) 0.9 0.0 0.0 13.1Lane LOS A BApproach Delay (s) 0.3 0.0 13.1Approach LOS B
Intersection SummaryAverage Delay 1.5Intersection Capacity Utilization 35.3% ICU Level of Service AAnalysis Period (min) 15
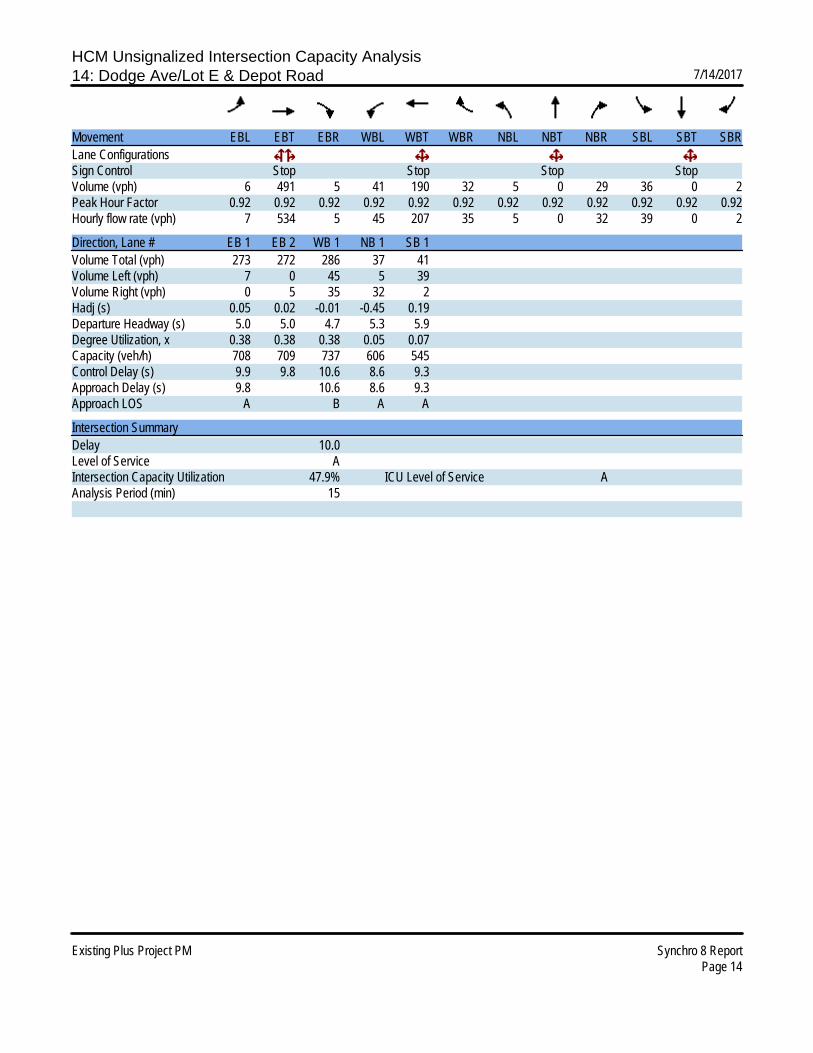
HCM Unsignalized Intersection Capacity Analysis14: Dodge Ave/Lot E & Depot Road 7/14/2017
Existing Plus Project PM Synchro 8 ReportPage 14
Movement EBL EBT EBR WBL WBT WBR NBL NBT NBR SBL SBT SBRLane ConfigurationsSign Control Stop Stop Stop StopVolume (vph) 6 491 5 41 190 32 5 0 29 36 0 2Peak Hour Factor 0.92 0.92 0.92 0.92 0.92 0.92 0.92 0.92 0.92 0.92 0.92 0.92Hourly flow rate (vph) 7 534 5 45 207 35 5 0 32 39 0 2
Direction, Lane # EB 1 EB 2 WB 1 NB 1 SB 1Volume Total (vph) 273 272 286 37 41Volume Left (vph) 7 0 45 5 39Volume Right (vph) 0 5 35 32 2Hadj (s) 0.05 0.02 -0.01 -0.45 0.19Departure Headway (s) 5.0 5.0 4.7 5.3 5.9Degree Utilization, x 0.38 0.38 0.38 0.05 0.07Capacity (veh/h) 708 709 737 606 545Control Delay (s) 9.9 9.8 10.6 8.6 9.3Approach Delay (s) 9.8 10.6 8.6 9.3Approach LOS A B A A
Intersection SummaryDelay 10.0Level of Service AIntersection Capacity Utilization 47.9% ICU Level of Service AAnalysis Period (min) 15

HCM Unsignalized Intersection Capacity Analysis15: Depot Road & Lot F 7/14/2017
Existing Plus Project PM Synchro 8 ReportPage 15
Movement EBL EBT WBT WBR SBL SBRLane ConfigurationsVolume (veh/h) 13 540 252 14 28 13Sign Control Free Free StopGrade 0% 0% 0%Peak Hour Factor 0.92 0.92 0.92 0.92 0.92 0.92Hourly flow rate (vph) 14 587 274 15 30 14Pedestrians 9Lane Width (ft) 12.0Walking Speed (ft/s) 3.5Percent Blockage 1Right turn flare (veh)Median type None NoneMedian storage veh)Upstream signal (ft) 957pX, platoon unblockedvC, conflicting volume 298 612 291vC1, stage 1 conf volvC2, stage 2 conf volvCu, unblocked vol 298 612 291tC, single (s) 4.1 6.8 6.9tC, 2 stage (s)tF (s) 2.2 3.5 3.3p0 queue free % 99 93 98cM capacity (veh/h) 1249 416 700
Direction, Lane # EB 1 EB 2 WB 1 SB 1Volume Total 210 391 289 45Volume Left 14 0 0 30Volume Right 0 0 15 14cSH 1249 1700 1700 478Volume to Capacity 0.01 0.23 0.17 0.09Queue Length 95th (ft) 1 0 0 8Control Delay (s) 0.6 0.0 0.0 13.3Lane LOS A BApproach Delay (s) 0.2 0.0 13.3Approach LOS B
Intersection SummaryAverage Delay 0.8Intersection Capacity Utilization 34.2% ICU Level of Service AAnalysis Period (min) 15

HCM Unsignalized Intersection Capacity Analysis16: Depot Road & Lot G 7/14/2017
Existing Plus Project PM Synchro 8 ReportPage 16
Movement EBL EBT WBT WBR SBL SBRLane ConfigurationsVolume (veh/h) 3 576 272 51 38 4Sign Control Free Free StopGrade 0% 0% 0%Peak Hour Factor 0.93 0.93 0.93 0.93 0.93 0.93Hourly flow rate (vph) 3 619 292 55 41 4Pedestrians 19 19 5Lane Width (ft) 12.0 12.0 12.0Walking Speed (ft/s) 3.5 3.5 3.5Percent Blockage 2 2 0Right turn flare (veh)Median type None NoneMedian storage veh)Upstream signal (ft) 529pX, platoon unblockedvC, conflicting volume 352 633 316vC1, stage 1 conf volvC2, stage 2 conf volvCu, unblocked vol 352 633 316tC, single (s) 4.1 6.8 6.9tC, 2 stage (s)tF (s) 2.2 3.5 3.3p0 queue free % 100 90 99cM capacity (veh/h) 1197 402 664
Direction, Lane # EB 1 EB 2 WB 1 WB 2 SB 1Volume Total 210 413 292 55 45Volume Left 3 0 0 0 41Volume Right 0 0 0 55 4cSH 1197 1700 1700 1700 417Volume to Capacity 0.00 0.24 0.17 0.03 0.11Queue Length 95th (ft) 0 0 0 0 9Control Delay (s) 0.1 0.0 0.0 0.0 14.7Lane LOS A BApproach Delay (s) 0.0 0.0 14.7Approach LOS B
Intersection SummaryAverage Delay 0.7Intersection Capacity Utilization 32.7% ICU Level of Service AAnalysis Period (min) 15
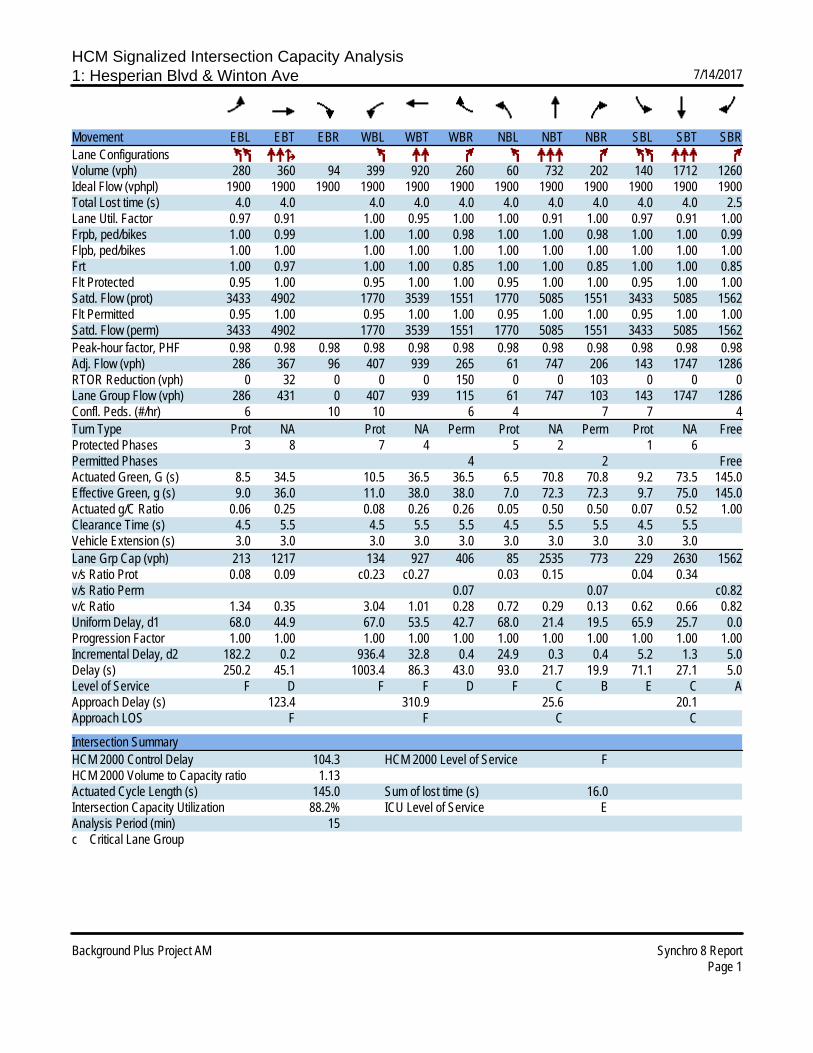
HCM Signalized Intersection Capacity Analysis1: Hesperian Blvd & Winton Ave 7/14/2017
Background Plus Project AM Synchro 8 ReportPage 1
Movement EBL EBT EBR WBL WBT WBR NBL NBT NBR SBL SBT SBRLane ConfigurationsVolume (vph) 280 360 94 399 920 260 60 732 202 140 1712 1260Ideal Flow (vphpl) 1900 1900 1900 1900 1900 1900 1900 1900 1900 1900 1900 1900Total Lost time (s) 4.0 4.0 4.0 4.0 4.0 4.0 4.0 4.0 4.0 4.0 2.5Lane Util. Factor 0.97 0.91 1.00 0.95 1.00 1.00 0.91 1.00 0.97 0.91 1.00Frpb, ped/bikes 1.00 0.99 1.00 1.00 0.98 1.00 1.00 0.98 1.00 1.00 0.99Flpb, ped/bikes 1.00 1.00 1.00 1.00 1.00 1.00 1.00 1.00 1.00 1.00 1.00Frt 1.00 0.97 1.00 1.00 0.85 1.00 1.00 0.85 1.00 1.00 0.85Flt Protected 0.95 1.00 0.95 1.00 1.00 0.95 1.00 1.00 0.95 1.00 1.00Satd. Flow (prot) 3433 4902 1770 3539 1551 1770 5085 1551 3433 5085 1562Flt Permitted 0.95 1.00 0.95 1.00 1.00 0.95 1.00 1.00 0.95 1.00 1.00Satd. Flow (perm) 3433 4902 1770 3539 1551 1770 5085 1551 3433 5085 1562Peak-hour factor, PHF 0.98 0.98 0.98 0.98 0.98 0.98 0.98 0.98 0.98 0.98 0.98 0.98Adj. Flow (vph) 286 367 96 407 939 265 61 747 206 143 1747 1286RTOR Reduction (vph) 0 32 0 0 0 150 0 0 103 0 0 0Lane Group Flow (vph) 286 431 0 407 939 115 61 747 103 143 1747 1286Confl. Peds. (#/hr) 6 10 10 6 4 7 7 4Turn Type Prot NA Prot NA Perm Prot NA Perm Prot NA FreeProtected Phases 3 8 7 4 5 2 1 6Permitted Phases 4 2 FreeActuated Green, G (s) 8.5 34.5 10.5 36.5 36.5 6.5 70.8 70.8 9.2 73.5 145.0Effective Green, g (s) 9.0 36.0 11.0 38.0 38.0 7.0 72.3 72.3 9.7 75.0 145.0Actuated g/C Ratio 0.06 0.25 0.08 0.26 0.26 0.05 0.50 0.50 0.07 0.52 1.00Clearance Time (s) 4.5 5.5 4.5 5.5 5.5 4.5 5.5 5.5 4.5 5.5Vehicle Extension (s) 3.0 3.0 3.0 3.0 3.0 3.0 3.0 3.0 3.0 3.0Lane Grp Cap (vph) 213 1217 134 927 406 85 2535 773 229 2630 1562v/s Ratio Prot 0.08 0.09 c0.23 c0.27 0.03 0.15 0.04 0.34v/s Ratio Perm 0.07 0.07 c0.82v/c Ratio 1.34 0.35 3.04 1.01 0.28 0.72 0.29 0.13 0.62 0.66 0.82Uniform Delay, d1 68.0 44.9 67.0 53.5 42.7 68.0 21.4 19.5 65.9 25.7 0.0Progression Factor 1.00 1.00 1.00 1.00 1.00 1.00 1.00 1.00 1.00 1.00 1.00Incremental Delay, d2 182.2 0.2 936.4 32.8 0.4 24.9 0.3 0.4 5.2 1.3 5.0Delay (s) 250.2 45.1 1003.4 86.3 43.0 93.0 21.7 19.9 71.1 27.1 5.0Level of Service F D F F D F C B E C AApproach Delay (s) 123.4 310.9 25.6 20.1Approach LOS F F C C
Intersection SummaryHCM 2000 Control Delay 104.3 HCM 2000 Level of Service FHCM 2000 Volume to Capacity ratio 1.13Actuated Cycle Length (s) 145.0 Sum of lost time (s) 16.0Intersection Capacity Utilization 88.2% ICU Level of Service EAnalysis Period (min) 15c Critical Lane Group

HCM Signalized Intersection Capacity Analysis2: Hesperian Blvd & Southland Drive 7/14/2017
Background Plus Project AM Synchro 8 ReportPage 2
Movement EBL EBT EBR WBL WBT WBR NBL NBT NBR SBL SBT SBRLane ConfigurationsVolume (vph) 100 130 100 250 380 30 70 874 100 60 1875 270Ideal Flow (vphpl) 1900 1900 1900 1900 1900 1900 1900 1900 1900 1900 1900 1900Total Lost time (s) 4.0 4.0 4.0 4.0 4.0 4.0 4.0 4.0Lane Util. Factor 1.00 0.95 1.00 0.91 1.00 0.91 1.00 0.91Frpb, ped/bikes 1.00 0.99 1.00 1.00 1.00 1.00 1.00 1.00Flpb, ped/bikes 1.00 1.00 0.99 1.00 1.00 1.00 1.00 1.00Frt 1.00 0.93 1.00 0.99 1.00 0.98 1.00 0.98Flt Protected 0.95 1.00 0.95 1.00 0.95 1.00 0.95 1.00Satd. Flow (prot) 1768 3267 1749 5024 1770 5000 1770 4979Flt Permitted 0.44 1.00 0.56 1.00 0.95 1.00 0.95 1.00Satd. Flow (perm) 810 3267 1037 5024 1770 5000 1770 4979Peak-hour factor, PHF 0.94 0.94 0.94 0.94 0.94 0.94 0.94 0.94 0.94 0.94 0.94 0.94Adj. Flow (vph) 106 138 106 266 404 32 74 930 106 64 1995 287RTOR Reduction (vph) 0 75 0 0 8 0 0 11 0 0 15 0Lane Group Flow (vph) 106 169 0 266 428 0 74 1025 0 64 2267 0Confl. Peds. (#/hr) 2 16 16 2 4 1 1 4Confl. Bikes (#/hr) 1 1Turn Type Perm NA Perm NA Prot NA Prot NAProtected Phases 8 4 1 6 5 2Permitted Phases 8 4Actuated Green, G (s) 32.2 32.2 32.2 32.2 7.7 58.2 7.0 57.5Effective Green, g (s) 32.2 32.2 32.2 32.2 7.7 58.8 7.0 58.1Actuated g/C Ratio 0.29 0.29 0.29 0.29 0.07 0.53 0.06 0.53Clearance Time (s) 4.0 4.0 4.0 4.0 4.0 4.6 4.0 4.6Vehicle Extension (s) 3.0 3.0 3.0 3.0 3.0 3.0 3.0 3.0Lane Grp Cap (vph) 237 956 303 1470 123 2672 112 2629v/s Ratio Prot 0.05 0.09 c0.04 0.20 0.04 c0.46v/s Ratio Perm 0.13 c0.26v/c Ratio 0.45 0.18 0.88 0.29 0.60 0.38 0.57 0.86Uniform Delay, d1 31.7 29.0 37.0 30.1 49.7 15.0 50.0 22.5Progression Factor 1.00 1.00 1.00 1.00 0.84 1.68 1.00 1.00Incremental Delay, d2 1.3 0.1 23.6 0.1 7.8 0.4 6.9 4.0Delay (s) 33.0 29.1 60.7 30.2 49.3 25.6 56.9 26.5Level of Service C C E C D C E CApproach Delay (s) 30.3 41.7 27.2 27.3Approach LOS C D C C
Intersection SummaryHCM 2000 Control Delay 29.8 HCM 2000 Level of Service CHCM 2000 Volume to Capacity ratio 0.85Actuated Cycle Length (s) 110.0 Sum of lost time (s) 12.0Intersection Capacity Utilization 89.2% ICU Level of Service EAnalysis Period (min) 15c Critical Lane Group

HCM Signalized Intersection Capacity Analysis3: Hesperian Blvd & Turner Court 7/14/2017
Background Plus Project AM Synchro 8 ReportPage 3
Movement EBL EBT EBR WBL WBT WBR NBL NBT NBR SBL SBT SBRLane ConfigurationsVolume (vph) 72 10 30 80 70 60 140 862 50 100 1803 436Ideal Flow (vphpl) 1900 1900 1900 1900 1900 1900 1900 1900 1900 1900 1900 1900Total Lost time (s) 4.0 4.0 4.0 4.6 4.0 4.0 4.0 4.0Lane Util. Factor 1.00 1.00 1.00 1.00 1.00 0.91 1.00 0.91Frpb, ped/bikes 1.00 0.96 1.00 0.99 1.00 1.00 1.00 0.99Flpb, ped/bikes 1.00 1.00 0.98 1.00 1.00 1.00 1.00 1.00Frt 1.00 0.89 1.00 0.85 1.00 0.99 1.00 0.97Flt Protected 0.95 1.00 0.97 1.00 0.95 1.00 0.95 1.00Satd. Flow (prot) 1768 1590 1777 1562 1770 5028 1770 4895Flt Permitted 0.49 1.00 0.81 1.00 0.95 1.00 0.95 1.00Satd. Flow (perm) 918 1590 1477 1562 1770 5028 1770 4895Peak-hour factor, PHF 0.94 0.94 0.94 0.94 0.94 0.94 0.94 0.94 0.94 0.94 0.94 0.94Adj. Flow (vph) 77 11 32 85 74 64 149 917 53 106 1918 464RTOR Reduction (vph) 0 26 0 0 0 53 0 4 0 0 25 0Lane Group Flow (vph) 77 17 0 0 159 11 149 966 0 106 2357 0Confl. Peds. (#/hr) 1 40 40 1 10 19 19 10Turn Type Perm NA Perm NA Perm Prot NA Prot NAProtected Phases 4 8 1 6 5 2Permitted Phases 4 8 8Actuated Green, G (s) 18.7 18.7 18.7 18.7 14.5 67.2 10.9 63.6Effective Green, g (s) 19.3 19.3 19.3 18.7 14.5 67.8 10.9 64.2Actuated g/C Ratio 0.18 0.18 0.18 0.17 0.13 0.62 0.10 0.58Clearance Time (s) 4.6 4.6 4.6 4.6 4.0 4.6 4.0 4.6Vehicle Extension (s) 3.0 3.0 3.0 3.0 3.0 3.0 3.0 3.0Lane Grp Cap (vph) 161 278 259 265 233 3099 175 2856v/s Ratio Prot 0.01 c0.08 c0.19 0.06 c0.48v/s Ratio Perm 0.08 c0.11 0.01v/c Ratio 0.48 0.06 0.61 0.04 0.64 0.31 0.61 0.83Uniform Delay, d1 40.8 37.8 41.9 38.2 45.3 10.0 47.5 18.4Progression Factor 1.00 1.00 1.00 1.00 1.00 1.00 0.70 1.52Incremental Delay, d2 2.2 0.1 4.3 0.1 5.7 0.3 3.6 1.8Delay (s) 43.1 37.9 46.2 38.2 50.9 10.3 37.1 29.8Level of Service D D D D D B D CApproach Delay (s) 41.2 43.9 15.7 30.1Approach LOS D D B C
Intersection SummaryHCM 2000 Control Delay 27.2 HCM 2000 Level of Service CHCM 2000 Volume to Capacity ratio 0.75Actuated Cycle Length (s) 110.0 Sum of lost time (s) 12.0Intersection Capacity Utilization 85.0% ICU Level of Service EAnalysis Period (min) 15c Critical Lane Group

HCM Signalized Intersection Capacity Analysis4: Hesperian Blvd & East Driveway 7/14/2017
Background Plus Project AM Synchro 8 ReportPage 4
Movement EBL EBR NBL NBT SBU SBT SBRLane ConfigurationsVolume (vph) 72 103 193 1012 0 1679 270Ideal Flow (vphpl) 1900 1900 1900 1900 1900 1900 1900Total Lost time (s) 4.0 4.0 4.0 4.0 4.0Lane Util. Factor 1.00 1.00 1.00 0.91 0.91Frpb, ped/bikes 1.00 0.98 1.00 1.00 1.00Flpb, ped/bikes 1.00 1.00 1.00 1.00 1.00Frt 1.00 0.85 1.00 1.00 0.98Flt Protected 0.95 1.00 0.95 1.00 1.00Satd. Flow (prot) 1770 1555 1770 5085 4963Flt Permitted 0.95 1.00 0.95 1.00 1.00Satd. Flow (perm) 1770 1555 1770 5085 4963Peak-hour factor, PHF 0.95 0.95 0.95 0.95 0.95 0.95 0.95Adj. Flow (vph) 76 108 203 1065 0 1767 284RTOR Reduction (vph) 0 97 0 0 0 17 0Lane Group Flow (vph) 76 11 203 1065 0 2034 0Confl. Peds. (#/hr) 4 1 5 1Turn Type Prot Perm Prot NA Prot NAProtected Phases 4 1 6 5 2Permitted Phases 4Actuated Green, G (s) 13.4 13.4 22.6 107.6 81.0Effective Green, g (s) 13.4 13.4 22.6 108.6 82.0Actuated g/C Ratio 0.10 0.10 0.17 0.84 0.63Clearance Time (s) 4.0 4.0 4.0 5.0 5.0Vehicle Extension (s) 3.0 3.0 3.0 3.0 3.0Lane Grp Cap (vph) 182 160 307 4247 3130v/s Ratio Prot c0.04 c0.11 0.21 c0.41v/s Ratio Perm 0.01v/c Ratio 0.42 0.07 0.66 0.25 0.65Uniform Delay, d1 54.6 52.7 50.1 2.2 15.0Progression Factor 1.00 1.00 0.99 0.75 1.00Incremental Delay, d2 1.6 0.2 4.9 0.1 1.1Delay (s) 56.2 52.9 54.4 1.8 16.1Level of Service E D D A BApproach Delay (s) 54.2 10.2 16.1Approach LOS D B B
Intersection SummaryHCM 2000 Control Delay 16.0 HCM 2000 Level of Service BHCM 2000 Volume to Capacity ratio 0.63Actuated Cycle Length (s) 130.0 Sum of lost time (s) 12.0Intersection Capacity Utilization 67.7% ICU Level of Service CAnalysis Period (min) 15c Critical Lane Group

HCM Signalized Intersection Capacity Analysis5: Hesperian Blvd & Depot Road 7/14/2017
Background Plus Project AM Synchro 8 ReportPage 5
Movement EBL EBT EBR WBL WBT WBR NBL NBT NBR SBL SBT SBRLane ConfigurationsVolume (vph) 190 70 411 220 170 40 392 942 90 70 1553 199Ideal Flow (vphpl) 1900 1900 1900 1900 1900 1900 1900 1900 1900 1900 1900 1900Total Lost time (s) 4.0 4.0 4.0 4.0 4.0 4.0 4.0 4.0 4.0Lane Util. Factor 0.95 0.95 1.00 1.00 1.00 1.00 0.91 1.00 0.91Frpb, ped/bikes 1.00 1.00 0.96 1.00 1.00 1.00 1.00 1.00 1.00Flpb, ped/bikes 1.00 1.00 1.00 1.00 1.00 1.00 1.00 1.00 1.00Frt 1.00 1.00 0.85 1.00 0.97 1.00 0.99 1.00 0.98Flt Protected 0.95 0.98 1.00 0.95 1.00 0.95 1.00 0.95 1.00Satd. Flow (prot) 1681 1732 1521 1770 1804 1770 5003 1770 4975Flt Permitted 0.95 0.98 1.00 0.95 1.00 0.95 1.00 0.95 1.00Satd. Flow (perm) 1681 1732 1521 1770 1804 1770 5003 1770 4975Peak-hour factor, PHF 0.95 0.95 0.95 0.95 0.95 0.95 0.95 0.95 0.95 0.95 0.95 0.95Adj. Flow (vph) 200 74 433 232 179 42 413 992 95 74 1635 209RTOR Reduction (vph) 0 0 371 0 7 0 0 8 0 0 11 0Lane Group Flow (vph) 144 130 62 232 214 0 413 1079 0 74 1833 0Confl. Peds. (#/hr) 2 19 19 2 17 5 5 17Confl. Bikes (#/hr) 1 1Turn Type Split NA Perm Split NA Prot NA Prot NAProtected Phases 4 4 3 3 5 2 1 6Permitted Phases 4Actuated Green, G (s) 18.6 18.6 18.6 18.0 18.0 34.2 67.1 9.7 42.6Effective Green, g (s) 18.6 18.6 18.6 18.0 18.0 34.2 67.7 9.7 43.2Actuated g/C Ratio 0.14 0.14 0.14 0.14 0.14 0.26 0.52 0.07 0.33Clearance Time (s) 4.0 4.0 4.0 4.0 4.0 4.0 4.6 4.0 4.6Vehicle Extension (s) 3.0 3.0 3.0 3.0 3.0 3.0 3.0 3.0 3.0Lane Grp Cap (vph) 240 247 217 245 249 465 2605 132 1653v/s Ratio Prot c0.09 0.08 c0.13 0.12 c0.23 0.22 0.04 c0.37v/s Ratio Perm 0.04v/c Ratio 0.60 0.53 0.29 0.95 0.86 0.89 0.41 0.56 1.11Uniform Delay, d1 52.2 51.6 49.8 55.5 54.8 46.1 19.0 58.1 43.4Progression Factor 1.00 1.00 1.00 1.00 1.00 1.00 1.00 1.04 0.87Incremental Delay, d2 4.0 2.0 0.7 42.6 24.3 18.2 0.5 4.2 56.7Delay (s) 56.2 53.6 50.5 98.1 79.1 64.3 19.5 64.6 94.3Level of Service E D D F E E B E FApproach Delay (s) 52.2 88.8 31.9 93.2Approach LOS D F C F
Intersection SummaryHCM 2000 Control Delay 66.3 HCM 2000 Level of Service EHCM 2000 Volume to Capacity ratio 0.93Actuated Cycle Length (s) 130.0 Sum of lost time (s) 16.0Intersection Capacity Utilization 96.8% ICU Level of Service FAnalysis Period (min) 15c Critical Lane Group
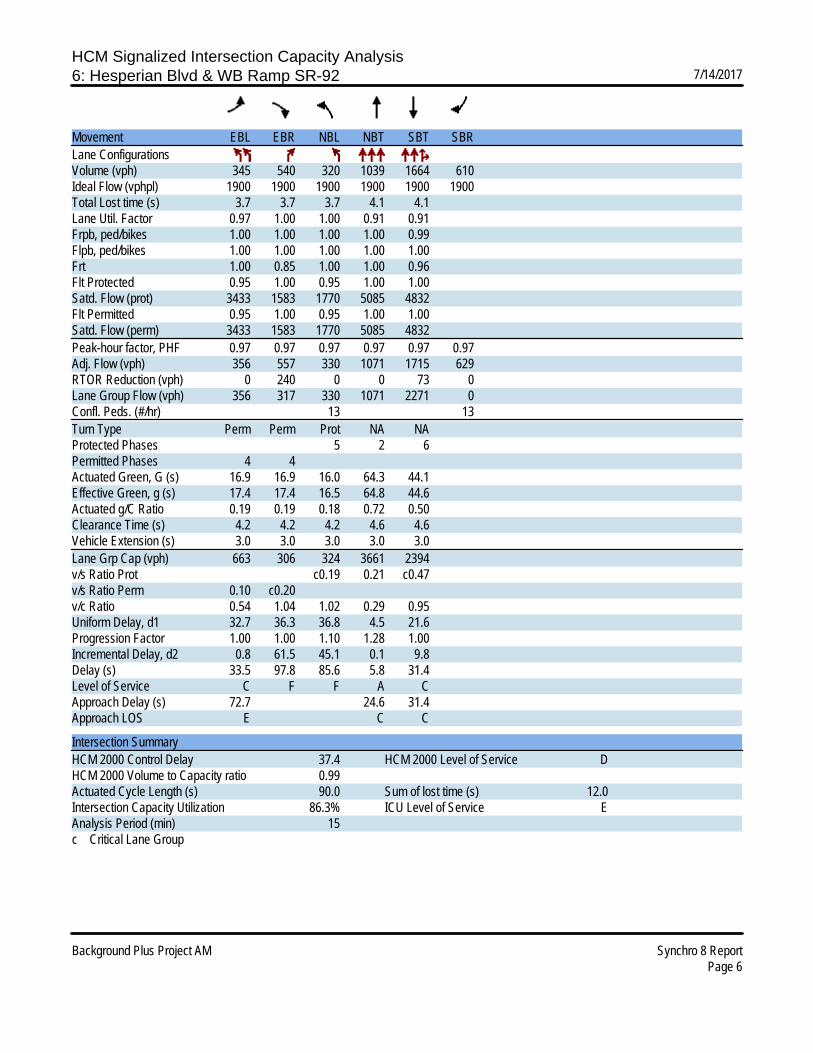
HCM Signalized Intersection Capacity Analysis6: Hesperian Blvd & WB Ramp SR-92 7/14/2017
Background Plus Project AM Synchro 8 ReportPage 6
Movement EBL EBR NBL NBT SBT SBRLane ConfigurationsVolume (vph) 345 540 320 1039 1664 610Ideal Flow (vphpl) 1900 1900 1900 1900 1900 1900Total Lost time (s) 3.7 3.7 3.7 4.1 4.1Lane Util. Factor 0.97 1.00 1.00 0.91 0.91Frpb, ped/bikes 1.00 1.00 1.00 1.00 0.99Flpb, ped/bikes 1.00 1.00 1.00 1.00 1.00Frt 1.00 0.85 1.00 1.00 0.96Flt Protected 0.95 1.00 0.95 1.00 1.00Satd. Flow (prot) 3433 1583 1770 5085 4832Flt Permitted 0.95 1.00 0.95 1.00 1.00Satd. Flow (perm) 3433 1583 1770 5085 4832Peak-hour factor, PHF 0.97 0.97 0.97 0.97 0.97 0.97Adj. Flow (vph) 356 557 330 1071 1715 629RTOR Reduction (vph) 0 240 0 0 73 0Lane Group Flow (vph) 356 317 330 1071 2271 0Confl. Peds. (#/hr) 13 13Turn Type Perm Perm Prot NA NAProtected Phases 5 2 6Permitted Phases 4 4Actuated Green, G (s) 16.9 16.9 16.0 64.3 44.1Effective Green, g (s) 17.4 17.4 16.5 64.8 44.6Actuated g/C Ratio 0.19 0.19 0.18 0.72 0.50Clearance Time (s) 4.2 4.2 4.2 4.6 4.6Vehicle Extension (s) 3.0 3.0 3.0 3.0 3.0Lane Grp Cap (vph) 663 306 324 3661 2394v/s Ratio Prot c0.19 0.21 c0.47v/s Ratio Perm 0.10 c0.20v/c Ratio 0.54 1.04 1.02 0.29 0.95Uniform Delay, d1 32.7 36.3 36.8 4.5 21.6Progression Factor 1.00 1.00 1.10 1.28 1.00Incremental Delay, d2 0.8 61.5 45.1 0.1 9.8Delay (s) 33.5 97.8 85.6 5.8 31.4Level of Service C F F A CApproach Delay (s) 72.7 24.6 31.4Approach LOS E C C
Intersection SummaryHCM 2000 Control Delay 37.4 HCM 2000 Level of Service DHCM 2000 Volume to Capacity ratio 0.99Actuated Cycle Length (s) 90.0 Sum of lost time (s) 12.0Intersection Capacity Utilization 86.3% ICU Level of Service EAnalysis Period (min) 15c Critical Lane Group

HCM Signalized Intersection Capacity Analysis7: Hesperian Blvd & EB Ramp SR-92 7/14/2017
Background Plus Project AM Synchro 8 ReportPage 7
Movement EBL EBT EBR WBL WBT WBR NBL NBT NBR SBL SBT SBRLane ConfigurationsVolume (vph) 113 0 120 0 0 0 0 1236 770 300 1924 0Ideal Flow (vphpl) 1900 1900 1900 1900 1900 1900 1900 1900 1900 1900 1900 1900Total Lost time (s) 3.7 3.7 4.1 4.1 3.7 4.1Lane Util. Factor 1.00 0.88 0.95 1.00 1.00 0.91Frpb, ped/bikes 1.00 1.00 1.00 0.98 1.00 1.00Flpb, ped/bikes 1.00 1.00 1.00 1.00 1.00 1.00Frt 1.00 0.85 1.00 0.85 1.00 1.00Flt Protected 0.95 1.00 1.00 1.00 0.95 1.00Satd. Flow (prot) 1770 2787 3539 1551 1770 5085Flt Permitted 0.95 1.00 1.00 1.00 0.95 1.00Satd. Flow (perm) 1770 2787 3539 1551 1770 5085Peak-hour factor, PHF 0.92 0.92 0.92 0.92 0.92 0.92 0.92 0.92 0.92 0.92 0.92 0.92Adj. Flow (vph) 123 0 130 0 0 0 0 1343 837 326 2091 0RTOR Reduction (vph) 0 0 61 0 0 0 0 0 256 0 0 0Lane Group Flow (vph) 0 123 69 0 0 0 0 1343 581 326 2091 0Confl. Peds. (#/hr) 16 6 6Turn Type Perm NA Perm NA Perm Prot NAProtected Phases 4 2 1 6Permitted Phases 4 4 2Actuated Green, G (s) 11.6 11.6 43.1 43.1 22.3 69.6Effective Green, g (s) 12.1 12.1 43.6 43.6 22.8 70.1Actuated g/C Ratio 0.13 0.13 0.48 0.48 0.25 0.78Clearance Time (s) 4.2 4.2 4.6 4.6 4.2 4.6Vehicle Extension (s) 3.0 3.0 3.0 3.0 3.0 3.0Lane Grp Cap (vph) 237 374 1714 751 448 3960v/s Ratio Prot c0.38 c0.18 0.41v/s Ratio Perm 0.07 0.02 0.37v/c Ratio 0.52 0.19 0.78 0.77 0.73 0.53Uniform Delay, d1 36.2 34.6 19.3 19.1 30.8 3.7Progression Factor 1.00 1.00 1.00 1.00 1.07 1.24Incremental Delay, d2 1.9 0.2 3.7 7.6 2.4 0.2Delay (s) 38.2 34.8 22.9 26.7 35.3 4.8Level of Service D C C C D AApproach Delay (s) 36.4 0.0 24.4 8.9Approach LOS D A C A
Intersection SummaryHCM 2000 Control Delay 17.3 HCM 2000 Level of Service BHCM 2000 Volume to Capacity ratio 0.73Actuated Cycle Length (s) 90.0 Sum of lost time (s) 11.5Intersection Capacity Utilization 81.3% ICU Level of Service DAnalysis Period (min) 15c Critical Lane Group

HCM Signalized Intersection Capacity Analysis8: Hesperian Blvd & Sleepy Hollow Ave 7/14/2017
Background Plus Project AM Synchro 8 ReportPage 8
Movement EBL EBT EBR WBL WBT WBR NBL NBT NBR SBL SBT SBRLane ConfigurationsVolume (vph) 190 90 50 50 110 260 40 1626 40 100 1744 190Ideal Flow (vphpl) 1900 1900 1900 1900 1900 1900 1900 1900 1900 1900 1900 1900Total Lost time (s) 4.0 4.0 4.0 4.0 4.0 4.0 4.0 4.0 4.0 4.0Lane Util. Factor 1.00 1.00 1.00 1.00 1.00 1.00 1.00 0.91 1.00 0.91Frpb, ped/bikes 1.00 1.00 0.97 1.00 1.00 0.98 1.00 1.00 1.00 1.00Flpb, ped/bikes 0.99 1.00 1.00 0.98 1.00 1.00 1.00 1.00 1.00 1.00Frt 1.00 1.00 0.85 1.00 1.00 0.85 1.00 1.00 1.00 0.99Flt Protected 0.95 1.00 1.00 0.95 1.00 1.00 0.95 1.00 0.95 1.00Satd. Flow (prot) 1755 1863 1534 1742 1863 1549 1770 5063 1770 4994Flt Permitted 0.60 1.00 1.00 0.65 1.00 1.00 0.95 1.00 0.95 1.00Satd. Flow (perm) 1115 1863 1534 1191 1863 1549 1770 5063 1770 4994Peak-hour factor, PHF 0.92 0.92 0.92 0.92 0.92 0.92 0.92 0.92 0.92 0.92 0.92 0.92Adj. Flow (vph) 207 98 54 54 120 283 43 1767 43 109 1896 207RTOR Reduction (vph) 0 0 42 0 0 182 0 2 0 0 8 0Lane Group Flow (vph) 207 98 12 54 120 101 43 1808 0 109 2095 0Confl. Peds. (#/hr) 8 15 15 8 5 4 4 5Confl. Bikes (#/hr) 1 2Turn Type Perm NA Perm Perm NA Perm Prot NA Prot NAProtected Phases 8 4 5 2 1 6Permitted Phases 8 8 4 4Actuated Green, G (s) 27.7 27.7 27.7 27.7 27.7 27.7 7.4 75.0 13.3 80.9Effective Green, g (s) 28.7 28.7 28.7 28.7 28.7 28.7 7.4 76.0 13.3 81.9Actuated g/C Ratio 0.22 0.22 0.22 0.22 0.22 0.22 0.06 0.58 0.10 0.63Clearance Time (s) 5.0 5.0 5.0 5.0 5.0 5.0 4.0 5.0 4.0 5.0Vehicle Extension (s) 3.0 3.0 3.0 3.0 3.0 3.0 3.0 3.0 3.0 3.0Lane Grp Cap (vph) 246 411 338 262 411 341 100 2959 181 3146v/s Ratio Prot 0.05 0.06 0.02 0.36 c0.06 c0.42v/s Ratio Perm c0.19 0.01 0.05 0.06v/c Ratio 0.84 0.24 0.04 0.21 0.29 0.30 0.43 0.61 0.60 0.67Uniform Delay, d1 48.5 41.7 39.8 41.3 42.2 42.2 59.3 17.4 55.8 15.3Progression Factor 1.00 1.00 1.00 1.00 1.00 1.00 0.69 1.82 1.00 1.00Incremental Delay, d2 22.1 0.3 0.0 0.4 0.4 0.5 2.5 0.8 5.5 1.1Delay (s) 70.5 42.0 39.8 41.7 42.6 42.7 43.6 32.6 61.4 16.5Level of Service E D D D D D D C E BApproach Delay (s) 58.1 42.6 32.9 18.7Approach LOS E D C B
Intersection SummaryHCM 2000 Control Delay 29.2 HCM 2000 Level of Service CHCM 2000 Volume to Capacity ratio 0.72Actuated Cycle Length (s) 130.0 Sum of lost time (s) 12.0Intersection Capacity Utilization 73.1% ICU Level of Service DAnalysis Period (min) 15c Critical Lane Group
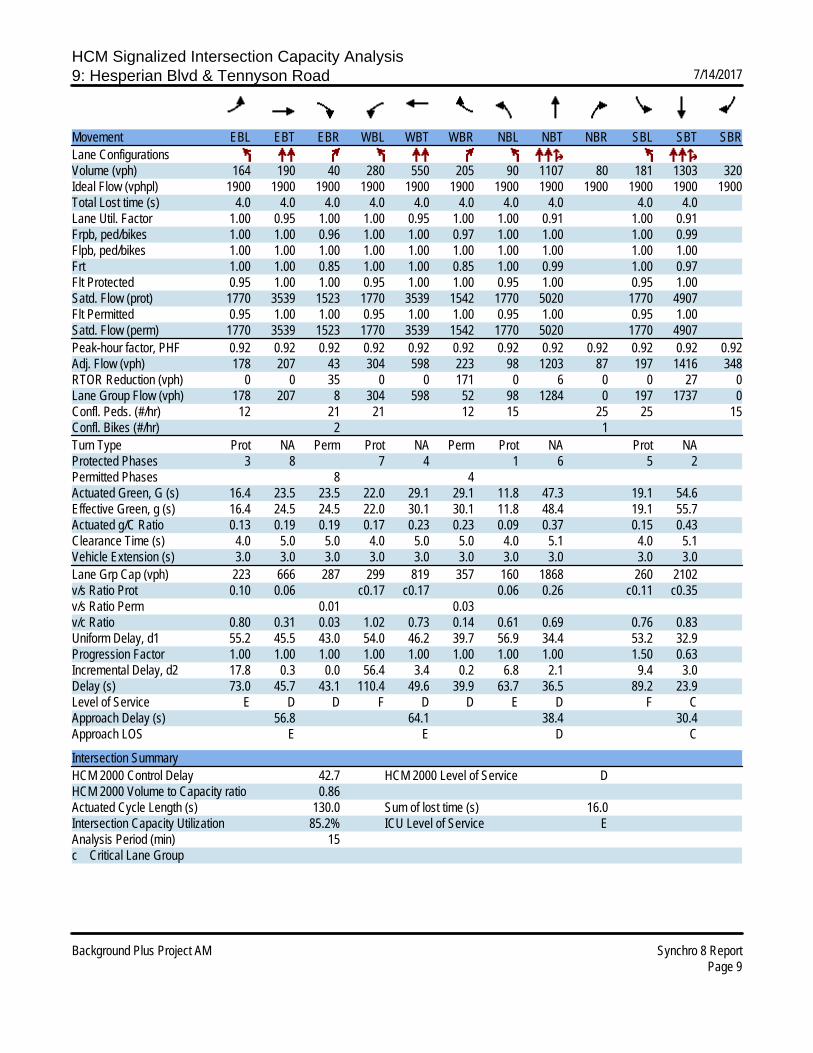
HCM Signalized Intersection Capacity Analysis9: Hesperian Blvd & Tennyson Road 7/14/2017
Background Plus Project AM Synchro 8 ReportPage 9
Movement EBL EBT EBR WBL WBT WBR NBL NBT NBR SBL SBT SBRLane ConfigurationsVolume (vph) 164 190 40 280 550 205 90 1107 80 181 1303 320Ideal Flow (vphpl) 1900 1900 1900 1900 1900 1900 1900 1900 1900 1900 1900 1900Total Lost time (s) 4.0 4.0 4.0 4.0 4.0 4.0 4.0 4.0 4.0 4.0Lane Util. Factor 1.00 0.95 1.00 1.00 0.95 1.00 1.00 0.91 1.00 0.91Frpb, ped/bikes 1.00 1.00 0.96 1.00 1.00 0.97 1.00 1.00 1.00 0.99Flpb, ped/bikes 1.00 1.00 1.00 1.00 1.00 1.00 1.00 1.00 1.00 1.00Frt 1.00 1.00 0.85 1.00 1.00 0.85 1.00 0.99 1.00 0.97Flt Protected 0.95 1.00 1.00 0.95 1.00 1.00 0.95 1.00 0.95 1.00Satd. Flow (prot) 1770 3539 1523 1770 3539 1542 1770 5020 1770 4907Flt Permitted 0.95 1.00 1.00 0.95 1.00 1.00 0.95 1.00 0.95 1.00Satd. Flow (perm) 1770 3539 1523 1770 3539 1542 1770 5020 1770 4907Peak-hour factor, PHF 0.92 0.92 0.92 0.92 0.92 0.92 0.92 0.92 0.92 0.92 0.92 0.92Adj. Flow (vph) 178 207 43 304 598 223 98 1203 87 197 1416 348RTOR Reduction (vph) 0 0 35 0 0 171 0 6 0 0 27 0Lane Group Flow (vph) 178 207 8 304 598 52 98 1284 0 197 1737 0Confl. Peds. (#/hr) 12 21 21 12 15 25 25 15Confl. Bikes (#/hr) 2 1Turn Type Prot NA Perm Prot NA Perm Prot NA Prot NAProtected Phases 3 8 7 4 1 6 5 2Permitted Phases 8 4Actuated Green, G (s) 16.4 23.5 23.5 22.0 29.1 29.1 11.8 47.3 19.1 54.6Effective Green, g (s) 16.4 24.5 24.5 22.0 30.1 30.1 11.8 48.4 19.1 55.7Actuated g/C Ratio 0.13 0.19 0.19 0.17 0.23 0.23 0.09 0.37 0.15 0.43Clearance Time (s) 4.0 5.0 5.0 4.0 5.0 5.0 4.0 5.1 4.0 5.1Vehicle Extension (s) 3.0 3.0 3.0 3.0 3.0 3.0 3.0 3.0 3.0 3.0Lane Grp Cap (vph) 223 666 287 299 819 357 160 1868 260 2102v/s Ratio Prot 0.10 0.06 c0.17 c0.17 0.06 0.26 c0.11 c0.35v/s Ratio Perm 0.01 0.03v/c Ratio 0.80 0.31 0.03 1.02 0.73 0.14 0.61 0.69 0.76 0.83Uniform Delay, d1 55.2 45.5 43.0 54.0 46.2 39.7 56.9 34.4 53.2 32.9Progression Factor 1.00 1.00 1.00 1.00 1.00 1.00 1.00 1.00 1.50 0.63Incremental Delay, d2 17.8 0.3 0.0 56.4 3.4 0.2 6.8 2.1 9.4 3.0Delay (s) 73.0 45.7 43.1 110.4 49.6 39.9 63.7 36.5 89.2 23.9Level of Service E D D F D D E D F CApproach Delay (s) 56.8 64.1 38.4 30.4Approach LOS E E D C
Intersection SummaryHCM 2000 Control Delay 42.7 HCM 2000 Level of Service DHCM 2000 Volume to Capacity ratio 0.86Actuated Cycle Length (s) 130.0 Sum of lost time (s) 16.0Intersection Capacity Utilization 85.2% ICU Level of Service EAnalysis Period (min) 15c Critical Lane Group
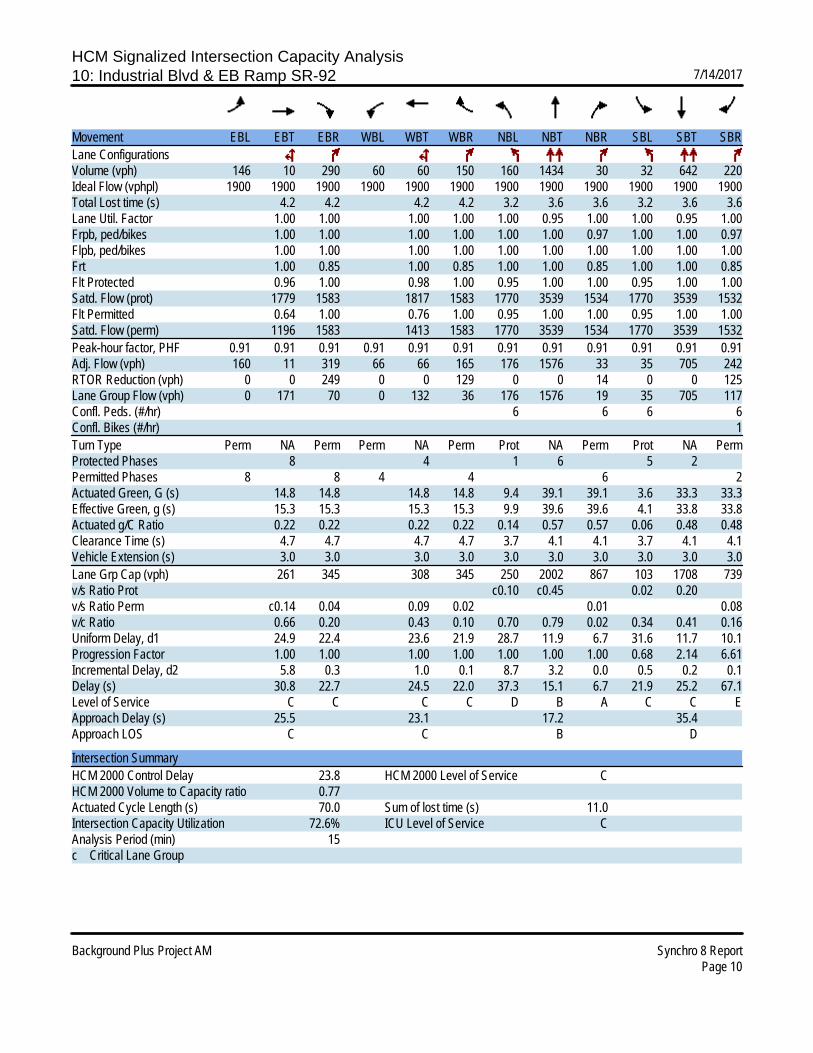
HCM Signalized Intersection Capacity Analysis10: Industrial Blvd & EB Ramp SR-92 7/14/2017
Background Plus Project AM Synchro 8 ReportPage 10
Movement EBL EBT EBR WBL WBT WBR NBL NBT NBR SBL SBT SBRLane ConfigurationsVolume (vph) 146 10 290 60 60 150 160 1434 30 32 642 220Ideal Flow (vphpl) 1900 1900 1900 1900 1900 1900 1900 1900 1900 1900 1900 1900Total Lost time (s) 4.2 4.2 4.2 4.2 3.2 3.6 3.6 3.2 3.6 3.6Lane Util. Factor 1.00 1.00 1.00 1.00 1.00 0.95 1.00 1.00 0.95 1.00Frpb, ped/bikes 1.00 1.00 1.00 1.00 1.00 1.00 0.97 1.00 1.00 0.97Flpb, ped/bikes 1.00 1.00 1.00 1.00 1.00 1.00 1.00 1.00 1.00 1.00Frt 1.00 0.85 1.00 0.85 1.00 1.00 0.85 1.00 1.00 0.85Flt Protected 0.96 1.00 0.98 1.00 0.95 1.00 1.00 0.95 1.00 1.00Satd. Flow (prot) 1779 1583 1817 1583 1770 3539 1534 1770 3539 1532Flt Permitted 0.64 1.00 0.76 1.00 0.95 1.00 1.00 0.95 1.00 1.00Satd. Flow (perm) 1196 1583 1413 1583 1770 3539 1534 1770 3539 1532Peak-hour factor, PHF 0.91 0.91 0.91 0.91 0.91 0.91 0.91 0.91 0.91 0.91 0.91 0.91Adj. Flow (vph) 160 11 319 66 66 165 176 1576 33 35 705 242RTOR Reduction (vph) 0 0 249 0 0 129 0 0 14 0 0 125Lane Group Flow (vph) 0 171 70 0 132 36 176 1576 19 35 705 117Confl. Peds. (#/hr) 6 6 6 6Confl. Bikes (#/hr) 1Turn Type Perm NA Perm Perm NA Perm Prot NA Perm Prot NA PermProtected Phases 8 4 1 6 5 2Permitted Phases 8 8 4 4 6 2Actuated Green, G (s) 14.8 14.8 14.8 14.8 9.4 39.1 39.1 3.6 33.3 33.3Effective Green, g (s) 15.3 15.3 15.3 15.3 9.9 39.6 39.6 4.1 33.8 33.8Actuated g/C Ratio 0.22 0.22 0.22 0.22 0.14 0.57 0.57 0.06 0.48 0.48Clearance Time (s) 4.7 4.7 4.7 4.7 3.7 4.1 4.1 3.7 4.1 4.1Vehicle Extension (s) 3.0 3.0 3.0 3.0 3.0 3.0 3.0 3.0 3.0 3.0Lane Grp Cap (vph) 261 345 308 345 250 2002 867 103 1708 739v/s Ratio Prot c0.10 c0.45 0.02 0.20v/s Ratio Perm c0.14 0.04 0.09 0.02 0.01 0.08v/c Ratio 0.66 0.20 0.43 0.10 0.70 0.79 0.02 0.34 0.41 0.16Uniform Delay, d1 24.9 22.4 23.6 21.9 28.7 11.9 6.7 31.6 11.7 10.1Progression Factor 1.00 1.00 1.00 1.00 1.00 1.00 1.00 0.68 2.14 6.61Incremental Delay, d2 5.8 0.3 1.0 0.1 8.7 3.2 0.0 0.5 0.2 0.1Delay (s) 30.8 22.7 24.5 22.0 37.3 15.1 6.7 21.9 25.2 67.1Level of Service C C C C D B A C C EApproach Delay (s) 25.5 23.1 17.2 35.4Approach LOS C C B D
Intersection SummaryHCM 2000 Control Delay 23.8 HCM 2000 Level of Service CHCM 2000 Volume to Capacity ratio 0.77Actuated Cycle Length (s) 70.0 Sum of lost time (s) 11.0Intersection Capacity Utilization 72.6% ICU Level of Service CAnalysis Period (min) 15c Critical Lane Group

HCM Signalized Intersection Capacity Analysis11: Industrial Blvd & WB Ramp SR-92 7/14/2017
Background Plus Project AM Synchro 8 ReportPage 11
Movement EBL EBT EBR WBL WBT WBR NBL NBT NBR SBL SBT SBRLane ConfigurationsVolume (vph) 80 20 70 140 150 10 550 980 160 10 704 360Ideal Flow (vphpl) 1900 1900 1900 1900 1900 1900 1900 1900 1900 1900 1900 1900Total Lost time (s) 4.2 4.2 4.2 4.2 3.2 3.6 3.2 3.6Lane Util. Factor 1.00 1.00 1.00 1.00 1.00 0.95 1.00 0.95Frpb, ped/bikes 1.00 1.00 1.00 1.00 1.00 1.00 1.00 0.99Flpb, ped/bikes 1.00 1.00 1.00 1.00 1.00 1.00 1.00 1.00Frt 1.00 0.85 1.00 0.85 1.00 0.98 1.00 0.95Flt Protected 0.96 1.00 0.98 1.00 0.95 1.00 0.95 1.00Satd. Flow (prot) 1791 1583 1819 1583 1770 3450 1770 3326Flt Permitted 0.27 1.00 0.79 1.00 0.95 1.00 0.95 1.00Satd. Flow (perm) 506 1583 1473 1583 1770 3450 1770 3326Peak-hour factor, PHF 0.90 0.90 0.90 0.90 0.90 0.90 0.90 0.90 0.90 0.90 0.90 0.90Adj. Flow (vph) 89 22 78 156 167 11 611 1089 178 11 782 400RTOR Reduction (vph) 0 0 62 0 0 9 0 15 0 0 92 0Lane Group Flow (vph) 0 111 16 0 323 2 611 1252 0 11 1090 0Confl. Peds. (#/hr) 6 7 7 6Turn Type Perm NA Perm Perm NA Perm Prot NA Prot NAProtected Phases 8 4 1 6 5 2Permitted Phases 8 8 4 4Actuated Green, G (s) 14.3 14.3 14.3 14.3 22.3 41.8 1.4 20.9Effective Green, g (s) 14.8 14.8 14.8 14.8 22.8 42.3 1.9 21.4Actuated g/C Ratio 0.21 0.21 0.21 0.21 0.33 0.60 0.03 0.31Clearance Time (s) 4.7 4.7 4.7 4.7 3.7 4.1 3.7 4.1Vehicle Extension (s) 3.0 3.0 3.0 3.0 3.0 3.0 3.0 3.0Lane Grp Cap (vph) 106 334 311 334 576 2084 48 1016v/s Ratio Prot c0.35 0.36 0.01 c0.33v/s Ratio Perm c0.22 0.01 0.22 0.00v/c Ratio 1.05 0.05 1.04 0.01 1.06 0.60 0.23 1.07Uniform Delay, d1 27.6 22.0 27.6 21.8 23.6 8.6 33.3 24.3Progression Factor 1.00 1.00 1.00 1.00 1.18 0.85 1.00 1.00Incremental Delay, d2 100.7 0.1 61.4 0.0 49.0 0.9 2.4 49.8Delay (s) 128.3 22.1 89.0 21.8 76.9 8.3 35.8 74.1Level of Service F C F C E A D EApproach Delay (s) 84.4 86.8 30.6 73.7Approach LOS F F C E
Intersection SummaryHCM 2000 Control Delay 53.0 HCM 2000 Level of Service DHCM 2000 Volume to Capacity ratio 1.06Actuated Cycle Length (s) 70.0 Sum of lost time (s) 11.0Intersection Capacity Utilization 99.3% ICU Level of Service FAnalysis Period (min) 15c Critical Lane Group

HCM Signalized Intersection Capacity Analysis12: Industrial Blvd & Depot Road 7/14/2017
Background Plus Project AM Synchro 8 ReportPage 12
Movement EBL EBT EBR WBL WBT WBR NBL NBT NBR SBL SBT SBRLane ConfigurationsVolume (vph) 20 40 180 144 150 64 360 370 90 34 740 120Ideal Flow (vphpl) 1900 1900 1900 1900 1900 1900 1900 1900 1900 1900 1900 1900Total Lost time (s) 4.0 4.0 4.0 4.5 4.0 4.0 4.0 4.0 4.0 4.0Lane Util. Factor 1.00 1.00 1.00 0.95 1.00 0.95 1.00 1.00 0.95 1.00Frpb, ped/bikes 1.00 1.00 0.98 1.00 1.00 1.00 1.00 1.00 1.00 0.99Flpb, ped/bikes 1.00 1.00 1.00 1.00 1.00 1.00 1.00 1.00 1.00 1.00Frt 1.00 1.00 0.85 0.97 1.00 1.00 0.85 1.00 1.00 0.85Flt Protected 0.95 1.00 1.00 0.98 0.95 1.00 1.00 0.95 1.00 1.00Satd. Flow (prot) 1770 1863 1554 3372 1770 3539 1583 1770 3539 1562Flt Permitted 0.44 1.00 1.00 0.82 0.95 1.00 1.00 0.95 1.00 1.00Satd. Flow (perm) 812 1863 1554 2813 1770 3539 1583 1770 3539 1562Peak-hour factor, PHF 0.93 0.93 0.93 0.93 0.93 0.93 0.93 0.93 0.93 0.93 0.93 0.93Adj. Flow (vph) 22 43 194 155 161 69 387 398 97 37 796 129RTOR Reduction (vph) 0 0 143 0 20 0 0 0 45 0 0 82Lane Group Flow (vph) 22 43 51 0 365 0 387 398 52 37 796 47Confl. Peds. (#/hr) 3 3 1 1Confl. Bikes (#/hr) 4Turn Type Perm NA Perm Perm NA Prot NA Perm Prot NA PermProtected Phases 4 4 5 2 1 6Permitted Phases 4 4 4 2 6Actuated Green, G (s) 23.1 23.1 23.1 23.1 21.4 47.0 47.0 6.3 31.9 31.9Effective Green, g (s) 23.6 23.6 23.6 23.1 21.4 48.0 48.0 6.3 32.9 32.9Actuated g/C Ratio 0.26 0.26 0.26 0.26 0.24 0.53 0.53 0.07 0.37 0.37Clearance Time (s) 4.5 4.5 4.5 4.5 4.0 5.0 5.0 4.0 5.0 5.0Vehicle Extension (s) 6.0 6.0 6.0 6.0 6.0 8.0 8.0 6.0 8.0 8.0Lane Grp Cap (vph) 213 489 407 722 421 1889 845 124 1295 571v/s Ratio Prot 0.02 c0.22 0.11 0.02 c0.22v/s Ratio Perm 0.03 0.03 c0.13 0.03 0.03v/c Ratio 0.10 0.09 0.13 0.51 0.92 0.21 0.06 0.30 0.61 0.08Uniform Delay, d1 25.1 25.0 25.3 28.5 33.4 11.0 10.1 39.7 23.3 18.6Progression Factor 1.00 1.00 1.00 1.00 1.00 1.00 1.00 1.00 1.00 1.00Incremental Delay, d2 0.6 0.2 0.4 1.6 26.6 0.2 0.1 3.8 2.0 0.3Delay (s) 25.7 25.2 25.7 30.1 60.0 11.2 10.2 43.5 25.4 18.9Level of Service C C C C E B B D C BApproach Delay (s) 25.6 30.1 32.5 25.2Approach LOS C C C C
Intersection SummaryHCM 2000 Control Delay 28.6 HCM 2000 Level of Service CHCM 2000 Volume to Capacity ratio 0.67Actuated Cycle Length (s) 89.9 Sum of lost time (s) 12.5Intersection Capacity Utilization 67.6% ICU Level of Service CAnalysis Period (min) 15c Critical Lane Group

HCM Unsignalized Intersection Capacity Analysis13: Depot Road & West Driveway 7/14/2017
Background Plus Project AM Synchro 8 ReportPage 13
Movement EBL EBT WBT WBR SBL SBRLane ConfigurationsVolume (veh/h) 34 470 450 80 20 16Sign Control Free Free StopGrade 0% 0% 0%Peak Hour Factor 0.91 0.91 0.91 0.91 0.91 0.91Hourly flow rate (vph) 37 516 495 88 22 18Pedestrians 2 29Lane Width (ft) 12.0 12.0Walking Speed (ft/s) 3.5 3.5Percent Blockage 0 3Right turn flare (veh)Median type None NoneMedian storage veh)Upstream signal (ft)pX, platoon unblockedvC, conflicting volume 611 902 567vC1, stage 1 conf volvC2, stage 2 conf volvCu, unblocked vol 611 902 567tC, single (s) 4.1 6.8 6.9tC, 2 stage (s)tF (s) 2.2 3.5 3.3p0 queue free % 96 91 96cM capacity (veh/h) 937 258 454
Direction, Lane # EB 1 EB 2 WB 1 SB 1Volume Total 210 344 582 40Volume Left 37 0 0 22Volume Right 0 0 88 18cSH 937 1700 1700 319Volume to Capacity 0.04 0.20 0.34 0.12Queue Length 95th (ft) 3 0 0 10Control Delay (s) 1.9 0.0 0.0 17.9Lane LOS A CApproach Delay (s) 0.7 0.0 17.9Approach LOS C
Intersection SummaryAverage Delay 0.9Intersection Capacity Utilization 48.8% ICU Level of Service AAnalysis Period (min) 15
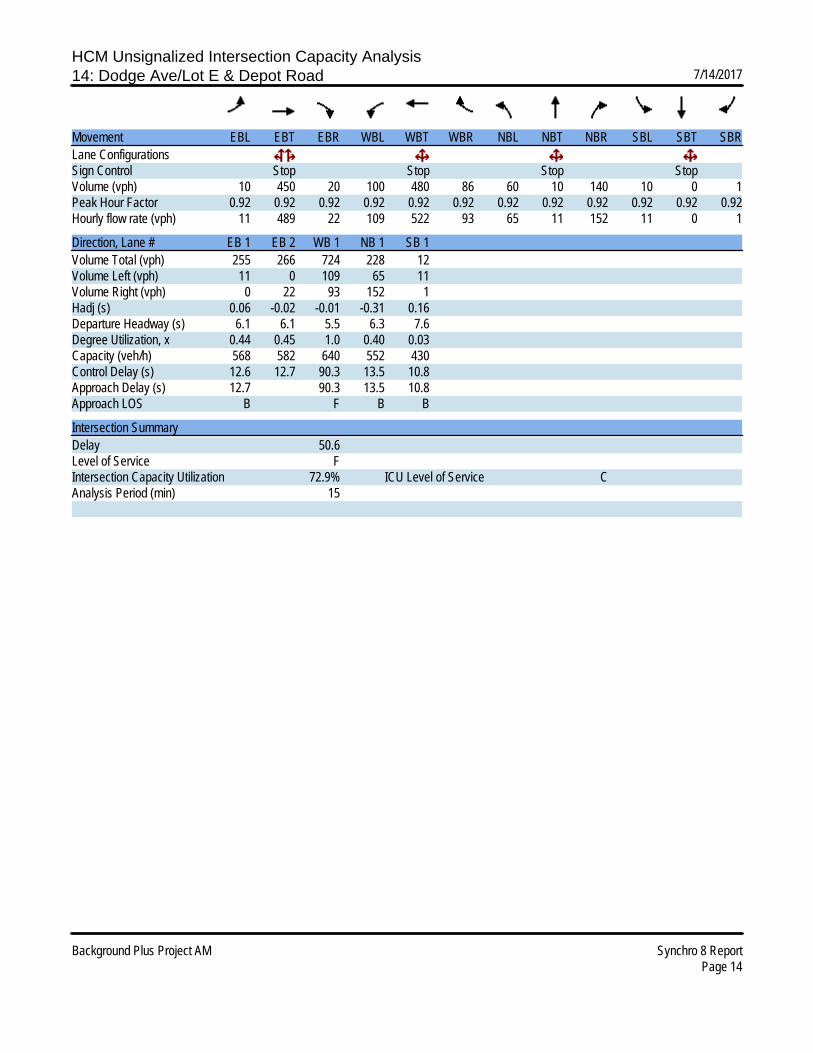
HCM Unsignalized Intersection Capacity Analysis14: Dodge Ave/Lot E & Depot Road 7/14/2017
Background Plus Project AM Synchro 8 ReportPage 14
Movement EBL EBT EBR WBL WBT WBR NBL NBT NBR SBL SBT SBRLane ConfigurationsSign Control Stop Stop Stop StopVolume (vph) 10 450 20 100 480 86 60 10 140 10 0 1Peak Hour Factor 0.92 0.92 0.92 0.92 0.92 0.92 0.92 0.92 0.92 0.92 0.92 0.92Hourly flow rate (vph) 11 489 22 109 522 93 65 11 152 11 0 1
Direction, Lane # EB 1 EB 2 WB 1 NB 1 SB 1Volume Total (vph) 255 266 724 228 12Volume Left (vph) 11 0 109 65 11Volume Right (vph) 0 22 93 152 1Hadj (s) 0.06 -0.02 -0.01 -0.31 0.16Departure Headway (s) 6.1 6.1 5.5 6.3 7.6Degree Utilization, x 0.44 0.45 1.0 0.40 0.03Capacity (veh/h) 568 582 640 552 430Control Delay (s) 12.6 12.7 90.3 13.5 10.8Approach Delay (s) 12.7 90.3 13.5 10.8Approach LOS B F B B
Intersection SummaryDelay 50.6Level of Service FIntersection Capacity Utilization 72.9% ICU Level of Service CAnalysis Period (min) 15

HCM Unsignalized Intersection Capacity Analysis15: Depot Road & Lot F 7/14/2017
Background Plus Project AM Synchro 8 ReportPage 15
Movement EBL EBT WBT WBR SBL SBRLane ConfigurationsVolume (veh/h) 20 570 550 30 10 111Sign Control Free Free StopGrade 0% 0% 0%Peak Hour Factor 0.92 0.92 0.92 0.92 0.92 0.92Hourly flow rate (vph) 22 620 598 33 11 121Pedestrians 9Lane Width (ft) 12.0Walking Speed (ft/s) 3.5Percent Blockage 1Right turn flare (veh)Median type None NoneMedian storage veh)Upstream signal (ft) 957pX, platoon unblocked 0.98 0.98 0.98vC, conflicting volume 639 976 623vC1, stage 1 conf volvC2, stage 2 conf volvCu, unblocked vol 621 965 604tC, single (s) 4.1 6.8 6.9tC, 2 stage (s)tF (s) 2.2 3.5 3.3p0 queue free % 98 95 72cM capacity (veh/h) 928 239 428
Direction, Lane # EB 1 EB 2 WB 1 SB 1Volume Total 228 413 630 132Volume Left 22 0 0 11Volume Right 0 0 33 121cSH 928 1700 1700 402Volume to Capacity 0.02 0.24 0.37 0.33Queue Length 95th (ft) 2 0 0 35Control Delay (s) 1.1 0.0 0.0 18.2Lane LOS A CApproach Delay (s) 0.4 0.0 18.2Approach LOS C
Intersection SummaryAverage Delay 1.9Intersection Capacity Utilization 44.9% ICU Level of Service AAnalysis Period (min) 15

HCM Unsignalized Intersection Capacity Analysis16: Depot Road & Lot G 7/14/2017
Background Plus Project AM Synchro 8 ReportPage 16
Movement EBL EBT WBT WBR SBL SBRLane ConfigurationsVolume (veh/h) 0 590 580 95 11 10Sign Control Free Free StopGrade 0% 0% 0%Peak Hour Factor 0.93 0.93 0.93 0.93 0.93 0.93Hourly flow rate (vph) 0 634 624 102 12 11Pedestrians 19 19 5Lane Width (ft) 12.0 12.0 12.0Walking Speed (ft/s) 3.5 3.5 3.5Percent Blockage 2 2 0Right turn flare (veh)Median type None NoneMedian storage veh)Upstream signal (ft) 529pX, platoon unblocked 0.93 0.93 0.93vC, conflicting volume 731 965 648vC1, stage 1 conf volvC2, stage 2 conf volvCu, unblocked vol 677 927 588tC, single (s) 4.1 6.8 6.9tC, 2 stage (s)tF (s) 2.2 3.5 3.3p0 queue free % 100 95 97cM capacity (veh/h) 847 244 413
Direction, Lane # EB 1 EB 2 WB 1 WB 2 SB 1Volume Total 211 423 624 102 23Volume Left 0 0 0 0 12Volume Right 0 0 0 102 11cSH 847 1700 1700 1700 303Volume to Capacity 0.00 0.25 0.37 0.06 0.07Queue Length 95th (ft) 0 0 0 0 6Control Delay (s) 0.0 0.0 0.0 0.0 17.8Lane LOS CApproach Delay (s) 0.0 0.0 17.8Approach LOS C
Intersection SummaryAverage Delay 0.3Intersection Capacity Utilization 45.2% ICU Level of Service AAnalysis Period (min) 15

HCM Signalized Intersection Capacity Analysis1: Hesperian Blvd & Winton Ave 7/14/2017
Background Plus Project PM Synchro 8 ReportPage 1
Movement EBL EBT EBR WBL WBT WBR NBL NBT NBR SBL SBT SBRLane ConfigurationsVolume (vph) 760 1150 93 326 340 190 83 1535 304 240 778 260Ideal Flow (vphpl) 1900 1900 1900 1900 1900 1900 1900 1900 1900 1900 1900 1900Total Lost time (s) 4.0 4.0 4.0 4.0 4.0 4.0 4.0 4.0 4.0 4.0 2.5Lane Util. Factor 0.97 0.91 1.00 0.95 1.00 1.00 0.91 1.00 0.97 0.91 1.00Frpb, ped/bikes 1.00 1.00 1.00 1.00 0.98 1.00 1.00 0.98 1.00 1.00 0.99Flpb, ped/bikes 1.00 1.00 1.00 1.00 1.00 1.00 1.00 1.00 1.00 1.00 1.00Frt 1.00 0.99 1.00 1.00 0.85 1.00 1.00 0.85 1.00 1.00 0.85Flt Protected 0.95 1.00 0.95 1.00 1.00 0.95 1.00 1.00 0.95 1.00 1.00Satd. Flow (prot) 3433 5019 1770 3539 1551 1770 5085 1551 3433 5085 1562Flt Permitted 0.95 1.00 0.95 1.00 1.00 0.95 1.00 1.00 0.95 1.00 1.00Satd. Flow (perm) 3433 5019 1770 3539 1551 1770 5085 1551 3433 5085 1562Peak-hour factor, PHF 0.98 0.98 0.98 0.98 0.98 0.98 0.98 0.98 0.98 0.98 0.98 0.98Adj. Flow (vph) 776 1173 95 333 347 194 85 1566 310 245 794 265RTOR Reduction (vph) 0 7 0 0 0 69 0 0 81 0 0 0Lane Group Flow (vph) 776 1261 0 333 347 125 85 1566 229 245 794 265Confl. Peds. (#/hr) 6 10 10 6 4 7 7 4Turn Type Prot NA Prot NA Perm Prot NA Perm Prot NA FreeProtected Phases 3 8 7 4 5 2 1 6Permitted Phases 4 2 FreeActuated Green, G (s) 8.5 34.5 10.5 36.5 36.5 6.5 70.5 70.5 9.5 73.5 145.0Effective Green, g (s) 9.0 36.0 11.0 38.0 38.0 7.0 72.0 72.0 10.0 75.0 145.0Actuated g/C Ratio 0.06 0.25 0.08 0.26 0.26 0.05 0.50 0.50 0.07 0.52 1.00Clearance Time (s) 4.5 5.5 4.5 5.5 5.5 4.5 5.5 5.5 4.5 5.5Vehicle Extension (s) 3.0 3.0 3.0 3.0 3.0 3.0 3.0 3.0 3.0 3.0Lane Grp Cap (vph) 213 1246 134 927 406 85 2524 770 236 2630 1562v/s Ratio Prot c0.23 c0.25 0.19 0.10 0.05 c0.31 c0.07 0.16v/s Ratio Perm 0.08 0.15 c0.17v/c Ratio 3.64 1.01 2.49 0.37 0.31 1.00 0.62 0.30 1.04 0.30 0.17Uniform Delay, d1 68.0 54.5 67.0 43.8 42.9 69.0 26.6 21.6 67.5 20.0 0.0Progression Factor 1.00 1.00 1.00 1.00 1.00 1.00 1.00 1.00 1.00 1.00 1.00Incremental Delay, d2 1201.0 28.6 690.1 0.3 0.4 97.6 1.2 1.0 68.9 0.3 0.2Delay (s) 1269.0 83.1 757.1 44.0 43.4 166.6 27.7 22.6 136.4 20.3 0.2Level of Service F F F D D F C C F C AApproach Delay (s) 533.3 315.5 32.9 38.0Approach LOS F F C D
Intersection SummaryHCM 2000 Control Delay 239.4 HCM 2000 Level of Service FHCM 2000 Volume to Capacity ratio 0.96Actuated Cycle Length (s) 145.0 Sum of lost time (s) 16.0Intersection Capacity Utilization 93.4% ICU Level of Service FAnalysis Period (min) 15c Critical Lane Group

HCM Signalized Intersection Capacity Analysis2: Hesperian Blvd & Southland Drive 7/14/2017
Background Plus Project PM Synchro 8 ReportPage 2
Movement EBL EBT EBR WBL WBT WBR NBL NBT NBR SBL SBT SBRLane ConfigurationsVolume (vph) 240 470 80 110 110 130 80 1602 160 180 837 150Ideal Flow (vphpl) 1900 1900 1900 1900 1900 1900 1900 1900 1900 1900 1900 1900Total Lost time (s) 4.0 4.0 4.0 4.0 4.0 4.0 4.0 4.0Lane Util. Factor 1.00 0.95 1.00 0.91 1.00 0.91 1.00 0.91Frpb, ped/bikes 1.00 1.00 1.00 0.99 1.00 1.00 1.00 1.00Flpb, ped/bikes 1.00 1.00 0.99 1.00 1.00 1.00 1.00 1.00Frt 1.00 0.98 1.00 0.92 1.00 0.99 1.00 0.98Flt Protected 0.95 1.00 0.95 1.00 0.95 1.00 0.95 1.00Satd. Flow (prot) 1767 3448 1759 4635 1770 5010 1770 4956Flt Permitted 0.58 1.00 0.26 1.00 0.95 1.00 0.95 1.00Satd. Flow (perm) 1083 3448 489 4635 1770 5010 1770 4956Peak-hour factor, PHF 0.94 0.94 0.94 0.94 0.94 0.94 0.94 0.94 0.94 0.94 0.94 0.94Adj. Flow (vph) 255 500 85 117 117 138 85 1704 170 191 890 160RTOR Reduction (vph) 0 14 0 0 98 0 0 11 0 0 20 0Lane Group Flow (vph) 255 571 0 117 157 0 85 1863 0 191 1030 0Confl. Peds. (#/hr) 2 16 16 2 4 1 1 4Confl. Bikes (#/hr) 1 1Turn Type Perm NA Perm NA Prot NA Prot NAProtected Phases 8 4 1 6 5 2Permitted Phases 8 4Actuated Green, G (s) 31.5 31.5 31.5 31.5 7.9 50.4 15.5 58.0Effective Green, g (s) 31.5 31.5 31.5 31.5 7.9 51.0 15.5 58.6Actuated g/C Ratio 0.29 0.29 0.29 0.29 0.07 0.46 0.14 0.53Clearance Time (s) 4.0 4.0 4.0 4.0 4.0 4.6 4.0 4.6Vehicle Extension (s) 3.0 3.0 3.0 3.0 3.0 3.0 3.0 3.0Lane Grp Cap (vph) 310 987 140 1327 127 2322 249 2640v/s Ratio Prot 0.17 0.03 0.05 c0.37 c0.11 0.21v/s Ratio Perm 0.24 c0.24v/c Ratio 0.82 0.58 0.84 0.12 0.67 0.80 0.77 0.39Uniform Delay, d1 36.6 33.6 36.8 29.0 49.8 25.2 45.5 15.2Progression Factor 1.00 1.00 1.00 1.00 0.71 1.60 1.00 1.00Incremental Delay, d2 16.0 0.8 32.9 0.0 10.1 2.4 13.2 0.4Delay (s) 52.6 34.4 69.8 29.0 45.4 42.7 58.7 15.6Level of Service D C E C D D E BApproach Delay (s) 39.9 41.8 42.8 22.2Approach LOS D D D C
Intersection SummaryHCM 2000 Control Delay 36.4 HCM 2000 Level of Service DHCM 2000 Volume to Capacity ratio 0.81Actuated Cycle Length (s) 110.0 Sum of lost time (s) 12.0Intersection Capacity Utilization 85.3% ICU Level of Service EAnalysis Period (min) 15c Critical Lane Group

HCM Signalized Intersection Capacity Analysis3: Hesperian Blvd & Turner Court 7/14/2017
Background Plus Project PM Synchro 8 ReportPage 3
Movement EBL EBT EBR WBL WBT WBR NBL NBT NBR SBL SBT SBRLane ConfigurationsVolume (vph) 155 30 70 60 20 70 80 1767 70 110 937 130Ideal Flow (vphpl) 1900 1900 1900 1900 1900 1900 1900 1900 1900 1900 1900 1900Total Lost time (s) 4.0 4.0 4.0 4.6 4.0 4.0 4.0 4.0Lane Util. Factor 1.00 1.00 1.00 1.00 1.00 0.91 1.00 0.91Frpb, ped/bikes 1.00 0.96 1.00 0.99 1.00 1.00 1.00 0.99Flpb, ped/bikes 1.00 1.00 0.97 1.00 1.00 1.00 1.00 1.00Frt 1.00 0.90 1.00 0.85 1.00 0.99 1.00 0.98Flt Protected 0.95 1.00 0.96 1.00 0.95 1.00 0.95 1.00Satd. Flow (prot) 1768 1607 1748 1562 1770 5046 1770 4966Flt Permitted 0.69 1.00 0.73 1.00 0.95 1.00 0.95 1.00Satd. Flow (perm) 1280 1607 1318 1562 1770 5046 1770 4966Peak-hour factor, PHF 0.94 0.94 0.94 0.94 0.94 0.94 0.94 0.94 0.94 0.94 0.94 0.94Adj. Flow (vph) 165 32 74 64 21 74 85 1880 74 117 997 138RTOR Reduction (vph) 0 60 0 0 0 60 0 3 0 0 10 0Lane Group Flow (vph) 165 46 0 0 85 14 85 1951 0 117 1125 0Confl. Peds. (#/hr) 1 40 40 1 10 19 19 10Turn Type Perm NA Perm NA Perm Prot NA Prot NAProtected Phases 4 8 1 6 5 2Permitted Phases 4 8 8Actuated Green, G (s) 20.2 20.2 20.2 20.2 9.3 65.0 11.6 67.3Effective Green, g (s) 20.8 20.8 20.8 20.2 9.3 65.6 11.6 67.9Actuated g/C Ratio 0.19 0.19 0.19 0.18 0.08 0.60 0.11 0.62Clearance Time (s) 4.6 4.6 4.6 4.6 4.0 4.6 4.0 4.6Vehicle Extension (s) 3.0 3.0 3.0 3.0 3.0 3.0 3.0 3.0Lane Grp Cap (vph) 242 303 249 286 149 3009 186 3065v/s Ratio Prot 0.03 0.05 c0.39 c0.07 0.23v/s Ratio Perm c0.13 0.06 0.01v/c Ratio 0.68 0.15 0.34 0.05 0.57 0.65 0.63 0.37Uniform Delay, d1 41.5 37.2 38.7 37.0 48.4 14.6 47.1 10.4Progression Factor 1.00 1.00 1.00 1.00 1.00 1.00 0.92 1.24Incremental Delay, d2 7.7 0.2 0.8 0.1 5.2 1.1 6.2 0.3Delay (s) 49.2 37.5 39.5 37.0 53.6 15.7 49.3 13.3Level of Service D D D D D B D BApproach Delay (s) 44.6 38.3 17.3 16.6Approach LOS D D B B
Intersection SummaryHCM 2000 Control Delay 20.0 HCM 2000 Level of Service BHCM 2000 Volume to Capacity ratio 0.65Actuated Cycle Length (s) 110.0 Sum of lost time (s) 12.0Intersection Capacity Utilization 75.5% ICU Level of Service DAnalysis Period (min) 15c Critical Lane Group

HCM Signalized Intersection Capacity Analysis4: Hesperian Blvd & East Driveway 7/14/2017
Background Plus Project PM Synchro 8 ReportPage 4
Movement EBL EBR NBL NBT SBU SBT SBRLane ConfigurationsVolume (vph) 87 127 112 1860 0 994 73Ideal Flow (vphpl) 1900 1900 1900 1900 1900 1900 1900Total Lost time (s) 4.0 4.0 4.0 4.0 4.0Lane Util. Factor 1.00 1.00 1.00 0.91 0.91Frpb, ped/bikes 1.00 0.98 1.00 1.00 1.00Flpb, ped/bikes 1.00 1.00 1.00 1.00 1.00Frt 1.00 0.85 1.00 1.00 0.99Flt Protected 0.95 1.00 0.95 1.00 1.00Satd. Flow (prot) 1770 1555 1770 5085 5025Flt Permitted 0.95 1.00 0.95 1.00 1.00Satd. Flow (perm) 1770 1555 1770 5085 5025Peak-hour factor, PHF 0.95 0.95 0.95 0.95 0.95 0.95 0.95Adj. Flow (vph) 92 134 118 1958 0 1046 77RTOR Reduction (vph) 0 119 0 0 0 5 0Lane Group Flow (vph) 92 15 118 1958 0 1118 0Confl. Peds. (#/hr) 4 1 5 1Turn Type Prot Perm Prot NA Prot NAProtected Phases 4 1 6 5 2Permitted Phases 4Actuated Green, G (s) 14.1 14.1 13.3 106.9 89.6Effective Green, g (s) 14.1 14.1 13.3 107.9 90.6Actuated g/C Ratio 0.11 0.11 0.10 0.83 0.70Clearance Time (s) 4.0 4.0 4.0 5.0 5.0Vehicle Extension (s) 3.0 3.0 3.0 3.0 3.0Lane Grp Cap (vph) 191 168 181 4220 3502v/s Ratio Prot c0.05 c0.07 c0.39 0.22v/s Ratio Perm 0.01v/c Ratio 0.48 0.09 0.65 0.46 0.32Uniform Delay, d1 54.5 52.2 56.1 3.1 7.7Progression Factor 1.00 1.00 0.78 1.75 1.00Incremental Delay, d2 1.9 0.2 6.1 0.3 0.2Delay (s) 56.4 52.4 49.9 5.6 7.9Level of Service E D D A AApproach Delay (s) 54.0 8.1 7.9Approach LOS D A A
Intersection SummaryHCM 2000 Control Delay 11.1 HCM 2000 Level of Service BHCM 2000 Volume to Capacity ratio 0.50Actuated Cycle Length (s) 130.0 Sum of lost time (s) 12.0Intersection Capacity Utilization 57.8% ICU Level of Service BAnalysis Period (min) 15c Critical Lane Group
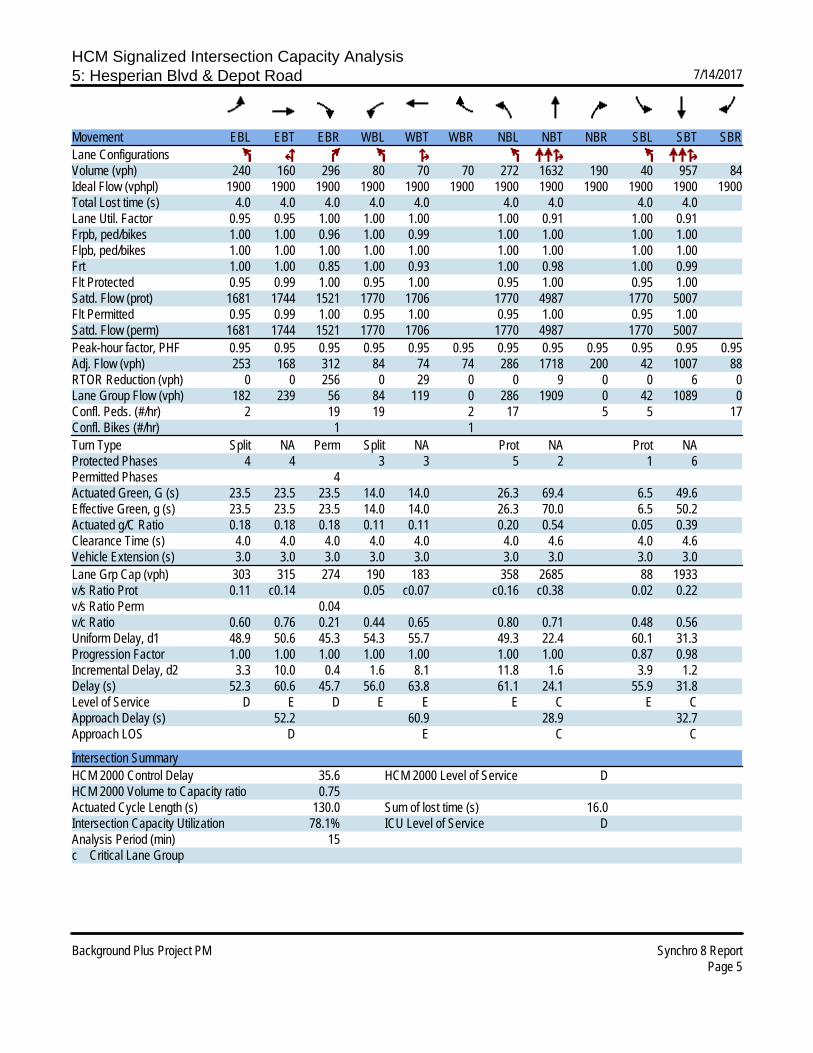
HCM Signalized Intersection Capacity Analysis5: Hesperian Blvd & Depot Road 7/14/2017
Background Plus Project PM Synchro 8 ReportPage 5
Movement EBL EBT EBR WBL WBT WBR NBL NBT NBR SBL SBT SBRLane ConfigurationsVolume (vph) 240 160 296 80 70 70 272 1632 190 40 957 84Ideal Flow (vphpl) 1900 1900 1900 1900 1900 1900 1900 1900 1900 1900 1900 1900Total Lost time (s) 4.0 4.0 4.0 4.0 4.0 4.0 4.0 4.0 4.0Lane Util. Factor 0.95 0.95 1.00 1.00 1.00 1.00 0.91 1.00 0.91Frpb, ped/bikes 1.00 1.00 0.96 1.00 0.99 1.00 1.00 1.00 1.00Flpb, ped/bikes 1.00 1.00 1.00 1.00 1.00 1.00 1.00 1.00 1.00Frt 1.00 1.00 0.85 1.00 0.93 1.00 0.98 1.00 0.99Flt Protected 0.95 0.99 1.00 0.95 1.00 0.95 1.00 0.95 1.00Satd. Flow (prot) 1681 1744 1521 1770 1706 1770 4987 1770 5007Flt Permitted 0.95 0.99 1.00 0.95 1.00 0.95 1.00 0.95 1.00Satd. Flow (perm) 1681 1744 1521 1770 1706 1770 4987 1770 5007Peak-hour factor, PHF 0.95 0.95 0.95 0.95 0.95 0.95 0.95 0.95 0.95 0.95 0.95 0.95Adj. Flow (vph) 253 168 312 84 74 74 286 1718 200 42 1007 88RTOR Reduction (vph) 0 0 256 0 29 0 0 9 0 0 6 0Lane Group Flow (vph) 182 239 56 84 119 0 286 1909 0 42 1089 0Confl. Peds. (#/hr) 2 19 19 2 17 5 5 17Confl. Bikes (#/hr) 1 1Turn Type Split NA Perm Split NA Prot NA Prot NAProtected Phases 4 4 3 3 5 2 1 6Permitted Phases 4Actuated Green, G (s) 23.5 23.5 23.5 14.0 14.0 26.3 69.4 6.5 49.6Effective Green, g (s) 23.5 23.5 23.5 14.0 14.0 26.3 70.0 6.5 50.2Actuated g/C Ratio 0.18 0.18 0.18 0.11 0.11 0.20 0.54 0.05 0.39Clearance Time (s) 4.0 4.0 4.0 4.0 4.0 4.0 4.6 4.0 4.6Vehicle Extension (s) 3.0 3.0 3.0 3.0 3.0 3.0 3.0 3.0 3.0Lane Grp Cap (vph) 303 315 274 190 183 358 2685 88 1933v/s Ratio Prot 0.11 c0.14 0.05 c0.07 c0.16 c0.38 0.02 0.22v/s Ratio Perm 0.04v/c Ratio 0.60 0.76 0.21 0.44 0.65 0.80 0.71 0.48 0.56Uniform Delay, d1 48.9 50.6 45.3 54.3 55.7 49.3 22.4 60.1 31.3Progression Factor 1.00 1.00 1.00 1.00 1.00 1.00 1.00 0.87 0.98Incremental Delay, d2 3.3 10.0 0.4 1.6 8.1 11.8 1.6 3.9 1.2Delay (s) 52.3 60.6 45.7 56.0 63.8 61.1 24.1 55.9 31.8Level of Service D E D E E E C E CApproach Delay (s) 52.2 60.9 28.9 32.7Approach LOS D E C C
Intersection SummaryHCM 2000 Control Delay 35.6 HCM 2000 Level of Service DHCM 2000 Volume to Capacity ratio 0.75Actuated Cycle Length (s) 130.0 Sum of lost time (s) 16.0Intersection Capacity Utilization 78.1% ICU Level of Service DAnalysis Period (min) 15c Critical Lane Group
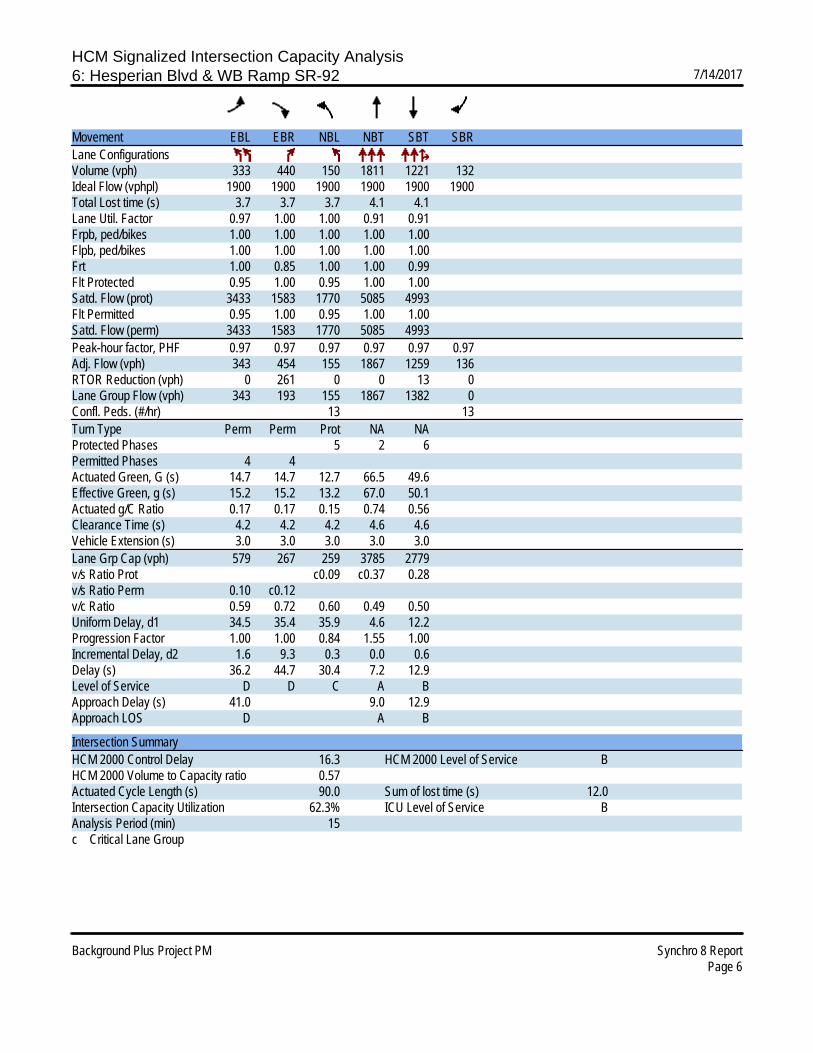
HCM Signalized Intersection Capacity Analysis6: Hesperian Blvd & WB Ramp SR-92 7/14/2017
Background Plus Project PM Synchro 8 ReportPage 6
Movement EBL EBR NBL NBT SBT SBRLane ConfigurationsVolume (vph) 333 440 150 1811 1221 132Ideal Flow (vphpl) 1900 1900 1900 1900 1900 1900Total Lost time (s) 3.7 3.7 3.7 4.1 4.1Lane Util. Factor 0.97 1.00 1.00 0.91 0.91Frpb, ped/bikes 1.00 1.00 1.00 1.00 1.00Flpb, ped/bikes 1.00 1.00 1.00 1.00 1.00Frt 1.00 0.85 1.00 1.00 0.99Flt Protected 0.95 1.00 0.95 1.00 1.00Satd. Flow (prot) 3433 1583 1770 5085 4993Flt Permitted 0.95 1.00 0.95 1.00 1.00Satd. Flow (perm) 3433 1583 1770 5085 4993Peak-hour factor, PHF 0.97 0.97 0.97 0.97 0.97 0.97Adj. Flow (vph) 343 454 155 1867 1259 136RTOR Reduction (vph) 0 261 0 0 13 0Lane Group Flow (vph) 343 193 155 1867 1382 0Confl. Peds. (#/hr) 13 13Turn Type Perm Perm Prot NA NAProtected Phases 5 2 6Permitted Phases 4 4Actuated Green, G (s) 14.7 14.7 12.7 66.5 49.6Effective Green, g (s) 15.2 15.2 13.2 67.0 50.1Actuated g/C Ratio 0.17 0.17 0.15 0.74 0.56Clearance Time (s) 4.2 4.2 4.2 4.6 4.6Vehicle Extension (s) 3.0 3.0 3.0 3.0 3.0Lane Grp Cap (vph) 579 267 259 3785 2779v/s Ratio Prot c0.09 c0.37 0.28v/s Ratio Perm 0.10 c0.12v/c Ratio 0.59 0.72 0.60 0.49 0.50Uniform Delay, d1 34.5 35.4 35.9 4.6 12.2Progression Factor 1.00 1.00 0.84 1.55 1.00Incremental Delay, d2 1.6 9.3 0.3 0.0 0.6Delay (s) 36.2 44.7 30.4 7.2 12.9Level of Service D D C A BApproach Delay (s) 41.0 9.0 12.9Approach LOS D A B
Intersection SummaryHCM 2000 Control Delay 16.3 HCM 2000 Level of Service BHCM 2000 Volume to Capacity ratio 0.57Actuated Cycle Length (s) 90.0 Sum of lost time (s) 12.0Intersection Capacity Utilization 62.3% ICU Level of Service BAnalysis Period (min) 15c Critical Lane Group
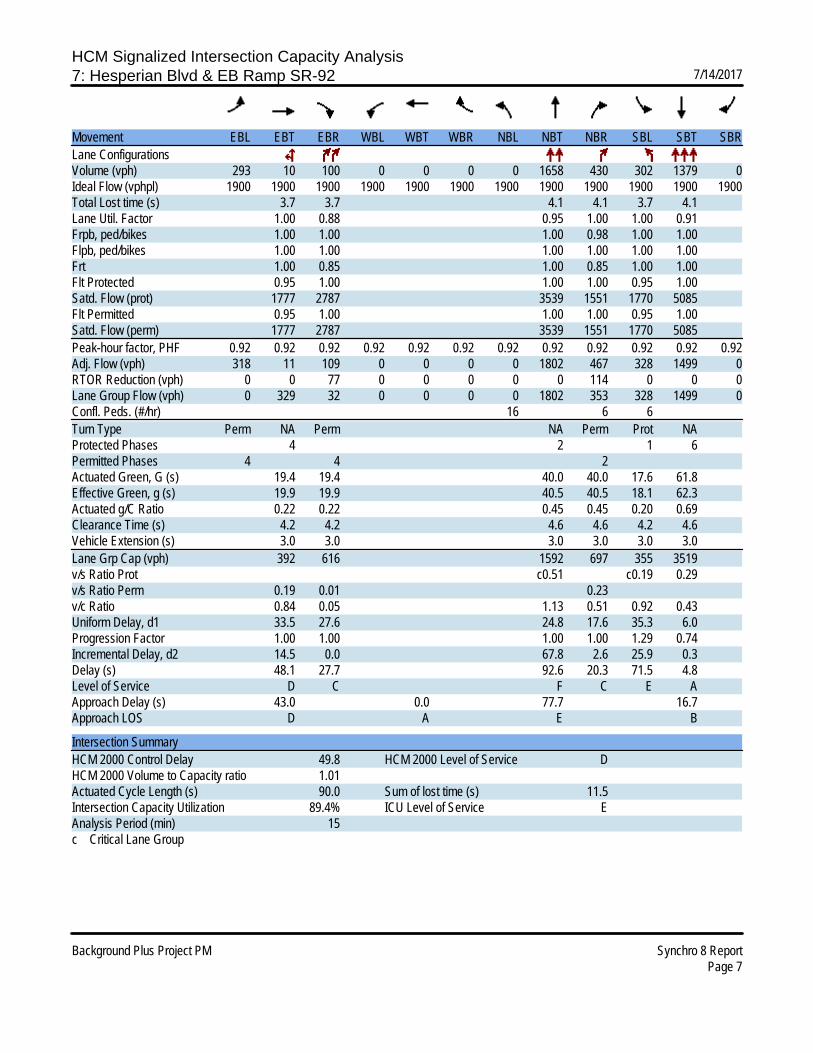
HCM Signalized Intersection Capacity Analysis7: Hesperian Blvd & EB Ramp SR-92 7/14/2017
Background Plus Project PM Synchro 8 ReportPage 7
Movement EBL EBT EBR WBL WBT WBR NBL NBT NBR SBL SBT SBRLane ConfigurationsVolume (vph) 293 10 100 0 0 0 0 1658 430 302 1379 0Ideal Flow (vphpl) 1900 1900 1900 1900 1900 1900 1900 1900 1900 1900 1900 1900Total Lost time (s) 3.7 3.7 4.1 4.1 3.7 4.1Lane Util. Factor 1.00 0.88 0.95 1.00 1.00 0.91Frpb, ped/bikes 1.00 1.00 1.00 0.98 1.00 1.00Flpb, ped/bikes 1.00 1.00 1.00 1.00 1.00 1.00Frt 1.00 0.85 1.00 0.85 1.00 1.00Flt Protected 0.95 1.00 1.00 1.00 0.95 1.00Satd. Flow (prot) 1777 2787 3539 1551 1770 5085Flt Permitted 0.95 1.00 1.00 1.00 0.95 1.00Satd. Flow (perm) 1777 2787 3539 1551 1770 5085Peak-hour factor, PHF 0.92 0.92 0.92 0.92 0.92 0.92 0.92 0.92 0.92 0.92 0.92 0.92Adj. Flow (vph) 318 11 109 0 0 0 0 1802 467 328 1499 0RTOR Reduction (vph) 0 0 77 0 0 0 0 0 114 0 0 0Lane Group Flow (vph) 0 329 32 0 0 0 0 1802 353 328 1499 0Confl. Peds. (#/hr) 16 6 6Turn Type Perm NA Perm NA Perm Prot NAProtected Phases 4 2 1 6Permitted Phases 4 4 2Actuated Green, G (s) 19.4 19.4 40.0 40.0 17.6 61.8Effective Green, g (s) 19.9 19.9 40.5 40.5 18.1 62.3Actuated g/C Ratio 0.22 0.22 0.45 0.45 0.20 0.69Clearance Time (s) 4.2 4.2 4.6 4.6 4.2 4.6Vehicle Extension (s) 3.0 3.0 3.0 3.0 3.0 3.0Lane Grp Cap (vph) 392 616 1592 697 355 3519v/s Ratio Prot c0.51 c0.19 0.29v/s Ratio Perm 0.19 0.01 0.23v/c Ratio 0.84 0.05 1.13 0.51 0.92 0.43Uniform Delay, d1 33.5 27.6 24.8 17.6 35.3 6.0Progression Factor 1.00 1.00 1.00 1.00 1.29 0.74Incremental Delay, d2 14.5 0.0 67.8 2.6 25.9 0.3Delay (s) 48.1 27.7 92.6 20.3 71.5 4.8Level of Service D C F C E AApproach Delay (s) 43.0 0.0 77.7 16.7Approach LOS D A E B
Intersection SummaryHCM 2000 Control Delay 49.8 HCM 2000 Level of Service DHCM 2000 Volume to Capacity ratio 1.01Actuated Cycle Length (s) 90.0 Sum of lost time (s) 11.5Intersection Capacity Utilization 89.4% ICU Level of Service EAnalysis Period (min) 15c Critical Lane Group

HCM Signalized Intersection Capacity Analysis8: Hesperian Blvd & Sleepy Hollow Ave 7/14/2017
Background Plus Project PM Synchro 8 ReportPage 8
Movement EBL EBT EBR WBL WBT WBR NBL NBT NBR SBL SBT SBRLane ConfigurationsVolume (vph) 130 50 60 20 40 130 40 1818 50 120 1199 130Ideal Flow (vphpl) 1900 1900 1900 1900 1900 1900 1900 1900 1900 1900 1900 1900Total Lost time (s) 4.0 4.0 4.0 4.0 4.0 4.0 4.0 4.0 4.0 4.0Lane Util. Factor 1.00 1.00 1.00 1.00 1.00 1.00 1.00 0.91 1.00 0.91Frpb, ped/bikes 1.00 1.00 0.97 1.00 1.00 0.98 1.00 1.00 1.00 1.00Flpb, ped/bikes 0.99 1.00 1.00 0.98 1.00 1.00 1.00 1.00 1.00 1.00Frt 1.00 1.00 0.85 1.00 1.00 0.85 1.00 1.00 1.00 0.99Flt Protected 0.95 1.00 1.00 0.95 1.00 1.00 0.95 1.00 0.95 1.00Satd. Flow (prot) 1753 1863 1534 1740 1863 1549 1770 5061 1770 4995Flt Permitted 0.73 1.00 1.00 0.72 1.00 1.00 0.95 1.00 0.95 1.00Satd. Flow (perm) 1345 1863 1534 1322 1863 1549 1770 5061 1770 4995Peak-hour factor, PHF 0.92 0.92 0.92 0.92 0.92 0.92 0.92 0.92 0.92 0.92 0.92 0.92Adj. Flow (vph) 141 54 65 22 43 141 43 1976 54 130 1303 141RTOR Reduction (vph) 0 0 54 0 0 118 0 1 0 0 7 0Lane Group Flow (vph) 141 54 11 22 43 23 43 2029 0 130 1437 0Confl. Peds. (#/hr) 8 15 15 8 5 4 4 5Confl. Bikes (#/hr) 1 2Turn Type Perm NA Perm Perm NA Perm Prot NA Prot NAProtected Phases 8 4 5 2 1 6Permitted Phases 8 8 4 4Actuated Green, G (s) 20.1 20.1 20.1 20.1 20.1 20.1 7.4 81.1 14.8 88.5Effective Green, g (s) 21.1 21.1 21.1 21.1 21.1 21.1 7.4 82.1 14.8 89.5Actuated g/C Ratio 0.16 0.16 0.16 0.16 0.16 0.16 0.06 0.63 0.11 0.69Clearance Time (s) 5.0 5.0 5.0 5.0 5.0 5.0 4.0 5.0 4.0 5.0Vehicle Extension (s) 3.0 3.0 3.0 3.0 3.0 3.0 3.0 3.0 3.0 3.0Lane Grp Cap (vph) 218 302 248 214 302 251 100 3196 201 3438v/s Ratio Prot 0.03 0.02 0.02 c0.40 c0.07 0.29v/s Ratio Perm c0.10 0.01 0.02 0.01v/c Ratio 0.65 0.18 0.04 0.10 0.14 0.09 0.43 0.63 0.65 0.42Uniform Delay, d1 51.0 47.0 45.9 46.4 46.7 46.3 59.3 14.7 55.1 8.9Progression Factor 1.00 1.00 1.00 1.00 1.00 1.00 0.60 2.56 1.00 1.00Incremental Delay, d2 6.5 0.3 0.1 0.2 0.2 0.2 1.1 0.4 7.0 0.4Delay (s) 57.4 47.3 46.0 46.6 46.9 46.5 36.7 38.1 62.1 9.2Level of Service E D D D D D D D E AApproach Delay (s) 52.5 46.6 38.1 13.6Approach LOS D D D B
Intersection SummaryHCM 2000 Control Delay 30.0 HCM 2000 Level of Service CHCM 2000 Volume to Capacity ratio 0.64Actuated Cycle Length (s) 130.0 Sum of lost time (s) 12.0Intersection Capacity Utilization 71.8% ICU Level of Service CAnalysis Period (min) 15c Critical Lane Group
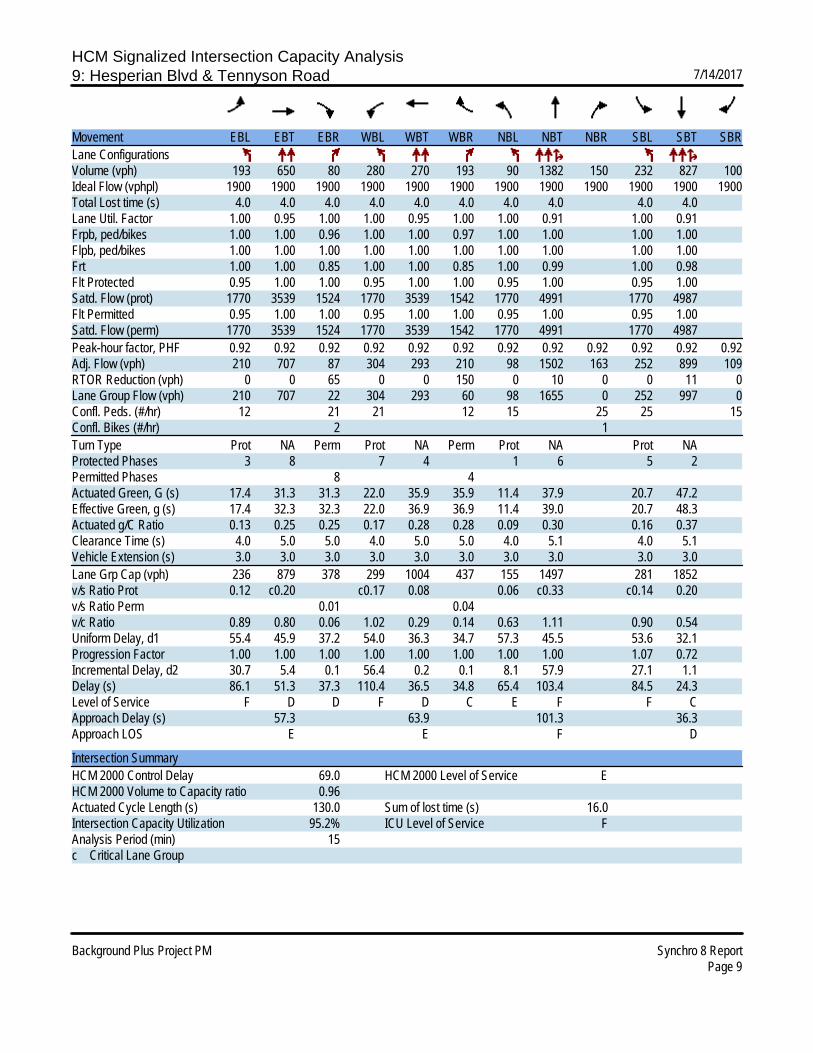
HCM Signalized Intersection Capacity Analysis9: Hesperian Blvd & Tennyson Road 7/14/2017
Background Plus Project PM Synchro 8 ReportPage 9
Movement EBL EBT EBR WBL WBT WBR NBL NBT NBR SBL SBT SBRLane ConfigurationsVolume (vph) 193 650 80 280 270 193 90 1382 150 232 827 100Ideal Flow (vphpl) 1900 1900 1900 1900 1900 1900 1900 1900 1900 1900 1900 1900Total Lost time (s) 4.0 4.0 4.0 4.0 4.0 4.0 4.0 4.0 4.0 4.0Lane Util. Factor 1.00 0.95 1.00 1.00 0.95 1.00 1.00 0.91 1.00 0.91Frpb, ped/bikes 1.00 1.00 0.96 1.00 1.00 0.97 1.00 1.00 1.00 1.00Flpb, ped/bikes 1.00 1.00 1.00 1.00 1.00 1.00 1.00 1.00 1.00 1.00Frt 1.00 1.00 0.85 1.00 1.00 0.85 1.00 0.99 1.00 0.98Flt Protected 0.95 1.00 1.00 0.95 1.00 1.00 0.95 1.00 0.95 1.00Satd. Flow (prot) 1770 3539 1524 1770 3539 1542 1770 4991 1770 4987Flt Permitted 0.95 1.00 1.00 0.95 1.00 1.00 0.95 1.00 0.95 1.00Satd. Flow (perm) 1770 3539 1524 1770 3539 1542 1770 4991 1770 4987Peak-hour factor, PHF 0.92 0.92 0.92 0.92 0.92 0.92 0.92 0.92 0.92 0.92 0.92 0.92Adj. Flow (vph) 210 707 87 304 293 210 98 1502 163 252 899 109RTOR Reduction (vph) 0 0 65 0 0 150 0 10 0 0 11 0Lane Group Flow (vph) 210 707 22 304 293 60 98 1655 0 252 997 0Confl. Peds. (#/hr) 12 21 21 12 15 25 25 15Confl. Bikes (#/hr) 2 1Turn Type Prot NA Perm Prot NA Perm Prot NA Prot NAProtected Phases 3 8 7 4 1 6 5 2Permitted Phases 8 4Actuated Green, G (s) 17.4 31.3 31.3 22.0 35.9 35.9 11.4 37.9 20.7 47.2Effective Green, g (s) 17.4 32.3 32.3 22.0 36.9 36.9 11.4 39.0 20.7 48.3Actuated g/C Ratio 0.13 0.25 0.25 0.17 0.28 0.28 0.09 0.30 0.16 0.37Clearance Time (s) 4.0 5.0 5.0 4.0 5.0 5.0 4.0 5.1 4.0 5.1Vehicle Extension (s) 3.0 3.0 3.0 3.0 3.0 3.0 3.0 3.0 3.0 3.0Lane Grp Cap (vph) 236 879 378 299 1004 437 155 1497 281 1852v/s Ratio Prot 0.12 c0.20 c0.17 0.08 0.06 c0.33 c0.14 0.20v/s Ratio Perm 0.01 0.04v/c Ratio 0.89 0.80 0.06 1.02 0.29 0.14 0.63 1.11 0.90 0.54Uniform Delay, d1 55.4 45.9 37.2 54.0 36.3 34.7 57.3 45.5 53.6 32.1Progression Factor 1.00 1.00 1.00 1.00 1.00 1.00 1.00 1.00 1.07 0.72Incremental Delay, d2 30.7 5.4 0.1 56.4 0.2 0.1 8.1 57.9 27.1 1.1Delay (s) 86.1 51.3 37.3 110.4 36.5 34.8 65.4 103.4 84.5 24.3Level of Service F D D F D C E F F CApproach Delay (s) 57.3 63.9 101.3 36.3Approach LOS E E F D
Intersection SummaryHCM 2000 Control Delay 69.0 HCM 2000 Level of Service EHCM 2000 Volume to Capacity ratio 0.96Actuated Cycle Length (s) 130.0 Sum of lost time (s) 16.0Intersection Capacity Utilization 95.2% ICU Level of Service FAnalysis Period (min) 15c Critical Lane Group

HCM Signalized Intersection Capacity Analysis10: Industrial Blvd & EB Ramp SR-92 7/14/2017
Background Plus Project PM Synchro 8 ReportPage 10
Movement EBL EBT EBR WBL WBT WBR NBL NBT NBR SBL SBT SBRLane ConfigurationsVolume (vph) 233 90 850 10 20 50 80 913 50 72 933 240Ideal Flow (vphpl) 1900 1900 1900 1900 1900 1900 1900 1900 1900 1900 1900 1900Total Lost time (s) 4.2 4.2 4.2 4.2 3.2 3.6 3.6 3.2 3.6 3.6Lane Util. Factor 1.00 1.00 1.00 1.00 1.00 0.95 1.00 1.00 0.95 1.00Frpb, ped/bikes 1.00 1.00 1.00 1.00 1.00 1.00 0.97 1.00 1.00 0.97Flpb, ped/bikes 1.00 1.00 1.00 1.00 1.00 1.00 1.00 1.00 1.00 1.00Frt 1.00 0.85 1.00 0.85 1.00 1.00 0.85 1.00 1.00 0.85Flt Protected 0.97 1.00 0.98 1.00 0.95 1.00 1.00 0.95 1.00 1.00Satd. Flow (prot) 1798 1583 1832 1583 1770 3539 1534 1770 3539 1532Flt Permitted 0.77 1.00 0.87 1.00 0.95 1.00 1.00 0.95 1.00 1.00Satd. Flow (perm) 1426 1583 1620 1583 1770 3539 1534 1770 3539 1532Peak-hour factor, PHF 0.91 0.91 0.91 0.91 0.91 0.91 0.91 0.91 0.91 0.91 0.91 0.91Adj. Flow (vph) 256 99 934 11 22 55 88 1003 55 79 1025 264RTOR Reduction (vph) 0 0 205 0 0 40 0 0 29 0 0 138Lane Group Flow (vph) 0 355 729 0 33 15 88 1003 26 79 1025 126Confl. Peds. (#/hr) 6 6 6 6Confl. Bikes (#/hr) 1Turn Type Perm NA Perm Perm NA Perm Prot NA Perm Prot NA PermProtected Phases 8 4 1 6 5 2Permitted Phases 8 8 4 4 6 2Actuated Green, G (s) 18.0 18.0 18.0 18.0 6.7 32.3 32.3 7.2 32.8 32.8Effective Green, g (s) 18.5 18.5 18.5 18.5 7.2 32.8 32.8 7.7 33.3 33.3Actuated g/C Ratio 0.26 0.26 0.26 0.26 0.10 0.47 0.47 0.11 0.48 0.48Clearance Time (s) 4.7 4.7 4.7 4.7 3.7 4.1 4.1 3.7 4.1 4.1Vehicle Extension (s) 3.0 3.0 3.0 3.0 3.0 3.0 3.0 3.0 3.0 3.0Lane Grp Cap (vph) 376 418 428 418 182 1658 718 194 1683 728v/s Ratio Prot c0.05 0.28 0.04 c0.29v/s Ratio Perm 0.25 c0.46 0.02 0.01 0.02 0.08v/c Ratio 0.94 1.75 0.08 0.03 0.48 0.60 0.04 0.41 0.61 0.17Uniform Delay, d1 25.2 25.8 19.3 19.1 29.6 13.8 10.1 29.0 13.5 10.5Progression Factor 1.00 1.00 1.00 1.00 1.00 1.00 1.00 0.68 2.07 7.58Incremental Delay, d2 32.1 345.1 0.1 0.0 2.0 1.6 0.1 0.6 0.7 0.2Delay (s) 57.4 370.9 19.4 19.2 31.7 15.4 10.1 20.5 28.7 79.7Level of Service E F B B C B B C C EApproach Delay (s) 284.5 19.3 16.4 38.1Approach LOS F B B D
Intersection SummaryHCM 2000 Control Delay 112.9 HCM 2000 Level of Service FHCM 2000 Volume to Capacity ratio 0.95Actuated Cycle Length (s) 70.0 Sum of lost time (s) 11.0Intersection Capacity Utilization 97.1% ICU Level of Service FAnalysis Period (min) 15c Critical Lane Group
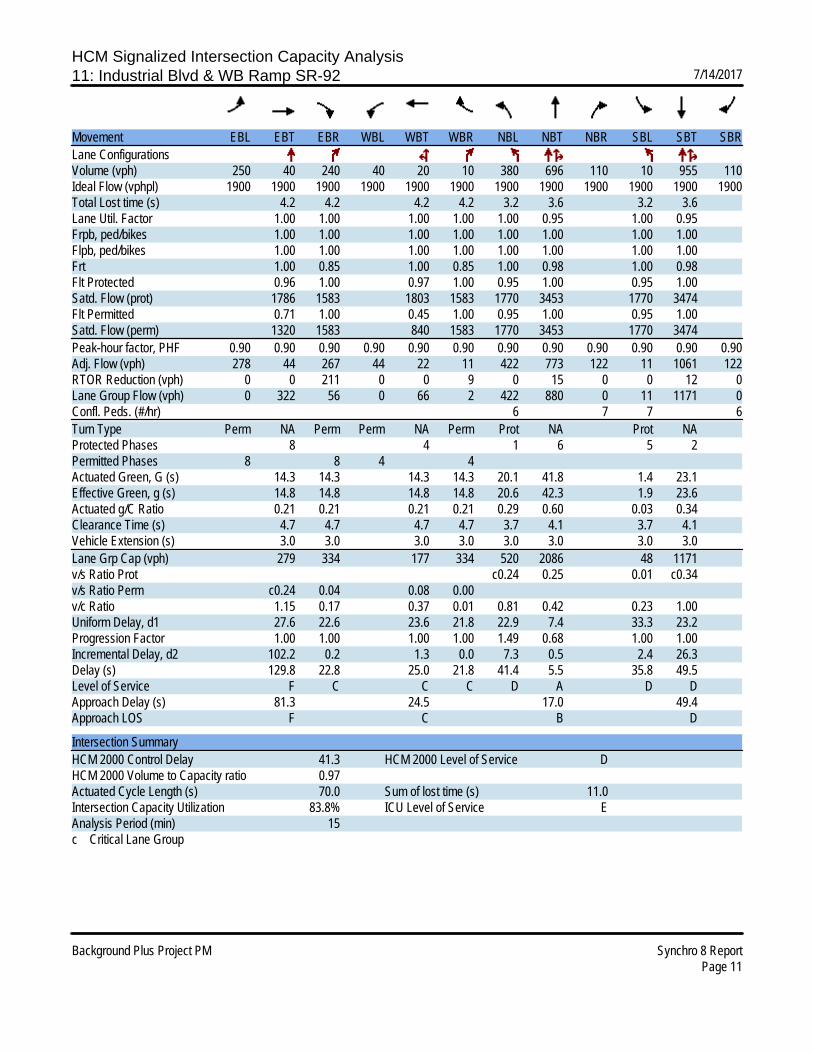
HCM Signalized Intersection Capacity Analysis11: Industrial Blvd & WB Ramp SR-92 7/14/2017
Background Plus Project PM Synchro 8 ReportPage 11
Movement EBL EBT EBR WBL WBT WBR NBL NBT NBR SBL SBT SBRLane ConfigurationsVolume (vph) 250 40 240 40 20 10 380 696 110 10 955 110Ideal Flow (vphpl) 1900 1900 1900 1900 1900 1900 1900 1900 1900 1900 1900 1900Total Lost time (s) 4.2 4.2 4.2 4.2 3.2 3.6 3.2 3.6Lane Util. Factor 1.00 1.00 1.00 1.00 1.00 0.95 1.00 0.95Frpb, ped/bikes 1.00 1.00 1.00 1.00 1.00 1.00 1.00 1.00Flpb, ped/bikes 1.00 1.00 1.00 1.00 1.00 1.00 1.00 1.00Frt 1.00 0.85 1.00 0.85 1.00 0.98 1.00 0.98Flt Protected 0.96 1.00 0.97 1.00 0.95 1.00 0.95 1.00Satd. Flow (prot) 1786 1583 1803 1583 1770 3453 1770 3474Flt Permitted 0.71 1.00 0.45 1.00 0.95 1.00 0.95 1.00Satd. Flow (perm) 1320 1583 840 1583 1770 3453 1770 3474Peak-hour factor, PHF 0.90 0.90 0.90 0.90 0.90 0.90 0.90 0.90 0.90 0.90 0.90 0.90Adj. Flow (vph) 278 44 267 44 22 11 422 773 122 11 1061 122RTOR Reduction (vph) 0 0 211 0 0 9 0 15 0 0 12 0Lane Group Flow (vph) 0 322 56 0 66 2 422 880 0 11 1171 0Confl. Peds. (#/hr) 6 7 7 6Turn Type Perm NA Perm Perm NA Perm Prot NA Prot NAProtected Phases 8 4 1 6 5 2Permitted Phases 8 8 4 4Actuated Green, G (s) 14.3 14.3 14.3 14.3 20.1 41.8 1.4 23.1Effective Green, g (s) 14.8 14.8 14.8 14.8 20.6 42.3 1.9 23.6Actuated g/C Ratio 0.21 0.21 0.21 0.21 0.29 0.60 0.03 0.34Clearance Time (s) 4.7 4.7 4.7 4.7 3.7 4.1 3.7 4.1Vehicle Extension (s) 3.0 3.0 3.0 3.0 3.0 3.0 3.0 3.0Lane Grp Cap (vph) 279 334 177 334 520 2086 48 1171v/s Ratio Prot c0.24 0.25 0.01 c0.34v/s Ratio Perm c0.24 0.04 0.08 0.00v/c Ratio 1.15 0.17 0.37 0.01 0.81 0.42 0.23 1.00Uniform Delay, d1 27.6 22.6 23.6 21.8 22.9 7.4 33.3 23.2Progression Factor 1.00 1.00 1.00 1.00 1.49 0.68 1.00 1.00Incremental Delay, d2 102.2 0.2 1.3 0.0 7.3 0.5 2.4 26.3Delay (s) 129.8 22.8 25.0 21.8 41.4 5.5 35.8 49.5Level of Service F C C C D A D DApproach Delay (s) 81.3 24.5 17.0 49.4Approach LOS F C B D
Intersection SummaryHCM 2000 Control Delay 41.3 HCM 2000 Level of Service DHCM 2000 Volume to Capacity ratio 0.97Actuated Cycle Length (s) 70.0 Sum of lost time (s) 11.0Intersection Capacity Utilization 83.8% ICU Level of Service EAnalysis Period (min) 15c Critical Lane Group

HCM Signalized Intersection Capacity Analysis12: Industrial Blvd & Depot Road 7/14/2017
Background Plus Project PM Synchro 8 ReportPage 12
Movement EBL EBT EBR WBL WBT WBR NBL NBT NBR SBL SBT SBRLane ConfigurationsVolume (vph) 80 220 280 55 30 20 130 590 136 53 430 10Ideal Flow (vphpl) 1900 1900 1900 1900 1900 1900 1900 1900 1900 1900 1900 1900Total Lost time (s) 4.0 4.0 4.0 4.5 4.0 4.0 4.0 4.0 4.0 4.0Lane Util. Factor 1.00 1.00 1.00 0.95 1.00 0.95 1.00 1.00 0.95 1.00Frpb, ped/bikes 1.00 1.00 0.98 1.00 1.00 1.00 1.00 1.00 1.00 0.99Flpb, ped/bikes 1.00 1.00 1.00 1.00 1.00 1.00 1.00 1.00 1.00 1.00Frt 1.00 1.00 0.85 0.97 1.00 1.00 0.85 1.00 1.00 0.85Flt Protected 0.95 1.00 1.00 0.97 0.95 1.00 1.00 0.95 1.00 1.00Satd. Flow (prot) 1770 1863 1556 3346 1770 3539 1583 1770 3539 1563Flt Permitted 0.68 1.00 1.00 0.76 0.95 1.00 1.00 0.95 1.00 1.00Satd. Flow (perm) 1268 1863 1556 2616 1770 3539 1583 1770 3539 1563Peak-hour factor, PHF 0.93 0.93 0.93 0.93 0.93 0.93 0.93 0.93 0.93 0.93 0.93 0.93Adj. Flow (vph) 86 237 301 59 32 22 140 634 146 57 462 11RTOR Reduction (vph) 0 0 203 0 15 0 0 0 85 0 0 7Lane Group Flow (vph) 86 237 98 0 98 0 140 634 61 57 462 4Confl. Peds. (#/hr) 3 3 1 1Confl. Bikes (#/hr) 4Turn Type Perm NA Perm Perm NA Prot NA Perm Prot NA PermProtected Phases 4 4 5 2 1 6Permitted Phases 4 4 4 2 6Actuated Green, G (s) 22.7 22.7 22.7 22.7 11.2 28.8 28.8 6.2 23.8 23.8Effective Green, g (s) 23.2 23.2 23.2 22.7 11.2 29.8 29.8 6.2 24.8 24.8Actuated g/C Ratio 0.33 0.33 0.33 0.32 0.16 0.42 0.42 0.09 0.35 0.35Clearance Time (s) 4.5 4.5 4.5 4.5 4.0 5.0 5.0 4.0 5.0 5.0Vehicle Extension (s) 6.0 6.0 6.0 6.0 6.0 8.0 8.0 6.0 8.0 8.0Lane Grp Cap (vph) 413 607 507 834 278 1481 662 154 1232 544v/s Ratio Prot c0.13 c0.08 c0.18 0.03 0.13v/s Ratio Perm 0.07 0.06 0.04 0.04 0.00v/c Ratio 0.21 0.39 0.19 0.12 0.50 0.43 0.09 0.37 0.38 0.01Uniform Delay, d1 17.4 18.5 17.3 17.2 27.5 14.7 12.5 30.7 17.4 15.2Progression Factor 1.00 1.00 1.00 1.00 1.00 1.00 1.00 1.00 1.00 1.00Incremental Delay, d2 0.7 1.2 0.5 0.2 4.0 0.9 0.3 4.2 0.8 0.0Delay (s) 18.1 19.7 17.8 17.3 31.5 15.5 12.8 34.9 18.2 15.2Level of Service B B B B C B B C B BApproach Delay (s) 18.6 17.3 17.5 19.9Approach LOS B B B B
Intersection SummaryHCM 2000 Control Delay 18.4 HCM 2000 Level of Service BHCM 2000 Volume to Capacity ratio 0.45Actuated Cycle Length (s) 71.2 Sum of lost time (s) 12.5Intersection Capacity Utilization 49.3% ICU Level of Service AAnalysis Period (min) 15c Critical Lane Group

HCM Unsignalized Intersection Capacity Analysis13: Depot Road & West Driveway 7/14/2017
Background Plus Project PM Synchro 8 ReportPage 13
Movement EBL EBT WBT WBR SBL SBRLane ConfigurationsVolume (veh/h) 27 472 150 61 60 15Sign Control Free Free StopGrade 0% 0% 0%Peak Hour Factor 0.91 0.91 0.91 0.91 0.91 0.91Hourly flow rate (vph) 30 519 165 67 66 16Pedestrians 2 29Lane Width (ft) 12.0 12.0Walking Speed (ft/s) 3.5 3.5Percent Blockage 0 3Right turn flare (veh)Median type None NoneMedian storage veh)Upstream signal (ft)pX, platoon unblockedvC, conflicting volume 261 548 227vC1, stage 1 conf volvC2, stage 2 conf volvCu, unblocked vol 261 548 227tC, single (s) 4.1 6.8 6.9tC, 2 stage (s)tF (s) 2.2 3.5 3.3p0 queue free % 98 85 98cM capacity (veh/h) 1265 442 754
Direction, Lane # EB 1 EB 2 WB 1 SB 1Volume Total 203 346 232 82Volume Left 30 0 0 66Volume Right 0 0 67 16cSH 1265 1700 1700 482Volume to Capacity 0.02 0.20 0.14 0.17Queue Length 95th (ft) 2 0 0 15Control Delay (s) 1.3 0.0 0.0 14.0Lane LOS A BApproach Delay (s) 0.5 0.0 14.0Approach LOS B
Intersection SummaryAverage Delay 1.7Intersection Capacity Utilization 41.0% ICU Level of Service AAnalysis Period (min) 15

HCM Unsignalized Intersection Capacity Analysis14: Dodge Ave/Lot E & Depot Road 7/14/2017
Background Plus Project PM Synchro 8 ReportPage 14
Movement EBL EBT EBR WBL WBT WBR NBL NBT NBR SBL SBT SBRLane ConfigurationsSign Control Stop Stop Stop StopVolume (vph) 12 500 10 50 201 40 10 0 50 50 0 10Peak Hour Factor 0.92 0.92 0.92 0.92 0.92 0.92 0.92 0.92 0.92 0.92 0.92 0.92Hourly flow rate (vph) 13 543 11 54 218 43 11 0 54 54 0 11
Direction, Lane # EB 1 EB 2 WB 1 NB 1 SB 1Volume Total (vph) 285 283 316 65 65Volume Left (vph) 13 0 54 11 54Volume Right (vph) 0 11 43 54 11Hadj (s) 0.06 0.01 -0.01 -0.43 0.10Departure Headway (s) 5.2 5.2 5.0 5.5 6.0Degree Utilization, x 0.41 0.41 0.44 0.10 0.11Capacity (veh/h) 672 676 701 568 528Control Delay (s) 10.7 10.5 11.7 9.1 9.8Approach Delay (s) 10.6 11.7 9.1 9.8Approach LOS B B A A
Intersection SummaryDelay 10.8Level of Service BIntersection Capacity Utilization 50.7% ICU Level of Service AAnalysis Period (min) 15
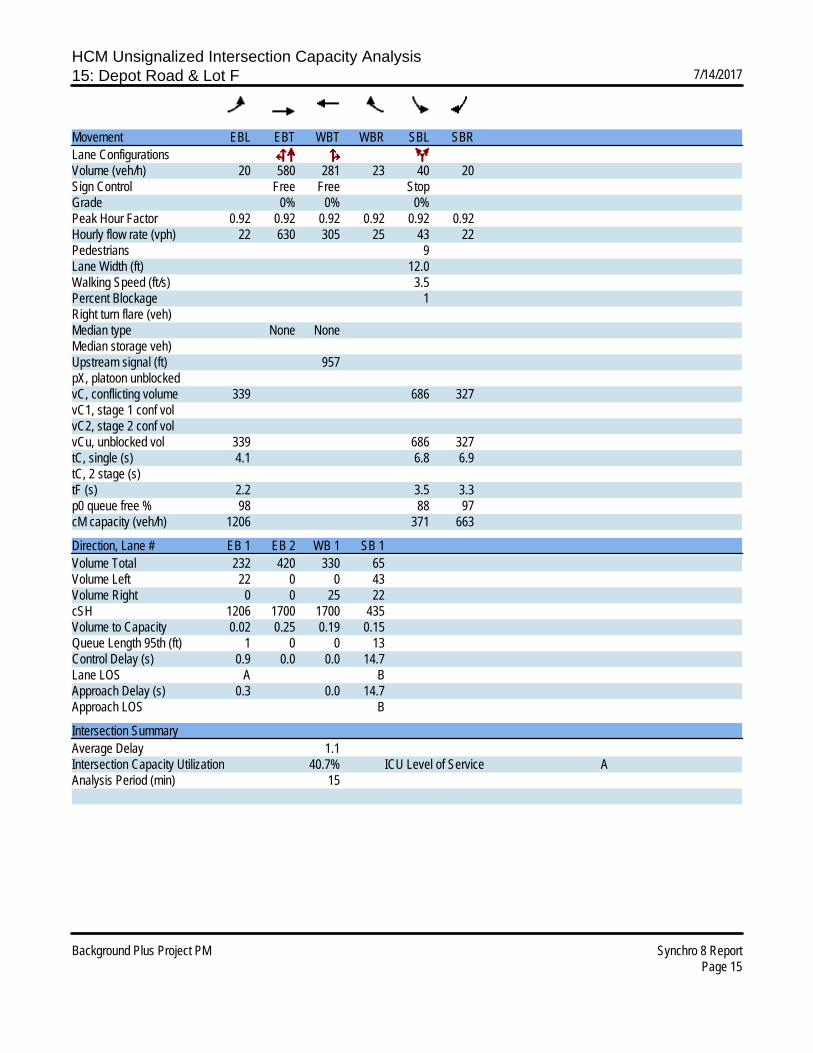
HCM Unsignalized Intersection Capacity Analysis15: Depot Road & Lot F 7/14/2017
Background Plus Project PM Synchro 8 ReportPage 15
Movement EBL EBT WBT WBR SBL SBRLane ConfigurationsVolume (veh/h) 20 580 281 23 40 20Sign Control Free Free StopGrade 0% 0% 0%Peak Hour Factor 0.92 0.92 0.92 0.92 0.92 0.92Hourly flow rate (vph) 22 630 305 25 43 22Pedestrians 9Lane Width (ft) 12.0Walking Speed (ft/s) 3.5Percent Blockage 1Right turn flare (veh)Median type None NoneMedian storage veh)Upstream signal (ft) 957pX, platoon unblockedvC, conflicting volume 339 686 327vC1, stage 1 conf volvC2, stage 2 conf volvCu, unblocked vol 339 686 327tC, single (s) 4.1 6.8 6.9tC, 2 stage (s)tF (s) 2.2 3.5 3.3p0 queue free % 98 88 97cM capacity (veh/h) 1206 371 663
Direction, Lane # EB 1 EB 2 WB 1 SB 1Volume Total 232 420 330 65Volume Left 22 0 0 43Volume Right 0 0 25 22cSH 1206 1700 1700 435Volume to Capacity 0.02 0.25 0.19 0.15Queue Length 95th (ft) 1 0 0 13Control Delay (s) 0.9 0.0 0.0 14.7Lane LOS A BApproach Delay (s) 0.3 0.0 14.7Approach LOS B
Intersection SummaryAverage Delay 1.1Intersection Capacity Utilization 40.7% ICU Level of Service AAnalysis Period (min) 15

HCM Unsignalized Intersection Capacity Analysis16: Depot Road & Lot G 7/14/2017
Background Plus Project PM Synchro 8 ReportPage 16
Movement EBL EBT WBT WBR SBL SBRLane ConfigurationsVolume (veh/h) 10 630 294 52 46 10Sign Control Free Free StopGrade 0% 0% 0%Peak Hour Factor 0.93 0.93 0.93 0.93 0.93 0.93Hourly flow rate (vph) 11 677 316 56 49 11Pedestrians 19 19 5Lane Width (ft) 12.0 12.0 12.0Walking Speed (ft/s) 3.5 3.5 3.5Percent Blockage 2 2 0Right turn flare (veh)Median type None NoneMedian storage veh)Upstream signal (ft) 529pX, platoon unblockedvC, conflicting volume 377 700 340vC1, stage 1 conf volvC2, stage 2 conf volvCu, unblocked vol 377 700 340tC, single (s) 4.1 6.8 6.9tC, 2 stage (s)tF (s) 2.2 3.5 3.3p0 queue free % 99 86 98cM capacity (veh/h) 1172 361 641
Direction, Lane # EB 1 EB 2 WB 1 WB 2 SB 1Volume Total 237 452 316 56 60Volume Left 11 0 0 0 49Volume Right 0 0 0 56 11cSH 1172 1700 1700 1700 392Volume to Capacity 0.01 0.27 0.19 0.03 0.15Queue Length 95th (ft) 1 0 0 0 13Control Delay (s) 0.4 0.0 0.0 0.0 15.8Lane LOS A CApproach Delay (s) 0.2 0.0 15.8Approach LOS C
Intersection SummaryAverage Delay 0.9Intersection Capacity Utilization 39.3% ICU Level of Service AAnalysis Period (min) 15
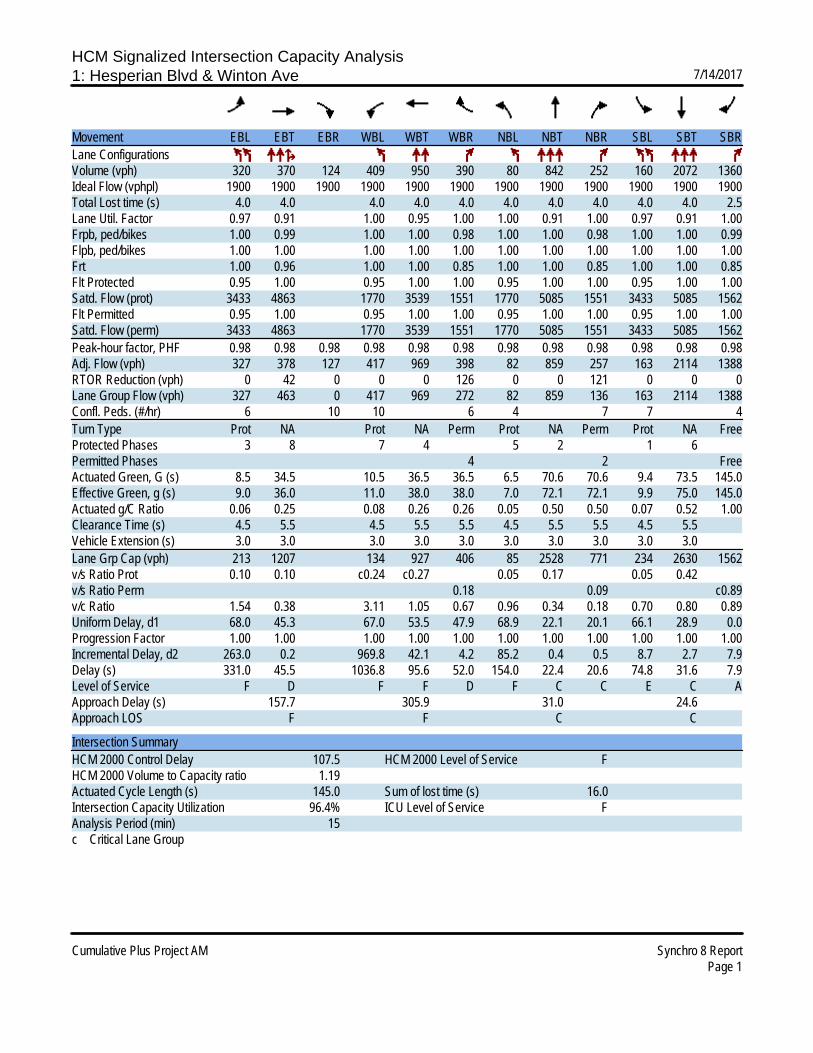
HCM Signalized Intersection Capacity Analysis1: Hesperian Blvd & Winton Ave 7/14/2017
Cumulative Plus Project AM Synchro 8 ReportPage 1
Movement EBL EBT EBR WBL WBT WBR NBL NBT NBR SBL SBT SBRLane ConfigurationsVolume (vph) 320 370 124 409 950 390 80 842 252 160 2072 1360Ideal Flow (vphpl) 1900 1900 1900 1900 1900 1900 1900 1900 1900 1900 1900 1900Total Lost time (s) 4.0 4.0 4.0 4.0 4.0 4.0 4.0 4.0 4.0 4.0 2.5Lane Util. Factor 0.97 0.91 1.00 0.95 1.00 1.00 0.91 1.00 0.97 0.91 1.00Frpb, ped/bikes 1.00 0.99 1.00 1.00 0.98 1.00 1.00 0.98 1.00 1.00 0.99Flpb, ped/bikes 1.00 1.00 1.00 1.00 1.00 1.00 1.00 1.00 1.00 1.00 1.00Frt 1.00 0.96 1.00 1.00 0.85 1.00 1.00 0.85 1.00 1.00 0.85Flt Protected 0.95 1.00 0.95 1.00 1.00 0.95 1.00 1.00 0.95 1.00 1.00Satd. Flow (prot) 3433 4863 1770 3539 1551 1770 5085 1551 3433 5085 1562Flt Permitted 0.95 1.00 0.95 1.00 1.00 0.95 1.00 1.00 0.95 1.00 1.00Satd. Flow (perm) 3433 4863 1770 3539 1551 1770 5085 1551 3433 5085 1562Peak-hour factor, PHF 0.98 0.98 0.98 0.98 0.98 0.98 0.98 0.98 0.98 0.98 0.98 0.98Adj. Flow (vph) 327 378 127 417 969 398 82 859 257 163 2114 1388RTOR Reduction (vph) 0 42 0 0 0 126 0 0 121 0 0 0Lane Group Flow (vph) 327 463 0 417 969 272 82 859 136 163 2114 1388Confl. Peds. (#/hr) 6 10 10 6 4 7 7 4Turn Type Prot NA Prot NA Perm Prot NA Perm Prot NA FreeProtected Phases 3 8 7 4 5 2 1 6Permitted Phases 4 2 FreeActuated Green, G (s) 8.5 34.5 10.5 36.5 36.5 6.5 70.6 70.6 9.4 73.5 145.0Effective Green, g (s) 9.0 36.0 11.0 38.0 38.0 7.0 72.1 72.1 9.9 75.0 145.0Actuated g/C Ratio 0.06 0.25 0.08 0.26 0.26 0.05 0.50 0.50 0.07 0.52 1.00Clearance Time (s) 4.5 5.5 4.5 5.5 5.5 4.5 5.5 5.5 4.5 5.5Vehicle Extension (s) 3.0 3.0 3.0 3.0 3.0 3.0 3.0 3.0 3.0 3.0Lane Grp Cap (vph) 213 1207 134 927 406 85 2528 771 234 2630 1562v/s Ratio Prot 0.10 0.10 c0.24 c0.27 0.05 0.17 0.05 0.42v/s Ratio Perm 0.18 0.09 c0.89v/c Ratio 1.54 0.38 3.11 1.05 0.67 0.96 0.34 0.18 0.70 0.80 0.89Uniform Delay, d1 68.0 45.3 67.0 53.5 47.9 68.9 22.1 20.1 66.1 28.9 0.0Progression Factor 1.00 1.00 1.00 1.00 1.00 1.00 1.00 1.00 1.00 1.00 1.00Incremental Delay, d2 263.0 0.2 969.8 42.1 4.2 85.2 0.4 0.5 8.7 2.7 7.9Delay (s) 331.0 45.5 1036.8 95.6 52.0 154.0 22.4 20.6 74.8 31.6 7.9Level of Service F D F F D F C C E C AApproach Delay (s) 157.7 305.9 31.0 24.6Approach LOS F F C C
Intersection SummaryHCM 2000 Control Delay 107.5 HCM 2000 Level of Service FHCM 2000 Volume to Capacity ratio 1.19Actuated Cycle Length (s) 145.0 Sum of lost time (s) 16.0Intersection Capacity Utilization 96.4% ICU Level of Service FAnalysis Period (min) 15c Critical Lane Group
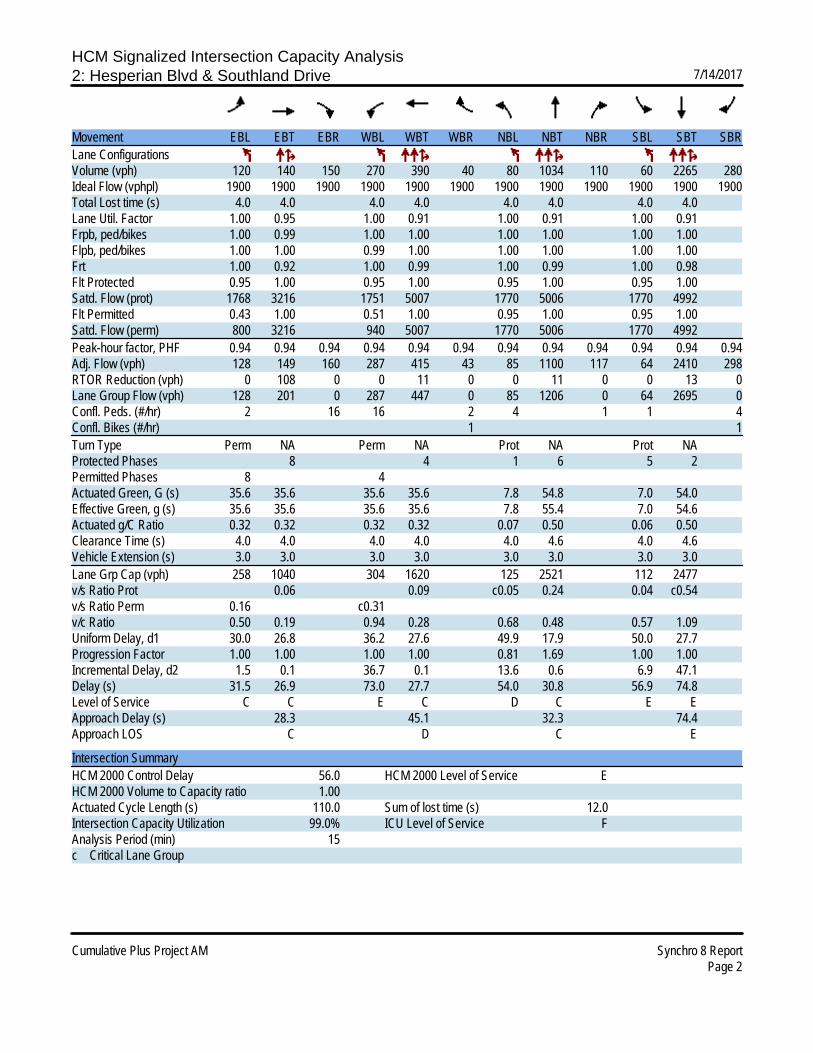
HCM Signalized Intersection Capacity Analysis2: Hesperian Blvd & Southland Drive 7/14/2017
Cumulative Plus Project AM Synchro 8 ReportPage 2
Movement EBL EBT EBR WBL WBT WBR NBL NBT NBR SBL SBT SBRLane ConfigurationsVolume (vph) 120 140 150 270 390 40 80 1034 110 60 2265 280Ideal Flow (vphpl) 1900 1900 1900 1900 1900 1900 1900 1900 1900 1900 1900 1900Total Lost time (s) 4.0 4.0 4.0 4.0 4.0 4.0 4.0 4.0Lane Util. Factor 1.00 0.95 1.00 0.91 1.00 0.91 1.00 0.91Frpb, ped/bikes 1.00 0.99 1.00 1.00 1.00 1.00 1.00 1.00Flpb, ped/bikes 1.00 1.00 0.99 1.00 1.00 1.00 1.00 1.00Frt 1.00 0.92 1.00 0.99 1.00 0.99 1.00 0.98Flt Protected 0.95 1.00 0.95 1.00 0.95 1.00 0.95 1.00Satd. Flow (prot) 1768 3216 1751 5007 1770 5006 1770 4992Flt Permitted 0.43 1.00 0.51 1.00 0.95 1.00 0.95 1.00Satd. Flow (perm) 800 3216 940 5007 1770 5006 1770 4992Peak-hour factor, PHF 0.94 0.94 0.94 0.94 0.94 0.94 0.94 0.94 0.94 0.94 0.94 0.94Adj. Flow (vph) 128 149 160 287 415 43 85 1100 117 64 2410 298RTOR Reduction (vph) 0 108 0 0 11 0 0 11 0 0 13 0Lane Group Flow (vph) 128 201 0 287 447 0 85 1206 0 64 2695 0Confl. Peds. (#/hr) 2 16 16 2 4 1 1 4Confl. Bikes (#/hr) 1 1Turn Type Perm NA Perm NA Prot NA Prot NAProtected Phases 8 4 1 6 5 2Permitted Phases 8 4Actuated Green, G (s) 35.6 35.6 35.6 35.6 7.8 54.8 7.0 54.0Effective Green, g (s) 35.6 35.6 35.6 35.6 7.8 55.4 7.0 54.6Actuated g/C Ratio 0.32 0.32 0.32 0.32 0.07 0.50 0.06 0.50Clearance Time (s) 4.0 4.0 4.0 4.0 4.0 4.6 4.0 4.6Vehicle Extension (s) 3.0 3.0 3.0 3.0 3.0 3.0 3.0 3.0Lane Grp Cap (vph) 258 1040 304 1620 125 2521 112 2477v/s Ratio Prot 0.06 0.09 c0.05 0.24 0.04 c0.54v/s Ratio Perm 0.16 c0.31v/c Ratio 0.50 0.19 0.94 0.28 0.68 0.48 0.57 1.09Uniform Delay, d1 30.0 26.8 36.2 27.6 49.9 17.9 50.0 27.7Progression Factor 1.00 1.00 1.00 1.00 0.81 1.69 1.00 1.00Incremental Delay, d2 1.5 0.1 36.7 0.1 13.6 0.6 6.9 47.1Delay (s) 31.5 26.9 73.0 27.7 54.0 30.8 56.9 74.8Level of Service C C E C D C E EApproach Delay (s) 28.3 45.1 32.3 74.4Approach LOS C D C E
Intersection SummaryHCM 2000 Control Delay 56.0 HCM 2000 Level of Service EHCM 2000 Volume to Capacity ratio 1.00Actuated Cycle Length (s) 110.0 Sum of lost time (s) 12.0Intersection Capacity Utilization 99.0% ICU Level of Service FAnalysis Period (min) 15c Critical Lane Group

HCM Signalized Intersection Capacity Analysis3: Hesperian Blvd & Turner Court 7/14/2017
Cumulative Plus Project AM Synchro 8 ReportPage 3
Movement EBL EBT EBR WBL WBT WBR NBL NBT NBR SBL SBT SBRLane ConfigurationsVolume (vph) 72 10 40 90 70 70 170 1032 60 100 2263 436Ideal Flow (vphpl) 1900 1900 1900 1900 1900 1900 1900 1900 1900 1900 1900 1900Total Lost time (s) 4.0 4.0 4.0 4.6 4.0 4.0 4.0 4.0Lane Util. Factor 1.00 1.00 1.00 1.00 1.00 0.91 1.00 0.91Frpb, ped/bikes 1.00 0.96 1.00 0.99 1.00 1.00 1.00 0.99Flpb, ped/bikes 1.00 1.00 0.98 1.00 1.00 1.00 1.00 1.00Frt 1.00 0.88 1.00 0.85 1.00 0.99 1.00 0.98Flt Protected 0.95 1.00 0.97 1.00 0.95 1.00 0.95 1.00Satd. Flow (prot) 1768 1572 1772 1562 1770 5028 1770 4927Flt Permitted 0.47 1.00 0.79 1.00 0.95 1.00 0.95 1.00Satd. Flow (perm) 884 1572 1449 1562 1770 5028 1770 4927Peak-hour factor, PHF 0.94 0.94 0.94 0.94 0.94 0.94 0.94 0.94 0.94 0.94 0.94 0.94Adj. Flow (vph) 77 11 43 96 74 74 181 1098 64 106 2407 464RTOR Reduction (vph) 0 35 0 0 0 61 0 4 0 0 18 0Lane Group Flow (vph) 77 19 0 0 170 13 181 1158 0 106 2853 0Confl. Peds. (#/hr) 1 40 40 1 10 19 19 10Turn Type Perm NA Perm NA Perm Prot NA Prot NAProtected Phases 4 8 1 6 5 2Permitted Phases 4 8 8Actuated Green, G (s) 19.4 19.4 19.4 19.4 16.4 66.5 10.9 61.0Effective Green, g (s) 20.0 20.0 20.0 19.4 16.4 67.1 10.9 61.6Actuated g/C Ratio 0.18 0.18 0.18 0.18 0.15 0.61 0.10 0.56Clearance Time (s) 4.6 4.6 4.6 4.6 4.0 4.6 4.0 4.6Vehicle Extension (s) 3.0 3.0 3.0 3.0 3.0 3.0 3.0 3.0Lane Grp Cap (vph) 160 285 263 275 263 3067 175 2759v/s Ratio Prot 0.01 c0.10 0.23 0.06 c0.58v/s Ratio Perm 0.09 c0.12 0.01v/c Ratio 0.48 0.07 0.65 0.05 0.69 0.38 0.61 1.03Uniform Delay, d1 40.3 37.3 41.7 37.6 44.4 10.9 47.5 24.2Progression Factor 1.00 1.00 1.00 1.00 1.00 1.00 0.69 1.51Incremental Delay, d2 2.3 0.1 5.4 0.1 7.3 0.4 1.7 19.7Delay (s) 42.6 37.4 47.1 37.7 51.7 11.2 34.4 56.3Level of Service D D D D D B C EApproach Delay (s) 40.5 44.2 16.7 55.5Approach LOS D D B E
Intersection SummaryHCM 2000 Control Delay 43.4 HCM 2000 Level of Service DHCM 2000 Volume to Capacity ratio 0.90Actuated Cycle Length (s) 110.0 Sum of lost time (s) 12.0Intersection Capacity Utilization 95.5% ICU Level of Service FAnalysis Period (min) 15c Critical Lane Group

HCM Signalized Intersection Capacity Analysis4: Hesperian Blvd & East Driveway 7/14/2017
Cumulative Plus Project AM Synchro 8 ReportPage 4
Movement EBL EBR NBL NBT SBU SBT SBRLane ConfigurationsVolume (vph) 72 113 193 1202 0 2139 280Ideal Flow (vphpl) 1900 1900 1900 1900 1900 1900 1900Total Lost time (s) 4.0 4.0 4.0 4.0 4.0Lane Util. Factor 1.00 1.00 1.00 0.91 0.91Frpb, ped/bikes 1.00 0.98 1.00 1.00 1.00Flpb, ped/bikes 1.00 1.00 1.00 1.00 1.00Frt 1.00 0.85 1.00 1.00 0.98Flt Protected 0.95 1.00 0.95 1.00 1.00Satd. Flow (prot) 1770 1555 1770 5085 4983Flt Permitted 0.95 1.00 0.95 1.00 1.00Satd. Flow (perm) 1770 1555 1770 5085 4983Peak-hour factor, PHF 0.95 0.95 0.95 0.95 0.95 0.95 0.95Adj. Flow (vph) 76 119 203 1265 0 2252 295RTOR Reduction (vph) 0 107 0 0 0 13 0Lane Group Flow (vph) 76 12 203 1265 0 2534 0Confl. Peds. (#/hr) 4 1 5 1Turn Type Prot Perm Prot NA Prot NAProtected Phases 4 1 6 5 2Permitted Phases 4Actuated Green, G (s) 13.4 13.4 22.6 107.6 81.0Effective Green, g (s) 13.4 13.4 22.6 108.6 82.0Actuated g/C Ratio 0.10 0.10 0.17 0.84 0.63Clearance Time (s) 4.0 4.0 4.0 5.0 5.0Vehicle Extension (s) 3.0 3.0 3.0 3.0 3.0Lane Grp Cap (vph) 182 160 307 4247 3143v/s Ratio Prot c0.04 c0.11 0.25 c0.51v/s Ratio Perm 0.01v/c Ratio 0.42 0.08 0.66 0.30 0.81Uniform Delay, d1 54.6 52.7 50.1 2.3 18.0Progression Factor 1.00 1.00 0.92 0.99 1.00Incremental Delay, d2 1.6 0.2 4.6 0.2 2.3Delay (s) 56.2 52.9 50.6 2.5 20.4Level of Service E D D A CApproach Delay (s) 54.2 9.1 20.4Approach LOS D A C
Intersection SummaryHCM 2000 Control Delay 18.0 HCM 2000 Level of Service BHCM 2000 Volume to Capacity ratio 0.73Actuated Cycle Length (s) 130.0 Sum of lost time (s) 12.0Intersection Capacity Utilization 76.8% ICU Level of Service DAnalysis Period (min) 15c Critical Lane Group

HCM Signalized Intersection Capacity Analysis5: Hesperian Blvd & Depot Road 7/14/2017
Cumulative Plus Project AM Synchro 8 ReportPage 5
Movement EBL EBT EBR WBL WBT WBR NBL NBT NBR SBL SBT SBRLane ConfigurationsVolume (vph) 200 80 421 250 180 50 402 1122 120 100 1953 229Ideal Flow (vphpl) 1900 1900 1900 1900 1900 1900 1900 1900 1900 1900 1900 1900Total Lost time (s) 4.0 4.0 4.0 4.0 4.0 4.0 4.0 4.0 4.0Lane Util. Factor 0.95 0.95 1.00 1.00 1.00 1.00 0.91 1.00 0.91Frpb, ped/bikes 1.00 1.00 0.96 1.00 1.00 1.00 1.00 1.00 1.00Flpb, ped/bikes 1.00 1.00 1.00 1.00 1.00 1.00 1.00 1.00 1.00Frt 1.00 1.00 0.85 1.00 0.97 1.00 0.99 1.00 0.98Flt Protected 0.95 0.98 1.00 0.95 1.00 0.95 1.00 0.95 1.00Satd. Flow (prot) 1681 1734 1521 1770 1795 1770 4995 1770 4983Flt Permitted 0.95 0.98 1.00 0.95 1.00 0.95 1.00 0.95 1.00Satd. Flow (perm) 1681 1734 1521 1770 1795 1770 4995 1770 4983Peak-hour factor, PHF 0.95 0.95 0.95 0.95 0.95 0.95 0.95 0.95 0.95 0.95 0.95 0.95Adj. Flow (vph) 211 84 443 263 189 53 423 1181 126 105 2056 241RTOR Reduction (vph) 0 0 378 0 8 0 0 9 0 0 10 0Lane Group Flow (vph) 152 143 65 263 234 0 423 1298 0 105 2287 0Confl. Peds. (#/hr) 2 19 19 2 17 5 5 17Confl. Bikes (#/hr) 1 1Turn Type Split NA Perm Split NA Prot NA Prot NAProtected Phases 4 4 3 3 5 2 1 6Permitted Phases 4Actuated Green, G (s) 19.1 19.1 19.1 18.0 18.0 35.0 63.6 12.7 41.3Effective Green, g (s) 19.1 19.1 19.1 18.0 18.0 35.0 64.2 12.7 41.9Actuated g/C Ratio 0.15 0.15 0.15 0.14 0.14 0.27 0.49 0.10 0.32Clearance Time (s) 4.0 4.0 4.0 4.0 4.0 4.0 4.6 4.0 4.6Vehicle Extension (s) 3.0 3.0 3.0 3.0 3.0 3.0 3.0 3.0 3.0Lane Grp Cap (vph) 246 254 223 245 248 476 2466 172 1606v/s Ratio Prot c0.09 0.08 c0.15 0.13 c0.24 0.26 0.06 c0.46v/s Ratio Perm 0.04v/c Ratio 0.62 0.56 0.29 1.07 0.94 0.89 0.53 0.61 1.42Uniform Delay, d1 52.0 51.6 49.4 56.0 55.5 45.6 22.5 56.3 44.0Progression Factor 1.00 1.00 1.00 1.00 1.00 1.00 1.00 1.12 0.81Incremental Delay, d2 4.6 2.8 0.7 78.4 41.8 18.0 0.8 3.9 193.1Delay (s) 56.6 54.4 50.2 134.4 97.3 63.6 23.3 66.8 228.9Level of Service E D D F F E C E FApproach Delay (s) 52.3 116.6 33.2 221.8Approach LOS D F C F
Intersection SummaryHCM 2000 Control Delay 127.9 HCM 2000 Level of Service FHCM 2000 Volume to Capacity ratio 1.07Actuated Cycle Length (s) 130.0 Sum of lost time (s) 16.0Intersection Capacity Utilization 107.5% ICU Level of Service GAnalysis Period (min) 15c Critical Lane Group

HCM Signalized Intersection Capacity Analysis6: Hesperian Blvd & WB Ramp SR-92 7/14/2017
Cumulative Plus Project AM Synchro 8 ReportPage 6
Movement EBL EBR NBL NBT SBT SBRLane ConfigurationsVolume (vph) 495 810 480 1119 1864 850Ideal Flow (vphpl) 1900 1900 1900 1900 1900 1900Total Lost time (s) 3.7 3.7 3.7 4.1 4.1Lane Util. Factor 0.97 1.00 1.00 0.91 0.91Frpb, ped/bikes 1.00 1.00 1.00 1.00 0.99Flpb, ped/bikes 1.00 1.00 1.00 1.00 1.00Frt 1.00 0.85 1.00 1.00 0.95Flt Protected 0.95 1.00 0.95 1.00 1.00Satd. Flow (prot) 3433 1583 1770 5085 4791Flt Permitted 0.95 1.00 0.95 1.00 1.00Satd. Flow (perm) 3433 1583 1770 5085 4791Peak-hour factor, PHF 0.97 0.97 0.97 0.97 0.97 0.97Adj. Flow (vph) 510 835 495 1154 1922 876RTOR Reduction (vph) 0 237 0 0 91 0Lane Group Flow (vph) 510 598 495 1154 2707 0Confl. Peds. (#/hr) 13 13Turn Type Perm Perm Prot NA NAProtected Phases 5 2 6Permitted Phases 4 4Actuated Green, G (s) 16.9 16.9 16.0 64.3 44.1Effective Green, g (s) 17.4 17.4 16.5 64.8 44.6Actuated g/C Ratio 0.19 0.19 0.18 0.72 0.50Clearance Time (s) 4.2 4.2 4.2 4.6 4.6Vehicle Extension (s) 3.0 3.0 3.0 3.0 3.0Lane Grp Cap (vph) 663 306 324 3661 2374v/s Ratio Prot c0.28 0.23 c0.57v/s Ratio Perm 0.15 c0.38v/c Ratio 0.77 1.95 1.53 0.32 1.14Uniform Delay, d1 34.4 36.3 36.8 4.6 22.7Progression Factor 1.00 1.00 1.00 1.59 1.00Incremental Delay, d2 5.4 440.9 243.1 0.1 68.7Delay (s) 39.8 477.2 280.0 7.3 91.4Level of Service D F F A FApproach Delay (s) 311.3 89.2 91.4Approach LOS F F F
Intersection SummaryHCM 2000 Control Delay 141.9 HCM 2000 Level of Service FHCM 2000 Volume to Capacity ratio 1.41Actuated Cycle Length (s) 90.0 Sum of lost time (s) 12.0Intersection Capacity Utilization 112.3% ICU Level of Service HAnalysis Period (min) 15c Critical Lane Group

HCM Signalized Intersection Capacity Analysis7: Hesperian Blvd & EB Ramp SR-92 7/14/2017
Cumulative Plus Project AM Synchro 8 ReportPage 7
Movement EBL EBT EBR WBL WBT WBR NBL NBT NBR SBL SBT SBRLane ConfigurationsVolume (vph) 153 0 180 0 0 0 0 1426 800 360 2334 0Ideal Flow (vphpl) 1900 1900 1900 1900 1900 1900 1900 1900 1900 1900 1900 1900Total Lost time (s) 3.7 3.7 4.1 4.1 3.7 4.1Lane Util. Factor 1.00 0.88 0.95 1.00 1.00 0.91Frpb, ped/bikes 1.00 1.00 1.00 0.98 1.00 1.00Flpb, ped/bikes 1.00 1.00 1.00 1.00 1.00 1.00Frt 1.00 0.85 1.00 0.85 1.00 1.00Flt Protected 0.95 1.00 1.00 1.00 0.95 1.00Satd. Flow (prot) 1770 2787 3539 1551 1770 5085Flt Permitted 0.95 1.00 1.00 1.00 0.95 1.00Satd. Flow (perm) 1770 2787 3539 1551 1770 5085Peak-hour factor, PHF 0.92 0.92 0.92 0.92 0.92 0.92 0.92 0.92 0.92 0.92 0.92 0.92Adj. Flow (vph) 166 0 196 0 0 0 0 1550 870 391 2537 0RTOR Reduction (vph) 0 0 59 0 0 0 0 0 249 0 0 0Lane Group Flow (vph) 0 166 137 0 0 0 0 1550 621 391 2537 0Confl. Peds. (#/hr) 16 6 6Turn Type Perm NA Perm NA Perm Prot NAProtected Phases 4 2 1 6Permitted Phases 4 4 2Actuated Green, G (s) 13.8 13.8 39.4 39.4 23.8 67.4Effective Green, g (s) 14.3 14.3 39.9 39.9 24.3 67.9Actuated g/C Ratio 0.16 0.16 0.44 0.44 0.27 0.75Clearance Time (s) 4.2 4.2 4.6 4.6 4.2 4.6Vehicle Extension (s) 3.0 3.0 3.0 3.0 3.0 3.0Lane Grp Cap (vph) 281 442 1568 687 477 3836v/s Ratio Prot c0.44 c0.22 0.50v/s Ratio Perm 0.09 0.05 0.40v/c Ratio 0.59 0.31 0.99 0.90 0.82 0.66Uniform Delay, d1 35.1 33.5 24.8 23.3 30.8 5.4Progression Factor 1.00 1.00 1.00 1.00 1.06 1.19Incremental Delay, d2 3.3 0.4 20.2 17.6 1.1 0.1Delay (s) 38.4 33.9 45.0 40.8 33.7 6.5Level of Service D C D D C AApproach Delay (s) 36.0 0.0 43.5 10.1Approach LOS D A D B
Intersection SummaryHCM 2000 Control Delay 25.9 HCM 2000 Level of Service CHCM 2000 Volume to Capacity ratio 0.86Actuated Cycle Length (s) 90.0 Sum of lost time (s) 11.5Intersection Capacity Utilization 88.7% ICU Level of Service EAnalysis Period (min) 15c Critical Lane Group
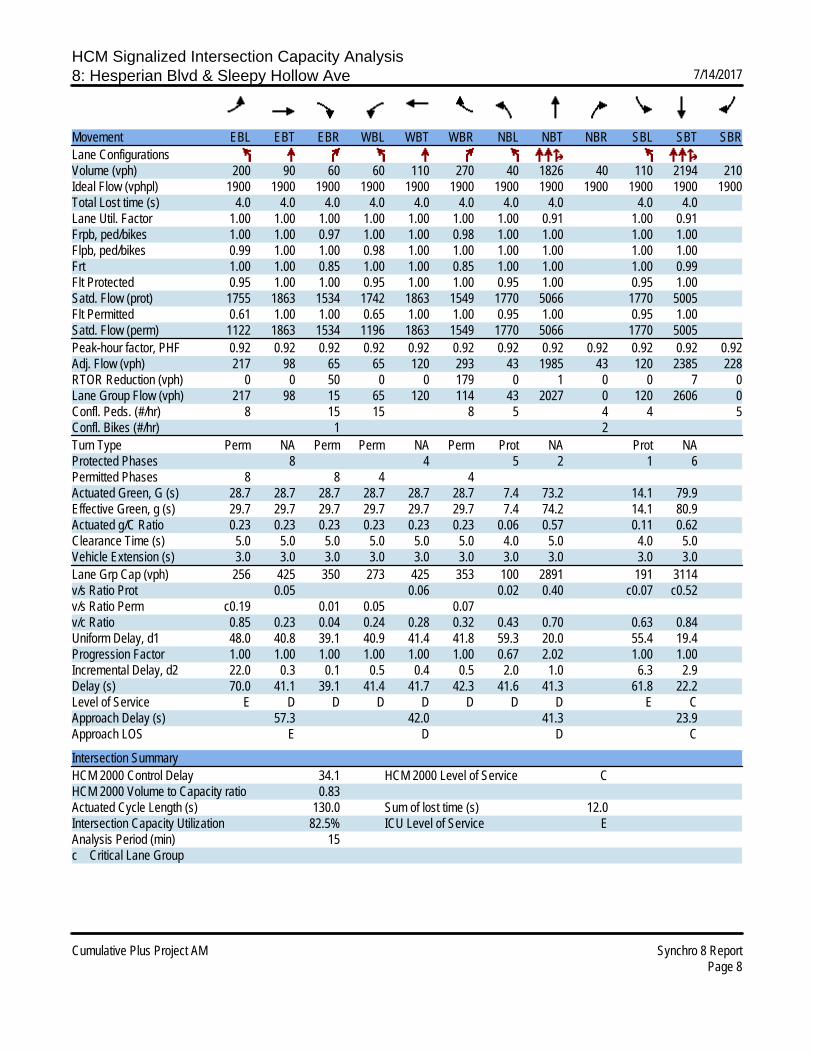
HCM Signalized Intersection Capacity Analysis8: Hesperian Blvd & Sleepy Hollow Ave 7/14/2017
Cumulative Plus Project AM Synchro 8 ReportPage 8
Movement EBL EBT EBR WBL WBT WBR NBL NBT NBR SBL SBT SBRLane ConfigurationsVolume (vph) 200 90 60 60 110 270 40 1826 40 110 2194 210Ideal Flow (vphpl) 1900 1900 1900 1900 1900 1900 1900 1900 1900 1900 1900 1900Total Lost time (s) 4.0 4.0 4.0 4.0 4.0 4.0 4.0 4.0 4.0 4.0Lane Util. Factor 1.00 1.00 1.00 1.00 1.00 1.00 1.00 0.91 1.00 0.91Frpb, ped/bikes 1.00 1.00 0.97 1.00 1.00 0.98 1.00 1.00 1.00 1.00Flpb, ped/bikes 0.99 1.00 1.00 0.98 1.00 1.00 1.00 1.00 1.00 1.00Frt 1.00 1.00 0.85 1.00 1.00 0.85 1.00 1.00 1.00 0.99Flt Protected 0.95 1.00 1.00 0.95 1.00 1.00 0.95 1.00 0.95 1.00Satd. Flow (prot) 1755 1863 1534 1742 1863 1549 1770 5066 1770 5005Flt Permitted 0.61 1.00 1.00 0.65 1.00 1.00 0.95 1.00 0.95 1.00Satd. Flow (perm) 1122 1863 1534 1196 1863 1549 1770 5066 1770 5005Peak-hour factor, PHF 0.92 0.92 0.92 0.92 0.92 0.92 0.92 0.92 0.92 0.92 0.92 0.92Adj. Flow (vph) 217 98 65 65 120 293 43 1985 43 120 2385 228RTOR Reduction (vph) 0 0 50 0 0 179 0 1 0 0 7 0Lane Group Flow (vph) 217 98 15 65 120 114 43 2027 0 120 2606 0Confl. Peds. (#/hr) 8 15 15 8 5 4 4 5Confl. Bikes (#/hr) 1 2Turn Type Perm NA Perm Perm NA Perm Prot NA Prot NAProtected Phases 8 4 5 2 1 6Permitted Phases 8 8 4 4Actuated Green, G (s) 28.7 28.7 28.7 28.7 28.7 28.7 7.4 73.2 14.1 79.9Effective Green, g (s) 29.7 29.7 29.7 29.7 29.7 29.7 7.4 74.2 14.1 80.9Actuated g/C Ratio 0.23 0.23 0.23 0.23 0.23 0.23 0.06 0.57 0.11 0.62Clearance Time (s) 5.0 5.0 5.0 5.0 5.0 5.0 4.0 5.0 4.0 5.0Vehicle Extension (s) 3.0 3.0 3.0 3.0 3.0 3.0 3.0 3.0 3.0 3.0Lane Grp Cap (vph) 256 425 350 273 425 353 100 2891 191 3114v/s Ratio Prot 0.05 0.06 0.02 0.40 c0.07 c0.52v/s Ratio Perm c0.19 0.01 0.05 0.07v/c Ratio 0.85 0.23 0.04 0.24 0.28 0.32 0.43 0.70 0.63 0.84Uniform Delay, d1 48.0 40.8 39.1 40.9 41.4 41.8 59.3 20.0 55.4 19.4Progression Factor 1.00 1.00 1.00 1.00 1.00 1.00 0.67 2.02 1.00 1.00Incremental Delay, d2 22.0 0.3 0.1 0.5 0.4 0.5 2.0 1.0 6.3 2.9Delay (s) 70.0 41.1 39.1 41.4 41.7 42.3 41.6 41.3 61.8 22.2Level of Service E D D D D D D D E CApproach Delay (s) 57.3 42.0 41.3 23.9Approach LOS E D D C
Intersection SummaryHCM 2000 Control Delay 34.1 HCM 2000 Level of Service CHCM 2000 Volume to Capacity ratio 0.83Actuated Cycle Length (s) 130.0 Sum of lost time (s) 12.0Intersection Capacity Utilization 82.5% ICU Level of Service EAnalysis Period (min) 15c Critical Lane Group
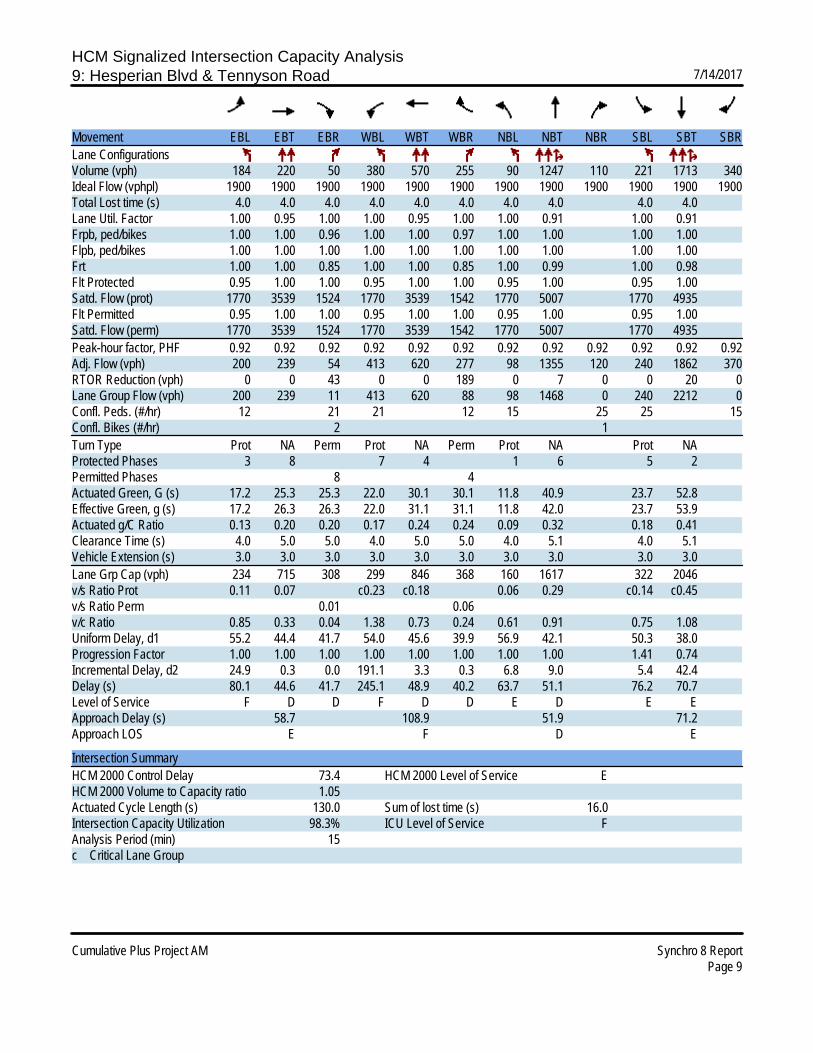
HCM Signalized Intersection Capacity Analysis9: Hesperian Blvd & Tennyson Road 7/14/2017
Cumulative Plus Project AM Synchro 8 ReportPage 9
Movement EBL EBT EBR WBL WBT WBR NBL NBT NBR SBL SBT SBRLane ConfigurationsVolume (vph) 184 220 50 380 570 255 90 1247 110 221 1713 340Ideal Flow (vphpl) 1900 1900 1900 1900 1900 1900 1900 1900 1900 1900 1900 1900Total Lost time (s) 4.0 4.0 4.0 4.0 4.0 4.0 4.0 4.0 4.0 4.0Lane Util. Factor 1.00 0.95 1.00 1.00 0.95 1.00 1.00 0.91 1.00 0.91Frpb, ped/bikes 1.00 1.00 0.96 1.00 1.00 0.97 1.00 1.00 1.00 1.00Flpb, ped/bikes 1.00 1.00 1.00 1.00 1.00 1.00 1.00 1.00 1.00 1.00Frt 1.00 1.00 0.85 1.00 1.00 0.85 1.00 0.99 1.00 0.98Flt Protected 0.95 1.00 1.00 0.95 1.00 1.00 0.95 1.00 0.95 1.00Satd. Flow (prot) 1770 3539 1524 1770 3539 1542 1770 5007 1770 4935Flt Permitted 0.95 1.00 1.00 0.95 1.00 1.00 0.95 1.00 0.95 1.00Satd. Flow (perm) 1770 3539 1524 1770 3539 1542 1770 5007 1770 4935Peak-hour factor, PHF 0.92 0.92 0.92 0.92 0.92 0.92 0.92 0.92 0.92 0.92 0.92 0.92Adj. Flow (vph) 200 239 54 413 620 277 98 1355 120 240 1862 370RTOR Reduction (vph) 0 0 43 0 0 189 0 7 0 0 20 0Lane Group Flow (vph) 200 239 11 413 620 88 98 1468 0 240 2212 0Confl. Peds. (#/hr) 12 21 21 12 15 25 25 15Confl. Bikes (#/hr) 2 1Turn Type Prot NA Perm Prot NA Perm Prot NA Prot NAProtected Phases 3 8 7 4 1 6 5 2Permitted Phases 8 4Actuated Green, G (s) 17.2 25.3 25.3 22.0 30.1 30.1 11.8 40.9 23.7 52.8Effective Green, g (s) 17.2 26.3 26.3 22.0 31.1 31.1 11.8 42.0 23.7 53.9Actuated g/C Ratio 0.13 0.20 0.20 0.17 0.24 0.24 0.09 0.32 0.18 0.41Clearance Time (s) 4.0 5.0 5.0 4.0 5.0 5.0 4.0 5.1 4.0 5.1Vehicle Extension (s) 3.0 3.0 3.0 3.0 3.0 3.0 3.0 3.0 3.0 3.0Lane Grp Cap (vph) 234 715 308 299 846 368 160 1617 322 2046v/s Ratio Prot 0.11 0.07 c0.23 c0.18 0.06 0.29 c0.14 c0.45v/s Ratio Perm 0.01 0.06v/c Ratio 0.85 0.33 0.04 1.38 0.73 0.24 0.61 0.91 0.75 1.08Uniform Delay, d1 55.2 44.4 41.7 54.0 45.6 39.9 56.9 42.1 50.3 38.0Progression Factor 1.00 1.00 1.00 1.00 1.00 1.00 1.00 1.00 1.41 0.74Incremental Delay, d2 24.9 0.3 0.0 191.1 3.3 0.3 6.8 9.0 5.4 42.4Delay (s) 80.1 44.6 41.7 245.1 48.9 40.2 63.7 51.1 76.2 70.7Level of Service F D D F D D E D E EApproach Delay (s) 58.7 108.9 51.9 71.2Approach LOS E F D E
Intersection SummaryHCM 2000 Control Delay 73.4 HCM 2000 Level of Service EHCM 2000 Volume to Capacity ratio 1.05Actuated Cycle Length (s) 130.0 Sum of lost time (s) 16.0Intersection Capacity Utilization 98.3% ICU Level of Service FAnalysis Period (min) 15c Critical Lane Group

HCM Signalized Intersection Capacity Analysis10: Industrial Blvd & EB Ramp SR-92 7/14/2017
Cumulative Plus Project AM Synchro 8 ReportPage 10
Movement EBL EBT EBR WBL WBT WBR NBL NBT NBR SBL SBT SBRLane ConfigurationsVolume (vph) 146 20 300 90 80 150 230 1574 50 42 802 250Ideal Flow (vphpl) 1900 1900 1900 1900 1900 1900 1900 1900 1900 1900 1900 1900Total Lost time (s) 4.2 4.2 4.2 4.2 3.2 3.6 3.6 3.2 3.6 3.6Lane Util. Factor 1.00 1.00 1.00 1.00 1.00 0.95 1.00 1.00 0.95 1.00Frpb, ped/bikes 1.00 1.00 1.00 1.00 1.00 1.00 0.97 1.00 1.00 0.97Flpb, ped/bikes 1.00 1.00 1.00 1.00 1.00 1.00 1.00 1.00 1.00 1.00Frt 1.00 0.85 1.00 0.85 1.00 1.00 0.85 1.00 1.00 0.85Flt Protected 0.96 1.00 0.97 1.00 0.95 1.00 1.00 0.95 1.00 1.00Satd. Flow (prot) 1784 1583 1815 1583 1770 3539 1534 1770 3539 1532Flt Permitted 0.55 1.00 0.66 1.00 0.95 1.00 1.00 0.95 1.00 1.00Satd. Flow (perm) 1022 1583 1229 1583 1770 3539 1534 1770 3539 1532Peak-hour factor, PHF 0.91 0.91 0.91 0.91 0.91 0.91 0.91 0.91 0.91 0.91 0.91 0.91Adj. Flow (vph) 160 22 330 99 88 165 253 1730 55 46 881 275RTOR Reduction (vph) 0 0 231 0 0 127 0 0 26 0 0 152Lane Group Flow (vph) 0 182 99 0 187 38 253 1730 29 46 881 123Confl. Peds. (#/hr) 6 6 6 6Confl. Bikes (#/hr) 1Turn Type Perm NA Perm Perm NA Perm Prot NA Perm Prot NA PermProtected Phases 8 4 1 6 5 2Permitted Phases 8 8 4 4 6 2Actuated Green, G (s) 15.7 15.7 15.7 15.7 10.9 36.4 36.4 5.4 30.9 30.9Effective Green, g (s) 16.2 16.2 16.2 16.2 11.4 36.9 36.9 5.9 31.4 31.4Actuated g/C Ratio 0.23 0.23 0.23 0.23 0.16 0.53 0.53 0.08 0.45 0.45Clearance Time (s) 4.7 4.7 4.7 4.7 3.7 4.1 4.1 3.7 4.1 4.1Vehicle Extension (s) 3.0 3.0 3.0 3.0 3.0 3.0 3.0 3.0 3.0 3.0Lane Grp Cap (vph) 236 366 284 366 288 1865 808 149 1587 687v/s Ratio Prot c0.14 c0.49 0.03 0.25v/s Ratio Perm c0.18 0.06 0.15 0.02 0.02 0.08v/c Ratio 0.77 0.27 0.66 0.10 0.88 0.93 0.04 0.31 0.56 0.18Uniform Delay, d1 25.2 22.1 24.4 21.2 28.6 15.3 8.0 30.1 14.2 11.6Progression Factor 1.00 1.00 1.00 1.00 1.00 1.00 1.00 0.66 2.07 7.10Incremental Delay, d2 14.4 0.4 5.4 0.1 24.7 9.6 0.1 0.1 0.1 0.1Delay (s) 39.6 22.5 29.8 21.3 53.3 24.9 8.1 20.1 29.5 82.2Level of Service D C C C D C A C C FApproach Delay (s) 28.5 25.8 27.9 41.2Approach LOS C C C D
Intersection SummaryHCM 2000 Control Delay 31.7 HCM 2000 Level of Service CHCM 2000 Volume to Capacity ratio 0.91Actuated Cycle Length (s) 70.0 Sum of lost time (s) 11.0Intersection Capacity Utilization 77.0% ICU Level of Service DAnalysis Period (min) 15c Critical Lane Group

HCM Signalized Intersection Capacity Analysis11: Industrial Blvd & WB Ramp SR-92 7/14/2017
Cumulative Plus Project AM Synchro 8 ReportPage 11
Movement EBL EBT EBR WBL WBT WBR NBL NBT NBR SBL SBT SBRLane ConfigurationsVolume (vph) 120 30 120 160 150 10 640 1040 160 10 834 360Ideal Flow (vphpl) 1900 1900 1900 1900 1900 1900 1900 1900 1900 1900 1900 1900Total Lost time (s) 4.2 4.2 4.2 4.2 3.2 3.6 3.2 3.6Lane Util. Factor 1.00 1.00 1.00 1.00 1.00 0.95 1.00 0.95Frpb, ped/bikes 1.00 1.00 1.00 1.00 1.00 1.00 1.00 0.99Flpb, ped/bikes 1.00 1.00 1.00 1.00 1.00 1.00 1.00 1.00Frt 1.00 0.85 1.00 0.85 1.00 0.98 1.00 0.95Flt Protected 0.96 1.00 0.97 1.00 0.95 1.00 0.95 1.00Satd. Flow (prot) 1791 1583 1816 1583 1770 3455 1770 3349Flt Permitted 0.24 1.00 0.68 1.00 0.95 1.00 0.95 1.00Satd. Flow (perm) 453 1583 1267 1583 1770 3455 1770 3349Peak-hour factor, PHF 0.90 0.90 0.90 0.90 0.90 0.90 0.90 0.90 0.90 0.90 0.90 0.90Adj. Flow (vph) 133 33 133 178 167 11 711 1156 178 11 927 400RTOR Reduction (vph) 0 0 105 0 0 9 0 15 0 0 69 0Lane Group Flow (vph) 0 166 28 0 345 2 711 1319 0 11 1258 0Confl. Peds. (#/hr) 6 7 7 6Turn Type Perm NA Perm Perm NA Perm Prot NA Prot NAProtected Phases 8 4 1 6 5 2Permitted Phases 8 8 4 4Actuated Green, G (s) 14.3 14.3 14.3 14.3 22.3 41.8 1.4 20.9Effective Green, g (s) 14.8 14.8 14.8 14.8 22.8 42.3 1.9 21.4Actuated g/C Ratio 0.21 0.21 0.21 0.21 0.33 0.60 0.03 0.31Clearance Time (s) 4.7 4.7 4.7 4.7 3.7 4.1 3.7 4.1Vehicle Extension (s) 3.0 3.0 3.0 3.0 3.0 3.0 3.0 3.0Lane Grp Cap (vph) 95 334 267 334 576 2087 48 1023v/s Ratio Prot c0.40 0.38 0.01 c0.38v/s Ratio Perm c0.37 0.02 0.27 0.00v/c Ratio 1.75 0.08 1.29 0.01 1.23 0.63 0.23 1.23Uniform Delay, d1 27.6 22.2 27.6 21.8 23.6 8.9 33.3 24.3Progression Factor 1.00 1.00 1.00 1.00 1.30 0.92 1.00 1.00Incremental Delay, d2 375.9 0.1 156.5 0.0 113.6 0.8 2.4 112.2Delay (s) 403.5 22.3 184.1 21.8 144.2 8.9 35.8 136.5Level of Service F C F C F A D FApproach Delay (s) 233.9 179.1 56.0 135.6Approach LOS F F E F
Intersection SummaryHCM 2000 Control Delay 106.4 HCM 2000 Level of Service FHCM 2000 Volume to Capacity ratio 1.36Actuated Cycle Length (s) 70.0 Sum of lost time (s) 11.0Intersection Capacity Utilization 109.0% ICU Level of Service GAnalysis Period (min) 15c Critical Lane Group

HCM Signalized Intersection Capacity Analysis12: Industrial Blvd & Depot Road 7/14/2017
Cumulative Plus Project AM Synchro 8 ReportPage 12
Movement EBL EBT EBR WBL WBT WBR NBL NBT NBR SBL SBT SBRLane ConfigurationsVolume (vph) 30 40 190 154 160 104 400 400 110 54 790 120Ideal Flow (vphpl) 1900 1900 1900 1900 1900 1900 1900 1900 1900 1900 1900 1900Total Lost time (s) 4.0 4.0 4.0 4.5 4.0 4.0 4.0 4.0 4.0 4.0Lane Util. Factor 1.00 1.00 1.00 0.95 1.00 0.95 1.00 1.00 0.95 1.00Frpb, ped/bikes 1.00 1.00 0.98 1.00 1.00 1.00 1.00 1.00 1.00 0.99Flpb, ped/bikes 1.00 1.00 1.00 1.00 1.00 1.00 1.00 1.00 1.00 1.00Frt 1.00 1.00 0.85 0.96 1.00 1.00 0.85 1.00 1.00 0.85Flt Protected 0.95 1.00 1.00 0.98 0.95 1.00 1.00 0.95 1.00 1.00Satd. Flow (prot) 1770 1863 1554 3342 1770 3539 1583 1770 3539 1562Flt Permitted 0.38 1.00 1.00 0.83 0.95 1.00 1.00 0.95 1.00 1.00Satd. Flow (perm) 711 1863 1554 2809 1770 3539 1583 1770 3539 1562Peak-hour factor, PHF 0.93 0.93 0.93 0.93 0.93 0.93 0.93 0.93 0.93 0.93 0.93 0.93Adj. Flow (vph) 32 43 204 166 172 112 430 430 118 58 849 129RTOR Reduction (vph) 0 0 148 0 34 0 0 0 60 0 0 82Lane Group Flow (vph) 32 43 56 0 416 0 430 430 58 58 849 47Confl. Peds. (#/hr) 3 3 1 1Confl. Bikes (#/hr) 4Turn Type Perm NA Perm Perm NA Prot NA Perm Prot NA PermProtected Phases 4 4 5 2 1 6Permitted Phases 4 4 4 2 6Actuated Green, G (s) 24.9 24.9 24.9 24.9 21.3 44.5 44.5 9.3 32.5 32.5Effective Green, g (s) 25.4 25.4 25.4 24.9 21.3 45.5 45.5 9.3 33.5 33.5Actuated g/C Ratio 0.28 0.28 0.28 0.27 0.23 0.49 0.49 0.10 0.36 0.36Clearance Time (s) 4.5 4.5 4.5 4.5 4.0 5.0 5.0 4.0 5.0 5.0Vehicle Extension (s) 6.0 6.0 6.0 6.0 6.0 8.0 8.0 6.0 8.0 8.0Lane Grp Cap (vph) 195 513 428 758 408 1746 781 178 1285 567v/s Ratio Prot 0.02 c0.24 0.12 0.03 c0.24v/s Ratio Perm 0.05 0.04 c0.15 0.04 0.03v/c Ratio 0.16 0.08 0.13 0.55 1.05 0.25 0.07 0.33 0.66 0.08Uniform Delay, d1 25.3 24.8 25.1 28.8 35.5 13.5 12.3 38.5 24.6 19.3Progression Factor 1.00 1.00 1.00 1.00 1.00 1.00 1.00 1.00 1.00 1.00Incremental Delay, d2 1.1 0.2 0.4 1.8 59.5 0.3 0.2 3.0 2.7 0.3Delay (s) 26.5 25.0 25.5 30.7 94.9 13.8 12.5 41.5 27.2 19.5Level of Service C C C C F B B D C BApproach Delay (s) 25.5 30.7 49.3 27.1Approach LOS C C D C
Intersection SummaryHCM 2000 Control Delay 35.4 HCM 2000 Level of Service DHCM 2000 Volume to Capacity ratio 0.73Actuated Cycle Length (s) 92.2 Sum of lost time (s) 12.5Intersection Capacity Utilization 75.1% ICU Level of Service DAnalysis Period (min) 15c Critical Lane Group

HCM Unsignalized Intersection Capacity Analysis13: Depot Road & West Driveway 7/14/2017
Cumulative Plus Project AM Synchro 8 ReportPage 13
Movement EBL EBT WBT WBR SBL SBRLane ConfigurationsVolume (veh/h) 44 520 500 80 20 26Sign Control Free Free StopGrade 0% 0% 0%Peak Hour Factor 0.91 0.91 0.91 0.91 0.91 0.91Hourly flow rate (vph) 48 571 549 88 22 29Pedestrians 2 29Lane Width (ft) 12.0 12.0Walking Speed (ft/s) 3.5 3.5Percent Blockage 0 3Right turn flare (veh)Median type None NoneMedian storage veh)Upstream signal (ft)pX, platoon unblockedvC, conflicting volume 666 1007 622vC1, stage 1 conf volvC2, stage 2 conf volvCu, unblocked vol 666 1007 622tC, single (s) 4.1 6.8 6.9tC, 2 stage (s)tF (s) 2.2 3.5 3.3p0 queue free % 95 90 93cM capacity (veh/h) 894 218 417
Direction, Lane # EB 1 EB 2 WB 1 SB 1Volume Total 239 381 637 51Volume Left 48 0 0 22Volume Right 0 0 88 29cSH 894 1700 1700 299Volume to Capacity 0.05 0.22 0.37 0.17Queue Length 95th (ft) 4 0 0 15Control Delay (s) 2.3 0.0 0.0 19.5Lane LOS A CApproach Delay (s) 0.9 0.0 19.5Approach LOS C
Intersection SummaryAverage Delay 1.2Intersection Capacity Utilization 58.1% ICU Level of Service BAnalysis Period (min) 15
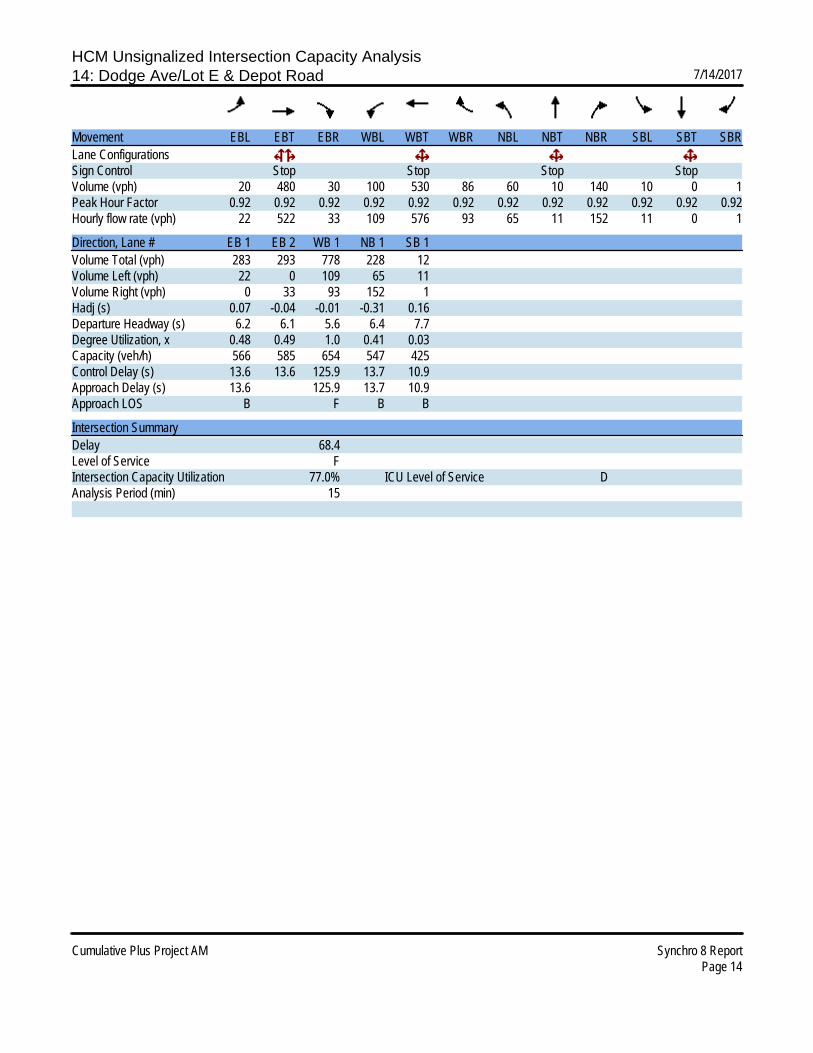
HCM Unsignalized Intersection Capacity Analysis14: Dodge Ave/Lot E & Depot Road 7/14/2017
Cumulative Plus Project AM Synchro 8 ReportPage 14
Movement EBL EBT EBR WBL WBT WBR NBL NBT NBR SBL SBT SBRLane ConfigurationsSign Control Stop Stop Stop StopVolume (vph) 20 480 30 100 530 86 60 10 140 10 0 1Peak Hour Factor 0.92 0.92 0.92 0.92 0.92 0.92 0.92 0.92 0.92 0.92 0.92 0.92Hourly flow rate (vph) 22 522 33 109 576 93 65 11 152 11 0 1
Direction, Lane # EB 1 EB 2 WB 1 NB 1 SB 1Volume Total (vph) 283 293 778 228 12Volume Left (vph) 22 0 109 65 11Volume Right (vph) 0 33 93 152 1Hadj (s) 0.07 -0.04 -0.01 -0.31 0.16Departure Headway (s) 6.2 6.1 5.6 6.4 7.7Degree Utilization, x 0.48 0.49 1.0 0.41 0.03Capacity (veh/h) 566 585 654 547 425Control Delay (s) 13.6 13.6 125.9 13.7 10.9Approach Delay (s) 13.6 125.9 13.7 10.9Approach LOS B F B B
Intersection SummaryDelay 68.4Level of Service FIntersection Capacity Utilization 77.0% ICU Level of Service DAnalysis Period (min) 15

HCM Unsignalized Intersection Capacity Analysis15: Depot Road & Lot F 7/14/2017
Cumulative Plus Project AM Synchro 8 ReportPage 15
Movement EBL EBT WBT WBR SBL SBRLane ConfigurationsVolume (veh/h) 30 600 600 30 10 121Sign Control Free Free StopGrade 0% 0% 0%Peak Hour Factor 0.92 0.92 0.92 0.92 0.92 0.92Hourly flow rate (vph) 33 652 652 33 11 132Pedestrians 9Lane Width (ft) 12.0Walking Speed (ft/s) 3.5Percent Blockage 1Right turn flare (veh)Median type None NoneMedian storage veh)Upstream signal (ft) 957pX, platoon unblocked 0.97 0.97 0.97vC, conflicting volume 694 1069 677vC1, stage 1 conf volvC2, stage 2 conf volvCu, unblocked vol 672 1057 655tC, single (s) 4.1 6.8 6.9tC, 2 stage (s)tF (s) 2.2 3.5 3.3p0 queue free % 96 95 67cM capacity (veh/h) 883 205 394
Direction, Lane # EB 1 EB 2 WB 1 SB 1Volume Total 250 435 685 142Volume Left 33 0 0 11Volume Right 0 0 33 132cSH 883 1700 1700 368Volume to Capacity 0.04 0.26 0.40 0.39Queue Length 95th (ft) 3 0 0 44Control Delay (s) 1.5 0.0 0.0 20.8Lane LOS A CApproach Delay (s) 0.6 0.0 20.8Approach LOS C
Intersection SummaryAverage Delay 2.2Intersection Capacity Utilization 53.5% ICU Level of Service AAnalysis Period (min) 15

HCM Unsignalized Intersection Capacity Analysis16: Depot Road & Lot G 7/14/2017
Cumulative Plus Project AM Synchro 8 ReportPage 16
Movement EBL EBT WBT WBR SBL SBRLane ConfigurationsVolume (veh/h) 0 610 630 105 11 10Sign Control Free Free StopGrade 0% 0% 0%Peak Hour Factor 0.93 0.93 0.93 0.93 0.93 0.93Hourly flow rate (vph) 0 656 677 113 12 11Pedestrians 19 19 5Lane Width (ft) 12.0 12.0 12.0Walking Speed (ft/s) 3.5 3.5 3.5Percent Blockage 2 2 0Right turn flare (veh)Median type None NoneMedian storage veh)Upstream signal (ft) 529pX, platoon unblocked 0.93 0.93 0.93vC, conflicting volume 795 1029 701vC1, stage 1 conf volvC2, stage 2 conf volvCu, unblocked vol 739 992 637tC, single (s) 4.1 6.8 6.9tC, 2 stage (s)tF (s) 2.2 3.5 3.3p0 queue free % 100 95 97cM capacity (veh/h) 795 220 380
Direction, Lane # EB 1 EB 2 WB 1 WB 2 SB 1Volume Total 219 437 677 113 23Volume Left 0 0 0 0 12Volume Right 0 0 0 113 11cSH 795 1700 1700 1700 275Volume to Capacity 0.00 0.26 0.40 0.07 0.08Queue Length 95th (ft) 0 0 0 0 7Control Delay (s) 0.0 0.0 0.0 0.0 19.3Lane LOS CApproach Delay (s) 0.0 0.0 19.3Approach LOS C
Intersection SummaryAverage Delay 0.3Intersection Capacity Utilization 47.8% ICU Level of Service AAnalysis Period (min) 15
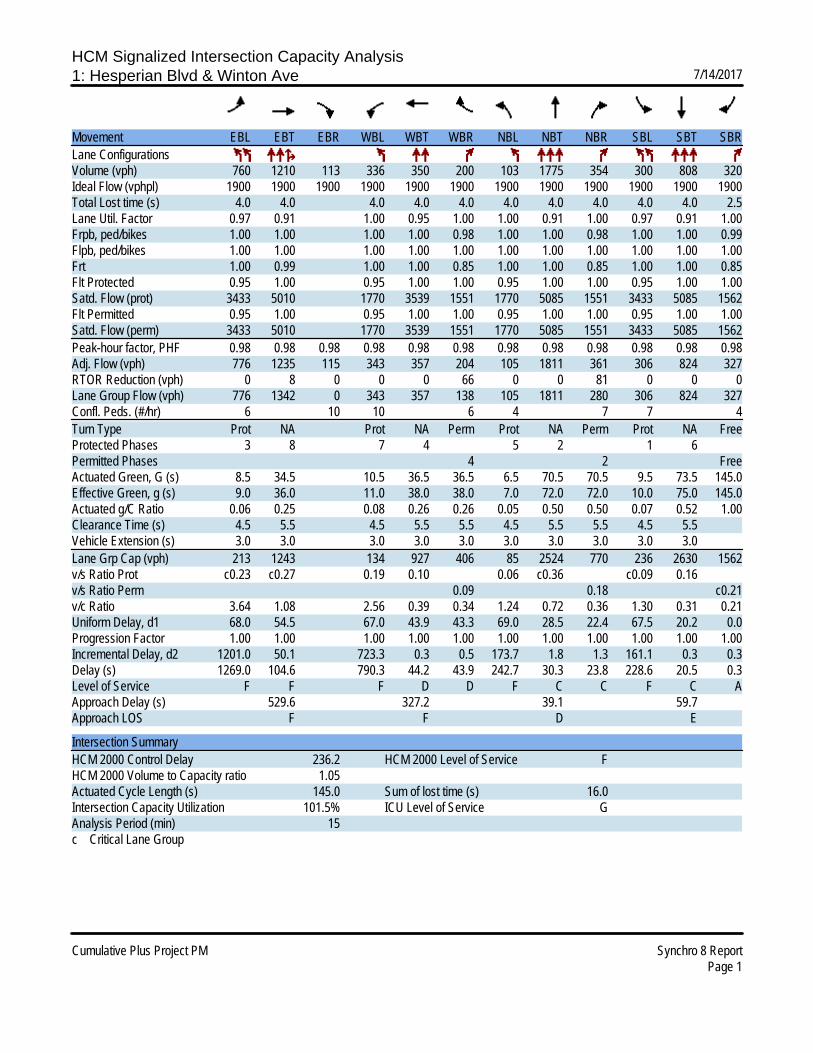
HCM Signalized Intersection Capacity Analysis1: Hesperian Blvd & Winton Ave 7/14/2017
Cumulative Plus Project PM Synchro 8 ReportPage 1
Movement EBL EBT EBR WBL WBT WBR NBL NBT NBR SBL SBT SBRLane ConfigurationsVolume (vph) 760 1210 113 336 350 200 103 1775 354 300 808 320Ideal Flow (vphpl) 1900 1900 1900 1900 1900 1900 1900 1900 1900 1900 1900 1900Total Lost time (s) 4.0 4.0 4.0 4.0 4.0 4.0 4.0 4.0 4.0 4.0 2.5Lane Util. Factor 0.97 0.91 1.00 0.95 1.00 1.00 0.91 1.00 0.97 0.91 1.00Frpb, ped/bikes 1.00 1.00 1.00 1.00 0.98 1.00 1.00 0.98 1.00 1.00 0.99Flpb, ped/bikes 1.00 1.00 1.00 1.00 1.00 1.00 1.00 1.00 1.00 1.00 1.00Frt 1.00 0.99 1.00 1.00 0.85 1.00 1.00 0.85 1.00 1.00 0.85Flt Protected 0.95 1.00 0.95 1.00 1.00 0.95 1.00 1.00 0.95 1.00 1.00Satd. Flow (prot) 3433 5010 1770 3539 1551 1770 5085 1551 3433 5085 1562Flt Permitted 0.95 1.00 0.95 1.00 1.00 0.95 1.00 1.00 0.95 1.00 1.00Satd. Flow (perm) 3433 5010 1770 3539 1551 1770 5085 1551 3433 5085 1562Peak-hour factor, PHF 0.98 0.98 0.98 0.98 0.98 0.98 0.98 0.98 0.98 0.98 0.98 0.98Adj. Flow (vph) 776 1235 115 343 357 204 105 1811 361 306 824 327RTOR Reduction (vph) 0 8 0 0 0 66 0 0 81 0 0 0Lane Group Flow (vph) 776 1342 0 343 357 138 105 1811 280 306 824 327Confl. Peds. (#/hr) 6 10 10 6 4 7 7 4Turn Type Prot NA Prot NA Perm Prot NA Perm Prot NA FreeProtected Phases 3 8 7 4 5 2 1 6Permitted Phases 4 2 FreeActuated Green, G (s) 8.5 34.5 10.5 36.5 36.5 6.5 70.5 70.5 9.5 73.5 145.0Effective Green, g (s) 9.0 36.0 11.0 38.0 38.0 7.0 72.0 72.0 10.0 75.0 145.0Actuated g/C Ratio 0.06 0.25 0.08 0.26 0.26 0.05 0.50 0.50 0.07 0.52 1.00Clearance Time (s) 4.5 5.5 4.5 5.5 5.5 4.5 5.5 5.5 4.5 5.5Vehicle Extension (s) 3.0 3.0 3.0 3.0 3.0 3.0 3.0 3.0 3.0 3.0Lane Grp Cap (vph) 213 1243 134 927 406 85 2524 770 236 2630 1562v/s Ratio Prot c0.23 c0.27 0.19 0.10 0.06 c0.36 c0.09 0.16v/s Ratio Perm 0.09 0.18 c0.21v/c Ratio 3.64 1.08 2.56 0.39 0.34 1.24 0.72 0.36 1.30 0.31 0.21Uniform Delay, d1 68.0 54.5 67.0 43.9 43.3 69.0 28.5 22.4 67.5 20.2 0.0Progression Factor 1.00 1.00 1.00 1.00 1.00 1.00 1.00 1.00 1.00 1.00 1.00Incremental Delay, d2 1201.0 50.1 723.3 0.3 0.5 173.7 1.8 1.3 161.1 0.3 0.3Delay (s) 1269.0 104.6 790.3 44.2 43.9 242.7 30.3 23.8 228.6 20.5 0.3Level of Service F F F D D F C C F C AApproach Delay (s) 529.6 327.2 39.1 59.7Approach LOS F F D E
Intersection SummaryHCM 2000 Control Delay 236.2 HCM 2000 Level of Service FHCM 2000 Volume to Capacity ratio 1.05Actuated Cycle Length (s) 145.0 Sum of lost time (s) 16.0Intersection Capacity Utilization 101.5% ICU Level of Service GAnalysis Period (min) 15c Critical Lane Group

HCM Signalized Intersection Capacity Analysis2: Hesperian Blvd & Southland Drive 7/14/2017
Cumulative Plus Project PM Synchro 8 ReportPage 2
Movement EBL EBT EBR WBL WBT WBR NBL NBT NBR SBL SBT SBRLane ConfigurationsVolume (vph) 280 480 110 120 120 140 90 1862 180 180 867 180Ideal Flow (vphpl) 1900 1900 1900 1900 1900 1900 1900 1900 1900 1900 1900 1900Total Lost time (s) 4.0 4.0 4.0 4.0 4.0 4.0 4.0 4.0Lane Util. Factor 1.00 0.95 1.00 0.91 1.00 0.91 1.00 0.91Frpb, ped/bikes 1.00 0.99 1.00 0.99 1.00 1.00 1.00 1.00Flpb, ped/bikes 1.00 1.00 0.99 1.00 1.00 1.00 1.00 1.00Frt 1.00 0.97 1.00 0.92 1.00 0.99 1.00 0.97Flt Protected 0.95 1.00 0.95 1.00 0.95 1.00 0.95 1.00Satd. Flow (prot) 1767 3422 1760 4638 1770 5012 1770 4940Flt Permitted 0.57 1.00 0.26 1.00 0.95 1.00 0.95 1.00Satd. Flow (perm) 1054 3422 482 4638 1770 5012 1770 4940Peak-hour factor, PHF 0.94 0.94 0.94 0.94 0.94 0.94 0.94 0.94 0.94 0.94 0.94 0.94Adj. Flow (vph) 298 511 117 128 128 149 96 1981 191 191 922 191RTOR Reduction (vph) 0 18 0 0 102 0 0 10 0 0 27 0Lane Group Flow (vph) 298 610 0 128 175 0 96 2162 0 191 1086 0Confl. Peds. (#/hr) 2 16 16 2 4 1 1 4Confl. Bikes (#/hr) 1 1Turn Type Perm NA Perm NA Prot NA Prot NAProtected Phases 8 4 1 6 5 2Permitted Phases 8 4Actuated Green, G (s) 34.8 34.8 34.8 34.8 9.3 50.4 12.2 53.3Effective Green, g (s) 34.8 34.8 34.8 34.8 9.3 51.0 12.2 53.9Actuated g/C Ratio 0.32 0.32 0.32 0.32 0.08 0.46 0.11 0.49Clearance Time (s) 4.0 4.0 4.0 4.0 4.0 4.6 4.0 4.6Vehicle Extension (s) 3.0 3.0 3.0 3.0 3.0 3.0 3.0 3.0Lane Grp Cap (vph) 333 1082 152 1467 149 2323 196 2420v/s Ratio Prot 0.18 0.04 0.05 c0.43 c0.11 c0.22v/s Ratio Perm c0.28 0.27v/c Ratio 0.89 0.56 0.84 0.12 0.64 0.93 0.97 0.45Uniform Delay, d1 35.9 31.3 35.0 26.7 48.7 27.8 48.7 18.3Progression Factor 1.00 1.00 1.00 1.00 0.72 1.56 1.00 1.00Incremental Delay, d2 24.9 0.7 32.3 0.0 6.4 5.9 56.4 0.6Delay (s) 60.7 32.0 67.3 26.8 41.5 49.5 105.2 18.9Level of Service E C E C D D F BApproach Delay (s) 41.2 39.6 49.1 31.6Approach LOS D D D C
Intersection SummaryHCM 2000 Control Delay 42.2 HCM 2000 Level of Service DHCM 2000 Volume to Capacity ratio 0.91Actuated Cycle Length (s) 110.0 Sum of lost time (s) 12.0Intersection Capacity Utilization 91.5% ICU Level of Service FAnalysis Period (min) 15c Critical Lane Group

HCM Signalized Intersection Capacity Analysis3: Hesperian Blvd & Turner Court 7/14/2017
Cumulative Plus Project PM Synchro 8 ReportPage 3
Movement EBL EBT EBR WBL WBT WBR NBL NBT NBR SBL SBT SBRLane ConfigurationsVolume (vph) 155 30 90 70 20 80 100 2057 90 110 1007 130Ideal Flow (vphpl) 1900 1900 1900 1900 1900 1900 1900 1900 1900 1900 1900 1900Total Lost time (s) 4.0 4.0 4.0 4.6 4.0 4.0 4.0 4.0Lane Util. Factor 1.00 1.00 1.00 1.00 1.00 0.91 1.00 0.91Frpb, ped/bikes 1.00 0.96 1.00 0.99 1.00 1.00 1.00 1.00Flpb, ped/bikes 1.00 1.00 0.97 1.00 1.00 1.00 1.00 1.00Frt 1.00 0.89 1.00 0.85 1.00 0.99 1.00 0.98Flt Protected 0.95 1.00 0.96 1.00 0.95 1.00 0.95 1.00Satd. Flow (prot) 1768 1588 1747 1562 1770 5041 1770 4973Flt Permitted 0.66 1.00 0.64 1.00 0.95 1.00 0.95 1.00Satd. Flow (perm) 1235 1588 1159 1562 1770 5041 1770 4973Peak-hour factor, PHF 0.94 0.94 0.94 0.94 0.94 0.94 0.94 0.94 0.94 0.94 0.94 0.94Adj. Flow (vph) 165 32 96 74 21 85 106 2188 96 117 1071 138RTOR Reduction (vph) 0 78 0 0 0 69 0 3 0 0 10 0Lane Group Flow (vph) 165 50 0 0 95 16 106 2281 0 117 1199 0Confl. Peds. (#/hr) 1 40 40 1 10 19 19 10Turn Type Perm NA Perm NA Perm Prot NA Prot NAProtected Phases 4 8 1 6 5 2Permitted Phases 4 8 8Actuated Green, G (s) 20.4 20.4 20.4 20.4 11.9 64.8 11.6 64.5Effective Green, g (s) 21.0 21.0 21.0 20.4 11.9 65.4 11.6 65.1Actuated g/C Ratio 0.19 0.19 0.19 0.19 0.11 0.59 0.11 0.59Clearance Time (s) 4.6 4.6 4.6 4.6 4.0 4.6 4.0 4.6Vehicle Extension (s) 3.0 3.0 3.0 3.0 3.0 3.0 3.0 3.0Lane Grp Cap (vph) 235 303 221 289 191 2997 186 2943v/s Ratio Prot 0.03 0.06 c0.45 c0.07 0.24v/s Ratio Perm c0.13 0.08 0.01v/c Ratio 0.70 0.17 0.43 0.05 0.55 0.76 0.63 0.41Uniform Delay, d1 41.6 37.2 39.2 36.9 46.5 16.5 47.1 12.1Progression Factor 1.00 1.00 1.00 1.00 1.00 1.00 0.91 1.32Incremental Delay, d2 9.1 0.3 1.3 0.1 3.5 1.9 6.0 0.4Delay (s) 50.7 37.4 40.6 36.9 50.0 18.4 48.8 16.3Level of Service D D D D D B D BApproach Delay (s) 44.9 38.9 19.8 19.1Approach LOS D D B B
Intersection SummaryHCM 2000 Control Delay 22.2 HCM 2000 Level of Service CHCM 2000 Volume to Capacity ratio 0.73Actuated Cycle Length (s) 110.0 Sum of lost time (s) 12.0Intersection Capacity Utilization 81.6% ICU Level of Service DAnalysis Period (min) 15c Critical Lane Group

HCM Signalized Intersection Capacity Analysis4: Hesperian Blvd & East Driveway 7/14/2017
Cumulative Plus Project PM Synchro 8 ReportPage 4
Movement EBL EBR NBL NBT SBU SBT SBRLane ConfigurationsVolume (vph) 87 127 132 2170 0 1054 103Ideal Flow (vphpl) 1900 1900 1900 1900 1900 1900 1900Total Lost time (s) 4.0 4.0 4.0 4.0 4.0Lane Util. Factor 1.00 1.00 1.00 0.91 0.91Frpb, ped/bikes 1.00 0.98 1.00 1.00 1.00Flpb, ped/bikes 1.00 1.00 1.00 1.00 1.00Frt 1.00 0.85 1.00 1.00 0.99Flt Protected 0.95 1.00 0.95 1.00 1.00Satd. Flow (prot) 1770 1555 1770 5085 5007Flt Permitted 0.95 1.00 0.95 1.00 1.00Satd. Flow (perm) 1770 1555 1770 5085 5007Peak-hour factor, PHF 0.95 0.95 0.95 0.95 0.95 0.95 0.95Adj. Flow (vph) 92 134 139 2284 0 1109 108RTOR Reduction (vph) 0 119 0 0 0 8 0Lane Group Flow (vph) 92 15 139 2284 0 1209 0Confl. Peds. (#/hr) 4 1 5 1Turn Type Prot Perm Prot NA Prot NAProtected Phases 4 1 6 5 2Permitted Phases 4Actuated Green, G (s) 14.1 14.1 16.3 106.9 86.6Effective Green, g (s) 14.1 14.1 16.3 107.9 87.6Actuated g/C Ratio 0.11 0.11 0.13 0.83 0.67Clearance Time (s) 4.0 4.0 4.0 5.0 5.0Vehicle Extension (s) 3.0 3.0 3.0 3.0 3.0Lane Grp Cap (vph) 191 168 221 4220 3373v/s Ratio Prot c0.05 c0.08 c0.45 0.24v/s Ratio Perm 0.01v/c Ratio 0.48 0.09 0.63 0.54 0.36Uniform Delay, d1 54.5 52.2 54.0 3.4 9.1Progression Factor 1.00 1.00 0.71 2.14 1.00Incremental Delay, d2 1.9 0.2 2.8 0.3 0.3Delay (s) 56.4 52.4 41.0 7.5 9.4Level of Service E D D A AApproach Delay (s) 54.0 9.5 9.4Approach LOS D A A
Intersection SummaryHCM 2000 Control Delay 12.1 HCM 2000 Level of Service BHCM 2000 Volume to Capacity ratio 0.56Actuated Cycle Length (s) 130.0 Sum of lost time (s) 12.0Intersection Capacity Utilization 63.8% ICU Level of Service BAnalysis Period (min) 15c Critical Lane Group

HCM Signalized Intersection Capacity Analysis5: Hesperian Blvd & Depot Road 7/14/2017
Cumulative Plus Project PM Synchro 8 ReportPage 5
Movement EBL EBT EBR WBL WBT WBR NBL NBT NBR SBL SBT SBRLane ConfigurationsVolume (vph) 250 200 306 110 100 110 272 1912 240 50 1007 94Ideal Flow (vphpl) 1900 1900 1900 1900 1900 1900 1900 1900 1900 1900 1900 1900Total Lost time (s) 4.0 4.0 4.0 4.0 4.0 4.0 4.0 4.0 4.0Lane Util. Factor 0.95 0.95 1.00 1.00 1.00 1.00 0.91 1.00 0.91Frpb, ped/bikes 1.00 1.00 0.96 1.00 0.99 1.00 1.00 1.00 1.00Flpb, ped/bikes 1.00 1.00 1.00 1.00 1.00 1.00 1.00 1.00 1.00Frt 1.00 1.00 0.85 1.00 0.92 1.00 0.98 1.00 0.99Flt Protected 0.95 0.99 1.00 0.95 1.00 0.95 1.00 0.95 1.00Satd. Flow (prot) 1681 1747 1522 1770 1700 1770 4980 1770 5002Flt Permitted 0.95 0.99 1.00 0.95 1.00 0.95 1.00 0.95 1.00Satd. Flow (perm) 1681 1747 1522 1770 1700 1770 4980 1770 5002Peak-hour factor, PHF 0.95 0.95 0.95 0.95 0.95 0.95 0.95 0.95 0.95 0.95 0.95 0.95Adj. Flow (vph) 263 211 322 116 105 116 286 2013 253 53 1060 99RTOR Reduction (vph) 0 0 259 0 31 0 0 11 0 0 7 0Lane Group Flow (vph) 189 285 63 116 190 0 286 2255 0 53 1152 0Confl. Peds. (#/hr) 2 19 19 2 17 5 5 17Confl. Bikes (#/hr) 1 1Turn Type Split NA Perm Split NA Prot NA Prot NAProtected Phases 4 4 3 3 5 2 1 6Permitted Phases 4Actuated Green, G (s) 25.5 25.5 25.5 17.0 17.0 26.3 64.5 6.4 44.6Effective Green, g (s) 25.5 25.5 25.5 17.0 17.0 26.3 65.1 6.4 45.2Actuated g/C Ratio 0.20 0.20 0.20 0.13 0.13 0.20 0.50 0.05 0.35Clearance Time (s) 4.0 4.0 4.0 4.0 4.0 4.0 4.6 4.0 4.6Vehicle Extension (s) 3.0 3.0 3.0 3.0 3.0 3.0 3.0 3.0 3.0Lane Grp Cap (vph) 329 342 298 231 222 358 2493 87 1739v/s Ratio Prot 0.11 c0.16 0.07 c0.11 c0.16 c0.45 0.03 0.23v/s Ratio Perm 0.04v/c Ratio 0.57 0.83 0.21 0.50 0.85 0.80 0.90 0.61 0.66Uniform Delay, d1 47.3 50.2 43.8 52.6 55.3 49.3 29.6 60.6 35.9Progression Factor 1.00 1.00 1.00 1.00 1.00 1.00 1.00 0.85 0.96Incremental Delay, d2 2.4 15.8 0.4 1.7 25.9 11.8 6.0 11.0 1.9Delay (s) 49.8 66.0 44.2 54.3 81.2 61.1 35.6 62.6 36.6Level of Service D E D D F E D E DApproach Delay (s) 53.3 71.9 38.5 37.7Approach LOS D E D D
Intersection SummaryHCM 2000 Control Delay 43.0 HCM 2000 Level of Service DHCM 2000 Volume to Capacity ratio 0.88Actuated Cycle Length (s) 130.0 Sum of lost time (s) 16.0Intersection Capacity Utilization 89.4% ICU Level of Service EAnalysis Period (min) 15c Critical Lane Group
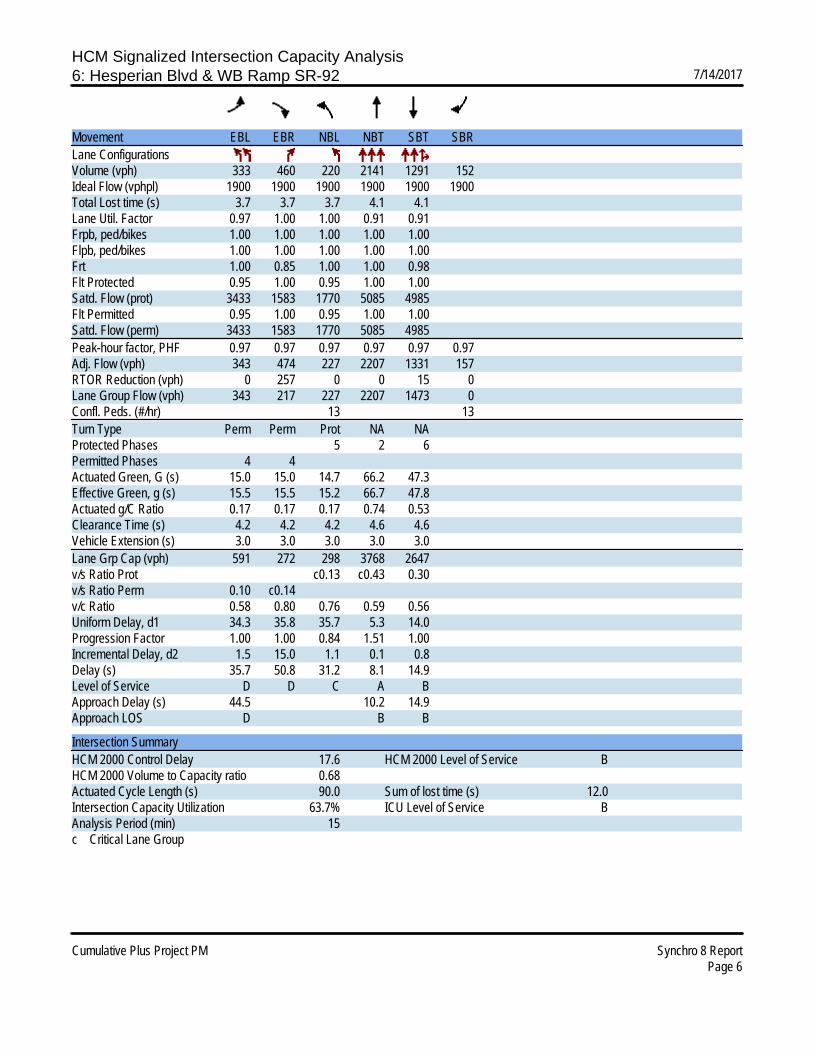
HCM Signalized Intersection Capacity Analysis6: Hesperian Blvd & WB Ramp SR-92 7/14/2017
Cumulative Plus Project PM Synchro 8 ReportPage 6
Movement EBL EBR NBL NBT SBT SBRLane ConfigurationsVolume (vph) 333 460 220 2141 1291 152Ideal Flow (vphpl) 1900 1900 1900 1900 1900 1900Total Lost time (s) 3.7 3.7 3.7 4.1 4.1Lane Util. Factor 0.97 1.00 1.00 0.91 0.91Frpb, ped/bikes 1.00 1.00 1.00 1.00 1.00Flpb, ped/bikes 1.00 1.00 1.00 1.00 1.00Frt 1.00 0.85 1.00 1.00 0.98Flt Protected 0.95 1.00 0.95 1.00 1.00Satd. Flow (prot) 3433 1583 1770 5085 4985Flt Permitted 0.95 1.00 0.95 1.00 1.00Satd. Flow (perm) 3433 1583 1770 5085 4985Peak-hour factor, PHF 0.97 0.97 0.97 0.97 0.97 0.97Adj. Flow (vph) 343 474 227 2207 1331 157RTOR Reduction (vph) 0 257 0 0 15 0Lane Group Flow (vph) 343 217 227 2207 1473 0Confl. Peds. (#/hr) 13 13Turn Type Perm Perm Prot NA NAProtected Phases 5 2 6Permitted Phases 4 4Actuated Green, G (s) 15.0 15.0 14.7 66.2 47.3Effective Green, g (s) 15.5 15.5 15.2 66.7 47.8Actuated g/C Ratio 0.17 0.17 0.17 0.74 0.53Clearance Time (s) 4.2 4.2 4.2 4.6 4.6Vehicle Extension (s) 3.0 3.0 3.0 3.0 3.0Lane Grp Cap (vph) 591 272 298 3768 2647v/s Ratio Prot c0.13 c0.43 0.30v/s Ratio Perm 0.10 c0.14v/c Ratio 0.58 0.80 0.76 0.59 0.56Uniform Delay, d1 34.3 35.8 35.7 5.3 14.0Progression Factor 1.00 1.00 0.84 1.51 1.00Incremental Delay, d2 1.5 15.0 1.1 0.1 0.8Delay (s) 35.7 50.8 31.2 8.1 14.9Level of Service D D C A BApproach Delay (s) 44.5 10.2 14.9Approach LOS D B B
Intersection SummaryHCM 2000 Control Delay 17.6 HCM 2000 Level of Service BHCM 2000 Volume to Capacity ratio 0.68Actuated Cycle Length (s) 90.0 Sum of lost time (s) 12.0Intersection Capacity Utilization 63.7% ICU Level of Service BAnalysis Period (min) 15c Critical Lane Group
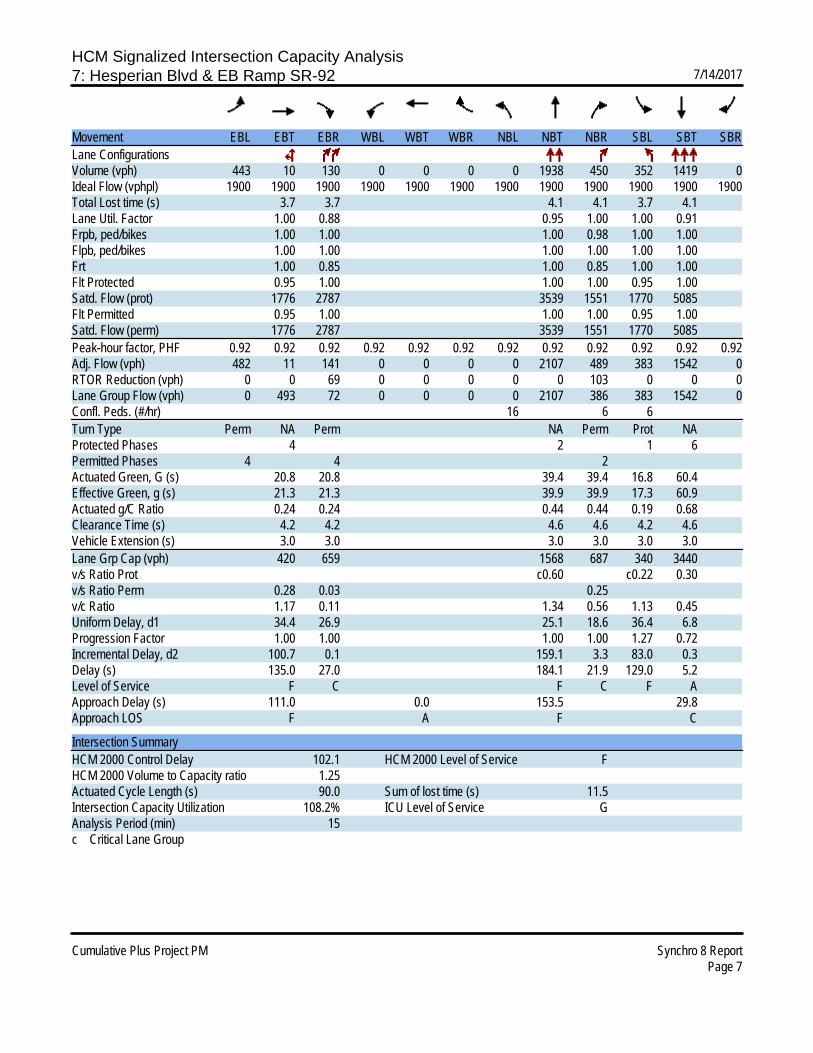
HCM Signalized Intersection Capacity Analysis7: Hesperian Blvd & EB Ramp SR-92 7/14/2017
Cumulative Plus Project PM Synchro 8 ReportPage 7
Movement EBL EBT EBR WBL WBT WBR NBL NBT NBR SBL SBT SBRLane ConfigurationsVolume (vph) 443 10 130 0 0 0 0 1938 450 352 1419 0Ideal Flow (vphpl) 1900 1900 1900 1900 1900 1900 1900 1900 1900 1900 1900 1900Total Lost time (s) 3.7 3.7 4.1 4.1 3.7 4.1Lane Util. Factor 1.00 0.88 0.95 1.00 1.00 0.91Frpb, ped/bikes 1.00 1.00 1.00 0.98 1.00 1.00Flpb, ped/bikes 1.00 1.00 1.00 1.00 1.00 1.00Frt 1.00 0.85 1.00 0.85 1.00 1.00Flt Protected 0.95 1.00 1.00 1.00 0.95 1.00Satd. Flow (prot) 1776 2787 3539 1551 1770 5085Flt Permitted 0.95 1.00 1.00 1.00 0.95 1.00Satd. Flow (perm) 1776 2787 3539 1551 1770 5085Peak-hour factor, PHF 0.92 0.92 0.92 0.92 0.92 0.92 0.92 0.92 0.92 0.92 0.92 0.92Adj. Flow (vph) 482 11 141 0 0 0 0 2107 489 383 1542 0RTOR Reduction (vph) 0 0 69 0 0 0 0 0 103 0 0 0Lane Group Flow (vph) 0 493 72 0 0 0 0 2107 386 383 1542 0Confl. Peds. (#/hr) 16 6 6Turn Type Perm NA Perm NA Perm Prot NAProtected Phases 4 2 1 6Permitted Phases 4 4 2Actuated Green, G (s) 20.8 20.8 39.4 39.4 16.8 60.4Effective Green, g (s) 21.3 21.3 39.9 39.9 17.3 60.9Actuated g/C Ratio 0.24 0.24 0.44 0.44 0.19 0.68Clearance Time (s) 4.2 4.2 4.6 4.6 4.2 4.6Vehicle Extension (s) 3.0 3.0 3.0 3.0 3.0 3.0Lane Grp Cap (vph) 420 659 1568 687 340 3440v/s Ratio Prot c0.60 c0.22 0.30v/s Ratio Perm 0.28 0.03 0.25v/c Ratio 1.17 0.11 1.34 0.56 1.13 0.45Uniform Delay, d1 34.4 26.9 25.1 18.6 36.4 6.8Progression Factor 1.00 1.00 1.00 1.00 1.27 0.72Incremental Delay, d2 100.7 0.1 159.1 3.3 83.0 0.3Delay (s) 135.0 27.0 184.1 21.9 129.0 5.2Level of Service F C F C F AApproach Delay (s) 111.0 0.0 153.5 29.8Approach LOS F A F C
Intersection SummaryHCM 2000 Control Delay 102.1 HCM 2000 Level of Service FHCM 2000 Volume to Capacity ratio 1.25Actuated Cycle Length (s) 90.0 Sum of lost time (s) 11.5Intersection Capacity Utilization 108.2% ICU Level of Service GAnalysis Period (min) 15c Critical Lane Group
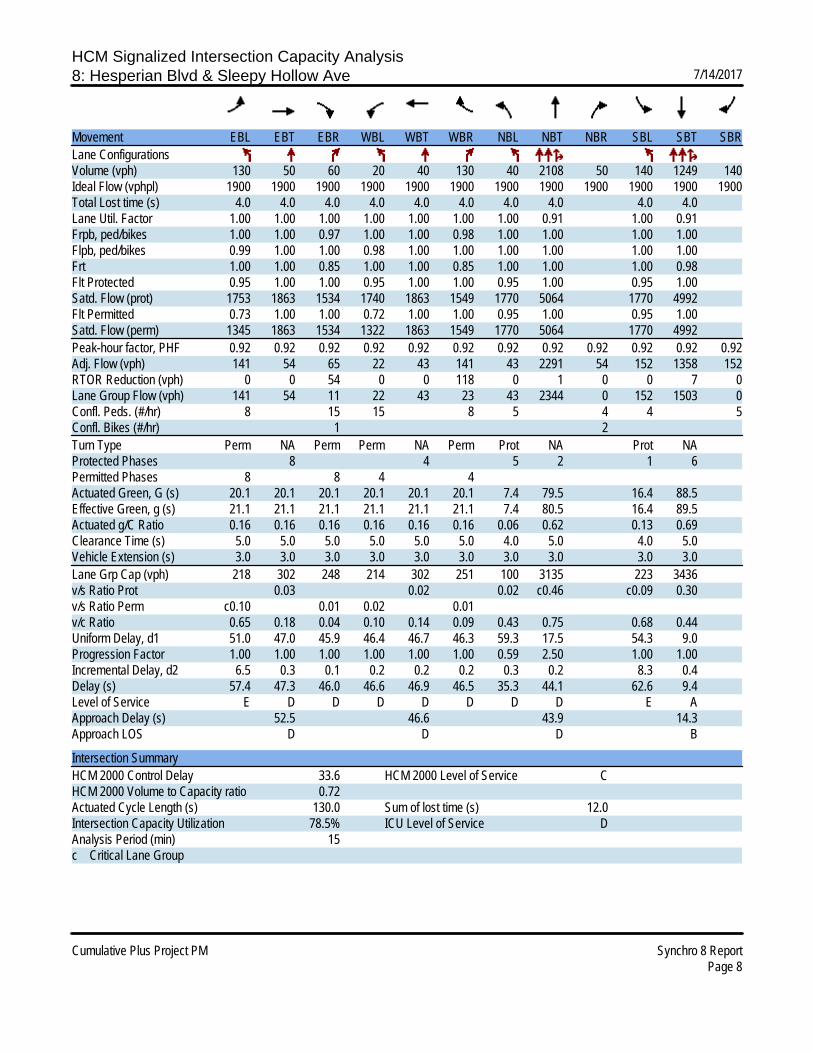
HCM Signalized Intersection Capacity Analysis8: Hesperian Blvd & Sleepy Hollow Ave 7/14/2017
Cumulative Plus Project PM Synchro 8 ReportPage 8
Movement EBL EBT EBR WBL WBT WBR NBL NBT NBR SBL SBT SBRLane ConfigurationsVolume (vph) 130 50 60 20 40 130 40 2108 50 140 1249 140Ideal Flow (vphpl) 1900 1900 1900 1900 1900 1900 1900 1900 1900 1900 1900 1900Total Lost time (s) 4.0 4.0 4.0 4.0 4.0 4.0 4.0 4.0 4.0 4.0Lane Util. Factor 1.00 1.00 1.00 1.00 1.00 1.00 1.00 0.91 1.00 0.91Frpb, ped/bikes 1.00 1.00 0.97 1.00 1.00 0.98 1.00 1.00 1.00 1.00Flpb, ped/bikes 0.99 1.00 1.00 0.98 1.00 1.00 1.00 1.00 1.00 1.00Frt 1.00 1.00 0.85 1.00 1.00 0.85 1.00 1.00 1.00 0.98Flt Protected 0.95 1.00 1.00 0.95 1.00 1.00 0.95 1.00 0.95 1.00Satd. Flow (prot) 1753 1863 1534 1740 1863 1549 1770 5064 1770 4992Flt Permitted 0.73 1.00 1.00 0.72 1.00 1.00 0.95 1.00 0.95 1.00Satd. Flow (perm) 1345 1863 1534 1322 1863 1549 1770 5064 1770 4992Peak-hour factor, PHF 0.92 0.92 0.92 0.92 0.92 0.92 0.92 0.92 0.92 0.92 0.92 0.92Adj. Flow (vph) 141 54 65 22 43 141 43 2291 54 152 1358 152RTOR Reduction (vph) 0 0 54 0 0 118 0 1 0 0 7 0Lane Group Flow (vph) 141 54 11 22 43 23 43 2344 0 152 1503 0Confl. Peds. (#/hr) 8 15 15 8 5 4 4 5Confl. Bikes (#/hr) 1 2Turn Type Perm NA Perm Perm NA Perm Prot NA Prot NAProtected Phases 8 4 5 2 1 6Permitted Phases 8 8 4 4Actuated Green, G (s) 20.1 20.1 20.1 20.1 20.1 20.1 7.4 79.5 16.4 88.5Effective Green, g (s) 21.1 21.1 21.1 21.1 21.1 21.1 7.4 80.5 16.4 89.5Actuated g/C Ratio 0.16 0.16 0.16 0.16 0.16 0.16 0.06 0.62 0.13 0.69Clearance Time (s) 5.0 5.0 5.0 5.0 5.0 5.0 4.0 5.0 4.0 5.0Vehicle Extension (s) 3.0 3.0 3.0 3.0 3.0 3.0 3.0 3.0 3.0 3.0Lane Grp Cap (vph) 218 302 248 214 302 251 100 3135 223 3436v/s Ratio Prot 0.03 0.02 0.02 c0.46 c0.09 0.30v/s Ratio Perm c0.10 0.01 0.02 0.01v/c Ratio 0.65 0.18 0.04 0.10 0.14 0.09 0.43 0.75 0.68 0.44Uniform Delay, d1 51.0 47.0 45.9 46.4 46.7 46.3 59.3 17.5 54.3 9.0Progression Factor 1.00 1.00 1.00 1.00 1.00 1.00 0.59 2.50 1.00 1.00Incremental Delay, d2 6.5 0.3 0.1 0.2 0.2 0.2 0.3 0.2 8.3 0.4Delay (s) 57.4 47.3 46.0 46.6 46.9 46.5 35.3 44.1 62.6 9.4Level of Service E D D D D D D D E AApproach Delay (s) 52.5 46.6 43.9 14.3Approach LOS D D D B
Intersection SummaryHCM 2000 Control Delay 33.6 HCM 2000 Level of Service CHCM 2000 Volume to Capacity ratio 0.72Actuated Cycle Length (s) 130.0 Sum of lost time (s) 12.0Intersection Capacity Utilization 78.5% ICU Level of Service DAnalysis Period (min) 15c Critical Lane Group

HCM Signalized Intersection Capacity Analysis9: Hesperian Blvd & Tennyson Road 7/14/2017
Cumulative Plus Project PM Synchro 8 ReportPage 9
Movement EBL EBT EBR WBL WBT WBR NBL NBT NBR SBL SBT SBRLane ConfigurationsVolume (vph) 203 740 80 300 300 223 110 1632 200 252 847 110Ideal Flow (vphpl) 1900 1900 1900 1900 1900 1900 1900 1900 1900 1900 1900 1900Total Lost time (s) 4.0 4.0 4.0 4.0 4.0 4.0 4.0 4.0 4.0 4.0Lane Util. Factor 1.00 0.95 1.00 1.00 0.95 1.00 1.00 0.91 1.00 0.91Frpb, ped/bikes 1.00 1.00 0.96 1.00 1.00 0.97 1.00 1.00 1.00 1.00Flpb, ped/bikes 1.00 1.00 1.00 1.00 1.00 1.00 1.00 1.00 1.00 1.00Frt 1.00 1.00 0.85 1.00 1.00 0.85 1.00 0.98 1.00 0.98Flt Protected 0.95 1.00 1.00 0.95 1.00 1.00 0.95 1.00 0.95 1.00Satd. Flow (prot) 1770 3539 1524 1770 3539 1542 1770 4980 1770 4981Flt Permitted 0.95 1.00 1.00 0.95 1.00 1.00 0.95 1.00 0.95 1.00Satd. Flow (perm) 1770 3539 1524 1770 3539 1542 1770 4980 1770 4981Peak-hour factor, PHF 0.92 0.92 0.92 0.92 0.92 0.92 0.92 0.92 0.92 0.92 0.92 0.92Adj. Flow (vph) 221 804 87 326 326 242 120 1774 217 274 921 120RTOR Reduction (vph) 0 0 64 0 0 169 0 12 0 0 12 0Lane Group Flow (vph) 221 804 23 326 326 73 120 1979 0 274 1029 0Confl. Peds. (#/hr) 12 21 21 12 15 25 25 15Confl. Bikes (#/hr) 2 1Turn Type Prot NA Perm Prot NA Perm Prot NA Prot NAProtected Phases 3 8 7 4 1 6 5 2Permitted Phases 8 4Actuated Green, G (s) 17.7 33.3 33.3 22.0 37.6 37.6 12.1 37.9 18.7 44.5Effective Green, g (s) 17.7 34.3 34.3 22.0 38.6 38.6 12.1 39.0 18.7 45.6Actuated g/C Ratio 0.14 0.26 0.26 0.17 0.30 0.30 0.09 0.30 0.14 0.35Clearance Time (s) 4.0 5.0 5.0 4.0 5.0 5.0 4.0 5.1 4.0 5.1Vehicle Extension (s) 3.0 3.0 3.0 3.0 3.0 3.0 3.0 3.0 3.0 3.0Lane Grp Cap (vph) 240 933 402 299 1050 457 164 1494 254 1747v/s Ratio Prot 0.12 c0.23 c0.18 0.09 0.07 c0.40 c0.15 0.21v/s Ratio Perm 0.02 0.05v/c Ratio 0.92 0.86 0.06 1.09 0.31 0.16 0.73 1.32 1.08 0.59Uniform Delay, d1 55.5 45.6 35.8 54.0 35.4 33.7 57.4 45.5 55.6 34.5Progression Factor 1.00 1.00 1.00 1.00 1.00 1.00 1.00 1.00 1.07 0.73Incremental Delay, d2 37.2 8.2 0.1 78.3 0.2 0.2 15.4 150.9 76.9 1.4Delay (s) 92.7 53.8 35.8 132.3 35.6 33.9 72.8 196.4 136.5 26.7Level of Service F D D F D C E F F CApproach Delay (s) 60.1 70.4 189.4 49.6Approach LOS E E F D
Intersection SummaryHCM 2000 Control Delay 109.5 HCM 2000 Level of Service FHCM 2000 Volume to Capacity ratio 1.10Actuated Cycle Length (s) 130.0 Sum of lost time (s) 16.0Intersection Capacity Utilization 104.6% ICU Level of Service GAnalysis Period (min) 15c Critical Lane Group

HCM Signalized Intersection Capacity Analysis10: Industrial Blvd & EB Ramp SR-92 7/14/2017
Cumulative Plus Project PM Synchro 8 ReportPage 10
Movement EBL EBT EBR WBL WBT WBR NBL NBT NBR SBL SBT SBRLane ConfigurationsVolume (vph) 243 90 980 10 30 50 100 993 80 92 1073 250Ideal Flow (vphpl) 1900 1900 1900 1900 1900 1900 1900 1900 1900 1900 1900 1900Total Lost time (s) 4.2 4.2 4.2 4.2 3.2 3.6 3.6 3.2 3.6 3.6Lane Util. Factor 1.00 1.00 1.00 1.00 1.00 0.95 1.00 1.00 0.95 1.00Frpb, ped/bikes 1.00 1.00 1.00 1.00 1.00 1.00 0.97 1.00 1.00 0.97Flpb, ped/bikes 1.00 1.00 1.00 1.00 1.00 1.00 1.00 1.00 1.00 1.00Frt 1.00 0.85 1.00 0.85 1.00 1.00 0.85 1.00 1.00 0.85Flt Protected 0.96 1.00 0.99 1.00 0.95 1.00 1.00 0.95 1.00 1.00Satd. Flow (prot) 1797 1583 1840 1583 1770 3539 1534 1770 3539 1532Flt Permitted 0.76 1.00 0.89 1.00 0.95 1.00 1.00 0.95 1.00 1.00Satd. Flow (perm) 1409 1583 1653 1583 1770 3539 1534 1770 3539 1532Peak-hour factor, PHF 0.91 0.91 0.91 0.91 0.91 0.91 0.91 0.91 0.91 0.91 0.91 0.91Adj. Flow (vph) 267 99 1077 11 33 55 110 1091 88 101 1179 275RTOR Reduction (vph) 0 0 193 0 0 40 0 0 45 0 0 145Lane Group Flow (vph) 0 366 884 0 44 15 110 1091 43 101 1179 130Confl. Peds. (#/hr) 6 6 6 6Confl. Bikes (#/hr) 1Turn Type Perm NA Perm Perm NA Perm Prot NA Perm Prot NA PermProtected Phases 8 4 1 6 5 2Permitted Phases 8 8 4 4 6 2Actuated Green, G (s) 18.0 18.0 18.0 18.0 6.8 32.3 32.3 7.2 32.7 32.7Effective Green, g (s) 18.5 18.5 18.5 18.5 7.3 32.8 32.8 7.7 33.2 33.2Actuated g/C Ratio 0.26 0.26 0.26 0.26 0.10 0.47 0.47 0.11 0.47 0.47Clearance Time (s) 4.7 4.7 4.7 4.7 3.7 4.1 4.1 3.7 4.1 4.1Vehicle Extension (s) 3.0 3.0 3.0 3.0 3.0 3.0 3.0 3.0 3.0 3.0Lane Grp Cap (vph) 372 418 436 418 184 1658 718 194 1678 726v/s Ratio Prot c0.06 0.31 0.06 c0.33v/s Ratio Perm 0.26 c0.56 0.03 0.01 0.03 0.09v/c Ratio 0.98 2.11 0.10 0.03 0.60 0.66 0.06 0.52 0.70 0.18Uniform Delay, d1 25.6 25.8 19.5 19.1 29.9 14.3 10.2 29.4 14.5 10.6Progression Factor 1.00 1.00 1.00 1.00 1.00 1.00 1.00 0.71 2.01 7.27Incremental Delay, d2 42.1 509.2 0.1 0.0 5.1 2.1 0.2 0.8 0.8 0.2Delay (s) 67.7 534.9 19.6 19.2 35.1 16.4 10.3 21.6 29.9 77.1Level of Service E F B B D B B C C EApproach Delay (s) 416.4 19.3 17.5 37.7Approach LOS F B B D
Intersection SummaryHCM 2000 Control Delay 156.0 HCM 2000 Level of Service FHCM 2000 Volume to Capacity ratio 1.13Actuated Cycle Length (s) 70.0 Sum of lost time (s) 11.0Intersection Capacity Utilization 109.0% ICU Level of Service HAnalysis Period (min) 15c Critical Lane Group
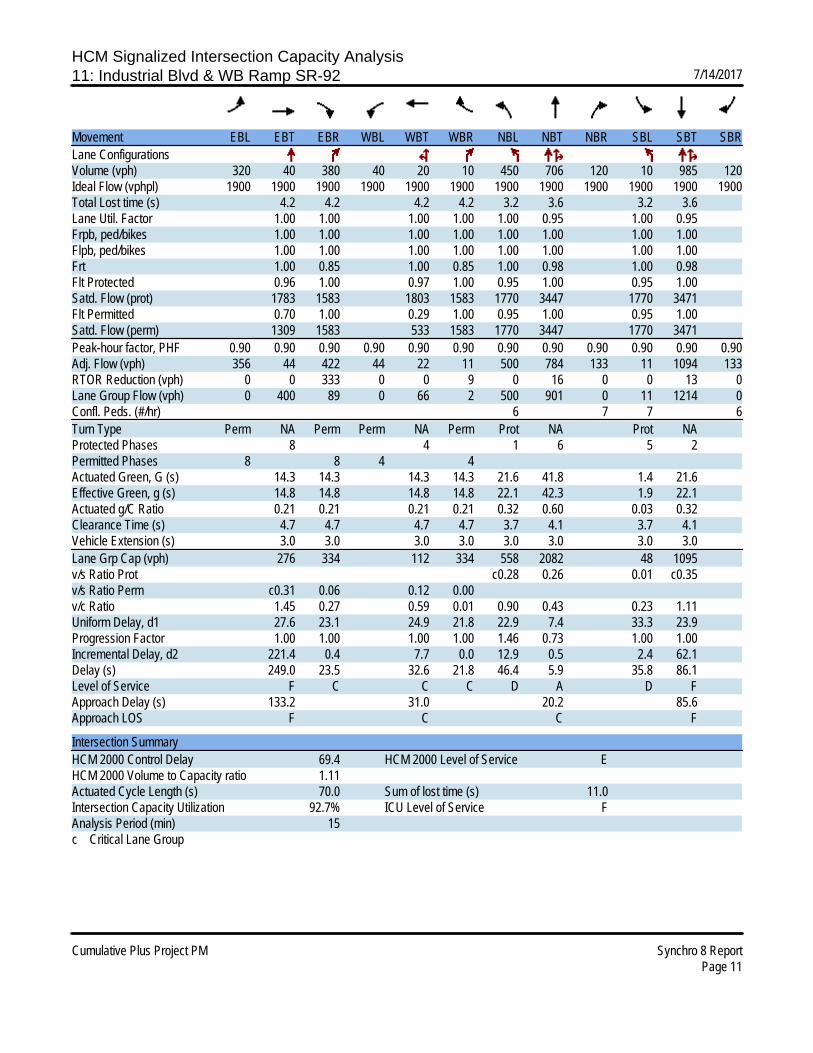
HCM Signalized Intersection Capacity Analysis11: Industrial Blvd & WB Ramp SR-92 7/14/2017
Cumulative Plus Project PM Synchro 8 ReportPage 11
Movement EBL EBT EBR WBL WBT WBR NBL NBT NBR SBL SBT SBRLane ConfigurationsVolume (vph) 320 40 380 40 20 10 450 706 120 10 985 120Ideal Flow (vphpl) 1900 1900 1900 1900 1900 1900 1900 1900 1900 1900 1900 1900Total Lost time (s) 4.2 4.2 4.2 4.2 3.2 3.6 3.2 3.6Lane Util. Factor 1.00 1.00 1.00 1.00 1.00 0.95 1.00 0.95Frpb, ped/bikes 1.00 1.00 1.00 1.00 1.00 1.00 1.00 1.00Flpb, ped/bikes 1.00 1.00 1.00 1.00 1.00 1.00 1.00 1.00Frt 1.00 0.85 1.00 0.85 1.00 0.98 1.00 0.98Flt Protected 0.96 1.00 0.97 1.00 0.95 1.00 0.95 1.00Satd. Flow (prot) 1783 1583 1803 1583 1770 3447 1770 3471Flt Permitted 0.70 1.00 0.29 1.00 0.95 1.00 0.95 1.00Satd. Flow (perm) 1309 1583 533 1583 1770 3447 1770 3471Peak-hour factor, PHF 0.90 0.90 0.90 0.90 0.90 0.90 0.90 0.90 0.90 0.90 0.90 0.90Adj. Flow (vph) 356 44 422 44 22 11 500 784 133 11 1094 133RTOR Reduction (vph) 0 0 333 0 0 9 0 16 0 0 13 0Lane Group Flow (vph) 0 400 89 0 66 2 500 901 0 11 1214 0Confl. Peds. (#/hr) 6 7 7 6Turn Type Perm NA Perm Perm NA Perm Prot NA Prot NAProtected Phases 8 4 1 6 5 2Permitted Phases 8 8 4 4Actuated Green, G (s) 14.3 14.3 14.3 14.3 21.6 41.8 1.4 21.6Effective Green, g (s) 14.8 14.8 14.8 14.8 22.1 42.3 1.9 22.1Actuated g/C Ratio 0.21 0.21 0.21 0.21 0.32 0.60 0.03 0.32Clearance Time (s) 4.7 4.7 4.7 4.7 3.7 4.1 3.7 4.1Vehicle Extension (s) 3.0 3.0 3.0 3.0 3.0 3.0 3.0 3.0Lane Grp Cap (vph) 276 334 112 334 558 2082 48 1095v/s Ratio Prot c0.28 0.26 0.01 c0.35v/s Ratio Perm c0.31 0.06 0.12 0.00v/c Ratio 1.45 0.27 0.59 0.01 0.90 0.43 0.23 1.11Uniform Delay, d1 27.6 23.1 24.9 21.8 22.9 7.4 33.3 23.9Progression Factor 1.00 1.00 1.00 1.00 1.46 0.73 1.00 1.00Incremental Delay, d2 221.4 0.4 7.7 0.0 12.9 0.5 2.4 62.1Delay (s) 249.0 23.5 32.6 21.8 46.4 5.9 35.8 86.1Level of Service F C C C D A D FApproach Delay (s) 133.2 31.0 20.2 85.6Approach LOS F C C F
Intersection SummaryHCM 2000 Control Delay 69.4 HCM 2000 Level of Service EHCM 2000 Volume to Capacity ratio 1.11Actuated Cycle Length (s) 70.0 Sum of lost time (s) 11.0Intersection Capacity Utilization 92.7% ICU Level of Service FAnalysis Period (min) 15c Critical Lane Group

HCM Signalized Intersection Capacity Analysis12: Industrial Blvd & Depot Road 7/14/2017
Cumulative Plus Project PM Synchro 8 ReportPage 12
Movement EBL EBT EBR WBL WBT WBR NBL NBT NBR SBL SBT SBRLane ConfigurationsVolume (vph) 90 240 290 55 30 20 140 650 146 53 460 10Ideal Flow (vphpl) 1900 1900 1900 1900 1900 1900 1900 1900 1900 1900 1900 1900Total Lost time (s) 4.0 4.0 4.0 4.5 4.0 4.0 4.0 4.0 4.0 4.0Lane Util. Factor 1.00 1.00 1.00 0.95 1.00 0.95 1.00 1.00 0.95 1.00Frpb, ped/bikes 1.00 1.00 0.98 1.00 1.00 1.00 1.00 1.00 1.00 0.99Flpb, ped/bikes 1.00 1.00 1.00 1.00 1.00 1.00 1.00 1.00 1.00 1.00Frt 1.00 1.00 0.85 0.97 1.00 1.00 0.85 1.00 1.00 0.85Flt Protected 0.95 1.00 1.00 0.97 0.95 1.00 1.00 0.95 1.00 1.00Satd. Flow (prot) 1770 1863 1556 3346 1770 3539 1583 1770 3539 1563Flt Permitted 0.68 1.00 1.00 0.74 0.95 1.00 1.00 0.95 1.00 1.00Satd. Flow (perm) 1268 1863 1556 2547 1770 3539 1583 1770 3539 1563Peak-hour factor, PHF 0.93 0.93 0.93 0.93 0.93 0.93 0.93 0.93 0.93 0.93 0.93 0.93Adj. Flow (vph) 97 258 312 59 32 22 151 699 157 57 495 11RTOR Reduction (vph) 0 0 214 0 15 0 0 0 88 0 0 7Lane Group Flow (vph) 97 258 98 0 98 0 151 699 69 57 495 4Confl. Peds. (#/hr) 3 3 1 1Confl. Bikes (#/hr) 4Turn Type Perm NA Perm Perm NA Prot NA Perm Prot NA PermProtected Phases 4 4 5 2 1 6Permitted Phases 4 4 4 2 6Actuated Green, G (s) 23.3 23.3 23.3 23.3 15.0 32.5 32.5 6.4 23.9 23.9Effective Green, g (s) 23.8 23.8 23.8 23.3 15.0 33.5 33.5 6.4 24.9 24.9Actuated g/C Ratio 0.31 0.31 0.31 0.31 0.20 0.44 0.44 0.08 0.33 0.33Clearance Time (s) 4.5 4.5 4.5 4.5 4.0 5.0 5.0 4.0 5.0 5.0Vehicle Extension (s) 6.0 6.0 6.0 6.0 6.0 8.0 8.0 6.0 8.0 8.0Lane Grp Cap (vph) 398 585 489 783 350 1566 700 149 1164 514v/s Ratio Prot c0.14 c0.09 c0.20 0.03 0.14v/s Ratio Perm 0.08 0.06 0.04 0.04 0.00v/c Ratio 0.24 0.44 0.20 0.12 0.43 0.45 0.10 0.38 0.43 0.01Uniform Delay, d1 19.3 20.7 19.0 18.9 26.6 14.7 12.3 32.8 19.8 17.1Progression Factor 1.00 1.00 1.00 1.00 1.00 1.00 1.00 1.00 1.00 1.00Incremental Delay, d2 0.9 1.5 0.6 0.2 2.4 0.9 0.3 4.6 1.1 0.0Delay (s) 20.2 22.2 19.6 19.1 29.0 15.5 12.6 37.3 20.9 17.1Level of Service C C B B C B B D C BApproach Delay (s) 20.7 19.1 17.1 22.5Approach LOS C B B C
Intersection SummaryHCM 2000 Control Delay 19.5 HCM 2000 Level of Service BHCM 2000 Volume to Capacity ratio 0.46Actuated Cycle Length (s) 75.7 Sum of lost time (s) 12.5Intersection Capacity Utilization 52.0% ICU Level of Service AAnalysis Period (min) 15c Critical Lane Group

HCM Unsignalized Intersection Capacity Analysis13: Depot Road & West Driveway 7/14/2017
Cumulative Plus Project PM Synchro 8 ReportPage 13
Movement EBL EBT WBT WBR SBL SBRLane ConfigurationsVolume (veh/h) 27 492 160 71 60 15Sign Control Free Free StopGrade 0% 0% 0%Peak Hour Factor 0.91 0.91 0.91 0.91 0.91 0.91Hourly flow rate (vph) 30 541 176 78 66 16Pedestrians 2 29Lane Width (ft) 12.0 12.0Walking Speed (ft/s) 3.5 3.5Percent Blockage 0 3Right turn flare (veh)Median type None NoneMedian storage veh)Upstream signal (ft)pX, platoon unblockedvC, conflicting volume 283 576 244vC1, stage 1 conf volvC2, stage 2 conf volvCu, unblocked vol 283 576 244tC, single (s) 4.1 6.8 6.9tC, 2 stage (s)tF (s) 2.2 3.5 3.3p0 queue free % 98 84 98cM capacity (veh/h) 1241 424 736
Direction, Lane # EB 1 EB 2 WB 1 SB 1Volume Total 210 360 254 82Volume Left 30 0 0 66Volume Right 0 0 78 16cSH 1241 1700 1700 464Volume to Capacity 0.02 0.21 0.15 0.18Queue Length 95th (ft) 2 0 0 16Control Delay (s) 1.3 0.0 0.0 14.4Lane LOS A BApproach Delay (s) 0.5 0.0 14.4Approach LOS B
Intersection SummaryAverage Delay 1.6Intersection Capacity Utilization 42.2% ICU Level of Service AAnalysis Period (min) 15
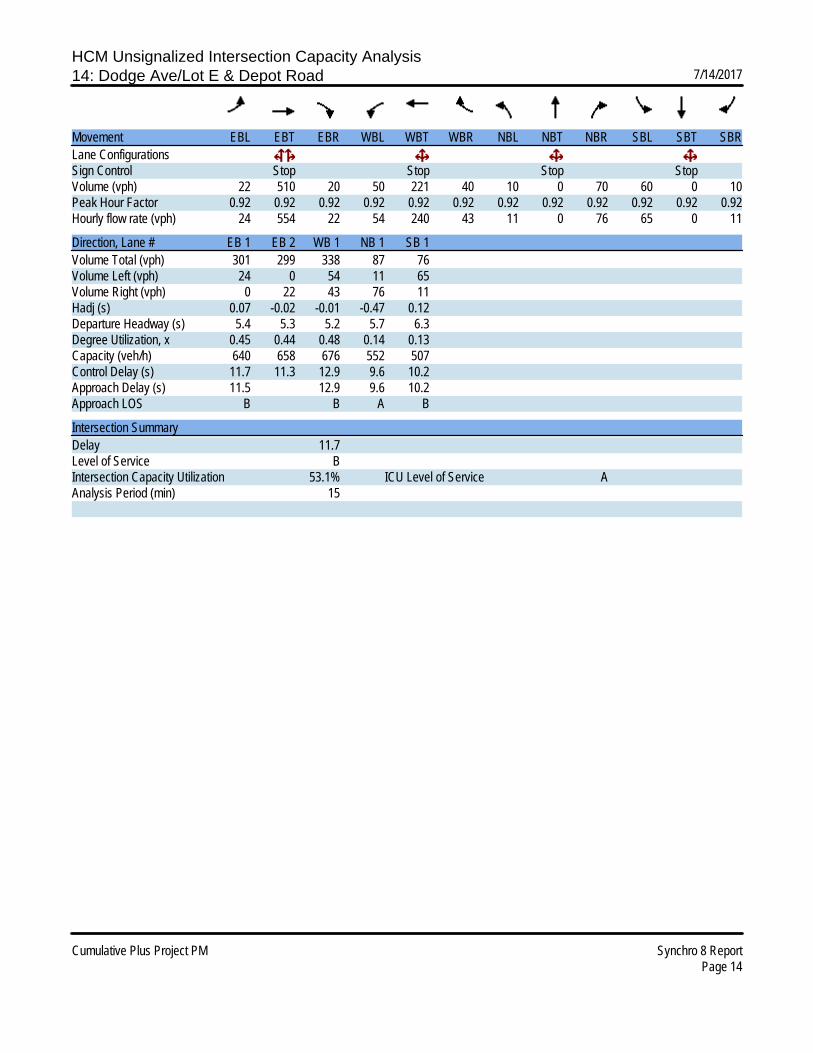
HCM Unsignalized Intersection Capacity Analysis14: Dodge Ave/Lot E & Depot Road 7/14/2017
Cumulative Plus Project PM Synchro 8 ReportPage 14
Movement EBL EBT EBR WBL WBT WBR NBL NBT NBR SBL SBT SBRLane ConfigurationsSign Control Stop Stop Stop StopVolume (vph) 22 510 20 50 221 40 10 0 70 60 0 10Peak Hour Factor 0.92 0.92 0.92 0.92 0.92 0.92 0.92 0.92 0.92 0.92 0.92 0.92Hourly flow rate (vph) 24 554 22 54 240 43 11 0 76 65 0 11
Direction, Lane # EB 1 EB 2 WB 1 NB 1 SB 1Volume Total (vph) 301 299 338 87 76Volume Left (vph) 24 0 54 11 65Volume Right (vph) 0 22 43 76 11Hadj (s) 0.07 -0.02 -0.01 -0.47 0.12Departure Headway (s) 5.4 5.3 5.2 5.7 6.3Degree Utilization, x 0.45 0.44 0.48 0.14 0.13Capacity (veh/h) 640 658 676 552 507Control Delay (s) 11.7 11.3 12.9 9.6 10.2Approach Delay (s) 11.5 12.9 9.6 10.2Approach LOS B B A B
Intersection SummaryDelay 11.7Level of Service BIntersection Capacity Utilization 53.1% ICU Level of Service AAnalysis Period (min) 15

HCM Unsignalized Intersection Capacity Analysis15: Depot Road & Lot F 7/14/2017
Cumulative Plus Project PM Synchro 8 ReportPage 15
Movement EBL EBT WBT WBR SBL SBRLane ConfigurationsVolume (veh/h) 20 620 301 23 60 20Sign Control Free Free StopGrade 0% 0% 0%Peak Hour Factor 0.92 0.92 0.92 0.92 0.92 0.92Hourly flow rate (vph) 22 674 327 25 65 22Pedestrians 9Lane Width (ft) 12.0Walking Speed (ft/s) 3.5Percent Blockage 1Right turn flare (veh)Median type None NoneMedian storage veh)Upstream signal (ft) 957pX, platoon unblockedvC, conflicting volume 361 729 349vC1, stage 1 conf volvC2, stage 2 conf volvCu, unblocked vol 361 729 349tC, single (s) 4.1 6.8 6.9tC, 2 stage (s)tF (s) 2.2 3.5 3.3p0 queue free % 98 81 97cM capacity (veh/h) 1184 348 642
Direction, Lane # EB 1 EB 2 WB 1 SB 1Volume Total 246 449 352 87Volume Left 22 0 0 65Volume Right 0 0 25 22cSH 1184 1700 1700 393Volume to Capacity 0.02 0.26 0.21 0.22Queue Length 95th (ft) 1 0 0 21Control Delay (s) 0.9 0.0 0.0 16.7Lane LOS A CApproach Delay (s) 0.3 0.0 16.7Approach LOS C
Intersection SummaryAverage Delay 1.5Intersection Capacity Utilization 42.8% ICU Level of Service AAnalysis Period (min) 15

HCM Unsignalized Intersection Capacity Analysis16: Depot Road & Lot G 7/14/2017
Cumulative Plus Project PM Synchro 8 ReportPage 16
Movement EBL EBT WBT WBR SBL SBRLane ConfigurationsVolume (veh/h) 10 680 324 62 56 10Sign Control Free Free StopGrade 0% 0% 0%Peak Hour Factor 0.93 0.93 0.93 0.93 0.93 0.93Hourly flow rate (vph) 11 731 348 67 60 11Pedestrians 19 19 5Lane Width (ft) 12.0 12.0 12.0Walking Speed (ft/s) 3.5 3.5 3.5Percent Blockage 2 2 0Right turn flare (veh)Median type None NoneMedian storage veh)Upstream signal (ft) 529pX, platoon unblockedvC, conflicting volume 420 759 372vC1, stage 1 conf volvC2, stage 2 conf volvCu, unblocked vol 420 759 372tC, single (s) 4.1 6.8 6.9tC, 2 stage (s)tF (s) 2.2 3.5 3.3p0 queue free % 99 82 98cM capacity (veh/h) 1130 331 611
Direction, Lane # EB 1 EB 2 WB 1 WB 2 SB 1Volume Total 254 487 348 67 71Volume Left 11 0 0 0 60Volume Right 0 0 0 67 11cSH 1130 1700 1700 1700 356Volume to Capacity 0.01 0.29 0.20 0.04 0.20Queue Length 95th (ft) 1 0 0 0 18Control Delay (s) 0.4 0.0 0.0 0.0 17.6Lane LOS A CApproach Delay (s) 0.1 0.0 17.6Approach LOS C
Intersection SummaryAverage Delay 1.1Intersection Capacity Utilization 40.9% ICU Level of Service AAnalysis Period (min) 15

Appendix B:
Intersection Count Data Sheets
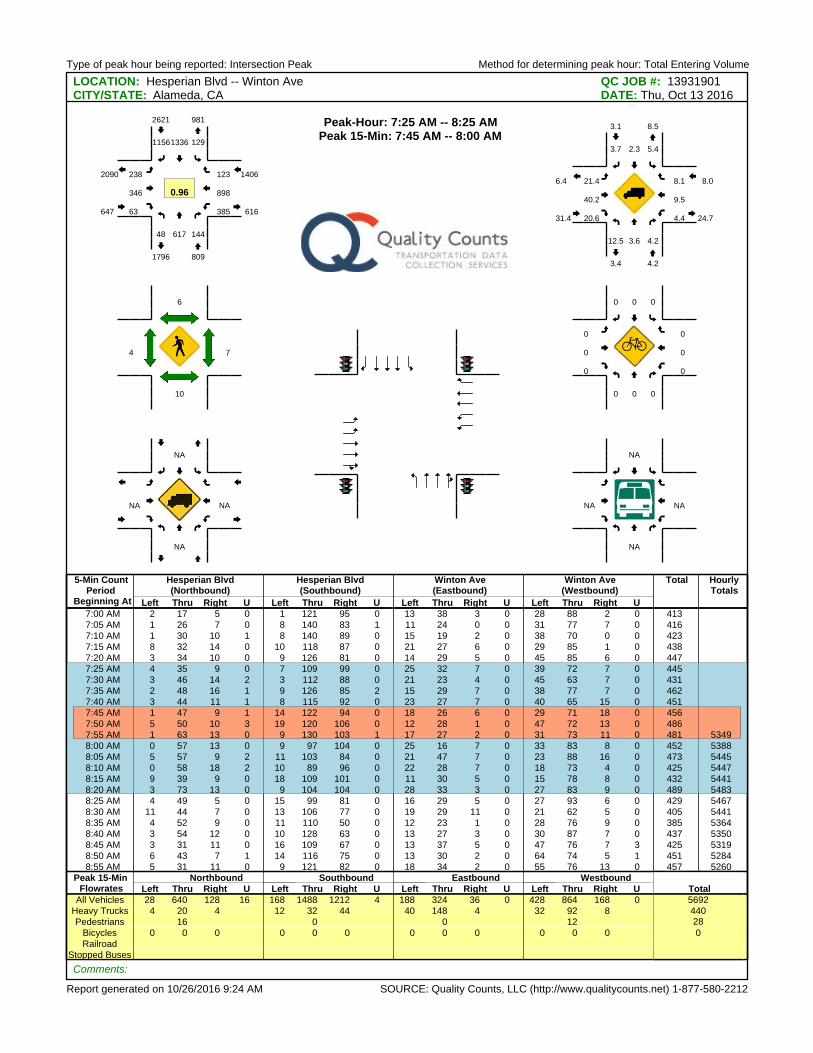
Type of peak hour being reported: Intersection Peak Method for determining peak hour: Total Entering Volume
Report generated on 10/26/2016 9:24 AM SOURCE: Quality Counts, LLC (http://www.qualitycounts.net) 1-877-580-2212
LOCATION: Hesperian Blvd -- Winton Ave QC JOB #: 13931901CITY/STATE: Alameda, CA DATE: Thu, Oct 13 2016
5-Min CountPeriod
Beginning At
Hesperian Blvd(Northbound)
Hesperian Blvd(Southbound)
Winton Ave(Eastbound)
Winton Ave(Westbound)
Total HourlyTotals
Left Thru Right U Left Thru Right U Left Thru Right U Left Thru Right U7:00 AM 2 17 5 0 1 121 95 0 13 38 3 0 28 88 2 0 4137:05 AM 1 26 7 0 8 140 83 1 11 24 0 0 31 77 7 0 4167:10 AM 1 30 10 1 8 140 89 0 15 19 2 0 38 70 0 0 4237:15 AM 8 32 14 0 10 118 87 0 21 27 6 0 29 85 1 0 4387:20 AM 3 34 10 0 9 126 81 0 14 29 5 0 45 85 6 0 447
7:25 AM 4 35 9 0 7 109 99 0 25 32 7 0 39 72 7 0 4457:30 AM 3 46 14 2 3 112 88 0 21 23 4 0 45 63 7 0 4317:35 AM 2 48 16 1 9 126 85 2 15 29 7 0 38 77 7 0 4627:40 AM 3 44 11 1 8 115 92 0 23 27 7 0 40 65 15 0 451
7:45 AM 1 47 9 1 14 122 94 0 18 26 6 0 29 71 18 0 4567:50 AM 5 50 10 3 19 120 106 0 12 28 1 0 47 72 13 0 4867:55 AM 1 63 13 0 9 130 103 1 17 27 2 0 31 73 11 0 481 53498:00 AM 0 57 13 0 9 97 104 0 25 16 7 0 33 83 8 0 452 53888:05 AM 5 57 9 2 11 103 84 0 21 47 7 0 23 88 16 0 473 54458:10 AM 0 58 18 2 10 89 96 0 22 28 7 0 18 73 4 0 425 54478:15 AM 9 39 9 0 18 109 101 0 11 30 5 0 15 78 8 0 432 54418:20 AM 3 73 13 0 9 104 104 0 28 33 3 0 27 83 9 0 489 54838:25 AM 4 49 5 0 15 99 81 0 16 29 5 0 27 93 6 0 429 54678:30 AM 11 44 7 0 13 106 77 0 19 29 11 0 21 62 5 0 405 54418:35 AM 4 52 9 0 11 110 50 0 12 23 1 0 28 76 9 0 385 53648:40 AM 3 54 12 0 10 128 63 0 13 27 3 0 30 87 7 0 437 53508:45 AM 3 31 11 0 16 109 67 0 13 37 5 0 47 76 7 3 425 53198:50 AM 6 43 7 1 14 116 75 0 13 30 2 0 64 74 5 1 451 52848:55 AM 5 31 11 0 9 121 82 0 18 34 2 0 55 76 13 0 457 5260
Peak 15-Min Northbound Southbound Eastbound WestboundTotalFlowrates Left Thru Right U Left Thru Right U Left Thru Right U Left Thru Right U
All Vehicles 28 640 128 16 168 1488 1212 4 188 324 36 0 428 864 168 0 5692Heavy Trucks 4 20 4 12 32 44 40 148 4 32 92 8 440Pedestrians 16 0 0 12 28
Bicycles 0 0 0 0 0 0 0 0 0 0 0 0 0Railroad
Stopped Buses
Comments:
Peak-Hour: 7:25 AM -- 8:25 AMPeak 15-Min: 7:45 AM -- 8:00 AM
48 617 144
12913361156
238
346
63 385
898
123
809
2621
647
1406
981
1796
616
2090
0.96
12.5 3.6 4.2
5.42.33.7
21.4
40.2
20.6 4.4
9.5
8.1
4.2
3.1
31.4
8.0
8.5
3.4
24.7
6.4
10
6
4 7
0 0 0
000
0
0
0 0
0
0
NA
NA
NA NA
NA
NA
NA NA
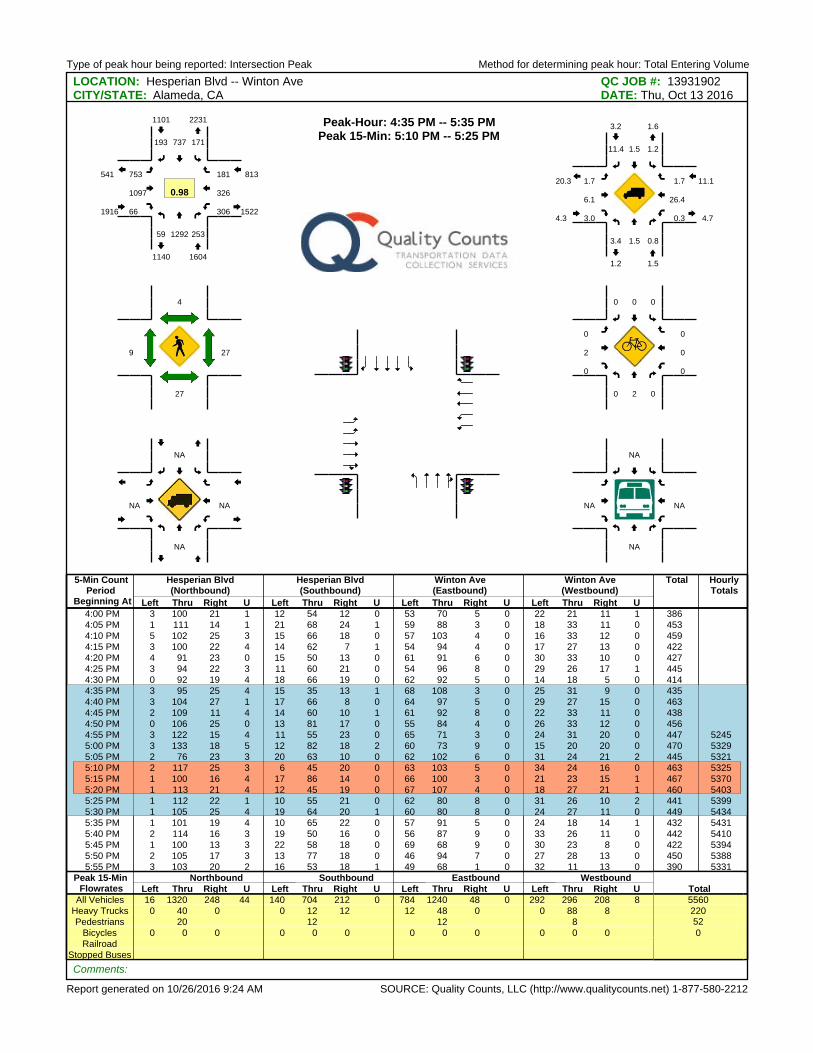
Type of peak hour being reported: Intersection Peak Method for determining peak hour: Total Entering Volume
Report generated on 10/26/2016 9:24 AM SOURCE: Quality Counts, LLC (http://www.qualitycounts.net) 1-877-580-2212
LOCATION: Hesperian Blvd -- Winton Ave QC JOB #: 13931902CITY/STATE: Alameda, CA DATE: Thu, Oct 13 2016
5-Min CountPeriod
Beginning At
Hesperian Blvd(Northbound)
Hesperian Blvd(Southbound)
Winton Ave(Eastbound)
Winton Ave(Westbound)
Total HourlyTotals
Left Thru Right U Left Thru Right U Left Thru Right U Left Thru Right U4:00 PM 3 100 21 1 12 54 12 0 53 70 5 0 22 21 11 1 3864:05 PM 1 111 14 1 21 68 24 1 59 88 3 0 18 33 11 0 4534:10 PM 5 102 25 3 15 66 18 0 57 103 4 0 16 33 12 0 4594:15 PM 3 100 22 4 14 62 7 1 54 94 4 0 17 27 13 0 4224:20 PM 4 91 23 0 15 50 13 0 61 91 6 0 30 33 10 0 4274:25 PM 3 94 22 3 11 60 21 0 54 96 8 0 29 26 17 1 4454:30 PM 0 92 19 4 18 66 19 0 62 92 5 0 14 18 5 0 414
4:35 PM 3 95 25 4 15 35 13 1 68 108 3 0 25 31 9 0 4354:40 PM 3 104 27 1 17 66 8 0 64 97 5 0 29 27 15 0 4634:45 PM 2 109 11 4 14 60 10 1 61 92 8 0 22 33 11 0 4384:50 PM 0 106 25 0 13 81 17 0 55 84 4 0 26 33 12 0 4564:55 PM 3 122 15 4 11 55 23 0 65 71 3 0 24 31 20 0 447 52455:00 PM 3 133 18 5 12 82 18 2 60 73 9 0 15 20 20 0 470 53295:05 PM 2 76 23 3 20 63 10 0 62 102 6 0 31 24 21 2 445 5321
5:10 PM 2 117 25 3 6 45 20 0 63 103 5 0 34 24 16 0 463 53255:15 PM 1 100 16 4 17 86 14 0 66 100 3 0 21 23 15 1 467 53705:20 PM 1 113 21 4 12 45 19 0 67 107 4 0 18 27 21 1 460 54035:25 PM 1 112 22 1 10 55 21 0 62 80 8 0 31 26 10 2 441 53995:30 PM 1 105 25 4 19 64 20 1 60 80 8 0 24 27 11 0 449 54345:35 PM 1 101 19 4 10 65 22 0 57 91 5 0 24 18 14 1 432 54315:40 PM 2 114 16 3 19 50 16 0 56 87 9 0 33 26 11 0 442 54105:45 PM 1 100 13 3 22 58 18 0 69 68 9 0 30 23 8 0 422 53945:50 PM 2 105 17 3 13 77 18 0 46 94 7 0 27 28 13 0 450 53885:55 PM 3 103 20 2 16 53 18 1 49 68 1 0 32 11 13 0 390 5331
Peak 15-Min Northbound Southbound Eastbound WestboundTotalFlowrates Left Thru Right U Left Thru Right U Left Thru Right U Left Thru Right U
All Vehicles 16 1320 248 44 140 704 212 0 784 1240 48 0 292 296 208 8 5560Heavy Trucks 0 40 0 0 12 12 12 48 0 0 88 8 220Pedestrians 20 12 12 8 52
Bicycles 0 0 0 0 0 0 0 0 0 0 0 0 0Railroad
Stopped Buses
Comments:
Peak-Hour: 4:35 PM -- 5:35 PMPeak 15-Min: 5:10 PM -- 5:25 PM
59 1292 253
171737193
753
1097
66 306
326
181
1604
1101
1916
813
2231
1140
1522
541
0.98
3.4 1.5 0.8
1.21.511.4
1.7
6.1
3.0 0.3
26.4
1.7
1.5
3.2
4.3
11.1
1.6
1.2
4.7
20.3
27
4
9 27
0 2 0
000
0
2
0 0
0
0
NA
NA
NA NA
NA
NA
NA NA
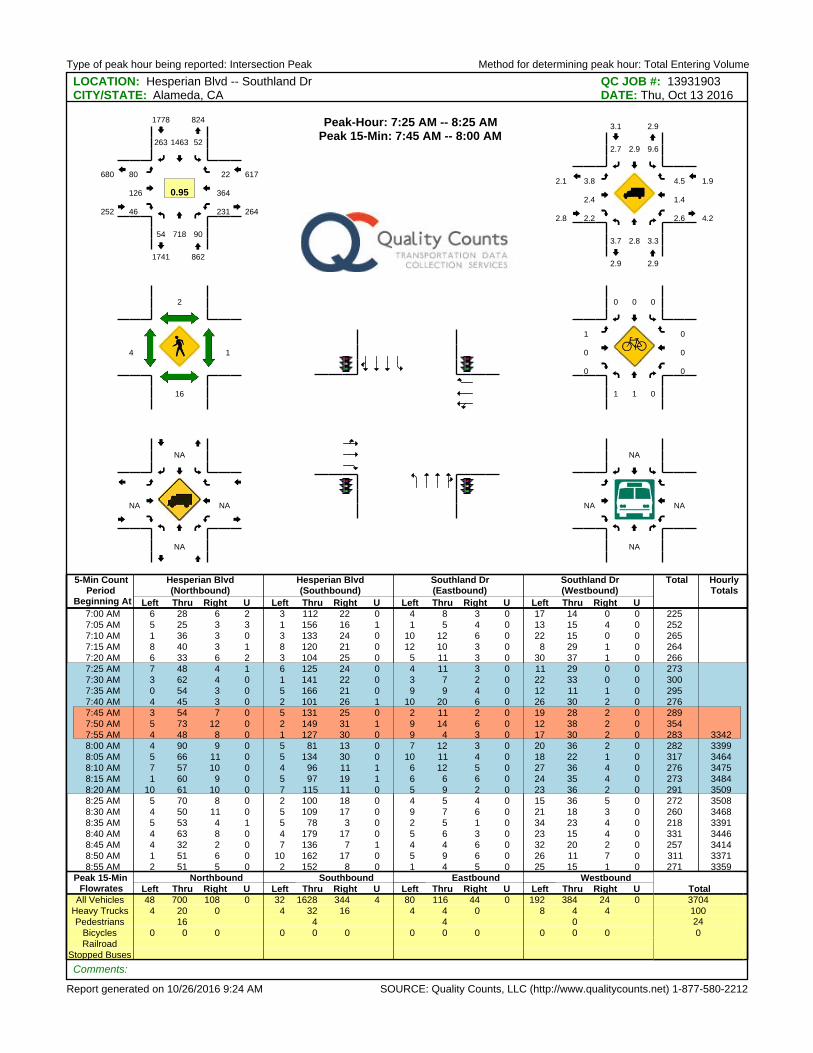
Type of peak hour being reported: Intersection Peak Method for determining peak hour: Total Entering Volume
Report generated on 10/26/2016 9:24 AM SOURCE: Quality Counts, LLC (http://www.qualitycounts.net) 1-877-580-2212
LOCATION: Hesperian Blvd -- Southland Dr QC JOB #: 13931903CITY/STATE: Alameda, CA DATE: Thu, Oct 13 2016
5-Min CountPeriod
Beginning At
Hesperian Blvd(Northbound)
Hesperian Blvd(Southbound)
Southland Dr(Eastbound)
Southland Dr(Westbound)
Total HourlyTotals
Left Thru Right U Left Thru Right U Left Thru Right U Left Thru Right U7:00 AM 6 28 6 2 3 112 22 0 4 8 3 0 17 14 0 0 2257:05 AM 5 25 3 3 1 156 16 1 1 5 4 0 13 15 4 0 2527:10 AM 1 36 3 0 3 133 24 0 10 12 6 0 22 15 0 0 2657:15 AM 8 40 3 1 8 120 21 0 12 10 3 0 8 29 1 0 2647:20 AM 6 33 6 2 3 104 25 0 5 11 3 0 30 37 1 0 266
7:25 AM 7 48 4 1 6 125 24 0 4 11 3 0 11 29 0 0 2737:30 AM 3 62 4 0 1 141 22 0 3 7 2 0 22 33 0 0 3007:35 AM 0 54 3 0 5 166 21 0 9 9 4 0 12 11 1 0 2957:40 AM 4 45 3 0 2 101 26 1 10 20 6 0 26 30 2 0 276
7:45 AM 3 54 7 0 5 131 25 0 2 11 2 0 19 28 2 0 2897:50 AM 5 73 12 0 2 149 31 1 9 14 6 0 12 38 2 0 3547:55 AM 4 48 8 0 1 127 30 0 9 4 3 0 17 30 2 0 283 33428:00 AM 4 90 9 0 5 81 13 0 7 12 3 0 20 36 2 0 282 33998:05 AM 5 66 11 0 5 134 30 0 10 11 4 0 18 22 1 0 317 34648:10 AM 7 57 10 0 4 96 11 1 6 12 5 0 27 36 4 0 276 34758:15 AM 1 60 9 0 5 97 19 1 6 6 6 0 24 35 4 0 273 34848:20 AM 10 61 10 0 7 115 11 0 5 9 2 0 23 36 2 0 291 35098:25 AM 5 70 8 0 2 100 18 0 4 5 4 0 15 36 5 0 272 35088:30 AM 4 50 11 0 5 109 17 0 9 7 6 0 21 18 3 0 260 34688:35 AM 5 53 4 1 5 78 3 0 2 5 1 0 34 23 4 0 218 33918:40 AM 4 63 8 0 4 179 17 0 5 6 3 0 23 15 4 0 331 34468:45 AM 4 32 2 0 7 136 7 1 4 4 6 0 32 20 2 0 257 34148:50 AM 1 51 6 0 10 162 17 0 5 9 6 0 26 11 7 0 311 33718:55 AM 2 51 5 0 2 152 8 0 1 4 5 0 25 15 1 0 271 3359
Peak 15-Min Northbound Southbound Eastbound WestboundTotalFlowrates Left Thru Right U Left Thru Right U Left Thru Right U Left Thru Right U
All Vehicles 48 700 108 0 32 1628 344 4 80 116 44 0 192 384 24 0 3704Heavy Trucks 4 20 0 4 32 16 4 4 0 8 4 4 100Pedestrians 16 4 4 0 24
Bicycles 0 0 0 0 0 0 0 0 0 0 0 0 0Railroad
Stopped Buses
Comments:
Peak-Hour: 7:25 AM -- 8:25 AMPeak 15-Min: 7:45 AM -- 8:00 AM
54 718 90
521463263
80
126
46 231
364
22
862
1778
252
617
824
1741
264
680
0.95
3.7 2.8 3.3
9.62.92.7
3.8
2.4
2.2 2.6
1.4
4.5
2.9
3.1
2.8
1.9
2.9
2.9
4.2
2.1
16
2
4 1
1 1 0
000
1
0
0 0
0
0
NA
NA
NA NA
NA
NA
NA NA
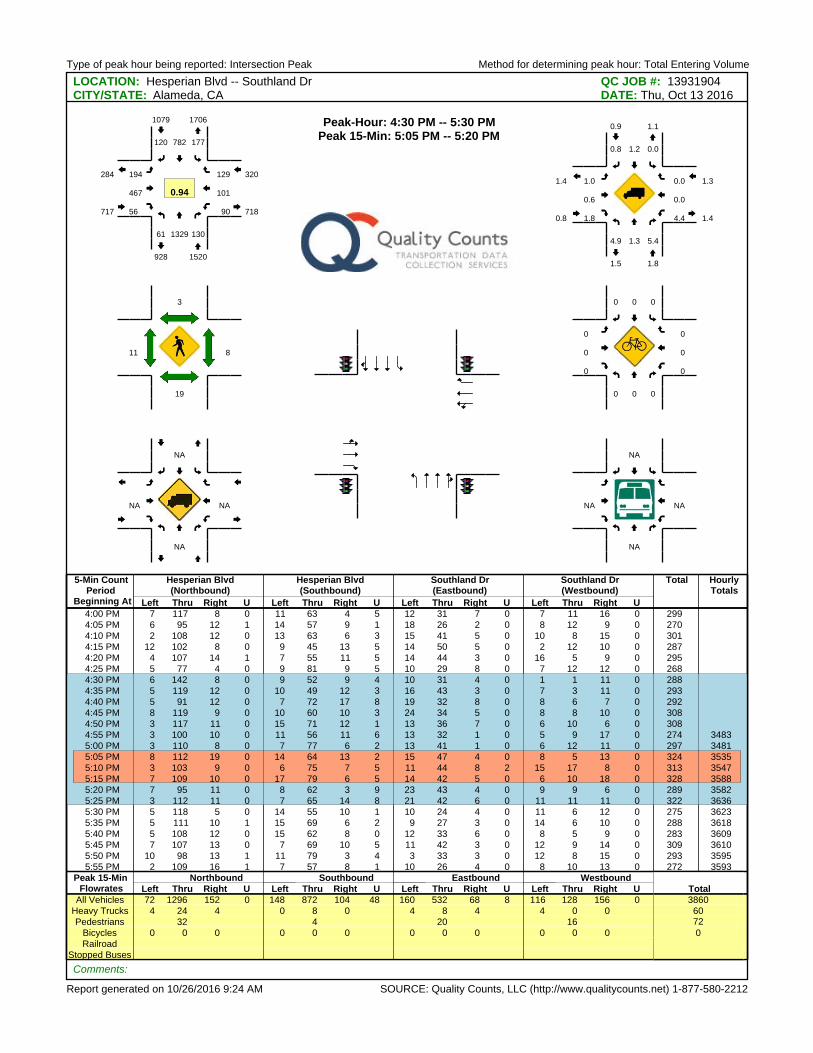
Type of peak hour being reported: Intersection Peak Method for determining peak hour: Total Entering Volume
Report generated on 10/26/2016 9:24 AM SOURCE: Quality Counts, LLC (http://www.qualitycounts.net) 1-877-580-2212
LOCATION: Hesperian Blvd -- Southland Dr QC JOB #: 13931904CITY/STATE: Alameda, CA DATE: Thu, Oct 13 2016
5-Min CountPeriod
Beginning At
Hesperian Blvd(Northbound)
Hesperian Blvd(Southbound)
Southland Dr(Eastbound)
Southland Dr(Westbound)
Total HourlyTotals
Left Thru Right U Left Thru Right U Left Thru Right U Left Thru Right U4:00 PM 7 117 8 0 11 63 4 5 12 31 7 0 7 11 16 0 2994:05 PM 6 95 12 1 14 57 9 1 18 26 2 0 8 12 9 0 2704:10 PM 2 108 12 0 13 63 6 3 15 41 5 0 10 8 15 0 3014:15 PM 12 102 8 0 9 45 13 5 14 50 5 0 2 12 10 0 2874:20 PM 4 107 14 1 7 55 11 5 14 44 3 0 16 5 9 0 2954:25 PM 5 77 4 0 9 81 9 5 10 29 8 0 7 12 12 0 268
4:30 PM 6 142 8 0 9 52 9 4 10 31 4 0 1 1 11 0 2884:35 PM 5 119 12 0 10 49 12 3 16 43 3 0 7 3 11 0 2934:40 PM 5 91 12 0 7 72 17 8 19 32 8 0 8 6 7 0 2924:45 PM 8 119 9 0 10 60 10 3 24 34 5 0 8 8 10 0 3084:50 PM 3 117 11 0 15 71 12 1 13 36 7 0 6 10 6 0 3084:55 PM 3 100 10 0 11 56 11 6 13 32 1 0 5 9 17 0 274 34835:00 PM 3 110 8 0 7 77 6 2 13 41 1 0 6 12 11 0 297 3481
5:05 PM 8 112 19 0 14 64 13 2 15 47 4 0 8 5 13 0 324 35355:10 PM 3 103 9 0 6 75 7 5 11 44 8 2 15 17 8 0 313 35475:15 PM 7 109 10 0 17 79 6 5 14 42 5 0 6 10 18 0 328 35885:20 PM 7 95 11 0 8 62 3 9 23 43 4 0 9 9 6 0 289 35825:25 PM 3 112 11 0 7 65 14 8 21 42 6 0 11 11 11 0 322 36365:30 PM 5 118 5 0 14 55 10 1 10 24 4 0 11 6 12 0 275 36235:35 PM 5 111 10 1 15 69 6 2 9 27 3 0 14 6 10 0 288 36185:40 PM 5 108 12 0 15 62 8 0 12 33 6 0 8 5 9 0 283 36095:45 PM 7 107 13 0 7 69 10 5 11 42 3 0 12 9 14 0 309 36105:50 PM 10 98 13 1 11 79 3 4 3 33 3 0 12 8 15 0 293 35955:55 PM 2 109 16 1 7 57 8 1 10 26 4 0 8 10 13 0 272 3593
Peak 15-Min Northbound Southbound Eastbound WestboundTotalFlowrates Left Thru Right U Left Thru Right U Left Thru Right U Left Thru Right U
All Vehicles 72 1296 152 0 148 872 104 48 160 532 68 8 116 128 156 0 3860Heavy Trucks 4 24 4 0 8 0 4 8 4 4 0 0 60Pedestrians 32 4 20 16 72
Bicycles 0 0 0 0 0 0 0 0 0 0 0 0 0Railroad
Stopped Buses
Comments:
Peak-Hour: 4:30 PM -- 5:30 PMPeak 15-Min: 5:05 PM -- 5:20 PM
61 1329 130
177782120
194
467
56 90
101
129
1520
1079
717
320
1706
928
718
284
0.94
4.9 1.3 5.4
0.01.20.8
1.0
0.6
1.8 4.4
0.0
0.0
1.8
0.9
0.8
1.3
1.1
1.5
1.4
1.4
19
3
11 8
0 0 0
000
0
0
0 0
0
0
NA
NA
NA NA
NA
NA
NA NA
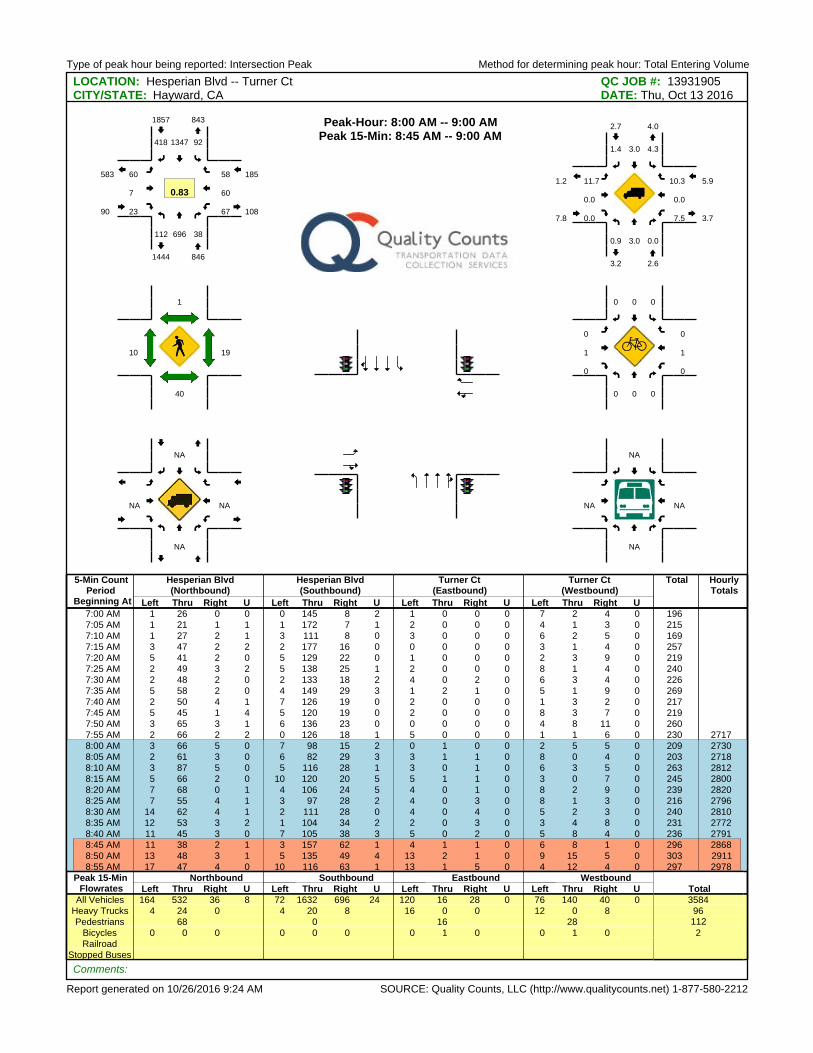
Type of peak hour being reported: Intersection Peak Method for determining peak hour: Total Entering Volume
Report generated on 10/26/2016 9:24 AM SOURCE: Quality Counts, LLC (http://www.qualitycounts.net) 1-877-580-2212
LOCATION: Hesperian Blvd -- Turner Ct QC JOB #: 13931905CITY/STATE: Hayward, CA DATE: Thu, Oct 13 2016
5-Min CountPeriod
Beginning At
Hesperian Blvd(Northbound)
Hesperian Blvd(Southbound)
Turner Ct(Eastbound)
Turner Ct(Westbound)
Total HourlyTotals
Left Thru Right U Left Thru Right U Left Thru Right U Left Thru Right U7:00 AM 1 26 0 0 0 145 8 2 1 0 0 0 7 2 4 0 1967:05 AM 1 21 1 1 1 172 7 1 2 0 0 0 4 1 3 0 2157:10 AM 1 27 2 1 3 111 8 0 3 0 0 0 6 2 5 0 1697:15 AM 3 47 2 2 2 177 16 0 0 0 0 0 3 1 4 0 2577:20 AM 5 41 2 0 5 129 22 0 1 0 0 0 2 3 9 0 2197:25 AM 2 49 3 2 5 138 25 1 2 0 0 0 8 1 4 0 2407:30 AM 2 48 2 0 2 133 18 2 4 0 2 0 6 3 4 0 2267:35 AM 5 58 2 0 4 149 29 3 1 2 1 0 5 1 9 0 2697:40 AM 2 50 4 1 7 126 19 0 2 0 0 0 1 3 2 0 2177:45 AM 5 45 1 4 5 120 19 0 2 0 0 0 8 3 7 0 2197:50 AM 3 65 3 1 6 136 23 0 0 0 0 0 4 8 11 0 2607:55 AM 2 66 2 2 0 126 18 1 5 0 0 0 1 1 6 0 230 2717
8:00 AM 3 66 5 0 7 98 15 2 0 1 0 0 2 5 5 0 209 27308:05 AM 2 61 3 0 6 82 29 3 3 1 1 0 8 0 4 0 203 27188:10 AM 3 87 5 0 5 116 28 1 3 0 1 0 6 3 5 0 263 28128:15 AM 5 66 2 0 10 120 20 5 5 1 1 0 3 0 7 0 245 28008:20 AM 7 68 0 1 4 106 24 5 4 0 1 0 8 2 9 0 239 28208:25 AM 7 55 4 1 3 97 28 2 4 0 3 0 8 1 3 0 216 27968:30 AM 14 62 4 1 2 111 28 0 4 0 4 0 5 2 3 0 240 28108:35 AM 12 53 3 2 1 104 34 2 2 0 3 0 3 4 8 0 231 27728:40 AM 11 45 3 0 7 105 38 3 5 0 2 0 5 8 4 0 236 2791
8:45 AM 11 38 2 1 3 157 62 1 4 1 1 0 6 8 1 0 296 28688:50 AM 13 48 3 1 5 135 49 4 13 2 1 0 9 15 5 0 303 29118:55 AM 17 47 4 0 10 116 63 1 13 1 5 0 4 12 4 0 297 2978
Peak 15-Min Northbound Southbound Eastbound WestboundTotalFlowrates Left Thru Right U Left Thru Right U Left Thru Right U Left Thru Right U
All Vehicles 164 532 36 8 72 1632 696 24 120 16 28 0 76 140 40 0 3584Heavy Trucks 4 24 0 4 20 8 16 0 0 12 0 8 96Pedestrians 68 0 16 28 112
Bicycles 0 0 0 0 0 0 0 1 0 0 1 0 2Railroad
Stopped Buses
Comments:
Peak-Hour: 8:00 AM -- 9:00 AMPeak 15-Min: 8:45 AM -- 9:00 AM
112 696 38
921347418
60
7
23 67
60
58
846
1857
90
185
843
1444
108
583
0.83
0.9 3.0 0.0
4.33.01.4
11.7
0.0
0.0 7.5
0.0
10.3
2.6
2.7
7.8
5.9
4.0
3.2
3.7
1.2
40
1
10 19
0 0 0
000
0
1
0 0
1
0
NA
NA
NA NA
NA
NA
NA NA
Type of peak hour being reported: Intersection Peak Method for determining peak hour: Total Entering Volume
Report generated on 10/26/2016 9:24 AM SOURCE: Quality Counts, LLC (http://www.qualitycounts.net) 1-877-580-2212
LOCATION: Hesperian Blvd -- Turner Ct QC JOB #: 13931906CITY/STATE: Hayward, CA DATE: Thu, Oct 13 2016
5-Min CountPeriod
Beginning At
Hesperian Blvd(Northbound)
Hesperian Blvd(Southbound)
Turner Ct(Eastbound)
Turner Ct(Westbound)
Total HourlyTotals
Left Thru Right U Left Thru Right U Left Thru Right U Left Thru Right U4:00 PM 1 93 3 2 6 75 3 1 11 0 8 0 1 2 3 0 2094:05 PM 6 123 8 3 9 56 10 1 9 4 2 0 4 2 7 0 2444:10 PM 3 110 3 3 10 79 10 2 7 2 5 0 2 2 4 0 2424:15 PM 3 136 6 1 3 72 9 1 6 0 5 0 3 0 5 0 2504:20 PM 7 100 6 1 4 74 7 1 12 5 4 0 4 0 4 0 2294:25 PM 3 103 3 0 7 83 8 1 8 3 2 0 3 0 6 0 2304:30 PM 5 116 3 0 7 48 10 2 9 0 0 0 5 1 6 0 2124:35 PM 5 107 5 1 3 51 18 0 16 2 1 0 4 2 10 0 2254:40 PM 4 98 5 2 6 62 11 1 5 1 0 0 4 0 7 0 2064:45 PM 11 114 2 0 6 74 11 2 18 4 5 0 4 1 5 0 2574:50 PM 1 129 9 0 8 65 11 1 11 6 9 0 1 3 7 0 2614:55 PM 2 96 4 1 9 74 12 1 9 3 3 0 0 0 3 0 217 2782
5:00 PM 4 145 9 2 6 70 5 1 17 0 4 0 9 0 6 0 278 28515:05 PM 4 106 4 1 9 73 8 6 14 1 2 0 3 4 7 0 242 28495:10 PM 3 124 3 0 6 91 6 1 17 3 6 0 11 0 10 0 281 28885:15 PM 3 98 7 0 6 67 7 7 8 3 4 0 8 1 3 0 222 28605:20 PM 3 120 3 1 6 71 11 6 9 1 2 0 3 1 5 0 242 28735:25 PM 6 127 6 1 7 52 7 1 11 3 2 0 2 1 2 0 228 28715:30 PM 1 118 4 0 8 83 15 2 11 2 5 0 0 1 5 0 255 29145:35 PM 4 124 4 1 4 81 12 0 11 2 2 0 3 2 1 0 251 29405:40 PM 5 147 5 0 4 72 10 2 6 0 1 0 5 1 10 0 268 30025:45 PM 6 137 1 0 6 58 4 0 16 3 3 0 8 3 6 0 251 29965:50 PM 4 109 5 2 10 75 12 0 14 5 8 0 2 2 3 0 251 29865:55 PM 9 123 2 0 6 72 14 0 9 2 6 0 2 0 2 0 247 3016
Peak 15-Min Northbound Southbound Eastbound WestboundTotalFlowrates Left Thru Right U Left Thru Right U Left Thru Right U Left Thru Right U
All Vehicles 44 1500 64 12 84 936 76 32 192 16 48 0 92 16 92 0 3204Heavy Trucks 0 28 0 0 8 8 12 0 0 0 0 8 64Pedestrians 32 4 16 24 76
Bicycles 0 0 0 0 0 0 0 0 0 0 0 0 0Railroad
Stopped Buses
Comments:
Peak-Hour: 5:00 PM -- 6:00 PMPeak 15-Min: 5:00 PM -- 5:15 PM
60 1478 53
104865111
143
25
45 56
16
60
1591
1080
213
132
1707
974
156
179
0.94
0.0 1.1 0.0
0.01.63.6
4.2
0.0
0.0 0.0
0.0
3.3
1.0
1.7
2.8
1.5
1.4
1.4
0.0
2.2
26
8
17 16
0 0 0
000
0
0
0 0
0
0
NA
NA
NA NA
NA
NA
NA NA
Type of peak hour being reported: Intersection Peak Method for determining peak hour: Total Entering Volume
Report generated on 10/26/2016 9:24 AM SOURCE: Quality Counts, LLC (http://www.qualitycounts.net) 1-877-580-2212
LOCATION: Hesperian Blvd -- Chabot Ct QC JOB #: 13931907CITY/STATE: Hayward, CA DATE: Thu, Oct 13 2016
5-Min CountPeriod
Beginning At
Hesperian Blvd(Northbound)
Hesperian Blvd(Southbound)
Chabot Ct (Eastbound)
Chabot Ct (Westbound)
Total HourlyTotals
Left Thru Right U Left Thru Right U Left Thru Right U Left Thru Right U7:00 AM 0 28 0 0 0 168 0 0 0 0 0 0 0 0 1 0 1977:05 AM 0 24 1 0 2 151 0 0 0 0 0 0 0 0 0 0 1787:10 AM 0 34 1 0 1 134 0 0 0 0 0 0 0 0 1 0 1717:15 AM 0 50 4 0 0 161 0 0 0 0 0 0 0 0 0 0 2157:20 AM 0 44 1 0 0 107 0 1 0 0 0 0 0 0 1 0 154
7:25 AM 0 58 1 0 1 174 0 0 0 0 0 0 0 0 1 0 2357:30 AM 0 53 2 0 0 140 0 0 0 0 0 0 0 0 0 0 1957:35 AM 0 57 0 0 0 121 0 1 0 0 0 0 0 0 0 0 1797:40 AM 0 59 2 0 4 141 0 1 0 0 0 0 0 0 0 0 2077:45 AM 0 54 3 0 1 137 0 1 0 0 0 0 0 0 1 0 1977:50 AM 0 71 3 0 4 121 0 0 0 0 0 0 0 0 0 0 1997:55 AM 0 67 2 0 0 122 0 1 0 0 0 0 0 0 0 0 192 23198:00 AM 0 72 3 0 1 114 0 1 0 0 0 0 0 0 0 0 191 23138:05 AM 0 86 0 0 2 90 0 1 0 0 0 0 0 0 0 0 179 23148:10 AM 0 84 2 1 0 116 0 0 0 0 0 0 1 0 0 0 204 23478:15 AM 0 68 5 0 0 120 0 0 0 0 0 0 0 0 0 0 193 23258:20 AM 0 74 1 0 1 124 0 1 0 0 0 0 0 0 2 0 203 23748:25 AM 0 69 1 1 3 111 0 0 0 0 0 0 0 0 1 0 186 23258:30 AM 0 73 2 0 4 84 0 0 0 0 0 0 1 0 1 0 165 22958:35 AM 0 64 0 0 1 128 0 0 0 0 0 0 2 0 1 0 196 23128:40 AM 0 64 3 0 2 126 0 0 0 0 0 0 1 0 2 0 198 23038:45 AM 0 46 3 1 0 135 0 0 0 0 0 0 0 0 1 0 186 22928:50 AM 0 62 1 0 0 132 0 0 0 0 0 0 0 0 0 0 195 22888:55 AM 0 72 1 0 5 133 0 0 0 0 0 0 0 0 0 0 211 2307
Peak 15-Min Northbound Southbound Eastbound WestboundTotalFlowrates Left Thru Right U Left Thru Right U Left Thru Right U Left Thru Right U
All Vehicles 0 672 12 0 4 1740 0 4 0 0 0 0 0 0 4 0 2436Heavy Trucks 0 32 0 0 48 0 0 0 0 0 0 0 80Pedestrians 0 8 4 8 20
Bicycles 0 0 0 0 0 0 0 0 0 0 0 0 0Railroad
Stopped Buses
Comments:
Peak-Hour: 7:25 AM -- 8:25 AMPeak 15-Min: 7:25 AM -- 7:40 AM
1 803 24
2115200
0
0
0 1
0
4
828
1541
0
5
814
1522
38
0
0.97
0.0 1.9 0.0
0.03.60.0
0.0
0.0
0.0 0.0
0.0
0.0
1.8
3.5
0.0
0.0
1.8
3.5
0.0
0.0
3
4
12 10
0 0 0
000
0
0
0 0
0
0
NA
NA
NA NA
NA
NA
NA NA
Type of peak hour being reported: Intersection Peak Method for determining peak hour: Total Entering Volume
Report generated on 10/26/2016 9:24 AM SOURCE: Quality Counts, LLC (http://www.qualitycounts.net) 1-877-580-2212
LOCATION: Hesperian Blvd -- Chabot Ct QC JOB #: 13931908CITY/STATE: Hayward, CA DATE: Thu, Oct 13 2016
5-Min CountPeriod
Beginning At
Hesperian Blvd(Northbound)
Hesperian Blvd(Southbound)
Chabot Ct (Eastbound)
Chabot Ct (Westbound)
Total HourlyTotals
Left Thru Right U Left Thru Right U Left Thru Right U Left Thru Right U4:00 PM 0 115 5 1 2 79 0 1 0 0 0 0 0 0 0 0 2034:05 PM 0 139 4 1 1 60 0 0 0 0 0 0 0 0 4 0 2094:10 PM 0 109 6 0 3 76 0 0 0 0 0 0 0 0 2 0 1964:15 PM 0 136 2 1 1 69 0 0 0 0 0 0 2 0 6 0 2174:20 PM 0 108 11 0 2 71 0 0 0 0 0 0 0 0 2 0 1944:25 PM 0 107 6 1 1 111 0 0 0 0 0 0 2 0 1 0 2294:30 PM 0 129 6 0 2 55 0 0 0 0 0 0 4 0 2 0 1984:35 PM 0 117 6 0 0 58 0 1 0 0 0 0 0 0 3 0 1854:40 PM 0 105 2 0 2 65 0 1 0 0 0 0 1 0 4 0 1804:45 PM 0 134 2 0 1 80 0 0 0 0 0 0 1 0 3 0 2214:50 PM 0 119 5 0 0 56 0 0 0 0 0 0 2 0 2 0 1844:55 PM 0 104 4 0 1 72 0 1 0 0 0 0 2 0 2 0 186 2402
5:00 PM 0 143 3 0 0 97 0 0 0 0 0 0 1 0 1 0 245 24445:05 PM 0 115 1 0 0 69 0 0 0 0 0 0 0 0 2 0 187 24225:10 PM 0 131 4 0 2 119 0 0 0 0 0 0 0 0 3 0 259 24855:15 PM 0 116 2 0 1 84 0 1 0 0 0 0 0 0 1 0 205 24735:20 PM 0 138 3 0 2 76 0 1 0 0 0 0 2 0 1 0 223 25025:25 PM 0 142 3 0 1 54 0 1 0 0 0 0 0 0 1 0 202 24755:30 PM 0 135 3 0 1 78 0 1 0 0 0 0 1 0 1 0 220 24975:35 PM 0 125 1 0 2 74 0 1 0 0 0 0 2 0 1 0 206 25185:40 PM 0 137 2 0 0 80 0 0 0 0 0 0 1 0 3 0 223 25615:45 PM 0 144 4 0 2 80 0 0 0 0 0 0 1 0 3 0 234 25745:50 PM 0 126 5 0 4 77 0 0 0 0 0 0 3 0 2 0 217 26075:55 PM 0 142 1 0 2 90 0 0 0 0 0 0 1 0 0 0 236 2657
Peak 15-Min Northbound Southbound Eastbound WestboundTotalFlowrates Left Thru Right U Left Thru Right U Left Thru Right U Left Thru Right U
All Vehicles 0 1556 32 0 8 1140 0 0 0 0 0 0 4 0 24 0 2764Heavy Trucks 0 24 0 0 4 0 0 0 0 0 0 4 32Pedestrians 0 8 20 4 32
Bicycles 0 0 0 0 0 0 0 0 0 0 0 0 0Railroad
Stopped Buses
Comments:
Peak-Hour: 5:00 PM -- 6:00 PMPeak 15-Min: 5:00 PM -- 5:15 PM
0 1594 32
229780
0
0
0 12
0
19
1626
1000
0
31
1618
990
49
0
0.96
0.0 0.9 0.0
0.01.40.0
0.0
0.0
0.0 0.0
0.0
5.3
0.9
1.4
0.0
3.2
1.0
1.4
0.0
0.0
4
3
21 15
0 0 0
010
0
0
0 0
0
0
NA
NA
NA NA
NA
NA
NA NA
Type of peak hour being reported: Intersection Peak Method for determining peak hour: Total Entering Volume
Report generated on 10/26/2016 9:24 AM SOURCE: Quality Counts, LLC (http://www.qualitycounts.net) 1-877-580-2212
LOCATION: Hesperian Blvd -- Chabot College Dwy QC JOB #: 13931909CITY/STATE: Hayward, CA DATE: Thu, Oct 13 2016
5-Min CountPeriod
Beginning At
Hesperian Blvd(Northbound)
Hesperian Blvd(Southbound)
Chabot College Dwy(Eastbound)
Chabot College Dwy(Westbound)
Total HourlyTotals
Left Thru Right U Left Thru Right U Left Thru Right U Left Thru Right U7:00 AM 1 28 0 0 0 134 3 1 1 0 1 0 0 0 0 0 1697:05 AM 2 24 0 0 0 148 0 0 0 0 2 0 0 0 0 0 1767:10 AM 2 35 0 1 0 147 10 0 4 0 0 0 0 0 0 0 1997:15 AM 9 46 0 0 0 141 10 0 1 0 2 0 0 0 0 0 2097:20 AM 4 50 0 0 0 128 8 0 2 0 6 0 0 0 0 0 1987:25 AM 11 48 0 0 0 125 12 0 7 0 5 0 0 0 0 0 2087:30 AM 16 49 0 1 0 110 5 0 2 0 3 0 0 0 0 0 1867:35 AM 2 54 0 0 0 96 10 0 2 0 4 0 0 0 0 0 1687:40 AM 2 60 0 0 0 130 14 0 1 0 2 0 0 0 0 0 2097:45 AM 6 47 0 0 0 98 11 1 4 0 1 0 0 0 0 0 1687:50 AM 6 75 0 0 0 108 12 0 2 0 2 0 0 0 0 0 2057:55 AM 6 66 0 1 0 151 10 0 4 0 4 0 0 0 0 0 242 2337
8:00 AM 9 72 0 0 0 93 9 1 1 0 4 0 0 0 0 0 189 23578:05 AM 1 73 0 1 0 94 19 0 2 0 4 0 0 0 0 0 194 23758:10 AM 6 87 0 0 0 113 5 0 6 0 1 0 0 0 0 0 218 23948:15 AM 13 66 0 0 0 112 18 3 2 0 8 0 0 0 0 0 222 24078:20 AM 11 79 0 0 0 109 29 0 1 0 5 0 0 0 0 0 234 24438:25 AM 11 65 0 1 0 101 17 1 3 0 9 0 0 0 0 0 208 24438:30 AM 11 69 0 1 0 82 20 0 8 0 13 0 0 0 0 0 204 24618:35 AM 23 59 0 0 0 102 25 0 5 0 6 0 0 0 0 0 220 25138:40 AM 25 56 0 0 0 87 15 1 5 0 15 0 0 0 0 0 204 2508
8:45 AM 14 56 0 0 0 123 29 0 6 0 8 0 0 0 0 0 236 25768:50 AM 28 52 0 1 0 91 35 4 9 0 7 0 0 0 0 0 227 25988:55 AM 17 61 0 1 0 104 45 1 15 0 10 0 0 0 0 0 254 2610
Peak 15-Min Northbound Southbound Eastbound WestboundTotalFlowrates Left Thru Right U Left Thru Right U Left Thru Right U Left Thru Right U
All Vehicles 236 676 0 8 0 1272 436 20 120 0 100 0 0 0 0 0 2868Heavy Trucks 12 28 0 0 20 0 0 0 0 0 0 0 60Pedestrians 8 0 0 8 16
Bicycles 0 0 0 0 0 0 0 0 1 0 0 0 1Railroad
Stopped Buses
Comments:
Peak-Hour: 8:00 AM -- 9:00 AMPeak 15-Min: 8:45 AM -- 9:00 AM
174 795 0
111211266
63
0
90 0
0
0
969
1488
153
0
869
1306
0
435
0.91
3.4 2.6 0.0
0.03.70.0
0.0
0.0
5.6 0.0
0.0
0.0
2.8
3.0
3.3
0.0
2.4
3.8
0.0
1.4
4
0
1 5
0 0 0
000
0
0
1 0
0
0
NA
NA
NA NA
NA
NA
NA NA
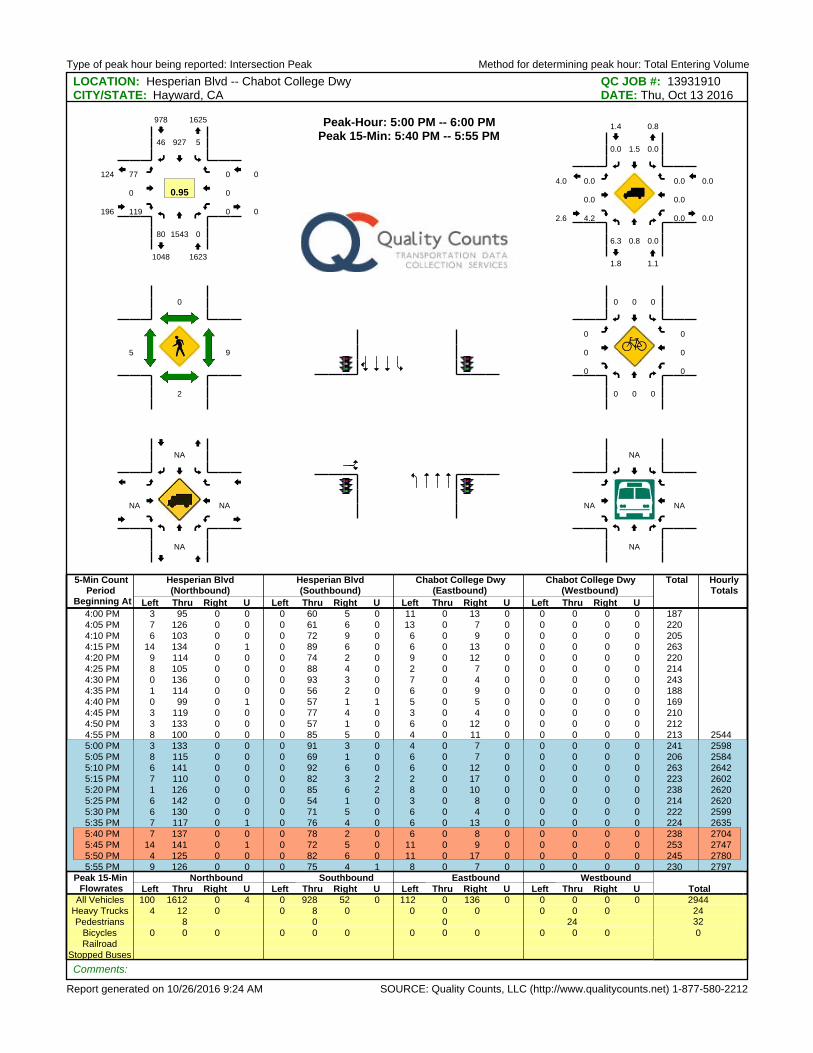
Type of peak hour being reported: Intersection Peak Method for determining peak hour: Total Entering Volume
Report generated on 10/26/2016 9:24 AM SOURCE: Quality Counts, LLC (http://www.qualitycounts.net) 1-877-580-2212
LOCATION: Hesperian Blvd -- Chabot College Dwy QC JOB #: 13931910CITY/STATE: Hayward, CA DATE: Thu, Oct 13 2016
5-Min CountPeriod
Beginning At
Hesperian Blvd(Northbound)
Hesperian Blvd(Southbound)
Chabot College Dwy(Eastbound)
Chabot College Dwy(Westbound)
Total HourlyTotals
Left Thru Right U Left Thru Right U Left Thru Right U Left Thru Right U4:00 PM 3 95 0 0 0 60 5 0 11 0 13 0 0 0 0 0 1874:05 PM 7 126 0 0 0 61 6 0 13 0 7 0 0 0 0 0 2204:10 PM 6 103 0 0 0 72 9 0 6 0 9 0 0 0 0 0 2054:15 PM 14 134 0 1 0 89 6 0 6 0 13 0 0 0 0 0 2634:20 PM 9 114 0 0 0 74 2 0 9 0 12 0 0 0 0 0 2204:25 PM 8 105 0 0 0 88 4 0 2 0 7 0 0 0 0 0 2144:30 PM 0 136 0 0 0 93 3 0 7 0 4 0 0 0 0 0 2434:35 PM 1 114 0 0 0 56 2 0 6 0 9 0 0 0 0 0 1884:40 PM 0 99 0 1 0 57 1 1 5 0 5 0 0 0 0 0 1694:45 PM 3 119 0 0 0 77 4 0 3 0 4 0 0 0 0 0 2104:50 PM 3 133 0 0 0 57 1 0 6 0 12 0 0 0 0 0 2124:55 PM 8 100 0 0 0 85 5 0 4 0 11 0 0 0 0 0 213 2544
5:00 PM 3 133 0 0 0 91 3 0 4 0 7 0 0 0 0 0 241 25985:05 PM 8 115 0 0 0 69 1 0 6 0 7 0 0 0 0 0 206 25845:10 PM 6 141 0 0 0 92 6 0 6 0 12 0 0 0 0 0 263 26425:15 PM 7 110 0 0 0 82 3 2 2 0 17 0 0 0 0 0 223 26025:20 PM 1 126 0 0 0 85 6 2 8 0 10 0 0 0 0 0 238 26205:25 PM 6 142 0 0 0 54 1 0 3 0 8 0 0 0 0 0 214 26205:30 PM 6 130 0 0 0 71 5 0 6 0 4 0 0 0 0 0 222 25995:35 PM 7 117 0 1 0 76 4 0 6 0 13 0 0 0 0 0 224 2635
5:40 PM 7 137 0 0 0 78 2 0 6 0 8 0 0 0 0 0 238 27045:45 PM 14 141 0 1 0 72 5 0 11 0 9 0 0 0 0 0 253 27475:50 PM 4 125 0 0 0 82 6 0 11 0 17 0 0 0 0 0 245 27805:55 PM 9 126 0 0 0 75 4 1 8 0 7 0 0 0 0 0 230 2797
Peak 15-Min Northbound Southbound Eastbound WestboundTotalFlowrates Left Thru Right U Left Thru Right U Left Thru Right U Left Thru Right U
All Vehicles 100 1612 0 4 0 928 52 0 112 0 136 0 0 0 0 0 2944Heavy Trucks 4 12 0 0 8 0 0 0 0 0 0 0 24Pedestrians 8 0 0 24 32
Bicycles 0 0 0 0 0 0 0 0 0 0 0 0 0Railroad
Stopped Buses
Comments:
Peak-Hour: 5:00 PM -- 6:00 PMPeak 15-Min: 5:40 PM -- 5:55 PM
80 1543 0
592746
77
0
119 0
0
0
1623
978
196
0
1625
1048
0
124
0.95
6.3 0.8 0.0
0.01.50.0
0.0
0.0
4.2 0.0
0.0
0.0
1.1
1.4
2.6
0.0
0.8
1.8
0.0
4.0
2
0
5 9
0 0 0
000
0
0
0 0
0
0
NA
NA
NA NA
NA
NA
NA NA
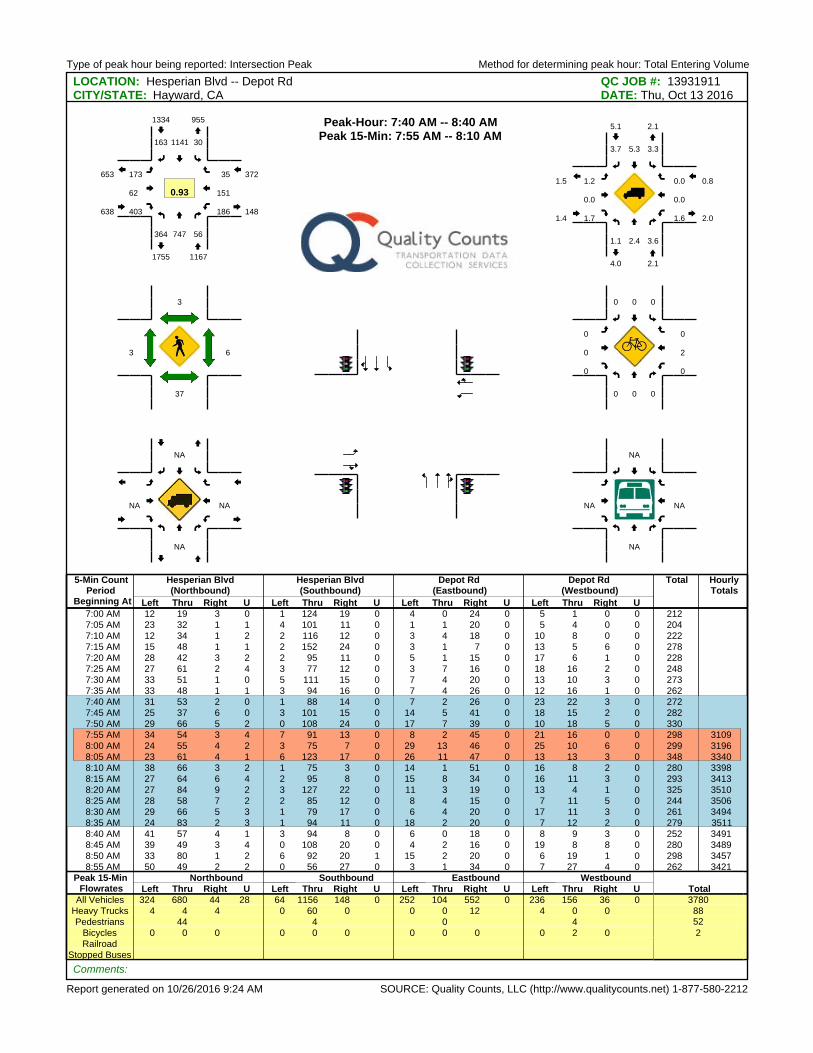
Type of peak hour being reported: Intersection Peak Method for determining peak hour: Total Entering Volume
Report generated on 10/26/2016 9:24 AM SOURCE: Quality Counts, LLC (http://www.qualitycounts.net) 1-877-580-2212
LOCATION: Hesperian Blvd -- Depot Rd QC JOB #: 13931911CITY/STATE: Hayward, CA DATE: Thu, Oct 13 2016
5-Min CountPeriod
Beginning At
Hesperian Blvd(Northbound)
Hesperian Blvd(Southbound)
Depot Rd(Eastbound)
Depot Rd(Westbound)
Total HourlyTotals
Left Thru Right U Left Thru Right U Left Thru Right U Left Thru Right U7:00 AM 12 19 3 0 1 124 19 0 4 0 24 0 5 1 0 0 2127:05 AM 23 32 1 1 4 101 11 0 1 1 20 0 5 4 0 0 2047:10 AM 12 34 1 2 2 116 12 0 3 4 18 0 10 8 0 0 2227:15 AM 15 48 1 1 2 152 24 0 3 1 7 0 13 5 6 0 2787:20 AM 28 42 3 2 2 95 11 0 5 1 15 0 17 6 1 0 2287:25 AM 27 61 2 4 3 77 12 0 3 7 16 0 18 16 2 0 2487:30 AM 33 51 1 0 5 111 15 0 7 4 20 0 13 10 3 0 2737:35 AM 33 48 1 1 3 94 16 0 7 4 26 0 12 16 1 0 262
7:40 AM 31 53 2 0 1 88 14 0 7 2 26 0 23 22 3 0 2727:45 AM 25 37 6 0 3 101 15 0 14 5 41 0 18 15 2 0 2827:50 AM 29 66 5 2 0 108 24 0 17 7 39 0 10 18 5 0 330
7:55 AM 34 54 3 4 7 91 13 0 8 2 45 0 21 16 0 0 298 31098:00 AM 24 55 4 2 3 75 7 0 29 13 46 0 25 10 6 0 299 31968:05 AM 23 61 4 1 6 123 17 0 26 11 47 0 13 13 3 0 348 33408:10 AM 38 66 3 2 1 75 3 0 14 1 51 0 16 8 2 0 280 33988:15 AM 27 64 6 4 2 95 8 0 15 8 34 0 16 11 3 0 293 34138:20 AM 27 84 9 2 3 127 22 0 11 3 19 0 13 4 1 0 325 35108:25 AM 28 58 7 2 2 85 12 0 8 4 15 0 7 11 5 0 244 35068:30 AM 29 66 5 3 1 79 17 0 6 4 20 0 17 11 3 0 261 34948:35 AM 24 83 2 3 1 94 11 0 18 2 20 0 7 12 2 0 279 35118:40 AM 41 57 4 1 3 94 8 0 6 0 18 0 8 9 3 0 252 34918:45 AM 39 49 3 4 0 108 20 0 4 2 16 0 19 8 8 0 280 34898:50 AM 33 80 1 2 6 92 20 1 15 2 20 0 6 19 1 0 298 34578:55 AM 50 49 2 2 0 56 27 0 3 1 34 0 7 27 4 0 262 3421
Peak 15-Min Northbound Southbound Eastbound WestboundTotalFlowrates Left Thru Right U Left Thru Right U Left Thru Right U Left Thru Right U
All Vehicles 324 680 44 28 64 1156 148 0 252 104 552 0 236 156 36 0 3780Heavy Trucks 4 4 4 0 60 0 0 0 12 4 0 0 88Pedestrians 44 4 0 4 52
Bicycles 0 0 0 0 0 0 0 0 0 0 2 0 2Railroad
Stopped Buses
Comments:
Peak-Hour: 7:40 AM -- 8:40 AMPeak 15-Min: 7:55 AM -- 8:10 AM
364 747 56
301141163
173
62
403 186
151
35
1167
1334
638
372
955
1755
148
653
0.93
1.1 2.4 3.6
3.35.33.7
1.2
0.0
1.7 1.6
0.0
0.0
2.1
5.1
1.4
0.8
2.1
4.0
2.0
1.5
37
3
3 6
0 0 0
000
0
0
0 0
2
0
NA
NA
NA NA
NA
NA
NA NA
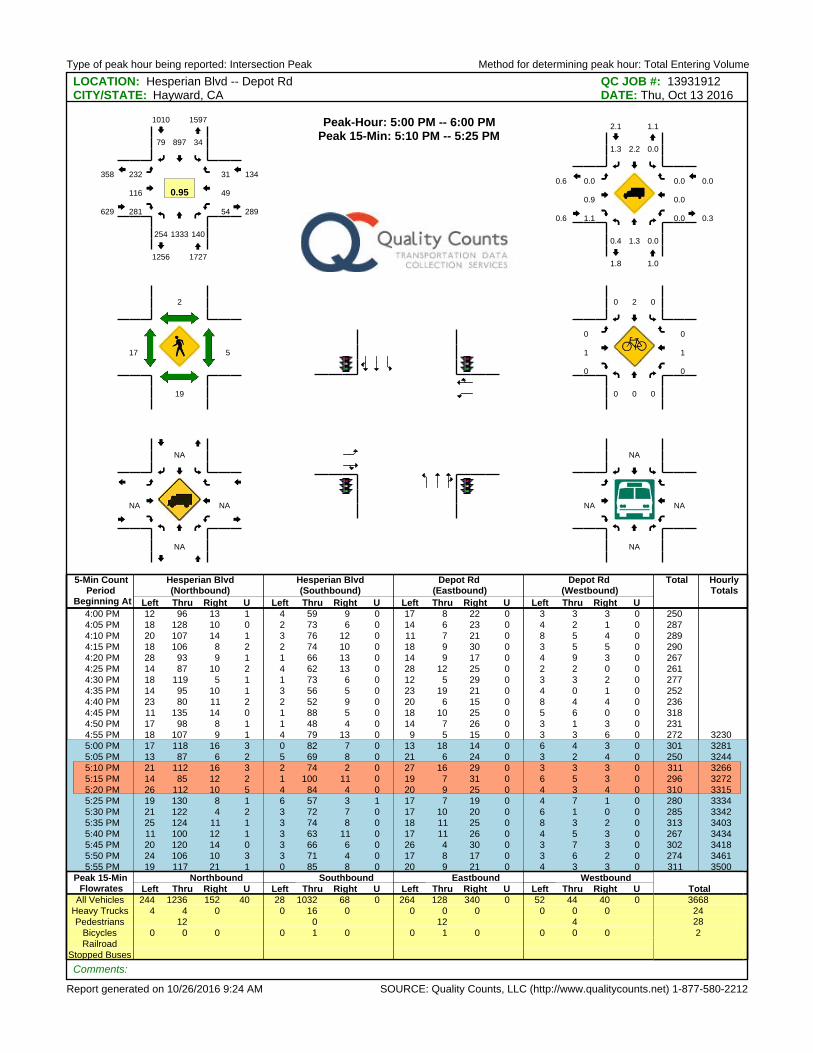
Type of peak hour being reported: Intersection Peak Method for determining peak hour: Total Entering Volume
Report generated on 10/26/2016 9:24 AM SOURCE: Quality Counts, LLC (http://www.qualitycounts.net) 1-877-580-2212
LOCATION: Hesperian Blvd -- Depot Rd QC JOB #: 13931912CITY/STATE: Hayward, CA DATE: Thu, Oct 13 2016
5-Min CountPeriod
Beginning At
Hesperian Blvd(Northbound)
Hesperian Blvd(Southbound)
Depot Rd(Eastbound)
Depot Rd(Westbound)
Total HourlyTotals
Left Thru Right U Left Thru Right U Left Thru Right U Left Thru Right U4:00 PM 12 96 13 1 4 59 9 0 17 8 22 0 3 3 3 0 2504:05 PM 18 128 10 0 2 73 6 0 14 6 23 0 4 2 1 0 2874:10 PM 20 107 14 1 3 76 12 0 11 7 21 0 8 5 4 0 2894:15 PM 18 106 8 2 2 74 10 0 18 9 30 0 3 5 5 0 2904:20 PM 28 93 9 1 1 66 13 0 14 9 17 0 4 9 3 0 2674:25 PM 14 87 10 2 4 62 13 0 28 12 25 0 2 2 0 0 2614:30 PM 18 119 5 1 1 73 6 0 12 5 29 0 3 3 2 0 2774:35 PM 14 95 10 1 3 56 5 0 23 19 21 0 4 0 1 0 2524:40 PM 23 80 11 2 2 52 9 0 20 6 15 0 8 4 4 0 2364:45 PM 11 135 14 0 1 88 5 0 18 10 25 0 5 6 0 0 3184:50 PM 17 98 8 1 1 48 4 0 14 7 26 0 3 1 3 0 2314:55 PM 18 107 9 1 4 79 13 0 9 5 15 0 3 3 6 0 272 3230
5:00 PM 17 118 16 3 0 82 7 0 13 18 14 0 6 4 3 0 301 32815:05 PM 13 87 6 2 5 69 8 0 21 6 24 0 3 2 4 0 250 3244
5:10 PM 21 112 16 3 2 74 2 0 27 16 29 0 3 3 3 0 311 32665:15 PM 14 85 12 2 1 100 11 0 19 7 31 0 6 5 3 0 296 32725:20 PM 26 112 10 5 4 84 4 0 20 9 25 0 4 3 4 0 310 33155:25 PM 19 130 8 1 6 57 3 1 17 7 19 0 4 7 1 0 280 33345:30 PM 21 122 4 2 3 72 7 0 17 10 20 0 6 1 0 0 285 33425:35 PM 25 124 11 1 3 74 8 0 18 11 25 0 8 3 2 0 313 34035:40 PM 11 100 12 1 3 63 11 0 17 11 26 0 4 5 3 0 267 34345:45 PM 20 120 14 0 3 66 6 0 26 4 30 0 3 7 3 0 302 34185:50 PM 24 106 10 3 3 71 4 0 17 8 17 0 3 6 2 0 274 34615:55 PM 19 117 21 1 0 85 8 0 20 9 21 0 4 3 3 0 311 3500
Peak 15-Min Northbound Southbound Eastbound WestboundTotalFlowrates Left Thru Right U Left Thru Right U Left Thru Right U Left Thru Right U
All Vehicles 244 1236 152 40 28 1032 68 0 264 128 340 0 52 44 40 0 3668Heavy Trucks 4 4 0 0 16 0 0 0 0 0 0 0 24Pedestrians 12 0 12 4 28
Bicycles 0 0 0 0 1 0 0 1 0 0 0 0 2Railroad
Stopped Buses
Comments:
Peak-Hour: 5:00 PM -- 6:00 PMPeak 15-Min: 5:10 PM -- 5:25 PM
254 1333 140
3489779
232
116
281 54
49
31
1727
1010
629
134
1597
1256
289
358
0.95
0.4 1.3 0.0
0.02.21.3
0.0
0.9
1.1 0.0
0.0
0.0
1.0
2.1
0.6
0.0
1.1
1.8
0.3
0.6
19
2
17 5
0 0 0
020
0
1
0 0
1
0
NA
NA
NA NA
NA
NA
NA NA
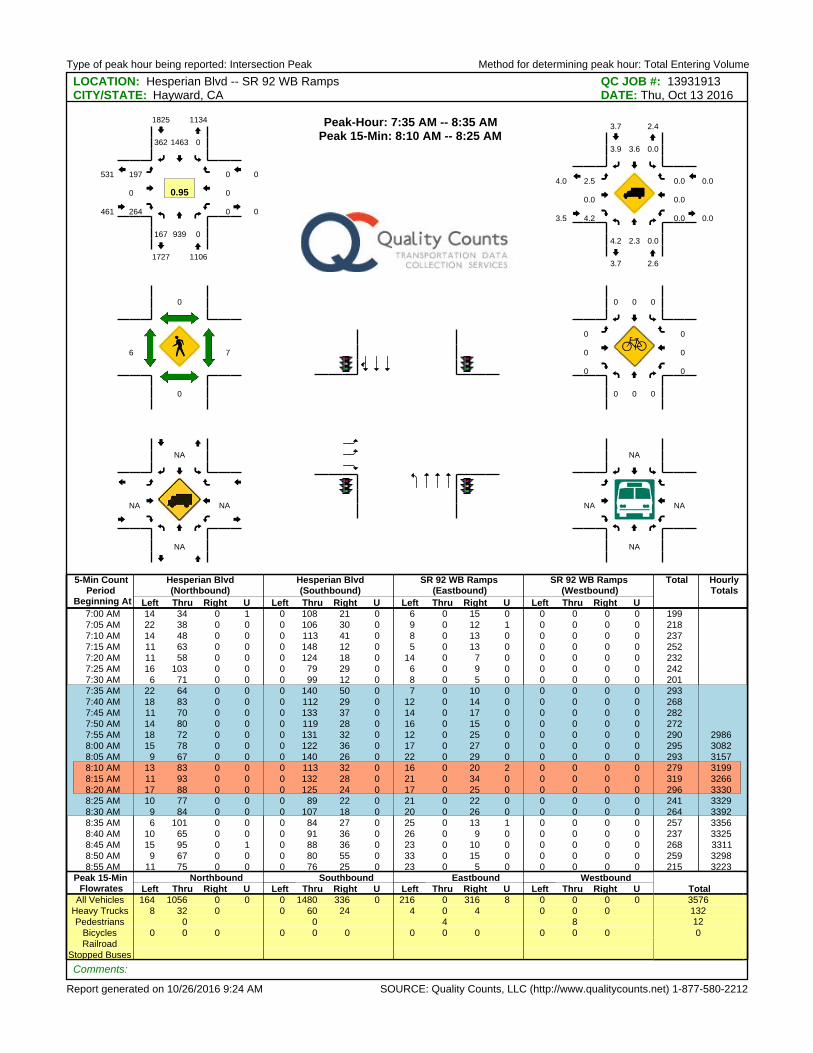
Type of peak hour being reported: Intersection Peak Method for determining peak hour: Total Entering Volume
Report generated on 10/26/2016 9:24 AM SOURCE: Quality Counts, LLC (http://www.qualitycounts.net) 1-877-580-2212
LOCATION: Hesperian Blvd -- SR 92 WB Ramps QC JOB #: 13931913CITY/STATE: Hayward, CA DATE: Thu, Oct 13 2016
5-Min CountPeriod
Beginning At
Hesperian Blvd(Northbound)
Hesperian Blvd(Southbound)
SR 92 WB Ramps(Eastbound)
SR 92 WB Ramps(Westbound)
Total HourlyTotals
Left Thru Right U Left Thru Right U Left Thru Right U Left Thru Right U7:00 AM 14 34 0 1 0 108 21 0 6 0 15 0 0 0 0 0 1997:05 AM 22 38 0 0 0 106 30 0 9 0 12 1 0 0 0 0 2187:10 AM 14 48 0 0 0 113 41 0 8 0 13 0 0 0 0 0 2377:15 AM 11 63 0 0 0 148 12 0 5 0 13 0 0 0 0 0 2527:20 AM 11 58 0 0 0 124 18 0 14 0 7 0 0 0 0 0 2327:25 AM 16 103 0 0 0 79 29 0 6 0 9 0 0 0 0 0 2427:30 AM 6 71 0 0 0 99 12 0 8 0 5 0 0 0 0 0 201
7:35 AM 22 64 0 0 0 140 50 0 7 0 10 0 0 0 0 0 2937:40 AM 18 83 0 0 0 112 29 0 12 0 14 0 0 0 0 0 2687:45 AM 11 70 0 0 0 133 37 0 14 0 17 0 0 0 0 0 2827:50 AM 14 80 0 0 0 119 28 0 16 0 15 0 0 0 0 0 2727:55 AM 18 72 0 0 0 131 32 0 12 0 25 0 0 0 0 0 290 29868:00 AM 15 78 0 0 0 122 36 0 17 0 27 0 0 0 0 0 295 30828:05 AM 9 67 0 0 0 140 26 0 22 0 29 0 0 0 0 0 293 3157
8:10 AM 13 83 0 0 0 113 32 0 16 0 20 2 0 0 0 0 279 31998:15 AM 11 93 0 0 0 132 28 0 21 0 34 0 0 0 0 0 319 32668:20 AM 17 88 0 0 0 125 24 0 17 0 25 0 0 0 0 0 296 33308:25 AM 10 77 0 0 0 89 22 0 21 0 22 0 0 0 0 0 241 33298:30 AM 9 84 0 0 0 107 18 0 20 0 26 0 0 0 0 0 264 33928:35 AM 6 101 0 0 0 84 27 0 25 0 13 1 0 0 0 0 257 33568:40 AM 10 65 0 0 0 91 36 0 26 0 9 0 0 0 0 0 237 33258:45 AM 15 95 0 1 0 88 36 0 23 0 10 0 0 0 0 0 268 33118:50 AM 9 67 0 0 0 80 55 0 33 0 15 0 0 0 0 0 259 32988:55 AM 11 75 0 0 0 76 25 0 23 0 5 0 0 0 0 0 215 3223
Peak 15-Min Northbound Southbound Eastbound WestboundTotalFlowrates Left Thru Right U Left Thru Right U Left Thru Right U Left Thru Right U
All Vehicles 164 1056 0 0 0 1480 336 0 216 0 316 8 0 0 0 0 3576Heavy Trucks 8 32 0 0 60 24 4 0 4 0 0 0 132Pedestrians 0 0 4 8 12
Bicycles 0 0 0 0 0 0 0 0 0 0 0 0 0Railroad
Stopped Buses
Comments:
Peak-Hour: 7:35 AM -- 8:35 AMPeak 15-Min: 8:10 AM -- 8:25 AM
167 939 0
01463362
197
0
264 0
0
0
1106
1825
461
0
1134
1727
0
531
0.95
4.2 2.3 0.0
0.03.63.9
2.5
0.0
4.2 0.0
0.0
0.0
2.6
3.7
3.5
0.0
2.4
3.7
0.0
4.0
0
0
6 7
0 0 0
000
0
0
0 0
0
0
NA
NA
NA NA
NA
NA
NA NA
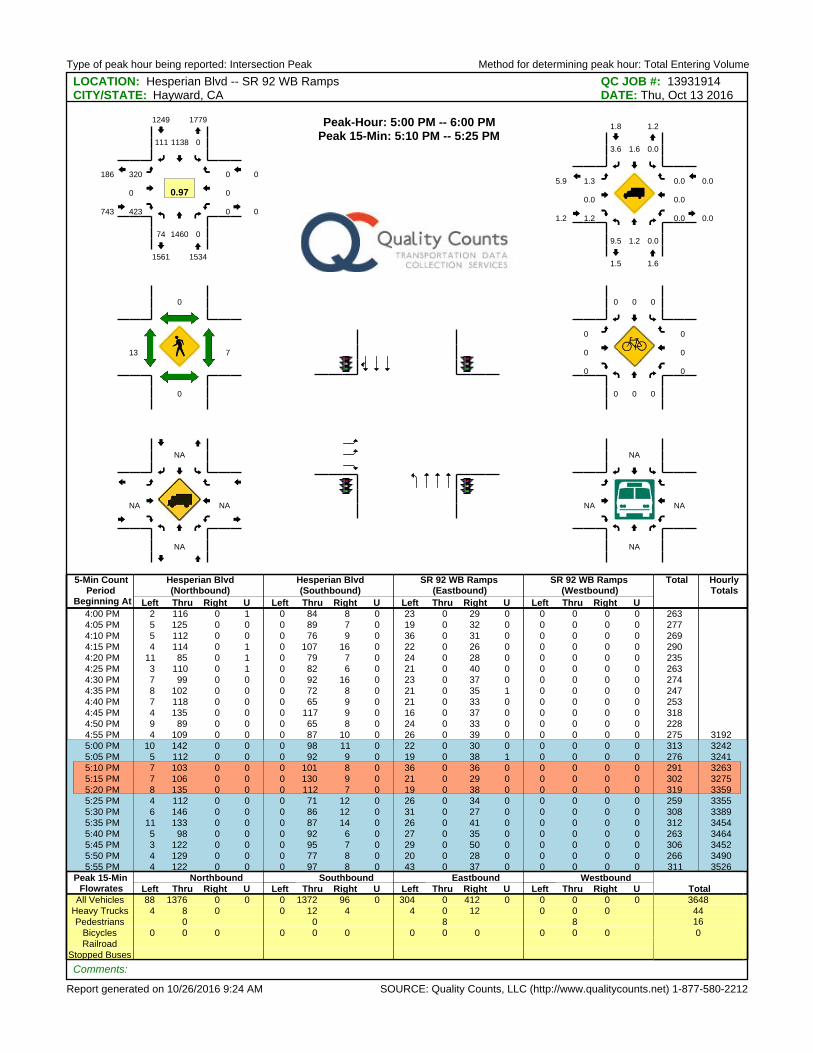
Type of peak hour being reported: Intersection Peak Method for determining peak hour: Total Entering Volume
Report generated on 10/26/2016 9:24 AM SOURCE: Quality Counts, LLC (http://www.qualitycounts.net) 1-877-580-2212
LOCATION: Hesperian Blvd -- SR 92 WB Ramps QC JOB #: 13931914CITY/STATE: Hayward, CA DATE: Thu, Oct 13 2016
5-Min CountPeriod
Beginning At
Hesperian Blvd(Northbound)
Hesperian Blvd(Southbound)
SR 92 WB Ramps(Eastbound)
SR 92 WB Ramps(Westbound)
Total HourlyTotals
Left Thru Right U Left Thru Right U Left Thru Right U Left Thru Right U4:00 PM 2 116 0 1 0 84 8 0 23 0 29 0 0 0 0 0 2634:05 PM 5 125 0 0 0 89 7 0 19 0 32 0 0 0 0 0 2774:10 PM 5 112 0 0 0 76 9 0 36 0 31 0 0 0 0 0 2694:15 PM 4 114 0 1 0 107 16 0 22 0 26 0 0 0 0 0 2904:20 PM 11 85 0 1 0 79 7 0 24 0 28 0 0 0 0 0 2354:25 PM 3 110 0 1 0 82 6 0 21 0 40 0 0 0 0 0 2634:30 PM 7 99 0 0 0 92 16 0 23 0 37 0 0 0 0 0 2744:35 PM 8 102 0 0 0 72 8 0 21 0 35 1 0 0 0 0 2474:40 PM 7 118 0 0 0 65 9 0 21 0 33 0 0 0 0 0 2534:45 PM 4 135 0 0 0 117 9 0 16 0 37 0 0 0 0 0 3184:50 PM 9 89 0 0 0 65 8 0 24 0 33 0 0 0 0 0 2284:55 PM 4 109 0 0 0 87 10 0 26 0 39 0 0 0 0 0 275 3192
5:00 PM 10 142 0 0 0 98 11 0 22 0 30 0 0 0 0 0 313 32425:05 PM 5 112 0 0 0 92 9 0 19 0 38 1 0 0 0 0 276 3241
5:10 PM 7 103 0 0 0 101 8 0 36 0 36 0 0 0 0 0 291 32635:15 PM 7 106 0 0 0 130 9 0 21 0 29 0 0 0 0 0 302 32755:20 PM 8 135 0 0 0 112 7 0 19 0 38 0 0 0 0 0 319 33595:25 PM 4 112 0 0 0 71 12 0 26 0 34 0 0 0 0 0 259 33555:30 PM 6 146 0 0 0 86 12 0 31 0 27 0 0 0 0 0 308 33895:35 PM 11 133 0 0 0 87 14 0 26 0 41 0 0 0 0 0 312 34545:40 PM 5 98 0 0 0 92 6 0 27 0 35 0 0 0 0 0 263 34645:45 PM 3 122 0 0 0 95 7 0 29 0 50 0 0 0 0 0 306 34525:50 PM 4 129 0 0 0 77 8 0 20 0 28 0 0 0 0 0 266 34905:55 PM 4 122 0 0 0 97 8 0 43 0 37 0 0 0 0 0 311 3526
Peak 15-Min Northbound Southbound Eastbound WestboundTotalFlowrates Left Thru Right U Left Thru Right U Left Thru Right U Left Thru Right U
All Vehicles 88 1376 0 0 0 1372 96 0 304 0 412 0 0 0 0 0 3648Heavy Trucks 4 8 0 0 12 4 4 0 12 0 0 0 44Pedestrians 0 0 8 8 16
Bicycles 0 0 0 0 0 0 0 0 0 0 0 0 0Railroad
Stopped Buses
Comments:
Peak-Hour: 5:00 PM -- 6:00 PMPeak 15-Min: 5:10 PM -- 5:25 PM
74 1460 0
01138111
320
0
423 0
0
0
1534
1249
743
0
1779
1561
0
186
0.97
9.5 1.2 0.0
0.01.63.6
1.3
0.0
1.2 0.0
0.0
0.0
1.6
1.8
1.2
0.0
1.2
1.5
0.0
5.9
0
0
13 7
0 0 0
000
0
0
0 0
0
0
NA
NA
NA NA
NA
NA
NA NA
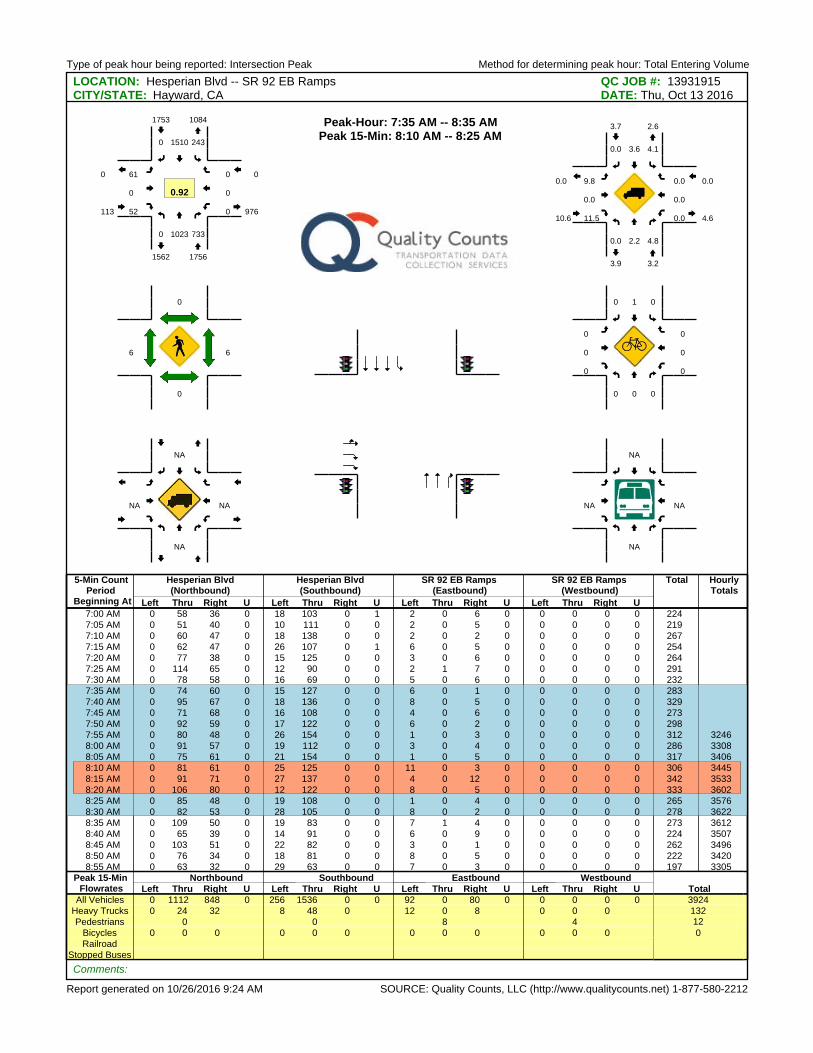
Type of peak hour being reported: Intersection Peak Method for determining peak hour: Total Entering Volume
Report generated on 10/26/2016 9:24 AM SOURCE: Quality Counts, LLC (http://www.qualitycounts.net) 1-877-580-2212
LOCATION: Hesperian Blvd -- SR 92 EB Ramps QC JOB #: 13931915CITY/STATE: Hayward, CA DATE: Thu, Oct 13 2016
5-Min CountPeriod
Beginning At
Hesperian Blvd(Northbound)
Hesperian Blvd(Southbound)
SR 92 EB Ramps (Eastbound)
SR 92 EB Ramps (Westbound)
Total HourlyTotals
Left Thru Right U Left Thru Right U Left Thru Right U Left Thru Right U7:00 AM 0 58 36 0 18 103 0 1 2 0 6 0 0 0 0 0 2247:05 AM 0 51 40 0 10 111 0 0 2 0 5 0 0 0 0 0 2197:10 AM 0 60 47 0 18 138 0 0 2 0 2 0 0 0 0 0 2677:15 AM 0 62 47 0 26 107 0 1 6 0 5 0 0 0 0 0 2547:20 AM 0 77 38 0 15 125 0 0 3 0 6 0 0 0 0 0 2647:25 AM 0 114 65 0 12 90 0 0 2 1 7 0 0 0 0 0 2917:30 AM 0 78 58 0 16 69 0 0 5 0 6 0 0 0 0 0 232
7:35 AM 0 74 60 0 15 127 0 0 6 0 1 0 0 0 0 0 2837:40 AM 0 95 67 0 18 136 0 0 8 0 5 0 0 0 0 0 3297:45 AM 0 71 68 0 16 108 0 0 4 0 6 0 0 0 0 0 2737:50 AM 0 92 59 0 17 122 0 0 6 0 2 0 0 0 0 0 2987:55 AM 0 80 48 0 26 154 0 0 1 0 3 0 0 0 0 0 312 32468:00 AM 0 91 57 0 19 112 0 0 3 0 4 0 0 0 0 0 286 33088:05 AM 0 75 61 0 21 154 0 0 1 0 5 0 0 0 0 0 317 3406
8:10 AM 0 81 61 0 25 125 0 0 11 0 3 0 0 0 0 0 306 34458:15 AM 0 91 71 0 27 137 0 0 4 0 12 0 0 0 0 0 342 35338:20 AM 0 106 80 0 12 122 0 0 8 0 5 0 0 0 0 0 333 36028:25 AM 0 85 48 0 19 108 0 0 1 0 4 0 0 0 0 0 265 35768:30 AM 0 82 53 0 28 105 0 0 8 0 2 0 0 0 0 0 278 36228:35 AM 0 109 50 0 19 83 0 0 7 1 4 0 0 0 0 0 273 36128:40 AM 0 65 39 0 14 91 0 0 6 0 9 0 0 0 0 0 224 35078:45 AM 0 103 51 0 22 82 0 0 3 0 1 0 0 0 0 0 262 34968:50 AM 0 76 34 0 18 81 0 0 8 0 5 0 0 0 0 0 222 34208:55 AM 0 63 32 0 29 63 0 0 7 0 3 0 0 0 0 0 197 3305
Peak 15-Min Northbound Southbound Eastbound WestboundTotalFlowrates Left Thru Right U Left Thru Right U Left Thru Right U Left Thru Right U
All Vehicles 0 1112 848 0 256 1536 0 0 92 0 80 0 0 0 0 0 3924Heavy Trucks 0 24 32 8 48 0 12 0 8 0 0 0 132Pedestrians 0 0 8 4 12
Bicycles 0 0 0 0 0 0 0 0 0 0 0 0 0Railroad
Stopped Buses
Comments:
Peak-Hour: 7:35 AM -- 8:35 AMPeak 15-Min: 8:10 AM -- 8:25 AM
0 1023 733
24315100
61
0
52 0
0
0
1756
1753
113
0
1084
1562
976
0
0.92
0.0 2.2 4.8
4.13.60.0
9.8
0.0
11.5 0.0
0.0
0.0
3.2
3.7
10.6
0.0
2.6
3.9
4.6
0.0
0
0
6 6
0 0 0
010
0
0
0 0
0
0
NA
NA
NA NA
NA
NA
NA NA
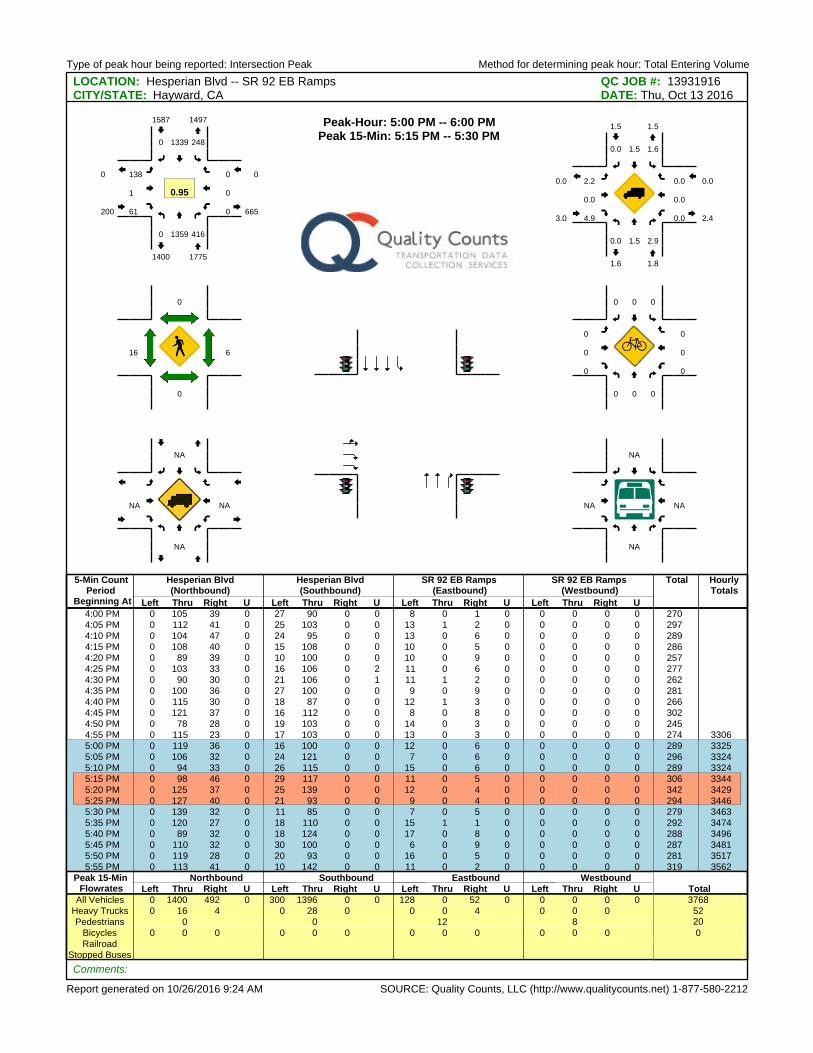
Type of peak hour being reported: Intersection Peak Method for determining peak hour: Total Entering Volume
Report generated on 10/26/2016 9:24 AM SOURCE: Quality Counts, LLC (http://www.qualitycounts.net) 1-877-580-2212
LOCATION: Hesperian Blvd -- SR 92 EB Ramps QC JOB #: 13931916CITY/STATE: Hayward, CA DATE: Thu, Oct 13 2016
5-Min CountPeriod
Beginning At
Hesperian Blvd(Northbound)
Hesperian Blvd(Southbound)
SR 92 EB Ramps (Eastbound)
SR 92 EB Ramps (Westbound)
Total HourlyTotals
Left Thru Right U Left Thru Right U Left Thru Right U Left Thru Right U4:00 PM 0 105 39 0 27 90 0 0 8 0 1 0 0 0 0 0 2704:05 PM 0 112 41 0 25 103 0 0 13 1 2 0 0 0 0 0 2974:10 PM 0 104 47 0 24 95 0 0 13 0 6 0 0 0 0 0 2894:15 PM 0 108 40 0 15 108 0 0 10 0 5 0 0 0 0 0 2864:20 PM 0 89 39 0 10 100 0 0 10 0 9 0 0 0 0 0 2574:25 PM 0 103 33 0 16 106 0 2 11 0 6 0 0 0 0 0 2774:30 PM 0 90 30 0 21 106 0 1 11 1 2 0 0 0 0 0 2624:35 PM 0 100 36 0 27 100 0 0 9 0 9 0 0 0 0 0 2814:40 PM 0 115 30 0 18 87 0 0 12 1 3 0 0 0 0 0 2664:45 PM 0 121 37 0 16 112 0 0 8 0 8 0 0 0 0 0 3024:50 PM 0 78 28 0 19 103 0 0 14 0 3 0 0 0 0 0 2454:55 PM 0 115 23 0 17 103 0 0 13 0 3 0 0 0 0 0 274 3306
5:00 PM 0 119 36 0 16 100 0 0 12 0 6 0 0 0 0 0 289 33255:05 PM 0 106 32 0 24 121 0 0 7 0 6 0 0 0 0 0 296 33245:10 PM 0 94 33 0 26 115 0 0 15 0 6 0 0 0 0 0 289 3324
5:15 PM 0 98 46 0 29 117 0 0 11 0 5 0 0 0 0 0 306 33445:20 PM 0 125 37 0 25 139 0 0 12 0 4 0 0 0 0 0 342 34295:25 PM 0 127 40 0 21 93 0 0 9 0 4 0 0 0 0 0 294 34465:30 PM 0 139 32 0 11 85 0 0 7 0 5 0 0 0 0 0 279 34635:35 PM 0 120 27 0 18 110 0 0 15 1 1 0 0 0 0 0 292 34745:40 PM 0 89 32 0 18 124 0 0 17 0 8 0 0 0 0 0 288 34965:45 PM 0 110 32 0 30 100 0 0 6 0 9 0 0 0 0 0 287 34815:50 PM 0 119 28 0 20 93 0 0 16 0 5 0 0 0 0 0 281 35175:55 PM 0 113 41 0 10 142 0 0 11 0 2 0 0 0 0 0 319 3562
Peak 15-Min Northbound Southbound Eastbound WestboundTotalFlowrates Left Thru Right U Left Thru Right U Left Thru Right U Left Thru Right U
All Vehicles 0 1400 492 0 300 1396 0 0 128 0 52 0 0 0 0 0 3768Heavy Trucks 0 16 4 0 28 0 0 0 4 0 0 0 52Pedestrians 0 0 12 8 20
Bicycles 0 0 0 0 0 0 0 0 0 0 0 0 0Railroad
Stopped Buses
Comments:
Peak-Hour: 5:00 PM -- 6:00 PMPeak 15-Min: 5:15 PM -- 5:30 PM
0 1359 416
24813390
138
1
61 0
0
0
1775
1587
200
0
1497
1400
665
0
0.95
0.0 1.5 2.9
1.61.50.0
2.2
0.0
4.9 0.0
0.0
0.0
1.8
1.5
3.0
0.0
1.5
1.6
2.4
0.0
0
0
16 6
0 0 0
000
0
0
0 0
0
0
NA
NA
NA NA
NA
NA
NA NA
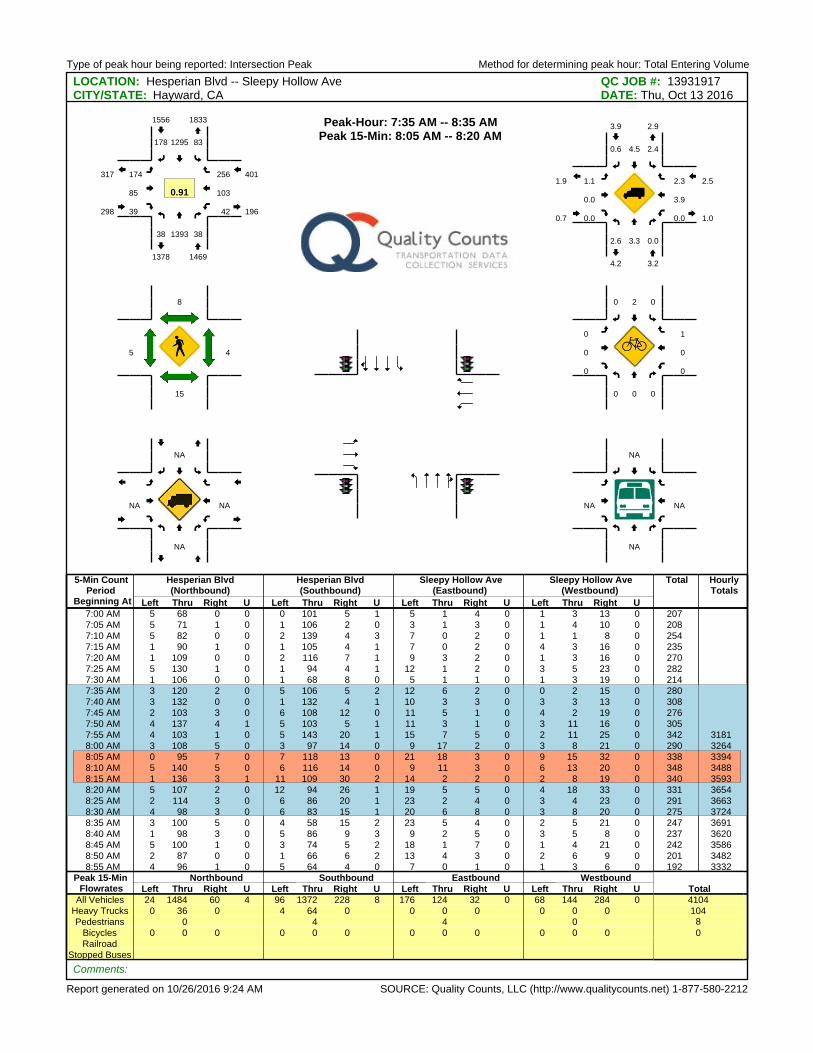
Type of peak hour being reported: Intersection Peak Method for determining peak hour: Total Entering Volume
Report generated on 10/26/2016 9:24 AM SOURCE: Quality Counts, LLC (http://www.qualitycounts.net) 1-877-580-2212
LOCATION: Hesperian Blvd -- Sleepy Hollow Ave QC JOB #: 13931917CITY/STATE: Hayward, CA DATE: Thu, Oct 13 2016
5-Min CountPeriod
Beginning At
Hesperian Blvd(Northbound)
Hesperian Blvd(Southbound)
Sleepy Hollow Ave (Eastbound)
Sleepy Hollow Ave (Westbound)
Total HourlyTotals
Left Thru Right U Left Thru Right U Left Thru Right U Left Thru Right U7:00 AM 5 68 0 0 0 101 5 1 5 1 4 0 1 3 13 0 2077:05 AM 5 71 1 0 1 106 2 0 3 1 3 0 1 4 10 0 2087:10 AM 5 82 0 0 2 139 4 3 7 0 2 0 1 1 8 0 2547:15 AM 1 90 1 0 1 105 4 1 7 0 2 0 4 3 16 0 2357:20 AM 1 109 0 0 2 116 7 1 9 3 2 0 1 3 16 0 2707:25 AM 5 130 1 0 1 94 4 1 12 1 2 0 3 5 23 0 2827:30 AM 1 106 0 0 1 68 8 0 5 1 1 0 1 3 19 0 214
7:35 AM 3 120 2 0 5 106 5 2 12 6 2 0 0 2 15 0 2807:40 AM 3 132 0 0 1 132 4 1 10 3 3 0 3 3 13 0 3087:45 AM 2 103 3 0 6 108 12 0 11 5 1 0 4 2 19 0 2767:50 AM 4 137 4 1 5 103 5 1 11 3 1 0 3 11 16 0 3057:55 AM 4 103 1 0 5 143 20 1 15 7 5 0 2 11 25 0 342 31818:00 AM 3 108 5 0 3 97 14 0 9 17 2 0 3 8 21 0 290 3264
8:05 AM 0 95 7 0 7 118 13 0 21 18 3 0 9 15 32 0 338 33948:10 AM 5 140 5 0 6 116 14 0 9 11 3 0 6 13 20 0 348 34888:15 AM 1 136 3 1 11 109 30 2 14 2 2 0 2 8 19 0 340 35938:20 AM 5 107 2 0 12 94 26 1 19 5 5 0 4 18 33 0 331 36548:25 AM 2 114 3 0 6 86 20 1 23 2 4 0 3 4 23 0 291 36638:30 AM 4 98 3 0 6 83 15 1 20 6 8 0 3 8 20 0 275 37248:35 AM 3 100 5 0 4 58 15 2 23 5 4 0 2 5 21 0 247 36918:40 AM 1 98 3 0 5 86 9 3 9 2 5 0 3 5 8 0 237 36208:45 AM 5 100 1 0 3 74 5 2 18 1 7 0 1 4 21 0 242 35868:50 AM 2 87 0 0 1 66 6 2 13 4 3 0 2 6 9 0 201 34828:55 AM 4 96 1 0 5 64 4 0 7 0 1 0 1 3 6 0 192 3332
Peak 15-Min Northbound Southbound Eastbound WestboundTotalFlowrates Left Thru Right U Left Thru Right U Left Thru Right U Left Thru Right U
All Vehicles 24 1484 60 4 96 1372 228 8 176 124 32 0 68 144 284 0 4104Heavy Trucks 0 36 0 4 64 0 0 0 0 0 0 0 104Pedestrians 0 4 4 0 8
Bicycles 0 0 0 0 0 0 0 0 0 0 0 0 0Railroad
Stopped Buses
Comments:
Peak-Hour: 7:35 AM -- 8:35 AMPeak 15-Min: 8:05 AM -- 8:20 AM
38 1393 38
831295178
174
85
39 42
103
256
1469
1556
298
401
1833
1378
196
317
0.91
2.6 3.3 0.0
2.44.50.6
1.1
0.0
0.0 0.0
3.9
2.3
3.2
3.9
0.7
2.5
2.9
4.2
1.0
1.9
15
8
5 4
0 0 0
020
0
0
0 0
0
1
NA
NA
NA NA
NA
NA
NA NA
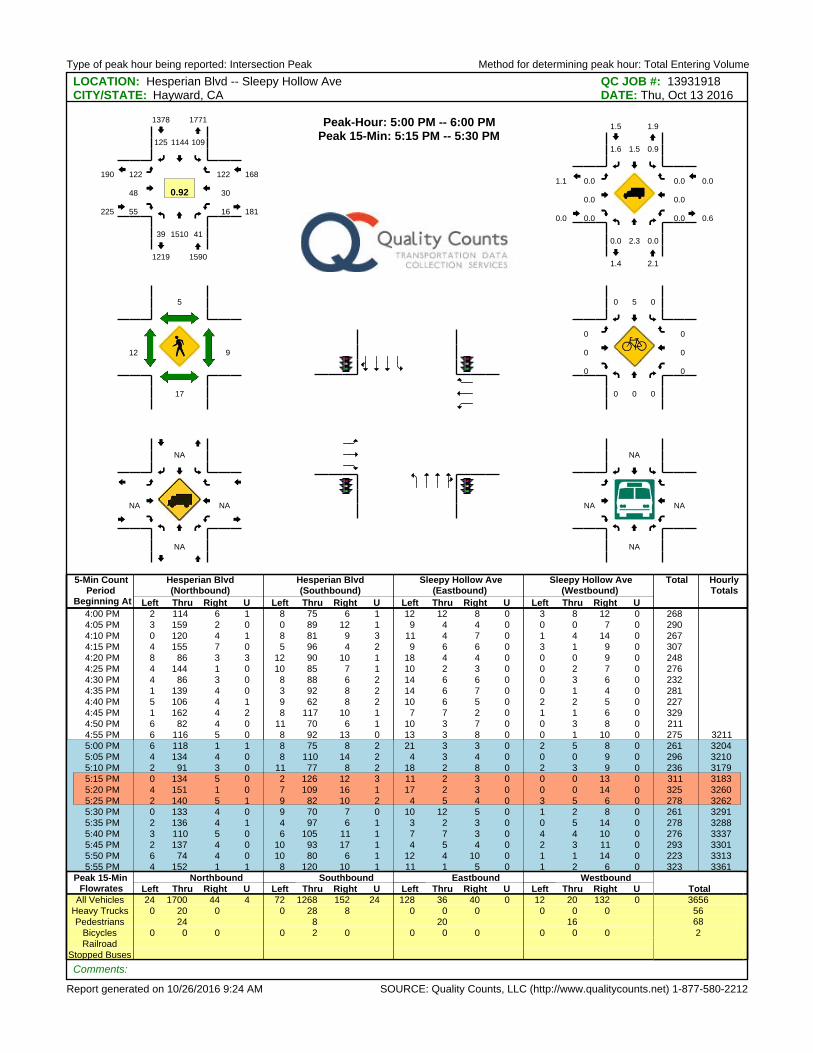
Type of peak hour being reported: Intersection Peak Method for determining peak hour: Total Entering Volume
Report generated on 10/26/2016 9:24 AM SOURCE: Quality Counts, LLC (http://www.qualitycounts.net) 1-877-580-2212
LOCATION: Hesperian Blvd -- Sleepy Hollow Ave QC JOB #: 13931918CITY/STATE: Hayward, CA DATE: Thu, Oct 13 2016
5-Min CountPeriod
Beginning At
Hesperian Blvd(Northbound)
Hesperian Blvd(Southbound)
Sleepy Hollow Ave (Eastbound)
Sleepy Hollow Ave (Westbound)
Total HourlyTotals
Left Thru Right U Left Thru Right U Left Thru Right U Left Thru Right U4:00 PM 2 114 6 1 8 75 6 1 12 12 8 0 3 8 12 0 2684:05 PM 3 159 2 0 0 89 12 1 9 4 4 0 0 0 7 0 2904:10 PM 0 120 4 1 8 81 9 3 11 4 7 0 1 4 14 0 2674:15 PM 4 155 7 0 5 96 4 2 9 6 6 0 3 1 9 0 3074:20 PM 8 86 3 3 12 90 10 1 18 4 4 0 0 0 9 0 2484:25 PM 4 144 1 0 10 85 7 1 10 2 3 0 0 2 7 0 2764:30 PM 4 86 3 0 8 88 6 2 14 6 6 0 0 3 6 0 2324:35 PM 1 139 4 0 3 92 8 2 14 6 7 0 0 1 4 0 2814:40 PM 5 106 4 1 9 62 8 2 10 6 5 0 2 2 5 0 2274:45 PM 1 162 4 2 8 117 10 1 7 7 2 0 1 1 6 0 3294:50 PM 6 82 4 0 11 70 6 1 10 3 7 0 0 3 8 0 2114:55 PM 6 116 5 0 8 92 13 0 13 3 8 0 0 1 10 0 275 3211
5:00 PM 6 118 1 1 8 75 8 2 21 3 3 0 2 5 8 0 261 32045:05 PM 4 134 4 0 8 110 14 2 4 3 4 0 0 0 9 0 296 32105:10 PM 2 91 3 0 11 77 8 2 18 2 8 0 2 3 9 0 236 3179
5:15 PM 0 134 5 0 2 126 12 3 11 2 3 0 0 0 13 0 311 31835:20 PM 4 151 1 0 7 109 16 1 17 2 3 0 0 0 14 0 325 32605:25 PM 2 140 5 1 9 82 10 2 4 5 4 0 3 5 6 0 278 32625:30 PM 0 133 4 0 9 70 7 0 10 12 5 0 1 2 8 0 261 32915:35 PM 2 136 4 1 4 97 6 1 3 2 3 0 0 5 14 0 278 32885:40 PM 3 110 5 0 6 105 11 1 7 7 3 0 4 4 10 0 276 33375:45 PM 2 137 4 0 10 93 17 1 4 5 4 0 2 3 11 0 293 33015:50 PM 6 74 4 0 10 80 6 1 12 4 10 0 1 1 14 0 223 33135:55 PM 4 152 1 1 8 120 10 1 11 1 5 0 1 2 6 0 323 3361
Peak 15-Min Northbound Southbound Eastbound WestboundTotalFlowrates Left Thru Right U Left Thru Right U Left Thru Right U Left Thru Right U
All Vehicles 24 1700 44 4 72 1268 152 24 128 36 40 0 12 20 132 0 3656Heavy Trucks 0 20 0 0 28 8 0 0 0 0 0 0 56Pedestrians 24 8 20 16 68
Bicycles 0 0 0 0 2 0 0 0 0 0 0 0 2Railroad
Stopped Buses
Comments:
Peak-Hour: 5:00 PM -- 6:00 PMPeak 15-Min: 5:15 PM -- 5:30 PM
39 1510 41
1091144125
122
48
55 16
30
122
1590
1378
225
168
1771
1219
181
190
0.92
0.0 2.3 0.0
0.91.51.6
0.0
0.0
0.0 0.0
0.0
0.0
2.1
1.5
0.0
0.0
1.9
1.4
0.6
1.1
17
5
12 9
0 0 0
050
0
0
0 0
0
0
NA
NA
NA NA
NA
NA
NA NA
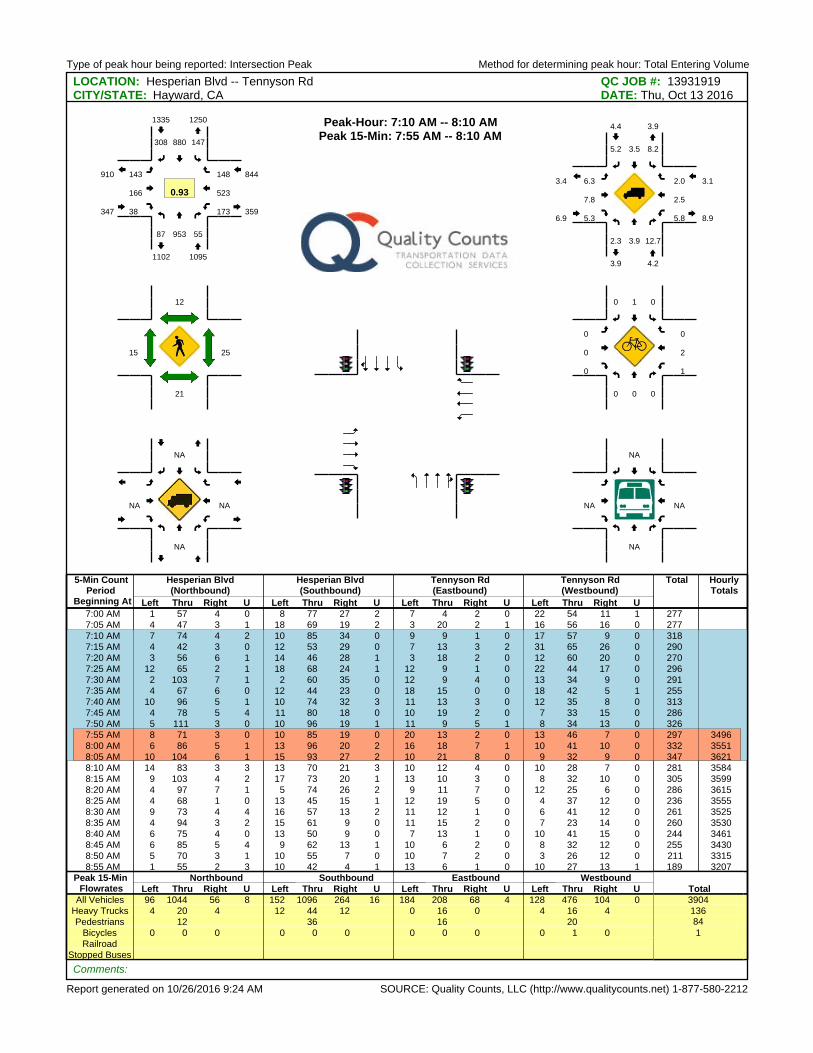
Type of peak hour being reported: Intersection Peak Method for determining peak hour: Total Entering Volume
Report generated on 10/26/2016 9:24 AM SOURCE: Quality Counts, LLC (http://www.qualitycounts.net) 1-877-580-2212
LOCATION: Hesperian Blvd -- Tennyson Rd QC JOB #: 13931919CITY/STATE: Hayward, CA DATE: Thu, Oct 13 2016
5-Min CountPeriod
Beginning At
Hesperian Blvd(Northbound)
Hesperian Blvd(Southbound)
Tennyson Rd (Eastbound)
Tennyson Rd (Westbound)
Total HourlyTotals
Left Thru Right U Left Thru Right U Left Thru Right U Left Thru Right U7:00 AM 1 57 4 0 8 77 27 2 7 4 2 0 22 54 11 1 2777:05 AM 4 47 3 1 18 69 19 2 3 20 2 1 16 56 16 0 277
7:10 AM 7 74 4 2 10 85 34 0 9 9 1 0 17 57 9 0 3187:15 AM 4 42 3 0 12 53 29 0 7 13 3 2 31 65 26 0 2907:20 AM 3 56 6 1 14 46 28 1 3 18 2 0 12 60 20 0 2707:25 AM 12 65 2 1 18 68 24 1 12 9 1 0 22 44 17 0 2967:30 AM 2 103 7 1 2 60 35 0 12 9 4 0 13 34 9 0 2917:35 AM 4 67 6 0 12 44 23 0 18 15 0 0 18 42 5 1 2557:40 AM 10 96 5 1 10 74 32 3 11 13 3 0 12 35 8 0 3137:45 AM 4 78 5 4 11 80 18 0 10 19 2 0 7 33 15 0 2867:50 AM 5 111 3 0 10 96 19 1 11 9 5 1 8 34 13 0 326
7:55 AM 8 71 3 0 10 85 19 0 20 13 2 0 13 46 7 0 297 34968:00 AM 6 86 5 1 13 96 20 2 16 18 7 1 10 41 10 0 332 35518:05 AM 10 104 6 1 15 93 27 2 10 21 8 0 9 32 9 0 347 36218:10 AM 14 83 3 3 13 70 21 3 10 12 4 0 10 28 7 0 281 35848:15 AM 9 103 4 2 17 73 20 1 13 10 3 0 8 32 10 0 305 35998:20 AM 4 97 7 1 5 74 26 2 9 11 7 0 12 25 6 0 286 36158:25 AM 4 68 1 0 13 45 15 1 12 19 5 0 4 37 12 0 236 35558:30 AM 9 73 4 4 16 57 13 2 11 12 1 0 6 41 12 0 261 35258:35 AM 4 94 3 2 15 61 9 0 11 15 2 0 7 23 14 0 260 35308:40 AM 6 75 4 0 13 50 9 0 7 13 1 0 10 41 15 0 244 34618:45 AM 6 85 5 4 9 62 13 1 10 6 2 0 8 32 12 0 255 34308:50 AM 5 70 3 1 10 55 7 0 10 7 2 0 3 26 12 0 211 33158:55 AM 1 55 2 3 10 42 4 1 13 6 1 0 10 27 13 1 189 3207
Peak 15-Min Northbound Southbound Eastbound WestboundTotalFlowrates Left Thru Right U Left Thru Right U Left Thru Right U Left Thru Right U
All Vehicles 96 1044 56 8 152 1096 264 16 184 208 68 4 128 476 104 0 3904Heavy Trucks 4 20 4 12 44 12 0 16 0 4 16 4 136Pedestrians 12 36 16 20 84
Bicycles 0 0 0 0 0 0 0 0 0 0 1 0 1Railroad
Stopped Buses
Comments:
Peak-Hour: 7:10 AM -- 8:10 AMPeak 15-Min: 7:55 AM -- 8:10 AM
87 953 55
147880308
143
166
38 173
523
148
1095
1335
347
844
1250
1102
359
910
0.93
2.3 3.9 12.7
8.23.55.2
6.3
7.8
5.3 5.8
2.5
2.0
4.2
4.4
6.9
3.1
3.9
3.9
8.9
3.4
21
12
15 25
0 0 0
010
0
0
0 1
2
0
NA
NA
NA NA
NA
NA
NA NA
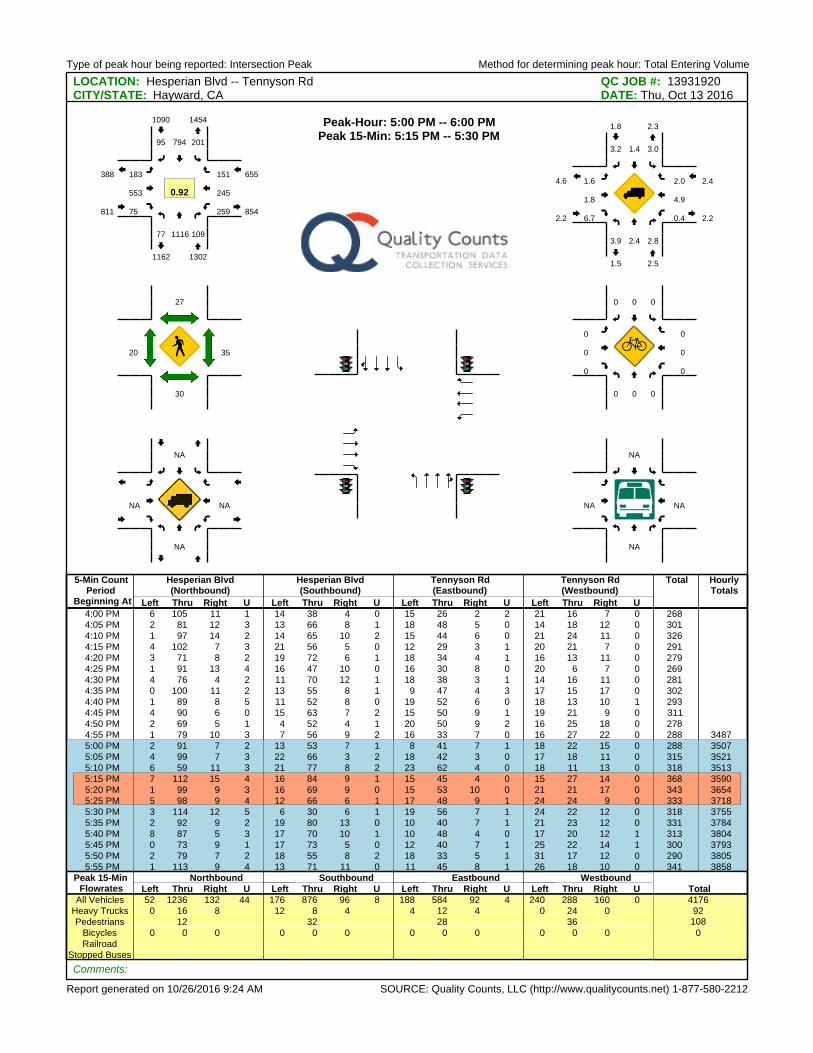
Type of peak hour being reported: Intersection Peak Method for determining peak hour: Total Entering Volume
Report generated on 10/26/2016 9:24 AM SOURCE: Quality Counts, LLC (http://www.qualitycounts.net) 1-877-580-2212
LOCATION: Hesperian Blvd -- Tennyson Rd QC JOB #: 13931920CITY/STATE: Hayward, CA DATE: Thu, Oct 13 2016
5-Min CountPeriod
Beginning At
Hesperian Blvd(Northbound)
Hesperian Blvd(Southbound)
Tennyson Rd (Eastbound)
Tennyson Rd (Westbound)
Total HourlyTotals
Left Thru Right U Left Thru Right U Left Thru Right U Left Thru Right U4:00 PM 6 105 11 1 14 38 4 0 15 26 2 2 21 16 7 0 2684:05 PM 2 81 12 3 13 66 8 1 18 48 5 0 14 18 12 0 3014:10 PM 1 97 14 2 14 65 10 2 15 44 6 0 21 24 11 0 3264:15 PM 4 102 7 3 21 56 5 0 12 29 3 1 20 21 7 0 2914:20 PM 3 71 8 2 19 72 6 1 18 34 4 1 16 13 11 0 2794:25 PM 1 91 13 4 16 47 10 0 16 30 8 0 20 6 7 0 2694:30 PM 4 76 4 2 11 70 12 1 18 38 3 1 14 16 11 0 2814:35 PM 0 100 11 2 13 55 8 1 9 47 4 3 17 15 17 0 3024:40 PM 1 89 8 5 11 52 8 0 19 52 6 0 18 13 10 1 2934:45 PM 4 90 6 0 15 63 7 2 15 50 9 1 19 21 9 0 3114:50 PM 2 69 5 1 4 52 4 1 20 50 9 2 16 25 18 0 2784:55 PM 1 79 10 3 7 56 9 2 16 33 7 0 16 27 22 0 288 3487
5:00 PM 2 91 7 2 13 53 7 1 8 41 7 1 18 22 15 0 288 35075:05 PM 4 99 7 3 22 66 3 2 18 42 3 0 17 18 11 0 315 35215:10 PM 6 59 11 3 21 77 8 2 23 62 4 0 18 11 13 0 318 3513
5:15 PM 7 112 15 4 16 84 9 1 15 45 4 0 15 27 14 0 368 35905:20 PM 1 99 9 3 16 69 9 0 15 53 10 0 21 21 17 0 343 36545:25 PM 5 98 9 4 12 66 6 1 17 48 9 1 24 24 9 0 333 37185:30 PM 3 114 12 5 6 30 6 1 19 56 7 1 24 22 12 0 318 37555:35 PM 2 92 9 2 19 80 13 0 10 40 7 1 21 23 12 0 331 37845:40 PM 8 87 5 3 17 70 10 1 10 48 4 0 17 20 12 1 313 38045:45 PM 0 73 9 1 17 73 5 0 12 40 7 1 25 22 14 1 300 37935:50 PM 2 79 7 2 18 55 8 2 18 33 5 1 31 17 12 0 290 38055:55 PM 1 113 9 4 13 71 11 0 11 45 8 1 26 18 10 0 341 3858
Peak 15-Min Northbound Southbound Eastbound WestboundTotalFlowrates Left Thru Right U Left Thru Right U Left Thru Right U Left Thru Right U
All Vehicles 52 1236 132 44 176 876 96 8 188 584 92 4 240 288 160 0 4176Heavy Trucks 0 16 8 12 8 4 4 12 4 0 24 0 92Pedestrians 12 32 28 36 108
Bicycles 0 0 0 0 0 0 0 0 0 0 0 0 0Railroad
Stopped Buses
Comments:
Peak-Hour: 5:00 PM -- 6:00 PMPeak 15-Min: 5:15 PM -- 5:30 PM
77 1116 109
20179495
183
553
75 259
245
151
1302
1090
811
655
1454
1162
854
388
0.92
3.9 2.4 2.8
3.01.43.2
1.6
1.8
6.7 0.4
4.9
2.0
2.5
1.8
2.2
2.4
2.3
1.5
2.2
4.6
30
27
20 35
0 0 0
000
0
0
0 0
0
0
NA
NA
NA NA
NA
NA
NA NA
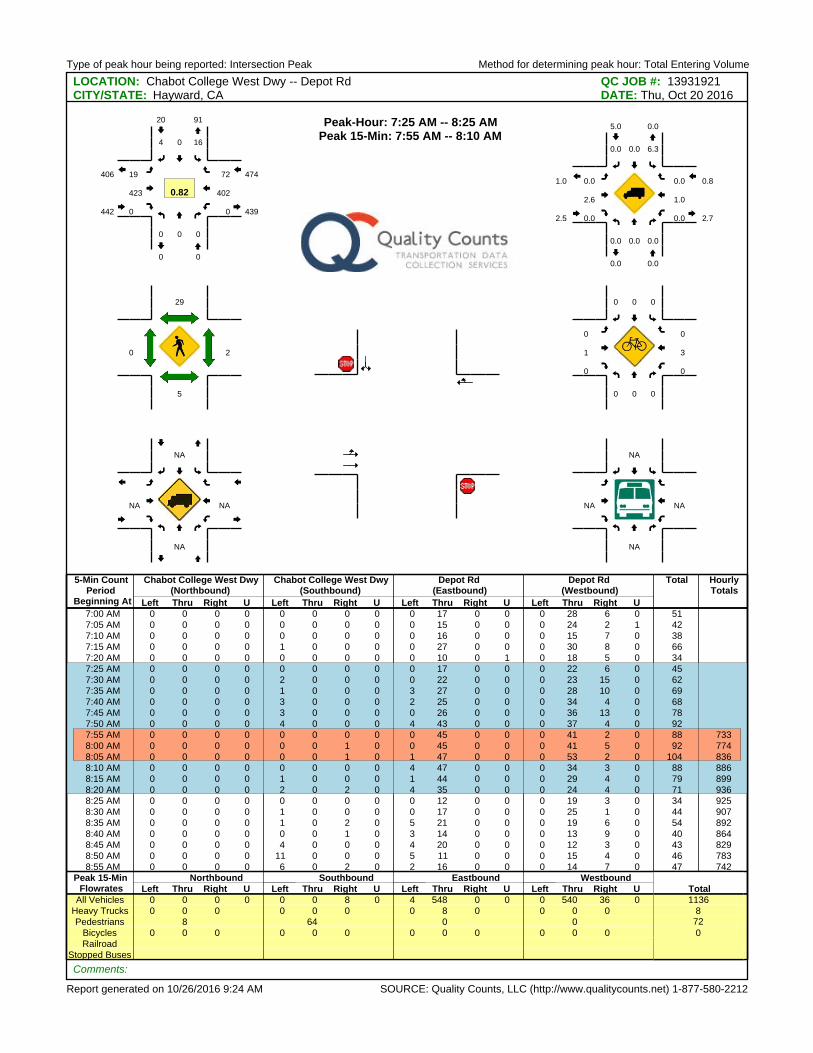
Type of peak hour being reported: Intersection Peak Method for determining peak hour: Total Entering Volume
Report generated on 10/26/2016 9:24 AM SOURCE: Quality Counts, LLC (http://www.qualitycounts.net) 1-877-580-2212
LOCATION: Chabot College West Dwy -- Depot Rd QC JOB #: 13931921CITY/STATE: Hayward, CA DATE: Thu, Oct 20 2016
5-Min CountPeriod
Beginning At
Chabot College West Dwy(Northbound)
Chabot College West Dwy(Southbound)
Depot Rd(Eastbound)
Depot Rd(Westbound)
Total HourlyTotals
Left Thru Right U Left Thru Right U Left Thru Right U Left Thru Right U7:00 AM 0 0 0 0 0 0 0 0 0 17 0 0 0 28 6 0 517:05 AM 0 0 0 0 0 0 0 0 0 15 0 0 0 24 2 1 427:10 AM 0 0 0 0 0 0 0 0 0 16 0 0 0 15 7 0 387:15 AM 0 0 0 0 1 0 0 0 0 27 0 0 0 30 8 0 667:20 AM 0 0 0 0 0 0 0 0 0 10 0 1 0 18 5 0 34
7:25 AM 0 0 0 0 0 0 0 0 0 17 0 0 0 22 6 0 457:30 AM 0 0 0 0 2 0 0 0 0 22 0 0 0 23 15 0 627:35 AM 0 0 0 0 1 0 0 0 3 27 0 0 0 28 10 0 697:40 AM 0 0 0 0 3 0 0 0 2 25 0 0 0 34 4 0 687:45 AM 0 0 0 0 3 0 0 0 0 26 0 0 0 36 13 0 787:50 AM 0 0 0 0 4 0 0 0 4 43 0 0 0 37 4 0 92
7:55 AM 0 0 0 0 0 0 0 0 0 45 0 0 0 41 2 0 88 7338:00 AM 0 0 0 0 0 0 1 0 0 45 0 0 0 41 5 0 92 7748:05 AM 0 0 0 0 0 0 1 0 1 47 0 0 0 53 2 0 104 8368:10 AM 0 0 0 0 0 0 0 0 4 47 0 0 0 34 3 0 88 8868:15 AM 0 0 0 0 1 0 0 0 1 44 0 0 0 29 4 0 79 8998:20 AM 0 0 0 0 2 0 2 0 4 35 0 0 0 24 4 0 71 9368:25 AM 0 0 0 0 0 0 0 0 0 12 0 0 0 19 3 0 34 9258:30 AM 0 0 0 0 1 0 0 0 0 17 0 0 0 25 1 0 44 9078:35 AM 0 0 0 0 1 0 2 0 5 21 0 0 0 19 6 0 54 8928:40 AM 0 0 0 0 0 0 1 0 3 14 0 0 0 13 9 0 40 8648:45 AM 0 0 0 0 4 0 0 0 4 20 0 0 0 12 3 0 43 8298:50 AM 0 0 0 0 11 0 0 0 5 11 0 0 0 15 4 0 46 7838:55 AM 0 0 0 0 6 0 2 0 2 16 0 0 0 14 7 0 47 742
Peak 15-Min Northbound Southbound Eastbound WestboundTotalFlowrates Left Thru Right U Left Thru Right U Left Thru Right U Left Thru Right U
All Vehicles 0 0 0 0 0 0 8 0 4 548 0 0 0 540 36 0 1136Heavy Trucks 0 0 0 0 0 0 0 8 0 0 0 0 8Pedestrians 8 64 0 0 72
Bicycles 0 0 0 0 0 0 0 0 0 0 0 0 0Railroad
Stopped Buses
Comments:
Peak-Hour: 7:25 AM -- 8:25 AMPeak 15-Min: 7:55 AM -- 8:10 AM
0 0 0
1604
19
423
0 0
402
72
0
20
442
474
91
0
439
406
0.82
0.0 0.0 0.0
6.30.00.0
0.0
2.6
0.0 0.0
1.0
0.0
0.0
5.0
2.5
0.8
0.0
0.0
2.7
1.0
5
29
0 2
0 0 0
000
0
1
0 0
3
0
NA
NA
NA NA
NA
NA
NA NA
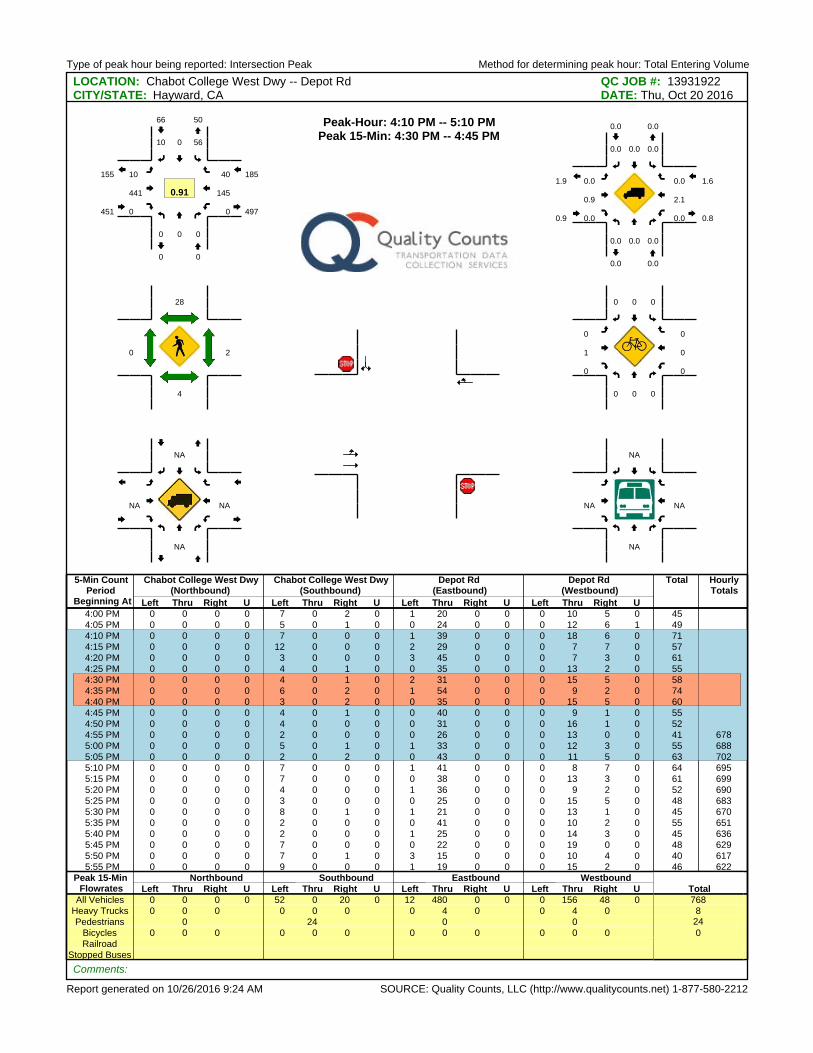
Type of peak hour being reported: Intersection Peak Method for determining peak hour: Total Entering Volume
Report generated on 10/26/2016 9:24 AM SOURCE: Quality Counts, LLC (http://www.qualitycounts.net) 1-877-580-2212
LOCATION: Chabot College West Dwy -- Depot Rd QC JOB #: 13931922CITY/STATE: Hayward, CA DATE: Thu, Oct 20 2016
5-Min CountPeriod
Beginning At
Chabot College West Dwy(Northbound)
Chabot College West Dwy(Southbound)
Depot Rd(Eastbound)
Depot Rd(Westbound)
Total HourlyTotals
Left Thru Right U Left Thru Right U Left Thru Right U Left Thru Right U4:00 PM 0 0 0 0 7 0 2 0 1 20 0 0 0 10 5 0 454:05 PM 0 0 0 0 5 0 1 0 0 24 0 0 0 12 6 1 49
4:10 PM 0 0 0 0 7 0 0 0 1 39 0 0 0 18 6 0 714:15 PM 0 0 0 0 12 0 0 0 2 29 0 0 0 7 7 0 574:20 PM 0 0 0 0 3 0 0 0 3 45 0 0 0 7 3 0 614:25 PM 0 0 0 0 4 0 1 0 0 35 0 0 0 13 2 0 55
4:30 PM 0 0 0 0 4 0 1 0 2 31 0 0 0 15 5 0 584:35 PM 0 0 0 0 6 0 2 0 1 54 0 0 0 9 2 0 744:40 PM 0 0 0 0 3 0 2 0 0 35 0 0 0 15 5 0 604:45 PM 0 0 0 0 4 0 1 0 0 40 0 0 0 9 1 0 554:50 PM 0 0 0 0 4 0 0 0 0 31 0 0 0 16 1 0 524:55 PM 0 0 0 0 2 0 0 0 0 26 0 0 0 13 0 0 41 6785:00 PM 0 0 0 0 5 0 1 0 1 33 0 0 0 12 3 0 55 6885:05 PM 0 0 0 0 2 0 2 0 0 43 0 0 0 11 5 0 63 7025:10 PM 0 0 0 0 7 0 0 0 1 41 0 0 0 8 7 0 64 6955:15 PM 0 0 0 0 7 0 0 0 0 38 0 0 0 13 3 0 61 6995:20 PM 0 0 0 0 4 0 0 0 1 36 0 0 0 9 2 0 52 6905:25 PM 0 0 0 0 3 0 0 0 0 25 0 0 0 15 5 0 48 6835:30 PM 0 0 0 0 8 0 1 0 1 21 0 0 0 13 1 0 45 6705:35 PM 0 0 0 0 2 0 0 0 0 41 0 0 0 10 2 0 55 6515:40 PM 0 0 0 0 2 0 0 0 1 25 0 0 0 14 3 0 45 6365:45 PM 0 0 0 0 7 0 0 0 0 22 0 0 0 19 0 0 48 6295:50 PM 0 0 0 0 7 0 1 0 3 15 0 0 0 10 4 0 40 6175:55 PM 0 0 0 0 9 0 0 0 1 19 0 0 0 15 2 0 46 622
Peak 15-Min Northbound Southbound Eastbound WestboundTotalFlowrates Left Thru Right U Left Thru Right U Left Thru Right U Left Thru Right U
All Vehicles 0 0 0 0 52 0 20 0 12 480 0 0 0 156 48 0 768Heavy Trucks 0 0 0 0 0 0 0 4 0 0 4 0 8Pedestrians 0 24 0 0 24
Bicycles 0 0 0 0 0 0 0 0 0 0 0 0 0Railroad
Stopped Buses
Comments:
Peak-Hour: 4:10 PM -- 5:10 PMPeak 15-Min: 4:30 PM -- 4:45 PM
0 0 0
56010
10
441
0 0
145
40
0
66
451
185
50
0
497
155
0.91
0.0 0.0 0.0
0.00.00.0
0.0
0.9
0.0 0.0
2.1
0.0
0.0
0.0
0.9
1.6
0.0
0.0
0.8
1.9
4
28
0 2
0 0 0
000
0
1
0 0
0
0
NA
NA
NA NA
NA
NA
NA NA
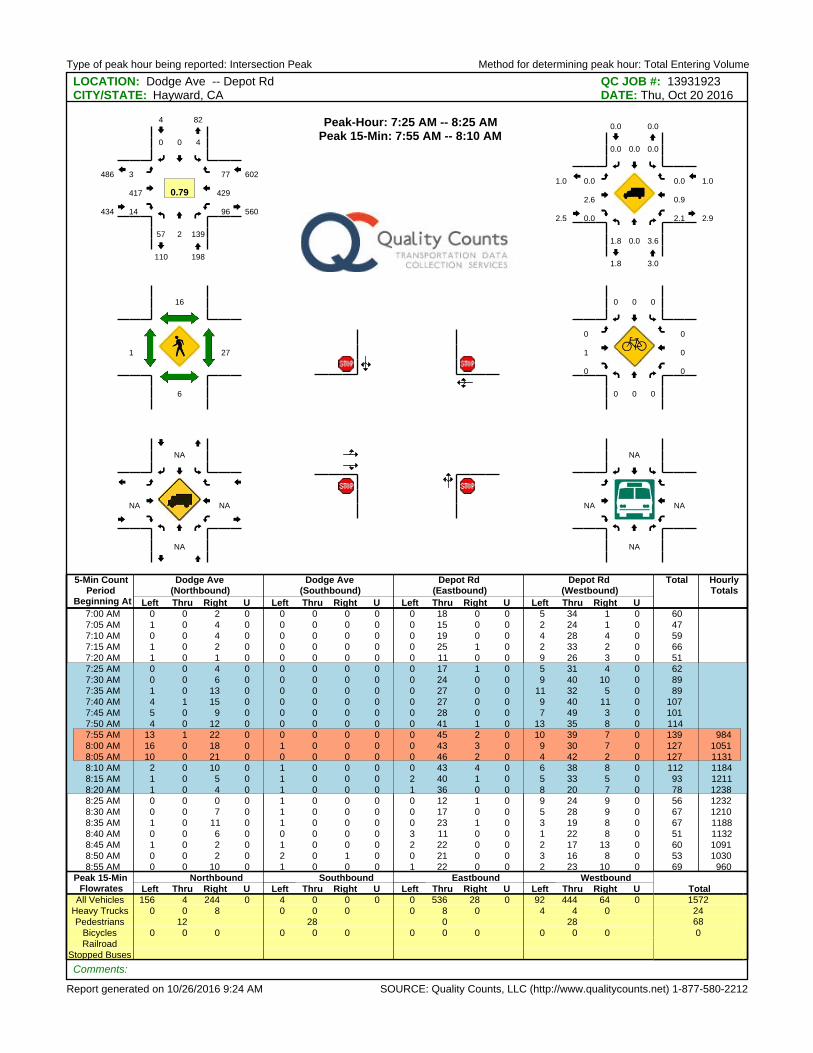
Type of peak hour being reported: Intersection Peak Method for determining peak hour: Total Entering Volume
Report generated on 10/26/2016 9:24 AM SOURCE: Quality Counts, LLC (http://www.qualitycounts.net) 1-877-580-2212
LOCATION: Dodge Ave -- Depot Rd QC JOB #: 13931923CITY/STATE: Hayward, CA DATE: Thu, Oct 20 2016
5-Min CountPeriod
Beginning At
Dodge Ave (Northbound)
Dodge Ave (Southbound)
Depot Rd(Eastbound)
Depot Rd(Westbound)
Total HourlyTotals
Left Thru Right U Left Thru Right U Left Thru Right U Left Thru Right U7:00 AM 0 0 2 0 0 0 0 0 0 18 0 0 5 34 1 0 607:05 AM 1 0 4 0 0 0 0 0 0 15 0 0 2 24 1 0 477:10 AM 0 0 4 0 0 0 0 0 0 19 0 0 4 28 4 0 597:15 AM 1 0 2 0 0 0 0 0 0 25 1 0 2 33 2 0 667:20 AM 1 0 1 0 0 0 0 0 0 11 0 0 9 26 3 0 51
7:25 AM 0 0 4 0 0 0 0 0 0 17 1 0 5 31 4 0 627:30 AM 0 0 6 0 0 0 0 0 0 24 0 0 9 40 10 0 897:35 AM 1 0 13 0 0 0 0 0 0 27 0 0 11 32 5 0 897:40 AM 4 1 15 0 0 0 0 0 0 27 0 0 9 40 11 0 1077:45 AM 5 0 9 0 0 0 0 0 0 28 0 0 7 49 3 0 1017:50 AM 4 0 12 0 0 0 0 0 0 41 1 0 13 35 8 0 114
7:55 AM 13 1 22 0 0 0 0 0 0 45 2 0 10 39 7 0 139 9848:00 AM 16 0 18 0 1 0 0 0 0 43 3 0 9 30 7 0 127 10518:05 AM 10 0 21 0 0 0 0 0 0 46 2 0 4 42 2 0 127 11318:10 AM 2 0 10 0 1 0 0 0 0 43 4 0 6 38 8 0 112 11848:15 AM 1 0 5 0 1 0 0 0 2 40 1 0 5 33 5 0 93 12118:20 AM 1 0 4 0 1 0 0 0 1 36 0 0 8 20 7 0 78 12388:25 AM 0 0 0 0 1 0 0 0 0 12 1 0 9 24 9 0 56 12328:30 AM 0 0 7 0 1 0 0 0 0 17 0 0 5 28 9 0 67 12108:35 AM 1 0 11 0 1 0 0 0 0 23 1 0 3 19 8 0 67 11888:40 AM 0 0 6 0 0 0 0 0 3 11 0 0 1 22 8 0 51 11328:45 AM 1 0 2 0 1 0 0 0 2 22 0 0 2 17 13 0 60 10918:50 AM 0 0 2 0 2 0 1 0 0 21 0 0 3 16 8 0 53 10308:55 AM 0 0 10 0 1 0 0 0 1 22 0 0 2 23 10 0 69 960
Peak 15-Min Northbound Southbound Eastbound WestboundTotalFlowrates Left Thru Right U Left Thru Right U Left Thru Right U Left Thru Right U
All Vehicles 156 4 244 0 4 0 0 0 0 536 28 0 92 444 64 0 1572Heavy Trucks 0 0 8 0 0 0 0 8 0 4 4 0 24Pedestrians 12 28 0 28 68
Bicycles 0 0 0 0 0 0 0 0 0 0 0 0 0Railroad
Stopped Buses
Comments:
Peak-Hour: 7:25 AM -- 8:25 AMPeak 15-Min: 7:55 AM -- 8:10 AM
57 2 139
400
3
417
14 96
429
77
198
4
434
602
82
110
560
486
0.79
1.8 0.0 3.6
0.00.00.0
0.0
2.6
0.0 2.1
0.9
0.0
3.0
0.0
2.5
1.0
0.0
1.8
2.9
1.0
6
16
1 27
0 0 0
000
0
1
0 0
0
0
NA
NA
NA NA
NA
NA
NA NA
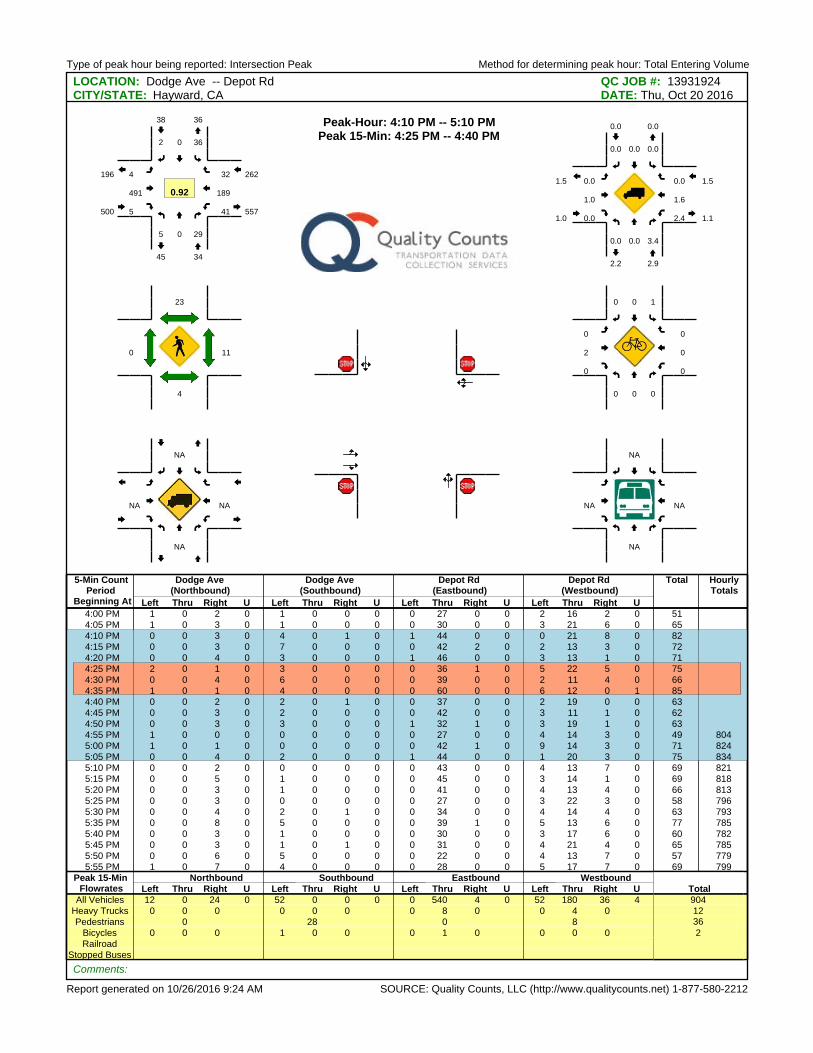
Type of peak hour being reported: Intersection Peak Method for determining peak hour: Total Entering Volume
Report generated on 10/26/2016 9:24 AM SOURCE: Quality Counts, LLC (http://www.qualitycounts.net) 1-877-580-2212
LOCATION: Dodge Ave -- Depot Rd QC JOB #: 13931924CITY/STATE: Hayward, CA DATE: Thu, Oct 20 2016
5-Min CountPeriod
Beginning At
Dodge Ave (Northbound)
Dodge Ave (Southbound)
Depot Rd(Eastbound)
Depot Rd(Westbound)
Total HourlyTotals
Left Thru Right U Left Thru Right U Left Thru Right U Left Thru Right U4:00 PM 1 0 2 0 1 0 0 0 0 27 0 0 2 16 2 0 514:05 PM 1 0 3 0 1 0 0 0 0 30 0 0 3 21 6 0 65
4:10 PM 0 0 3 0 4 0 1 0 1 44 0 0 0 21 8 0 824:15 PM 0 0 3 0 7 0 0 0 0 42 2 0 2 13 3 0 724:20 PM 0 0 4 0 3 0 0 0 1 46 0 0 3 13 1 0 71
4:25 PM 2 0 1 0 3 0 0 0 0 36 1 0 5 22 5 0 754:30 PM 0 0 4 0 6 0 0 0 0 39 0 0 2 11 4 0 664:35 PM 1 0 1 0 4 0 0 0 0 60 0 0 6 12 0 1 854:40 PM 0 0 2 0 2 0 1 0 0 37 0 0 2 19 0 0 634:45 PM 0 0 3 0 2 0 0 0 0 42 0 0 3 11 1 0 624:50 PM 0 0 3 0 3 0 0 0 1 32 1 0 3 19 1 0 634:55 PM 1 0 0 0 0 0 0 0 0 27 0 0 4 14 3 0 49 8045:00 PM 1 0 1 0 0 0 0 0 0 42 1 0 9 14 3 0 71 8245:05 PM 0 0 4 0 2 0 0 0 1 44 0 0 1 20 3 0 75 8345:10 PM 0 0 2 0 0 0 0 0 0 43 0 0 4 13 7 0 69 8215:15 PM 0 0 5 0 1 0 0 0 0 45 0 0 3 14 1 0 69 8185:20 PM 0 0 3 0 1 0 0 0 0 41 0 0 4 13 4 0 66 8135:25 PM 0 0 3 0 0 0 0 0 0 27 0 0 3 22 3 0 58 7965:30 PM 0 0 4 0 2 0 1 0 0 34 0 0 4 14 4 0 63 7935:35 PM 0 0 8 0 5 0 0 0 0 39 1 0 5 13 6 0 77 7855:40 PM 0 0 3 0 1 0 0 0 0 30 0 0 3 17 6 0 60 7825:45 PM 0 0 3 0 1 0 1 0 0 31 0 0 4 21 4 0 65 7855:50 PM 0 0 6 0 5 0 0 0 0 22 0 0 4 13 7 0 57 7795:55 PM 1 0 7 0 4 0 0 0 0 28 0 0 5 17 7 0 69 799
Peak 15-Min Northbound Southbound Eastbound WestboundTotalFlowrates Left Thru Right U Left Thru Right U Left Thru Right U Left Thru Right U
All Vehicles 12 0 24 0 52 0 0 0 0 540 4 0 52 180 36 4 904Heavy Trucks 0 0 0 0 0 0 0 8 0 0 4 0 12Pedestrians 0 28 0 8 36
Bicycles 0 0 0 1 0 0 0 1 0 0 0 0 2Railroad
Stopped Buses
Comments:
Peak-Hour: 4:10 PM -- 5:10 PMPeak 15-Min: 4:25 PM -- 4:40 PM
5 0 29
3602
4
491
5 41
189
32
34
38
500
262
36
45
557
196
0.92
0.0 0.0 3.4
0.00.00.0
0.0
1.0
0.0 2.4
1.6
0.0
2.9
0.0
1.0
1.5
0.0
2.2
1.1
1.5
4
23
0 11
0 0 0
100
0
2
0 0
0
0
NA
NA
NA NA
NA
NA
NA NA
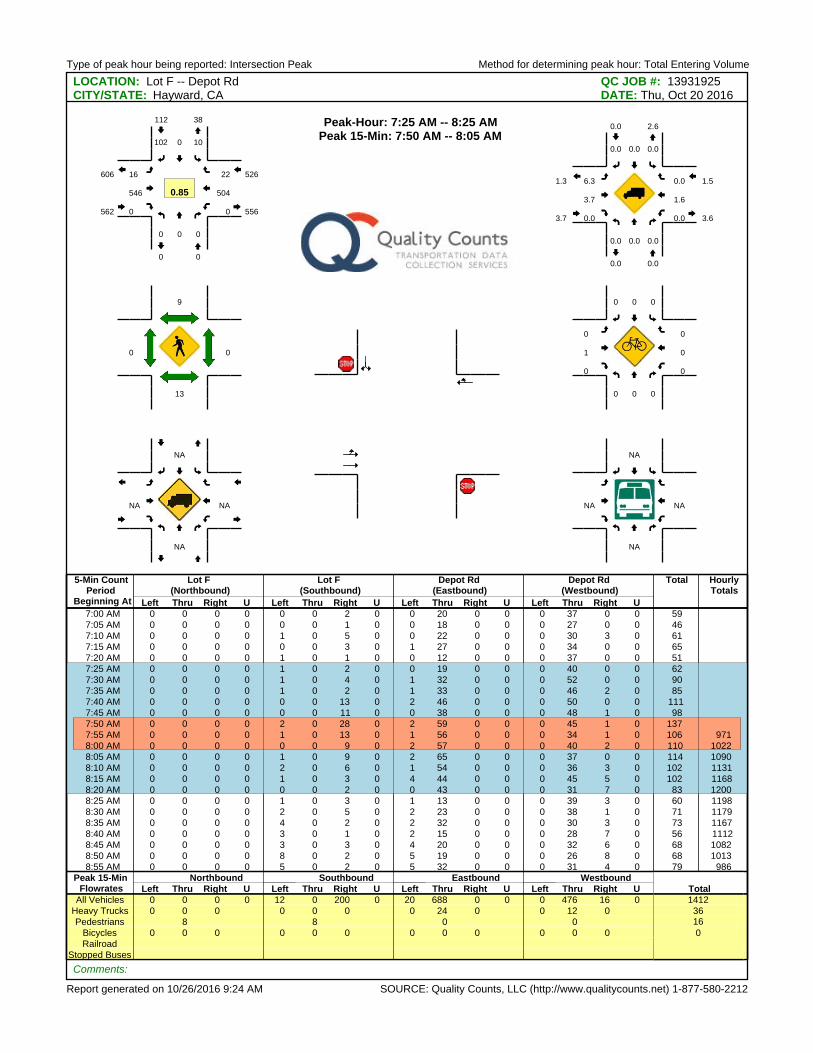
Type of peak hour being reported: Intersection Peak Method for determining peak hour: Total Entering Volume
Report generated on 10/26/2016 9:24 AM SOURCE: Quality Counts, LLC (http://www.qualitycounts.net) 1-877-580-2212
LOCATION: Lot F -- Depot Rd QC JOB #: 13931925CITY/STATE: Hayward, CA DATE: Thu, Oct 20 2016
5-Min CountPeriod
Beginning At
Lot F(Northbound)
Lot F(Southbound)
Depot Rd(Eastbound)
Depot Rd(Westbound)
Total HourlyTotals
Left Thru Right U Left Thru Right U Left Thru Right U Left Thru Right U7:00 AM 0 0 0 0 0 0 2 0 0 20 0 0 0 37 0 0 597:05 AM 0 0 0 0 0 0 1 0 0 18 0 0 0 27 0 0 467:10 AM 0 0 0 0 1 0 5 0 0 22 0 0 0 30 3 0 617:15 AM 0 0 0 0 0 0 3 0 1 27 0 0 0 34 0 0 657:20 AM 0 0 0 0 1 0 1 0 0 12 0 0 0 37 0 0 51
7:25 AM 0 0 0 0 1 0 2 0 0 19 0 0 0 40 0 0 627:30 AM 0 0 0 0 1 0 4 0 1 32 0 0 0 52 0 0 907:35 AM 0 0 0 0 1 0 2 0 1 33 0 0 0 46 2 0 857:40 AM 0 0 0 0 0 0 13 0 2 46 0 0 0 50 0 0 1117:45 AM 0 0 0 0 0 0 11 0 0 38 0 0 0 48 1 0 98
7:50 AM 0 0 0 0 2 0 28 0 2 59 0 0 0 45 1 0 1377:55 AM 0 0 0 0 1 0 13 0 1 56 0 0 0 34 1 0 106 9718:00 AM 0 0 0 0 0 0 9 0 2 57 0 0 0 40 2 0 110 10228:05 AM 0 0 0 0 1 0 9 0 2 65 0 0 0 37 0 0 114 10908:10 AM 0 0 0 0 2 0 6 0 1 54 0 0 0 36 3 0 102 11318:15 AM 0 0 0 0 1 0 3 0 4 44 0 0 0 45 5 0 102 11688:20 AM 0 0 0 0 0 0 2 0 0 43 0 0 0 31 7 0 83 12008:25 AM 0 0 0 0 1 0 3 0 1 13 0 0 0 39 3 0 60 11988:30 AM 0 0 0 0 2 0 5 0 2 23 0 0 0 38 1 0 71 11798:35 AM 0 0 0 0 4 0 2 0 2 32 0 0 0 30 3 0 73 11678:40 AM 0 0 0 0 3 0 1 0 2 15 0 0 0 28 7 0 56 11128:45 AM 0 0 0 0 3 0 3 0 4 20 0 0 0 32 6 0 68 10828:50 AM 0 0 0 0 8 0 2 0 5 19 0 0 0 26 8 0 68 10138:55 AM 0 0 0 0 5 0 2 0 5 32 0 0 0 31 4 0 79 986
Peak 15-Min Northbound Southbound Eastbound WestboundTotalFlowrates Left Thru Right U Left Thru Right U Left Thru Right U Left Thru Right U
All Vehicles 0 0 0 0 12 0 200 0 20 688 0 0 0 476 16 0 1412Heavy Trucks 0 0 0 0 0 0 0 24 0 0 12 0 36Pedestrians 8 8 0 0 16
Bicycles 0 0 0 0 0 0 0 0 0 0 0 0 0Railroad
Stopped Buses
Comments:
Peak-Hour: 7:25 AM -- 8:25 AMPeak 15-Min: 7:50 AM -- 8:05 AM
0 0 0
100102
16
546
0 0
504
22
0
112
562
526
38
0
556
606
0.85
0.0 0.0 0.0
0.00.00.0
6.3
3.7
0.0 0.0
1.6
0.0
0.0
0.0
3.7
1.5
2.6
0.0
3.6
1.3
13
9
0 0
0 0 0
000
0
1
0 0
0
0
NA
NA
NA NA
NA
NA
NA NA
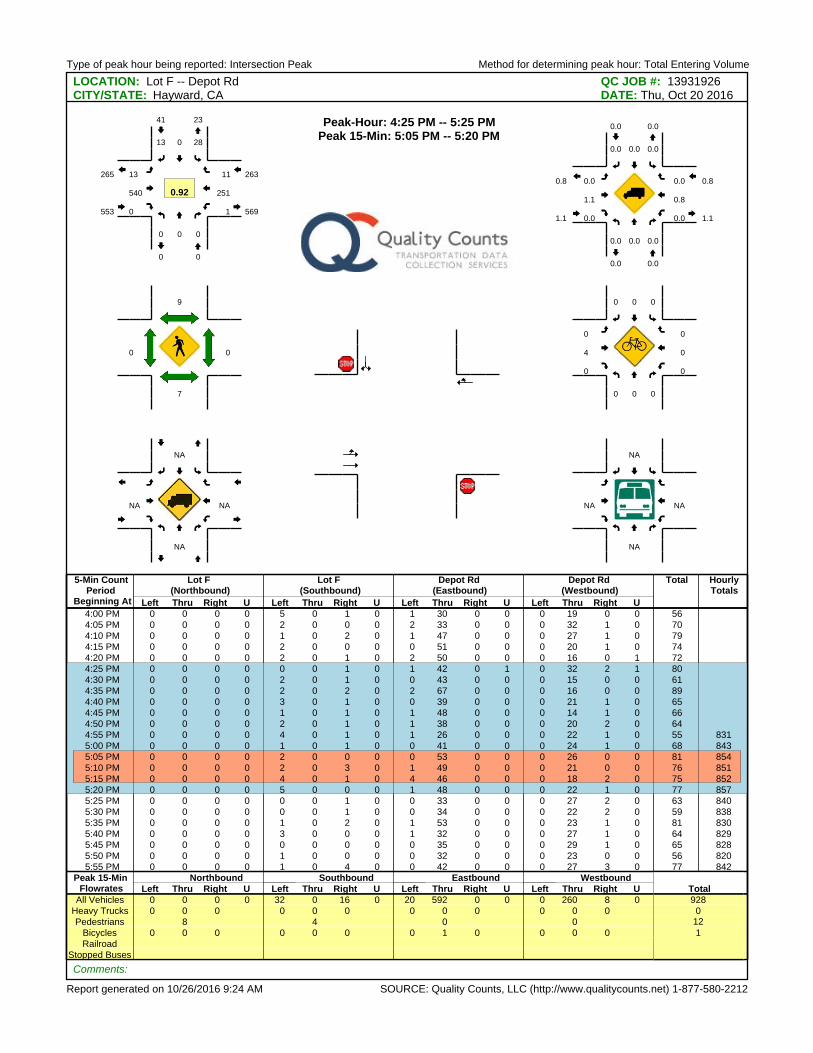
Type of peak hour being reported: Intersection Peak Method for determining peak hour: Total Entering Volume
Report generated on 10/26/2016 9:24 AM SOURCE: Quality Counts, LLC (http://www.qualitycounts.net) 1-877-580-2212
LOCATION: Lot F -- Depot Rd QC JOB #: 13931926CITY/STATE: Hayward, CA DATE: Thu, Oct 20 2016
5-Min CountPeriod
Beginning At
Lot F(Northbound)
Lot F(Southbound)
Depot Rd(Eastbound)
Depot Rd(Westbound)
Total HourlyTotals
Left Thru Right U Left Thru Right U Left Thru Right U Left Thru Right U4:00 PM 0 0 0 0 5 0 1 0 1 30 0 0 0 19 0 0 564:05 PM 0 0 0 0 2 0 0 0 2 33 0 0 0 32 1 0 704:10 PM 0 0 0 0 1 0 2 0 1 47 0 0 0 27 1 0 794:15 PM 0 0 0 0 2 0 0 0 0 51 0 0 0 20 1 0 744:20 PM 0 0 0 0 2 0 1 0 2 50 0 0 0 16 0 1 72
4:25 PM 0 0 0 0 0 0 1 0 1 42 0 1 0 32 2 1 804:30 PM 0 0 0 0 2 0 1 0 0 43 0 0 0 15 0 0 614:35 PM 0 0 0 0 2 0 2 0 2 67 0 0 0 16 0 0 894:40 PM 0 0 0 0 3 0 1 0 0 39 0 0 0 21 1 0 654:45 PM 0 0 0 0 1 0 1 0 1 48 0 0 0 14 1 0 664:50 PM 0 0 0 0 2 0 1 0 1 38 0 0 0 20 2 0 644:55 PM 0 0 0 0 4 0 1 0 1 26 0 0 0 22 1 0 55 8315:00 PM 0 0 0 0 1 0 1 0 0 41 0 0 0 24 1 0 68 843
5:05 PM 0 0 0 0 2 0 0 0 0 53 0 0 0 26 0 0 81 8545:10 PM 0 0 0 0 2 0 3 0 1 49 0 0 0 21 0 0 76 8515:15 PM 0 0 0 0 4 0 1 0 4 46 0 0 0 18 2 0 75 8525:20 PM 0 0 0 0 5 0 0 0 1 48 0 0 0 22 1 0 77 8575:25 PM 0 0 0 0 0 0 1 0 0 33 0 0 0 27 2 0 63 8405:30 PM 0 0 0 0 0 0 1 0 0 34 0 0 0 22 2 0 59 8385:35 PM 0 0 0 0 1 0 2 0 1 53 0 0 0 23 1 0 81 8305:40 PM 0 0 0 0 3 0 0 0 1 32 0 0 0 27 1 0 64 8295:45 PM 0 0 0 0 0 0 0 0 0 35 0 0 0 29 1 0 65 8285:50 PM 0 0 0 0 1 0 0 0 0 32 0 0 0 23 0 0 56 8205:55 PM 0 0 0 0 1 0 4 0 0 42 0 0 0 27 3 0 77 842
Peak 15-Min Northbound Southbound Eastbound WestboundTotalFlowrates Left Thru Right U Left Thru Right U Left Thru Right U Left Thru Right U
All Vehicles 0 0 0 0 32 0 16 0 20 592 0 0 0 260 8 0 928Heavy Trucks 0 0 0 0 0 0 0 0 0 0 0 0 0Pedestrians 8 4 0 0 12
Bicycles 0 0 0 0 0 0 0 1 0 0 0 0 1Railroad
Stopped Buses
Comments:
Peak-Hour: 4:25 PM -- 5:25 PMPeak 15-Min: 5:05 PM -- 5:20 PM
0 0 0
28013
13
540
0 1
251
11
0
41
553
263
23
0
569
265
0.92
0.0 0.0 0.0
0.00.00.0
0.0
1.1
0.0 0.0
0.8
0.0
0.0
0.0
1.1
0.8
0.0
0.0
1.1
0.8
7
9
0 0
0 0 0
000
0
4
0 0
0
0
NA
NA
NA NA
NA
NA
NA NA
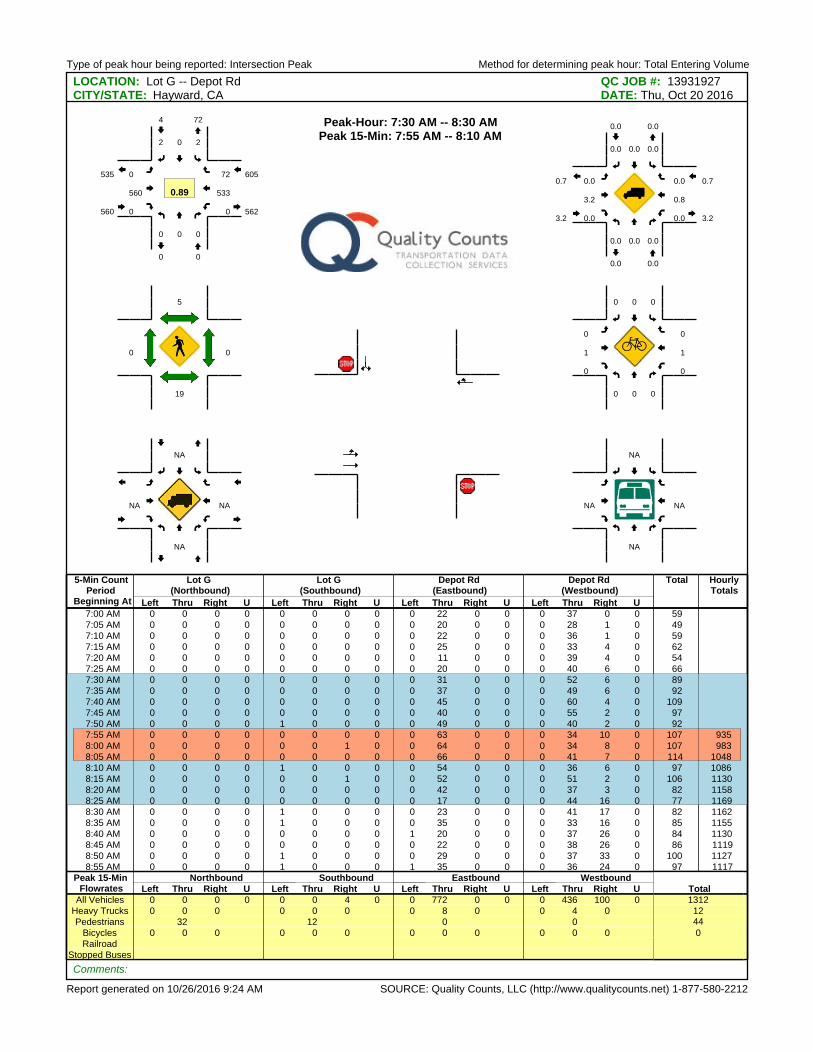
Type of peak hour being reported: Intersection Peak Method for determining peak hour: Total Entering Volume
Report generated on 10/26/2016 9:24 AM SOURCE: Quality Counts, LLC (http://www.qualitycounts.net) 1-877-580-2212
LOCATION: Lot G -- Depot Rd QC JOB #: 13931927CITY/STATE: Hayward, CA DATE: Thu, Oct 20 2016
5-Min CountPeriod
Beginning At
Lot G(Northbound)
Lot G(Southbound)
Depot Rd(Eastbound)
Depot Rd(Westbound)
Total HourlyTotals
Left Thru Right U Left Thru Right U Left Thru Right U Left Thru Right U7:00 AM 0 0 0 0 0 0 0 0 0 22 0 0 0 37 0 0 597:05 AM 0 0 0 0 0 0 0 0 0 20 0 0 0 28 1 0 497:10 AM 0 0 0 0 0 0 0 0 0 22 0 0 0 36 1 0 597:15 AM 0 0 0 0 0 0 0 0 0 25 0 0 0 33 4 0 627:20 AM 0 0 0 0 0 0 0 0 0 11 0 0 0 39 4 0 547:25 AM 0 0 0 0 0 0 0 0 0 20 0 0 0 40 6 0 66
7:30 AM 0 0 0 0 0 0 0 0 0 31 0 0 0 52 6 0 897:35 AM 0 0 0 0 0 0 0 0 0 37 0 0 0 49 6 0 927:40 AM 0 0 0 0 0 0 0 0 0 45 0 0 0 60 4 0 1097:45 AM 0 0 0 0 0 0 0 0 0 40 0 0 0 55 2 0 977:50 AM 0 0 0 0 1 0 0 0 0 49 0 0 0 40 2 0 92
7:55 AM 0 0 0 0 0 0 0 0 0 63 0 0 0 34 10 0 107 9358:00 AM 0 0 0 0 0 0 1 0 0 64 0 0 0 34 8 0 107 9838:05 AM 0 0 0 0 0 0 0 0 0 66 0 0 0 41 7 0 114 10488:10 AM 0 0 0 0 1 0 0 0 0 54 0 0 0 36 6 0 97 10868:15 AM 0 0 0 0 0 0 1 0 0 52 0 0 0 51 2 0 106 11308:20 AM 0 0 0 0 0 0 0 0 0 42 0 0 0 37 3 0 82 11588:25 AM 0 0 0 0 0 0 0 0 0 17 0 0 0 44 16 0 77 11698:30 AM 0 0 0 0 1 0 0 0 0 23 0 0 0 41 17 0 82 11628:35 AM 0 0 0 0 1 0 0 0 0 35 0 0 0 33 16 0 85 11558:40 AM 0 0 0 0 0 0 0 0 1 20 0 0 0 37 26 0 84 11308:45 AM 0 0 0 0 0 0 0 0 0 22 0 0 0 38 26 0 86 11198:50 AM 0 0 0 0 1 0 0 0 0 29 0 0 0 37 33 0 100 11278:55 AM 0 0 0 0 1 0 0 0 1 35 0 0 0 36 24 0 97 1117
Peak 15-Min Northbound Southbound Eastbound WestboundTotalFlowrates Left Thru Right U Left Thru Right U Left Thru Right U Left Thru Right U
All Vehicles 0 0 0 0 0 0 4 0 0 772 0 0 0 436 100 0 1312Heavy Trucks 0 0 0 0 0 0 0 8 0 0 4 0 12Pedestrians 32 12 0 0 44
Bicycles 0 0 0 0 0 0 0 0 0 0 0 0 0Railroad
Stopped Buses
Comments:
Peak-Hour: 7:30 AM -- 8:30 AMPeak 15-Min: 7:55 AM -- 8:10 AM
0 0 0
202
0
560
0 0
533
72
0
4
560
605
72
0
562
535
0.89
0.0 0.0 0.0
0.00.00.0
0.0
3.2
0.0 0.0
0.8
0.0
0.0
0.0
3.2
0.7
0.0
0.0
3.2
0.7
19
5
0 0
0 0 0
000
0
1
0 0
1
0
NA
NA
NA NA
NA
NA
NA NA
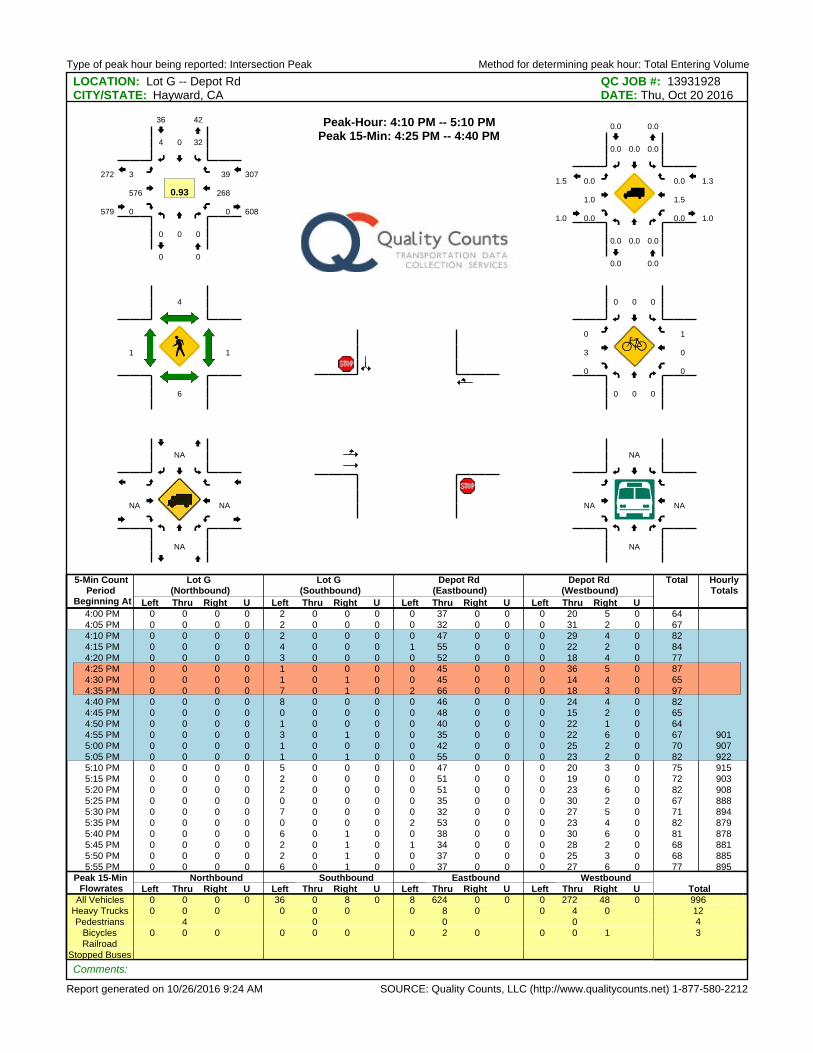
Type of peak hour being reported: Intersection Peak Method for determining peak hour: Total Entering Volume
Report generated on 10/26/2016 9:24 AM SOURCE: Quality Counts, LLC (http://www.qualitycounts.net) 1-877-580-2212
LOCATION: Lot G -- Depot Rd QC JOB #: 13931928CITY/STATE: Hayward, CA DATE: Thu, Oct 20 2016
5-Min CountPeriod
Beginning At
Lot G(Northbound)
Lot G(Southbound)
Depot Rd(Eastbound)
Depot Rd(Westbound)
Total HourlyTotals
Left Thru Right U Left Thru Right U Left Thru Right U Left Thru Right U4:00 PM 0 0 0 0 2 0 0 0 0 37 0 0 0 20 5 0 644:05 PM 0 0 0 0 2 0 0 0 0 32 0 0 0 31 2 0 67
4:10 PM 0 0 0 0 2 0 0 0 0 47 0 0 0 29 4 0 824:15 PM 0 0 0 0 4 0 0 0 1 55 0 0 0 22 2 0 844:20 PM 0 0 0 0 3 0 0 0 0 52 0 0 0 18 4 0 77
4:25 PM 0 0 0 0 1 0 0 0 0 45 0 0 0 36 5 0 874:30 PM 0 0 0 0 1 0 1 0 0 45 0 0 0 14 4 0 654:35 PM 0 0 0 0 7 0 1 0 2 66 0 0 0 18 3 0 974:40 PM 0 0 0 0 8 0 0 0 0 46 0 0 0 24 4 0 824:45 PM 0 0 0 0 0 0 0 0 0 48 0 0 0 15 2 0 654:50 PM 0 0 0 0 1 0 0 0 0 40 0 0 0 22 1 0 644:55 PM 0 0 0 0 3 0 1 0 0 35 0 0 0 22 6 0 67 9015:00 PM 0 0 0 0 1 0 0 0 0 42 0 0 0 25 2 0 70 9075:05 PM 0 0 0 0 1 0 1 0 0 55 0 0 0 23 2 0 82 9225:10 PM 0 0 0 0 5 0 0 0 0 47 0 0 0 20 3 0 75 9155:15 PM 0 0 0 0 2 0 0 0 0 51 0 0 0 19 0 0 72 9035:20 PM 0 0 0 0 2 0 0 0 0 51 0 0 0 23 6 0 82 9085:25 PM 0 0 0 0 0 0 0 0 0 35 0 0 0 30 2 0 67 8885:30 PM 0 0 0 0 7 0 0 0 0 32 0 0 0 27 5 0 71 8945:35 PM 0 0 0 0 0 0 0 0 2 53 0 0 0 23 4 0 82 8795:40 PM 0 0 0 0 6 0 1 0 0 38 0 0 0 30 6 0 81 8785:45 PM 0 0 0 0 2 0 1 0 1 34 0 0 0 28 2 0 68 8815:50 PM 0 0 0 0 2 0 1 0 0 37 0 0 0 25 3 0 68 8855:55 PM 0 0 0 0 6 0 1 0 0 37 0 0 0 27 6 0 77 895
Peak 15-Min Northbound Southbound Eastbound WestboundTotalFlowrates Left Thru Right U Left Thru Right U Left Thru Right U Left Thru Right U
All Vehicles 0 0 0 0 36 0 8 0 8 624 0 0 0 272 48 0 996Heavy Trucks 0 0 0 0 0 0 0 8 0 0 4 0 12Pedestrians 4 0 0 0 4
Bicycles 0 0 0 0 0 0 0 2 0 0 0 1 3Railroad
Stopped Buses
Comments:
Peak-Hour: 4:10 PM -- 5:10 PMPeak 15-Min: 4:25 PM -- 4:40 PM
0 0 0
3204
3
576
0 0
268
39
0
36
579
307
42
0
608
272
0.93
0.0 0.0 0.0
0.00.00.0
0.0
1.0
0.0 0.0
1.5
0.0
0.0
0.0
1.0
1.3
0.0
0.0
1.0
1.5
6
4
1 1
0 0 0
000
0
3
0 0
0
1
NA
NA
NA NA
NA
NA
NA NA
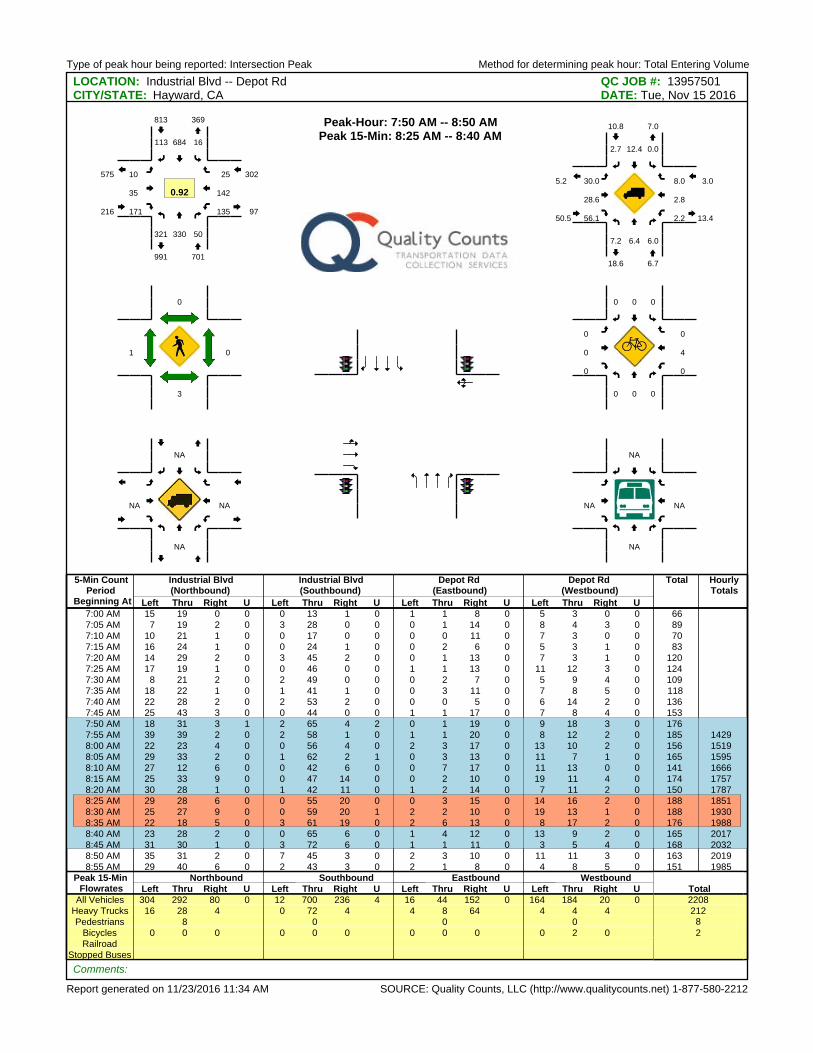
Type of peak hour being reported: Intersection Peak Method for determining peak hour: Total Entering Volume
Report generated on 11/23/2016 11:34 AM SOURCE: Quality Counts, LLC (http://www.qualitycounts.net) 1-877-580-2212
LOCATION: Industrial Blvd -- Depot Rd QC JOB #: 13957501CITY/STATE: Hayward, CA DATE: Tue, Nov 15 2016
5-Min CountPeriod
Beginning At
Industrial Blvd(Northbound)
Industrial Blvd(Southbound)
Depot Rd(Eastbound)
Depot Rd(Westbound)
Total HourlyTotals
Left Thru Right U Left Thru Right U Left Thru Right U Left Thru Right U7:00 AM 15 19 0 0 0 13 1 0 1 1 8 0 5 3 0 0 667:05 AM 7 19 2 0 3 28 0 0 0 1 14 0 8 4 3 0 897:10 AM 10 21 1 0 0 17 0 0 0 0 11 0 7 3 0 0 707:15 AM 16 24 1 0 0 24 1 0 0 2 6 0 5 3 1 0 837:20 AM 14 29 2 0 3 45 2 0 0 1 13 0 7 3 1 0 1207:25 AM 17 19 1 0 0 46 0 0 1 1 13 0 11 12 3 0 1247:30 AM 8 21 2 0 2 49 0 0 0 2 7 0 5 9 4 0 1097:35 AM 18 22 1 0 1 41 1 0 0 3 11 0 7 8 5 0 1187:40 AM 22 28 2 0 2 53 2 0 0 0 5 0 6 14 2 0 1367:45 AM 25 43 3 0 0 44 0 0 1 1 17 0 7 8 4 0 153
7:50 AM 18 31 3 1 2 65 4 2 0 1 19 0 9 18 3 0 1767:55 AM 39 39 2 0 2 58 1 0 1 1 20 0 8 12 2 0 185 14298:00 AM 22 23 4 0 0 56 4 0 2 3 17 0 13 10 2 0 156 15198:05 AM 29 33 2 0 1 62 2 1 0 3 13 0 11 7 1 0 165 15958:10 AM 27 12 6 0 0 42 6 0 0 7 17 0 11 13 0 0 141 16668:15 AM 25 33 9 0 0 47 14 0 0 2 10 0 19 11 4 0 174 17578:20 AM 30 28 1 0 1 42 11 0 1 2 14 0 7 11 2 0 150 1787
8:25 AM 29 28 6 0 0 55 20 0 0 3 15 0 14 16 2 0 188 18518:30 AM 25 27 9 0 0 59 20 1 2 2 10 0 19 13 1 0 188 19308:35 AM 22 18 5 0 3 61 19 0 2 6 13 0 8 17 2 0 176 19888:40 AM 23 28 2 0 0 65 6 0 1 4 12 0 13 9 2 0 165 20178:45 AM 31 30 1 0 3 72 6 0 1 1 11 0 3 5 4 0 168 20328:50 AM 35 31 2 0 7 45 3 0 2 3 10 0 11 11 3 0 163 20198:55 AM 29 40 6 0 2 43 3 0 2 1 8 0 4 8 5 0 151 1985
Peak 15-Min Northbound Southbound Eastbound WestboundTotalFlowrates Left Thru Right U Left Thru Right U Left Thru Right U Left Thru Right U
All Vehicles 304 292 80 0 12 700 236 4 16 44 152 0 164 184 20 0 2208Heavy Trucks 16 28 4 0 72 4 4 8 64 4 4 4 212Pedestrians 8 0 0 0 8
Bicycles 0 0 0 0 0 0 0 0 0 0 2 0 2Railroad
Stopped Buses
Comments:
Peak-Hour: 7:50 AM -- 8:50 AMPeak 15-Min: 8:25 AM -- 8:40 AM
321 330 50
16684113
10
35
171 135
142
25
701
813
216
302
369
991
97
575
0.92
7.2 6.4 6.0
0.012.42.7
30.0
28.6
56.1 2.2
2.8
8.0
6.7
10.8
50.5
3.0
7.0
18.6
13.4
5.2
3
0
1 0
0 0 0
000
0
0
0 0
4
0
NA
NA
NA NA
NA
NA
NA NA
Type of peak hour being reported: Intersection Peak Method for determining peak hour: Total Entering Volume
Report generated on 11/23/2016 11:34 AM SOURCE: Quality Counts, LLC (http://www.qualitycounts.net) 1-877-580-2212
LOCATION: Industrial Blvd -- Depot Rd QC JOB #: 13957502CITY/STATE: Hayward, CA DATE: Tue, Nov 15 2016
5-Min CountPeriod
Beginning At
Industrial Blvd(Northbound)
Industrial Blvd(Southbound)
Depot Rd(Eastbound)
Depot Rd(Westbound)
Total HourlyTotals
Left Thru Right U Left Thru Right U Left Thru Right U Left Thru Right U4:00 PM 5 38 12 0 2 26 1 0 5 7 17 0 6 2 5 0 1264:05 PM 11 45 13 0 5 39 0 0 6 8 20 0 11 2 2 0 1624:10 PM 13 34 10 0 7 37 1 0 2 9 24 0 9 6 2 0 1544:15 PM 16 28 12 1 9 41 0 0 3 7 18 0 8 1 3 0 1474:20 PM 4 50 11 1 3 31 1 0 2 2 24 0 7 2 2 0 1404:25 PM 18 35 7 0 4 31 0 0 1 6 17 0 2 3 2 0 1264:30 PM 6 40 5 1 1 44 0 0 1 6 21 0 5 3 1 0 1344:35 PM 10 48 11 0 2 36 1 1 4 16 26 0 1 3 4 0 1634:40 PM 9 44 12 1 2 36 2 0 7 22 33 0 4 2 2 0 1764:45 PM 11 44 11 1 3 26 0 0 2 5 19 0 5 3 0 0 1304:50 PM 6 40 15 0 1 30 0 1 6 8 15 0 5 6 2 0 135
4:55 PM 20 65 14 0 2 26 0 0 6 13 19 0 3 2 0 0 170 17635:00 PM 8 43 12 1 1 32 0 0 4 17 16 0 2 4 3 0 143 17805:05 PM 18 59 12 0 4 36 0 0 3 12 30 0 3 1 0 0 178 17965:10 PM 6 38 10 0 3 40 1 0 3 16 17 0 4 0 1 0 139 17815:15 PM 7 49 8 1 6 31 1 0 9 13 23 0 3 3 1 0 155 17895:20 PM 11 33 8 0 4 28 2 0 5 8 19 0 4 2 2 0 126 17755:25 PM 5 28 7 1 2 28 1 1 6 20 21 0 1 1 0 0 122 1771
5:30 PM 6 35 10 1 7 47 0 0 8 14 26 0 6 2 3 0 165 18025:35 PM 3 35 6 1 1 42 1 0 9 29 33 0 6 2 1 0 169 18085:40 PM 8 46 8 2 3 28 2 0 5 23 28 0 5 4 2 0 164 17965:45 PM 10 56 11 2 3 28 0 1 7 11 20 0 5 4 1 0 159 18255:50 PM 6 39 17 1 5 36 1 0 5 21 17 0 3 3 2 0 156 18465:55 PM 6 34 7 3 5 30 1 0 8 13 29 0 7 3 0 0 146 1822
Peak 15-Min Northbound Southbound Eastbound WestboundTotalFlowrates Left Thru Right U Left Thru Right U Left Thru Right U Left Thru Right U
All Vehicles 68 464 96 16 44 468 12 0 88 264 348 0 68 32 24 0 1992Heavy Trucks 36 56 4 0 12 8 8 0 16 4 0 4 148Pedestrians 0 0 16 0 16
Bicycles 0 0 0 0 0 0 0 0 0 0 0 0 0Railroad
Stopped Buses
Comments:
Peak-Hour: 4:55 PM -- 5:55 PMPeak 15-Min: 5:30 PM -- 5:45 PM
118 526 123
434029
70
197
269 45
28
16
767
454
536
89
614
726
361
145
0.93
39.8 14.4 7.3
2.34.522.2
8.6
2.0
11.5 6.7
3.6
18.8
17.2
4.6
7.6
7.9
13.8
7.2
3.9
34.5
9
0
4 1
0 0 0
000
0
0
0 0
0
0
NA
NA
NA NA
NA
NA
NA NA
Type of peak hour being reported: Intersection Peak Method for determining peak hour: Total Entering Volume
Report generated on 11/23/2016 11:34 AM SOURCE: Quality Counts, LLC (http://www.qualitycounts.net) 1-877-580-2212
LOCATION: Industrial Blvd -- SR 92 WB/Cryer St QC JOB #: 13957503CITY/STATE: Hayward, CA DATE: Tue, Nov 15 2016
5-Min CountPeriod
Beginning At
Industrial Blvd(Northbound)
Industrial Blvd(Southbound)
SR 92 WB/Cryer St(Eastbound)
SR 92 WB/Cryer St(Westbound)
Total HourlyTotals
Left Thru Right U Left Thru Right U Left Thru Right U Left Thru Right U7:00 AM 23 33 0 0 0 29 8 0 11 1 4 1 1 4 0 0 1157:05 AM 30 37 0 0 0 27 9 0 17 0 9 0 3 0 0 0 1327:10 AM 30 31 1 0 0 50 18 0 14 0 7 0 3 3 1 0 1587:15 AM 41 38 0 0 0 31 15 0 12 0 4 0 2 3 0 0 1467:20 AM 36 50 1 0 0 40 15 0 15 0 3 0 3 4 3 0 1707:25 AM 39 35 0 0 0 43 20 0 6 0 4 0 6 3 0 0 1567:30 AM 45 37 1 0 1 51 26 0 4 0 3 0 8 4 0 0 1807:35 AM 46 56 1 0 1 48 36 0 7 0 4 0 7 10 0 0 2167:40 AM 50 51 0 0 0 41 26 0 7 0 2 0 3 5 1 0 1867:45 AM 43 79 3 0 0 55 33 0 5 0 3 0 9 7 2 0 2397:50 AM 60 78 2 0 0 29 26 0 4 7 2 0 8 7 1 0 2247:55 AM 47 90 1 0 0 53 32 0 4 0 1 0 4 6 1 0 239 2161
8:00 AM 52 70 1 0 1 36 41 0 2 0 1 0 7 7 1 0 219 22658:05 AM 61 62 7 0 1 37 27 0 9 1 3 0 2 9 0 0 219 23528:10 AM 37 60 7 0 0 39 31 0 3 1 0 0 3 10 1 0 192 23868:15 AM 36 89 9 0 0 52 35 0 3 0 1 0 5 9 0 0 239 24798:20 AM 30 72 15 0 0 43 31 0 7 0 4 0 15 24 1 0 242 25518:25 AM 42 102 19 0 1 27 20 0 4 8 1 0 8 23 0 0 255 26508:30 AM 33 74 17 0 0 53 31 0 4 1 4 0 8 17 3 0 245 27158:35 AM 13 63 15 0 0 60 30 0 1 1 1 0 8 17 0 0 209 2708
8:40 AM 40 90 12 0 0 45 35 0 1 0 1 0 12 9 1 0 246 27688:45 AM 43 78 17 0 0 62 25 0 3 0 3 0 4 12 0 0 247 27768:50 AM 34 85 21 0 1 63 19 0 3 0 0 0 21 4 1 0 252 28048:55 AM 48 64 18 0 0 49 29 0 2 0 1 0 20 8 2 0 241 2806
Peak 15-Min Northbound Southbound Eastbound WestboundTotalFlowrates Left Thru Right U Left Thru Right U Left Thru Right U Left Thru Right U
All Vehicles 468 1012 200 0 4 680 316 0 28 0 16 0 148 100 8 0 2980Heavy Trucks 44 52 4 0 120 40 0 0 0 0 0 0 260Pedestrians 0 0 0 0 0
Bicycles 0 0 1 0 0 0 0 0 0 0 0 0 1Railroad
Stopped Buses
Comments:
Peak-Hour: 8:00 AM -- 9:00 AMPeak 15-Min: 8:40 AM -- 8:55 AM
469 909 158
4566354
42
12
20 113
149
10
1536
924
74
272
961
699
174
972
0.94
6.4 5.3 1.9
0.026.19.9
16.7
8.3
15.0 0.9
1.3
10.0
5.3
19.8
14.9
1.5
5.8
21.7
2.3
6.9
0
0
1 0
0 1 1
000
0
0
0 0
0
1
NA
NA
NA NA
NA
NA
NA NA
Type of peak hour being reported: Intersection Peak Method for determining peak hour: Total Entering Volume
Report generated on 11/23/2016 11:34 AM SOURCE: Quality Counts, LLC (http://www.qualitycounts.net) 1-877-580-2212
LOCATION: Industrial Blvd -- SR 92 WB/Cryer St QC JOB #: 13957504CITY/STATE: Hayward, CA DATE: Tue, Nov 15 2016
5-Min CountPeriod
Beginning At
Industrial Blvd(Northbound)
Industrial Blvd(Southbound)
SR 92 WB/Cryer St(Eastbound)
SR 92 WB/Cryer St(Westbound)
Total HourlyTotals
Left Thru Right U Left Thru Right U Left Thru Right U Left Thru Right U4:00 PM 25 49 11 0 2 52 5 0 15 2 6 0 1 0 0 0 1684:05 PM 22 66 6 0 2 70 6 0 15 2 8 0 5 2 1 0 2054:10 PM 25 56 3 0 0 86 6 0 15 5 12 0 11 0 1 0 2204:15 PM 13 37 6 0 1 55 12 0 21 2 10 1 13 0 0 0 1714:20 PM 16 61 3 0 1 71 8 0 17 3 11 0 5 0 0 0 1964:25 PM 29 40 11 0 0 58 5 0 14 2 12 0 7 1 0 0 1794:30 PM 18 42 8 0 1 67 12 0 14 0 6 0 5 1 1 0 1754:35 PM 20 71 12 0 1 79 10 0 13 4 8 0 7 1 0 0 2264:40 PM 19 69 5 0 2 71 11 0 12 2 8 0 6 0 0 0 2054:45 PM 19 62 9 0 2 81 8 0 9 1 13 0 3 2 2 0 2114:50 PM 31 69 5 0 1 51 7 0 10 1 12 0 4 1 0 0 1924:55 PM 21 68 8 0 0 64 4 0 12 2 9 0 3 0 0 0 191 2339
5:00 PM 14 74 13 0 0 66 5 0 22 1 6 0 2 1 1 0 205 23765:05 PM 24 63 5 0 0 67 6 0 21 2 5 0 1 1 1 0 196 23675:10 PM 23 60 6 0 2 73 12 0 14 2 8 0 3 2 0 0 205 23525:15 PM 34 55 10 0 1 78 9 0 13 1 7 0 5 1 1 0 215 23965:20 PM 27 49 8 0 1 73 6 0 14 1 7 0 2 4 0 0 192 23925:25 PM 21 48 8 0 1 65 8 0 10 6 6 0 1 0 1 0 175 23885:30 PM 30 43 8 0 1 68 13 0 11 1 5 0 3 0 0 0 183 2396
5:35 PM 18 57 6 0 0 105 10 0 18 5 10 0 1 1 0 0 231 24015:40 PM 36 59 12 0 0 92 11 0 13 1 16 0 3 2 2 0 247 24435:45 PM 22 61 8 0 0 76 9 0 19 2 9 0 6 2 0 0 214 24465:50 PM 28 56 8 0 2 88 7 0 15 4 12 0 4 0 0 0 224 24785:55 PM 30 52 5 0 0 65 5 0 16 5 10 0 3 0 1 0 192 2479
Peak 15-Min Northbound Southbound Eastbound WestboundTotalFlowrates Left Thru Right U Left Thru Right U Left Thru Right U Left Thru Right U
All Vehicles 304 708 104 0 0 1092 120 0 200 32 140 0 40 20 8 0 2768Heavy Trucks 12 100 0 0 24 4 36 0 28 0 0 0 204Pedestrians 0 0 0 0 0
Bicycles 0 0 0 1 0 0 0 0 0 0 0 1 2Railroad
Stopped Buses
Comments:
Peak-Hour: 5:00 PM -- 6:00 PMPeak 15-Min: 5:35 PM -- 5:50 PM
307 677 97
8916101
186
31
101 34
14
7
1081
1025
318
55
870
1051
136
422
0.90
3.9 14.3 0.0
0.05.15.9
15.1
3.2
18.8 0.0
7.1
28.6
10.1
5.2
15.1
5.5
14.6
6.3
0.7
4.5
0
0
0 0
0 0 0
110
0
0
0 0
0
1
NA
NA
NA NA
NA
NA
NA NA
Type of peak hour being reported: Intersection Peak Method for determining peak hour: Total Entering Volume
Report generated on 11/23/2016 11:34 AM SOURCE: Quality Counts, LLC (http://www.qualitycounts.net) 1-877-580-2212
LOCATION: Industrial Blvd -- SR 92 EB/Sleepy Hollow QC JOB #: 13957505CITY/STATE: Hayward, CA DATE: Tue, Nov 15 2016
5-Min CountPeriod
Beginning At
Industrial Blvd(Northbound)
Industrial Blvd(Southbound)
SR 92 EB/Sleepy Hollow(Eastbound)
SR 92 EB/Sleepy Hollow(Westbound)
Total HourlyTotals
Left Thru Right U Left Thru Right U Left Thru Right U Left Thru Right U7:00 AM 3 45 0 0 0 18 17 0 6 0 9 0 0 4 7 0 1097:05 AM 7 58 0 0 1 31 16 0 6 0 7 0 0 2 4 0 1327:10 AM 7 54 0 0 0 30 21 0 5 0 10 0 1 3 2 0 1337:15 AM 3 78 0 0 2 26 13 0 5 0 13 0 0 0 7 0 1477:20 AM 7 66 0 0 2 22 17 0 7 0 16 0 1 2 7 0 1477:25 AM 7 61 0 0 2 38 15 0 4 0 8 0 0 1 5 0 1417:30 AM 2 84 0 0 2 42 27 0 6 0 18 0 0 0 10 0 1917:35 AM 4 72 0 0 0 35 11 0 3 0 21 0 4 2 9 0 1617:40 AM 8 84 1 0 1 39 20 0 12 0 27 0 2 4 13 0 2117:45 AM 8 111 1 0 3 39 8 0 16 0 15 0 2 1 7 0 2117:50 AM 7 118 0 0 0 41 14 0 9 1 19 0 2 2 7 0 220
7:55 AM 8 106 0 0 0 39 14 0 15 2 25 0 3 4 17 0 233 20368:00 AM 8 128 0 0 1 27 17 0 8 1 28 0 4 4 6 0 232 21598:05 AM 7 86 1 0 2 25 16 0 11 0 22 0 2 1 11 0 184 22118:10 AM 5 111 1 0 1 32 18 0 8 1 15 0 3 1 9 0 205 22838:15 AM 6 105 0 0 1 34 17 0 14 0 18 0 1 4 13 0 213 23498:20 AM 8 108 1 0 2 42 19 0 10 0 19 0 1 7 12 0 229 24318:25 AM 9 131 1 0 1 36 13 0 9 0 18 0 0 2 7 0 227 25178:30 AM 6 89 0 0 2 41 17 0 13 1 31 0 0 6 21 0 227 25538:35 AM 5 66 2 0 2 47 14 0 9 0 18 0 2 1 20 0 186 2578
8:40 AM 2 106 2 0 2 36 21 0 9 0 21 0 1 6 8 0 214 25818:45 AM 6 133 1 0 2 60 15 0 15 1 23 0 0 3 6 0 265 26358:50 AM 12 122 1 0 2 53 16 0 10 2 33 0 3 3 18 0 275 26908:55 AM 10 85 0 0 6 47 14 0 5 0 26 0 2 3 11 0 209 2666
Peak 15-Min Northbound Southbound Eastbound WestboundTotalFlowrates Left Thru Right U Left Thru Right U Left Thru Right U Left Thru Right U
All Vehicles 80 1444 16 0 24 596 208 0 136 12 308 0 16 48 128 0 3016Heavy Trucks 24 60 8 0 52 68 4 0 20 0 8 4 248Pedestrians 0 0 0 0 0
Bicycles 0 0 0 0 0 0 0 0 0 0 0 0 0Railroad
Stopped Buses
Comments:
Peak-Hour: 7:55 AM -- 8:55 AMPeak 15-Min: 8:40 AM -- 8:55 AM
82 1291 10
18472197
131
8
271 20
42
148
1383
687
410
210
1570
763
36
321
0.89
35.4 4.6 20.0
0.017.235.0
3.1
0.0
4.4 0.0
7.1
2.0
6.5
21.8
3.9
2.9
4.2
12.2
5.6
31.5
0
0
0 3
0 2 0
000
0
0
0 0
0
0
NA
NA
NA NA
NA
NA
NA NA
Type of peak hour being reported: Intersection Peak Method for determining peak hour: Total Entering Volume
Report generated on 11/23/2016 11:34 AM SOURCE: Quality Counts, LLC (http://www.qualitycounts.net) 1-877-580-2212
LOCATION: Industrial Blvd -- SR 92 EB/Sleepy Hollow QC JOB #: 13957506CITY/STATE: Hayward, CA DATE: Tue, Nov 15 2016
5-Min CountPeriod
Beginning At
Industrial Blvd(Northbound)
Industrial Blvd(Southbound)
SR 92 EB/Sleepy Hollow(Eastbound)
SR 92 EB/Sleepy Hollow(Westbound)
Total HourlyTotals
Left Thru Right U Left Thru Right U Left Thru Right U Left Thru Right U4:00 PM 4 61 1 0 4 40 17 0 22 5 64 0 0 2 2 0 2224:05 PM 5 85 1 0 0 69 16 0 11 4 32 0 1 1 1 0 2264:10 PM 5 60 1 0 10 76 20 0 13 6 40 0 0 1 6 0 2384:15 PM 5 45 0 0 3 57 19 0 7 6 27 0 0 1 2 0 1724:20 PM 6 76 1 0 5 69 16 0 15 4 26 0 0 1 6 0 2254:25 PM 3 51 0 0 6 51 19 0 12 5 28 0 0 2 3 0 1804:30 PM 8 63 0 0 3 68 15 0 9 0 25 0 1 0 2 0 1944:35 PM 8 69 1 0 4 74 13 0 17 4 43 0 0 3 13 0 2494:40 PM 9 76 2 0 7 58 21 0 22 5 62 0 1 2 11 0 2764:45 PM 7 48 1 0 7 72 14 0 21 2 47 0 0 7 8 0 2344:50 PM 5 68 2 0 7 54 11 0 28 3 45 0 1 1 1 0 2264:55 PM 10 74 1 0 3 56 15 0 20 6 40 0 0 1 7 0 233 2675
5:00 PM 4 75 2 0 2 35 17 0 22 4 61 0 0 0 8 0 230 26835:05 PM 6 70 1 0 5 72 18 0 21 5 60 0 0 0 4 0 262 27195:10 PM 3 71 1 0 3 70 10 0 13 5 49 0 0 1 4 0 230 27115:15 PM 4 69 1 0 10 68 19 0 20 8 53 0 1 2 5 0 260 27995:20 PM 5 66 1 0 4 61 18 0 10 9 51 0 0 0 3 0 228 28025:25 PM 1 64 2 0 5 51 13 0 18 11 53 0 0 1 1 0 220 28425:30 PM 7 61 3 0 7 57 26 0 19 8 54 0 0 0 3 0 245 2893
5:35 PM 6 79 0 0 2 87 14 0 18 8 66 0 0 1 2 0 283 29275:40 PM 3 65 2 0 7 84 21 0 22 11 69 0 0 1 3 0 288 29395:45 PM 3 77 3 0 5 70 20 0 18 3 59 0 0 1 2 0 261 29665:50 PM 8 81 2 0 5 66 23 0 13 8 70 0 0 0 6 0 282 30225:55 PM 5 54 0 0 4 60 21 0 22 3 67 0 0 1 4 0 241 3030
Peak 15-Min Northbound Southbound Eastbound WestboundTotalFlowrates Left Thru Right U Left Thru Right U Left Thru Right U Left Thru Right U
All Vehicles 48 884 20 0 56 964 220 0 232 88 776 0 0 12 28 0 3328Heavy Trucks 0 100 0 0 48 4 12 4 40 0 0 0 208Pedestrians 0 0 0 0 0
Bicycles 0 0 0 0 0 0 0 0 0 0 0 0 0Railroad
Stopped Buses
Comments:
Peak-Hour: 5:00 PM -- 6:00 PMPeak 15-Min: 5:35 PM -- 5:50 PM
55 832 18
59781220
216
83
712 1
8
45
905
1060
1011
54
1093
1494
160
283
0.91
3.6 13.2 0.0
3.47.25.0
7.4
2.4
5.5 0.0
0.0
6.7
12.4
6.5
5.6
5.6
11.8
6.4
2.5
4.6
0
0
0 0
0 0 0
010
0
0
0 0
0
0
NA
NA
NA NA
NA
NA
NA NA