Ch8_EQ_students
60
CH. 8 – EARTHQUAKES
-
Upload
cresnick -
Category
Technology
-
view
389 -
download
0
Transcript of Ch8_EQ_students

CH. 8 – EARTHQUAKES

Earthquakes
Vibrations in crust caused by shifting rock masses
Focus- point w/in crust where EQ originates
Epicenter – point on Earth’s surface directly above focus

Earthquakes
Shallow-focus vs. deep-focus EQ’s

Causes of Earthquakes
1) Volcanic eruptions- used for predictions
2) Crustal Rebound - weak EQ’s- caused by melting of continental ice sheets

Causes of Earthquakes
3) Elastic Rebound- pressure builds up in rocks
(potential energy)- once rx break, stored energy
is released (kinetic energy)- rx return to original shape

Fault
Fracture in crust where rocks have shifted
Two categories of faults:1) Dip-slip faults (vertical motion)2) Strike-slip faults (horizontal
motion)

Dip-Slip Faults
Vocabulary (mining terms):1) Fault Plane – fracture
surface 2) Footwall3) Hanging wall

Mining along faults
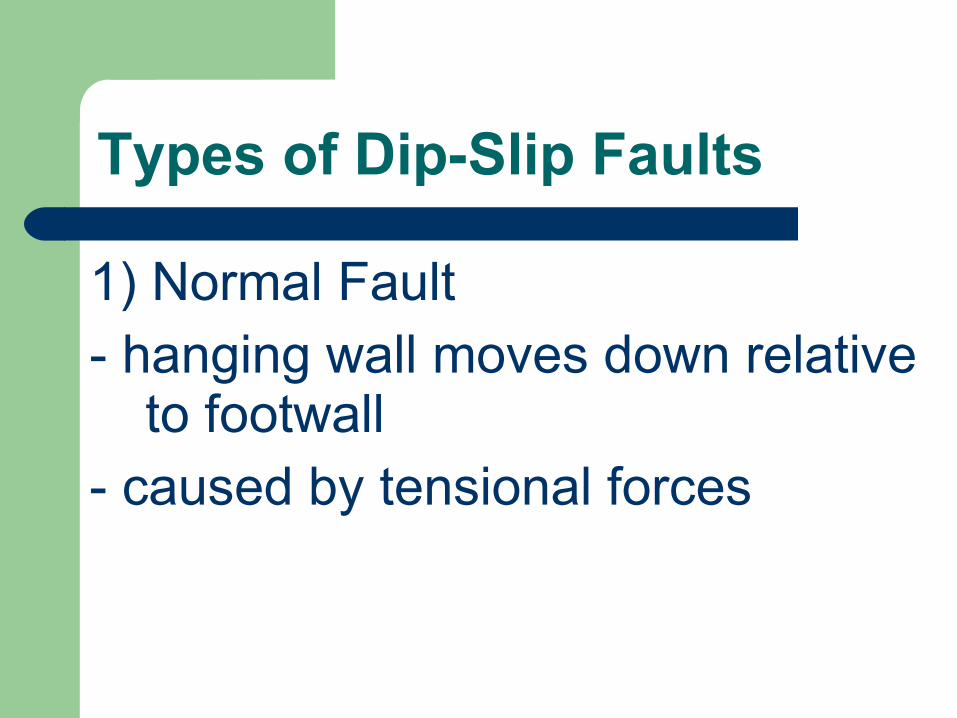
Types of Dip-Slip Faults
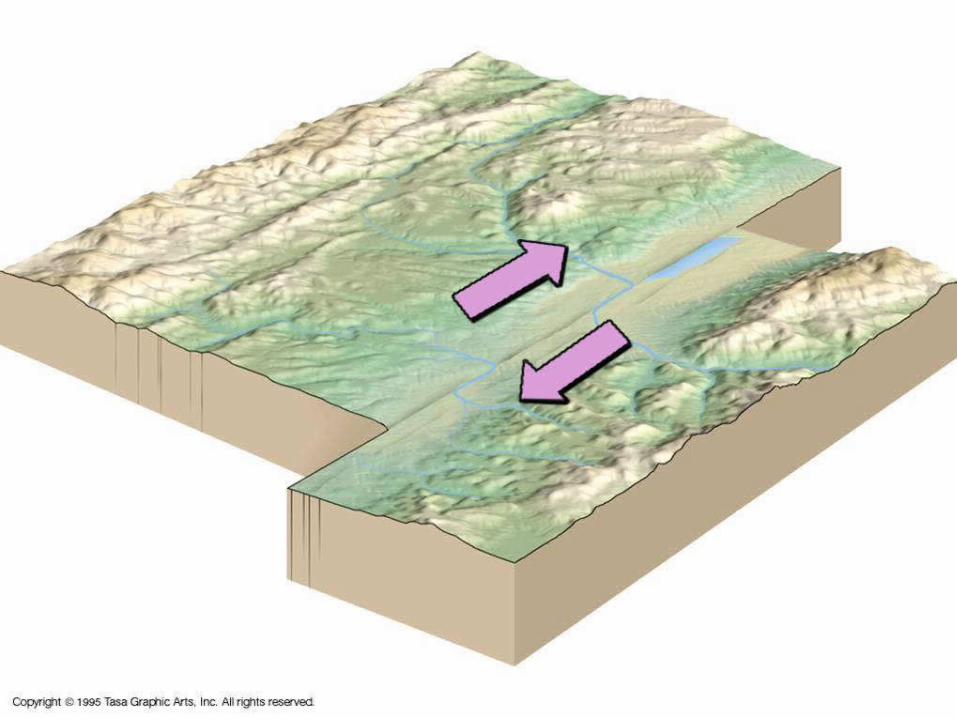
1) Normal Fault- hanging wall moves down relative
to footwall- caused by tensional forces

Normal Fault

Types of Dip-Slip Faults
2) Reverse Fault- hanging wall moves up relative
to footwall- caused by compressional
forces

Reverse Fault

Fault-Block Mountains
Bounded by normal faultsMountain = horst; valley =
grabenEx: Basin & Range Province in
Nevada & UtahEx: Teton Mountains, Wyoming

Basin & Range Province

Teton Mountains, WY

Strike-slip faults
Motion is horizontalSurface features are displaced:
Fences, railroad tracks, tree rows, stream channels
Ex: San Andreas Fault, CA

Types of Seismic Waves
1) Body Waves - energy travels from focus
through Earth’s interior

Body Waves:
a) Primary Waves (P-waves)- fastest- energy travels in push-pull motion (linear)- travel through solids, liquids, and gases

P-wave w/slinky

Body Waves:
b) Secondary waves (S-waves)- approx. half as fast as P-waves- energy travels at right angles to
path of motion- only travels through solids

S-wave with rope

Types of Seismic Waves
2) Surface waves- energy travels across surface- causes the most structural damage
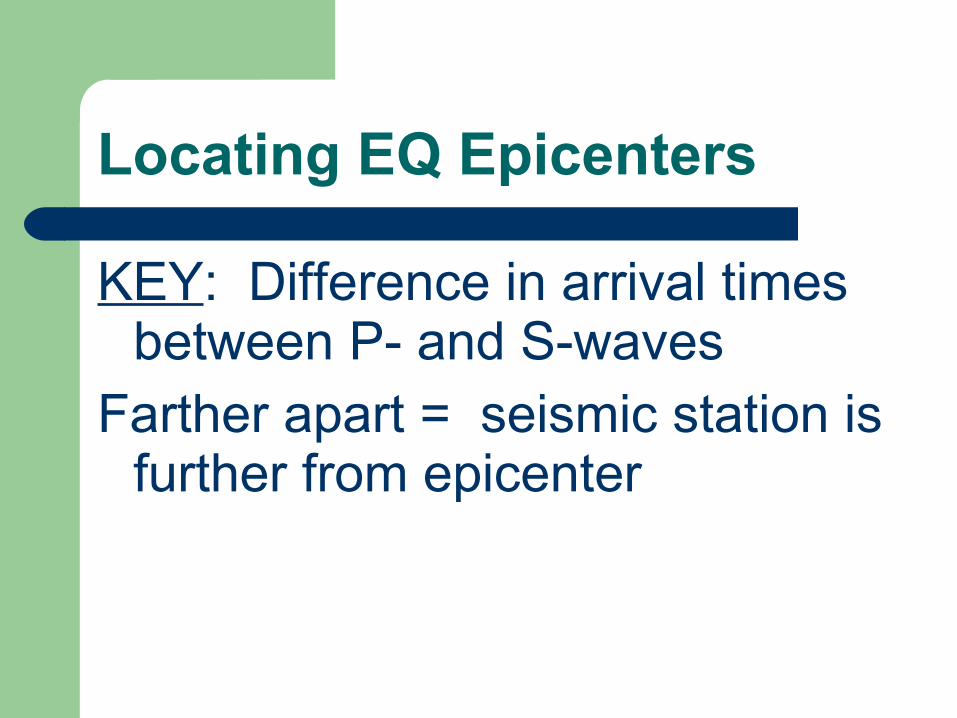
Locating EQ Epicenters
KEY: Difference in arrival times between P- and S-waves
Farther apart = seismic station is further from epicenter

Seismogram

Locating EQ Epicenters
Use multiple seismic stations to determine epicenter’s location

Measuring EQ’s
1) Intensity = damage-oriented

EQ Intensity Factors
1) Amount of energy released2) Distance from epicenter3) Type of surface material
- bedrock vs. sediment4) Building design5) Population Density

EQ Intensity
Measured using Mercalli Scale(Giuseppe Mercalli in 1902)- scale of I-XII based on damage
to location- not a measure of EQ’s actual
energy

Disadvantages of Mercalli Scale
1) Subjective2) Type of surface material
varies3) Building design varies4) No data for unpopulated areas

Measuring EQ’s
2) Magnitude – measures amount of energy released from focus

Richter Magnitude Scale
Measures largest amplitude of seismic waves on seismogram
Amplitude measures the ground shaking

Seismogram

Richter Magnitude Scale
Logarithmic scale (not linear!)Each higher number on Richter
Scale represents:a) 10 times more ground shakingb) 32 times more energy
released

Richter Magnitude Scale
2.0 Felt only by seismograph3.0 ____ x more energy than a 2.04.0 ____ x more energy than a 2.05.0 ____ x more energy than a 2.0

Richter Magnitude Scale
4.0-4.9 Felt by most people6.0-6.9 Destructive in populated
areas>8.0 Truly catastrophic EQ’s

Richter Magnitude Scale
Largest recorded U.S. EQ1964 Alaskan “Good Friday” EQ 9.2
Largest recorded EQ in world1960 Chile 9.6

Benefits of Richter Scale
1) Objective measurements from seismogram
2) Data available for unpopulated areas

Effects of EQ’s
1) Ground Shaking2) Ground Ruptures – cracks
occur in soil (not bedrock!)

Effects of EQ’s
3) Fault Scarp – cliff exposed by vertical movement along dip-slip fault
- used to measure growth rate of mountains

Effects of EQ’s
4) Liquefaction- occurs in sediment- vibrations release water
trapped between sediment grains“quick sand” or “quick clay”

Liquefaction
Foundations under buildings failEx: Marina District is San
Francisco

Effects of EQ’s
5) Landslides- more prevalent if pre-existing weakness exists in rxEx: EQ Lake in Montana 1959

Effects of EQ’s
6) Tsunami – “harbor wave”- seismic sea wave (not tidal wave)- caused by dip-slip fault movement in ocean crust
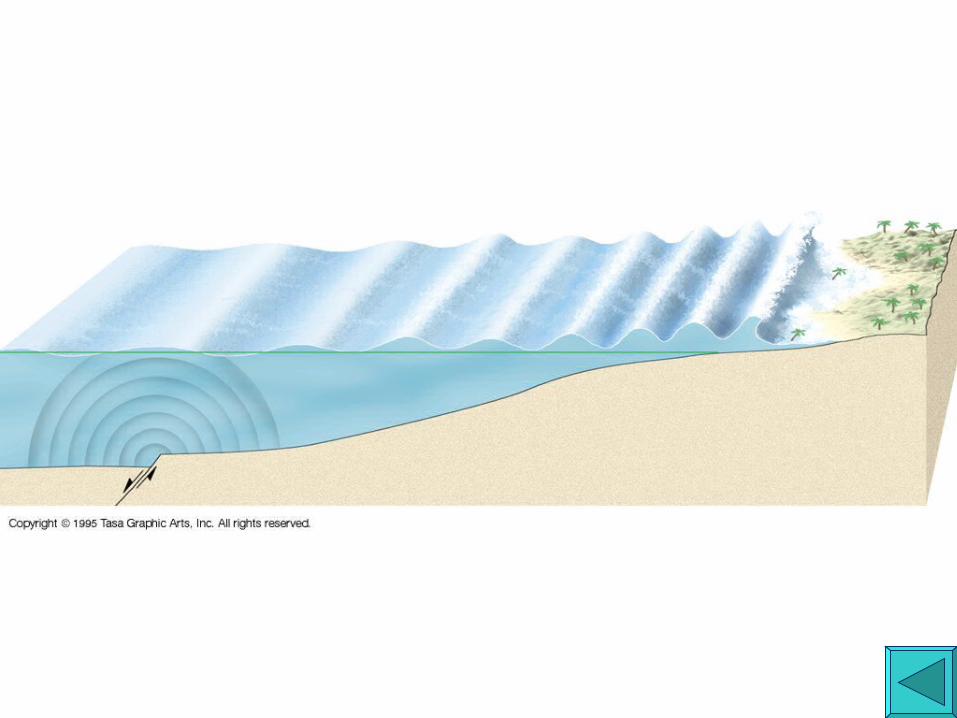
Tsumani diagram

Tsunami
Danger is from speed: between 500-950 km/hr
Ex: December 26, 2004- Indonesia: EQ of 9.0 offshore triggered tsunami- over 200,000 people killed

Tsunami Warning System

Effects of EQ’s
7) Fire – causes most property damage- liquefaction breaks buried gas & water pipelines Ex: Marina District in 1906 & 1989

EQ Prediction
Based on seismic “gaps” - look for areas on fault where no
EQ’s have occurred
EQ Prediction
EQ Prediction along San Andreas Fault
- best guess is 30-year estimate of likely EQ activity
- note Parkfield, CA

San Andreas EQ Probability
Earth’s Interior
Layers defined by physical properties & composition
Clues (indirect evidence): Seismic waves - variations in
speed & direction

Clues: seismic waves
1) P-waves speed up rapidly below 50 km depth within Earth
- marks a change in composition &/or physical state of the rocks
1909: Mohorovicic identified crust-mantle boundary

Clues: seismic waves
Within mantle:P-wave velocities slow back
down (100-660 km deep)- slower velocity zone is known
as the __________________

Asthenosphere
Weak layer in upper mantle- partially molten (~1-5%) which
slows P-waves down- not completely molten b/c S-
waves travel through it

Clues: seismic waves
Lithosphere – rigid rx of crust and uppermost mantle
Asthenosphere – weaker rocks (partially molten) in upper mantle

Asthenosphere

Clues: seismic waves
2) P-wave shadow zone- P-waves bend as they enter the
outer core3) S-wave shadow zoneS-waves disappear in outer core* Proof of liquid outer core

P-wave shadow zone

Clues: seismic waves
Outer core is moltenInner core is solid- pressure in center is too great
to allow minerals to expand & melt